microstructure, physical stability, and rheological properties of salad dressing emulsions
TRANSCRIPT

Journal of Food Research; Vol. 2, No. 2; 2013 ISSN 1927-0887 E-ISSN 1927-0895
Published by Canadian Center of Science and Education
167
Microstructure, Physical Stability, and Rheological Properties of Salad Dressing Emulsions Supplemented with Various Pulse Flours
Zhen Ma1 & Joyce I. Boye2 1 Department of Bioresource Engineering, Macdonald Campus, McGill University, Quebec, Canada 2 Food Research and Development Center, Agriculture and Agri-Food Canada, Quebec, Canada
Correspondence: Joyce I. Boye, Food Research and Development Center, Agriculture and Agri-Food Canada, 3600 Casavant West, St. Hyacinthe, Quebec J2S8E3, Canada. Tel: 1-450-768-3232. E-mail: [email protected]
Received: December 22, 2012 Accepted: March 25, 2013 Online Published: March 30, 2013
doi:10.5539/jfr.v2n2p167 URL: http://dx.doi.org/10.5539/jfr.v2n2p167
Abstract
Significant opportunities exist for using pulses in the development of health promoting foods as consumers increasingly look for functional foods with disease prevention qualities. Pulse ingredients could be considered for use in the development of novel, value-added products such as salad dressing. In this study, the rheological properties, color, physical stability, and microstructure of model salad dressing emulsions supplemented with various types of pulse flours (red lentil, green lentil, desi chickpea, kabuli chickpea and yellow pea) were evaluated. Supplementation with pulse flours significantly increased (P < 0.05) the consistency coefficient (m) and decreased (P < 0.05) the flow behavior index (n) of the control dressing in accordance with the power law model during steady state flow tests. The pulse-supplemented dressings also showed increased recoverable strain (i.e., increased Q(t)% values) compared with the control. The observed rheological results were supported by scanning electron microscope (SEM) observations, where a more compact and uniform network was observed for supplemented dressings in comparison with the control sample. Addition of pulse flour increased the physical stability of the salad dressing emulsions and also modified color by increasing yellowness and redness hues depending on the type of flour used. This study, thus, demonstrated that pulse flours hold promise as ingredients that could be used in salad dressing formulations.
Keywords: salad dressing, pulse flour, rheology, physical stability, microstructure
1. Introduction
Pulses are the edible seeds of legume plants such as beans, peas, chickpeas and lentils. Due to their unique nutritional and functional properties, they could be processed into flours and used as ingredients to enhance the characteristics of a wide variety of food products. Pulses are good sources of protein, minerals, vitamins, and complex carbohydrates, including starch and dietary fiber. Epidemiological data suggests that pulse consumption may reduce the risk of cardiovascular disease (Bazzano et al., 2001). There is also significant evidence that consumption of pulses is associated with reduced risk of numerous types of cancers such as breast cancer (Adebamowo et al., 2005), colon and rectal cancer (Franceschi, 1999), and prostate cancer (Jain, Hislop, Howe, & Ghadirian, 1999).
Canada is one of the largest producers and exporters of pulses. Pulse consumption in the western world is, however, low. Pulse ingredients have remained underexploited, partially due to the presence of undesirable beany flavors, and the presence of antinutritional compounds. Growing concerns regarding the potential negative health impacts of consuming food with high amounts of fat and cholesterol has increased consumer interest in plant-derived food ingredients which contain low-fat and are cholesterol free such as pulses. Whole pulses can be milled into flour or fractionated into protein, starch and fiber fractions, and these components can be incorporated into commercial food products as functional or replacement ingredients. Some research efforts in the last decade have focused on using pulse flours and pulse fractions as ingredients in the development of new products, such as low-fat meatballs (Serdaroglu, YildIz-Turp, & Abrodímov, 2005), extruded snacks (Lazou & Krokida, 2009), macaroni (Rasmay, El-Shatanovi, & Hassan, 2001), tortillas (Anton, Ross, Lukow, Fulcher, & Arntfield, 2008), breads (Sadowska, Fornal, Vidal-Valverde, & Frias, 1999) and yogurt (Zare, Boye, Orsat, Champagne, & Simpson, 2011). For some applications such as bakery, pasta and extruded products, addition of

www.ccsenet.org/jfr Journal of Food Research Vol. 2, No. 2; 2013
168
pulse flours could improve product nutritional quality by enhancing protein, fiber, mineral and vitamin and through amino acid complementation. Additionally, the high viscosity of pulse starches and their high resistance to swelling and rupture offers these products interesting functional properties. The addition of pulse fractions as binders in low fat meat products could improve their textural properties including firmness, chewiness and hardness as well as their sensory appeal (Boye & Ma, 2012).
Salad dressing is an important type of oil-in-water food emulsion which is widely consumed in North America and in many other countries around the world. Pulse ingredients have good potential for use in the development of innovative value-added salad dressing products. Emulsions are thermodynamically unstable systems which require the incorporation of emulsifiers and/or thickening agents. Egg yolk is the most common emulsifier used in salad dressings. The lipoproteins in the yolk became rapidly adsorbed during the initial stages of emulsion formation and rearrange at the oil droplet surfaces. This leads to a reduction in surface tension and the development of an absorbed membrane, which forms a protective coating that keeps the droplets from aggregating and therefore gives the emulsion short-term stability (Kiosseoglou, 2003). Xanthan gum, an extracellular polysaccharide produced by Xanthomonascampestris, is an excellent stabilizer that is widely used as a thickener in dressing formulations. It gives products characteristics such as creamy mouthfeel, high yield stress for suspension ability, thickness, strong pseudoplasticity, and, to a certain extent, long-term stability, which is mostly associated with its molecule structure (Nor Hayati, Che Man, Tan, & Nor Aini, 2007). Due to their relatively high protein content and complex carbohydrate profile, pulse flour supplementation could be considered as an approach to modify the rheological properties and textural attributes of salad dressing systems and contribute to physical stability.
To date, however, there has been little research on supplementing salad dressing products with pulse flours. The objective of this study, therefore, was to investigate and compare the effect of adding flours prepared from 7 different types of pulse flours on the physicochemical properties of salad dressing emulsions. This included evaluating the color characteristics, physical stability, static and dynamic rheological properties, and microstructure of the prepared salad dressings and comparing the results with those of control samples (i.e., without pulse supplementation). The research represents a novel avenue of study as pulses, in addition to serving as functional ingredients, could also provide enhanced nutritional value to salad dressing products. Pulses selected for the study were yellow pea, red lentils, green lentils, desi chickpea and kabuli chickpea. The varieties were selected based on their good functional properties (i.e., protein solubility, fat absorption capacity, water holding capacity, emulsifying properties and foaming properties) as previously reported (Ma et al., 2011), as well as their relative economic importance in Canadian production.
2. Materials and Methods
2.1 Materials
Flours of dehulled green lentil (DGL), green lentil with hulls (GLWH), dehulled red lentil (DRL), red lentil with hulls (RLWH), and dehulled Kabuli chickpea (DKC) were provided by the Canadian International Grains Institute (Winnipeg, MB, Canada). Dehulled Desi chickpea (DDC) flour and dehulled yellow pea (DYP) flour were commercial products provided by Diefenbaker Seed Processors Ltd. (Elbow, SK, Canada) and Parrheim Foods Inc. (Saskatoon, SK, Canada), respectively. Canola oil (100% pure Mazola oil, ACH Food Companies, Inc. Memphis, TN) was purchased from a local supermarket. Dried egg yolk powder was provided courtesy of Newly Weds FoodsTM (Newly Weds Foods Co., Boucherville, Quebec). Xanthan gum was purchased from Sigma-Aldrich (Sigma-Aldrich Corp., St. Louis, MO, U.S.A). All other chemicals used were of analytical grade.
2.2 Preparation of Salad Dressing Samples
The salad dressings contained the following ingredients expressed as a percentage (w/w): pulse flours 3.5%, dried egg yolk powder 2.0%, canola oil 50.0%, salt 1.0%, sugar 3.5%, xanthan gum 0.25%, and enough citric buffer (pH 3) to complete the formulation. A concentration of 3.5% of pulse flour was selected based on the relatively high acceptance score obtained for dressings supplemented with 3.5% pulse flours in preliminary sensory tests. Preparation was as follows: xanthan gum and sugar were first dispersed in water and stored overnight to ensure complete hydration. All other ingredients except oil were then added and mixed homogeneously. The oil was finally added and emulsification was achieved using an Ultra-Turrax (Model T25-S1, Janke & Kunkel, Ika-Labortechnik, Staufen, Germany) at 13,500 rpm for 3 min. A sample without pulse flour supplementation was similarly prepared and is referred to as control. Pasteurization was carried out at 71.7°C for 20 s after the emulsions were made. Samples were stored in tightly capped bottles for 28 days at 4°C until further analysis.

www.ccsenet.org/jfr Journal of Food Research Vol. 2, No. 2; 2013
169
2.3 Rheological Measurements
Rheological measurements were performed with an AR 1000 rheometer (TA Instrument, New Castle, DE, USA). Dynamic oscillatory tests, steady state flow tests, and creep and recovery tests were conducted using a stainless steel parallel plate (4 cm diameter). The gap setting was 1 mm. The measurement temperature was kept at 25°C using a circulation bath and a controlled Peltier system. One tablespoon of sample was placed at the centre of the circular plate, and excess sample was removed from the edges of the plate.
The steady state flow test was performed at increasing shear rates (0.02-300 s-1), and experimental flow curves were fitted to the power law model (the equation typically used to characterize shear-thinning fluids):
(1)
where n is the flow behavior index (dimensionless), n < 1 for a shear-thinning fluid and n = 1 for a Newtonian fluid, η is the shear viscosity (Pa.s), m is the consistency coefficient (Pa.sn), is the shear rate (s-1). The dynamic oscillatory test was then performed within the linear viscoelastic range at 0.1% strain with an angular frequency ranging from 0.1 to 100 rad/s. Storage modulus (G’), loss modulus (G”), and loss tangent (tan δ = G”/G’) versus angular frequency were measured for all samples. The plateau modulus. , which is defined as an extrapolation of the contribution of the interdroplet interactions to G′ at high frequencies, was estimated by an approximate procedure proposed by Wu (2003).
′ (2)
A creep and recovery test was carried out to examine the elasticity of the salad dressings. The samples were pre-sheared at a shear strain of 300 s-1 for 2 min; 0.5 Pa stress was applied to the samples for 600 s, then the stress was removed and the strain was recorded as a function of time (600 s). Strain versus time was recorded during the test. For each sample, all the rheological measurements were performed in triplicate. The recoverable strain (expressed as Q(t) %) can be calculated from the recovery zone (Zhang, Quek, Lam, & Easteal, 2008).
% 100 (3)
where and are the strains at the equilibrium of the creep and recovery zones, respectively. The greater the extent of strain recovery, the greater the elasticity of the sample.
2.4 Color Measurements
The color of the salad dressing samples was measured with the L*, a*, b* tristimulus system using a Minolta CM-503c spectrophotometer (Minolta Co. Ltd., Osaka, Japan). The instrument was calibrated using a white calibration standard before color measurements were made. In this colour system, the L* value is for lightness to darkness (0 = black and 100 = white), a* and b* are for the color-opponent dimensions, in which a* is a measure of redness (+ve) to greenness (−ve), with a higher positive a* value indicating more red, and b* is a measure of yellowness (+ve) to blueness (−ve), with a higher positive b* value indicating more yellow.
2.5 Physical Stability
The emulsion stability of the pulse flour supplemented dressings was determined using a vertical scan analyzer (Quick Scan, Beckman Coulter, Fullerton, Calif., USA). The reading head comprised a pulsed near infrared light source (λ = 850 nm) and two synchronous detectors. The transmission detector monitors the light transmitted through the sample (0°), while the backscattering detector receives the light backscattered by the sample (135°). This method has been applied to oil in water type emulsion in previous studies (Pan, Tomás, & Añón, 2004; Romero, Cordobés, Puppo, Guerrero, & Bengoechea, 2008). The acquisition options were set to 0-60 mm and scanning of samples was repeated at different time intervals over 28 days of storage. The backscattering (BS) profile of every 40 μm was acquired as a function of sample height (50 mm) and time. Based on the %BS profile obtained, particle migration kinetics, such as coalescence and flocculation, were evaluated by registering mean variations at a threshold value as a function of time.
2.6 Scanning Electron Microscopy
Salad dressing samples were encapsulated in 2% agar, cut into 2-3 mm cubes, and immersed in 2.5% glutaraldehyde for 2 h, then transferred to 0.1 M sodium cacodylate buffer solution (pH 7.1) and stored at 4°C. Two samples were encapsulated for each dressing. The samples were washed in buffer and then dehydrated in a graded ethanol series with concentrations ranging from 30% to 100%, and they were critical point dried with CO2 in a critical point dryer (SPI, USA). Dry sections were fractured and fragments were mounted on aluminum
www.ccsenet.org/jfr Journal of Food Research Vol. 2, No. 2; 2013
170
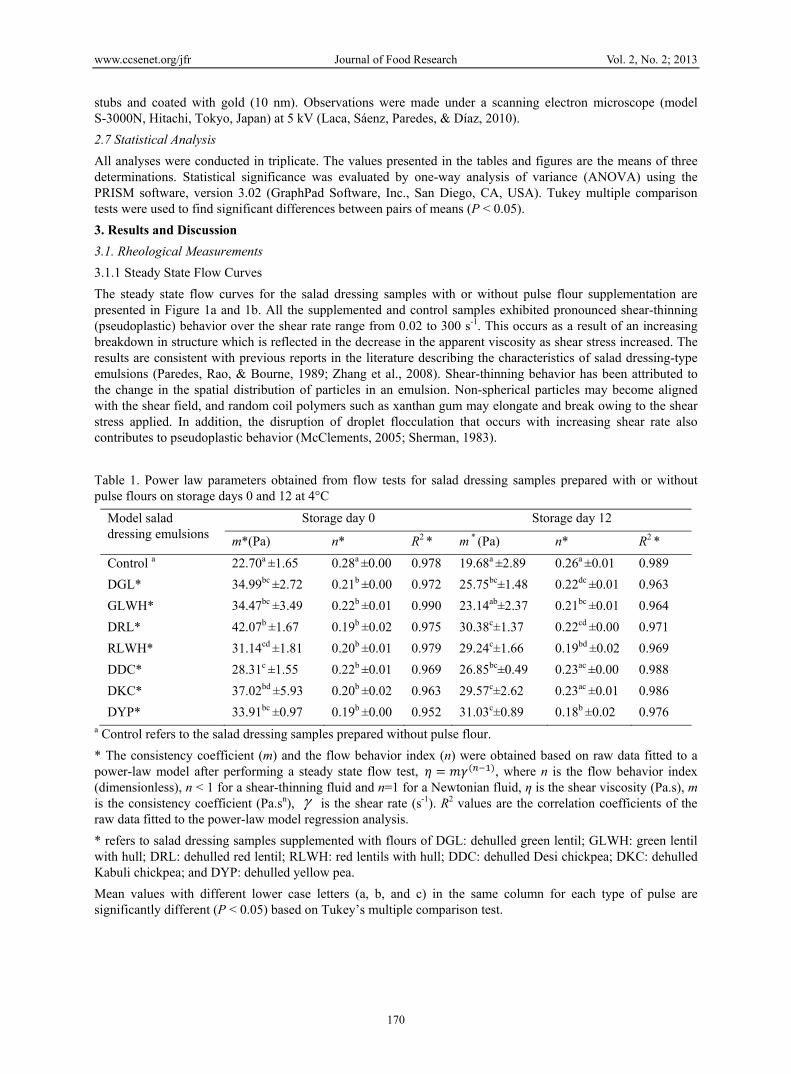
stubs and coated with gold (10 nm). Observations were made under a scanning electron microscope (model S-3000N, Hitachi, Tokyo, Japan) at 5 kV (Laca, Sáenz, Paredes, & Díaz, 2010).
2.7 Statistical Analysis
All analyses were conducted in triplicate. The values presented in the tables and figures are the means of three determinations. Statistical significance was evaluated by one-way analysis of variance (ANOVA) using the PRISM software, version 3.02 (GraphPad Software, Inc., San Diego, CA, USA). Tukey multiple comparison tests were used to find significant differences between pairs of means (P < 0.05).
3. Results and Discussion
3.1. Rheological Measurements
3.1.1 Steady State Flow Curves
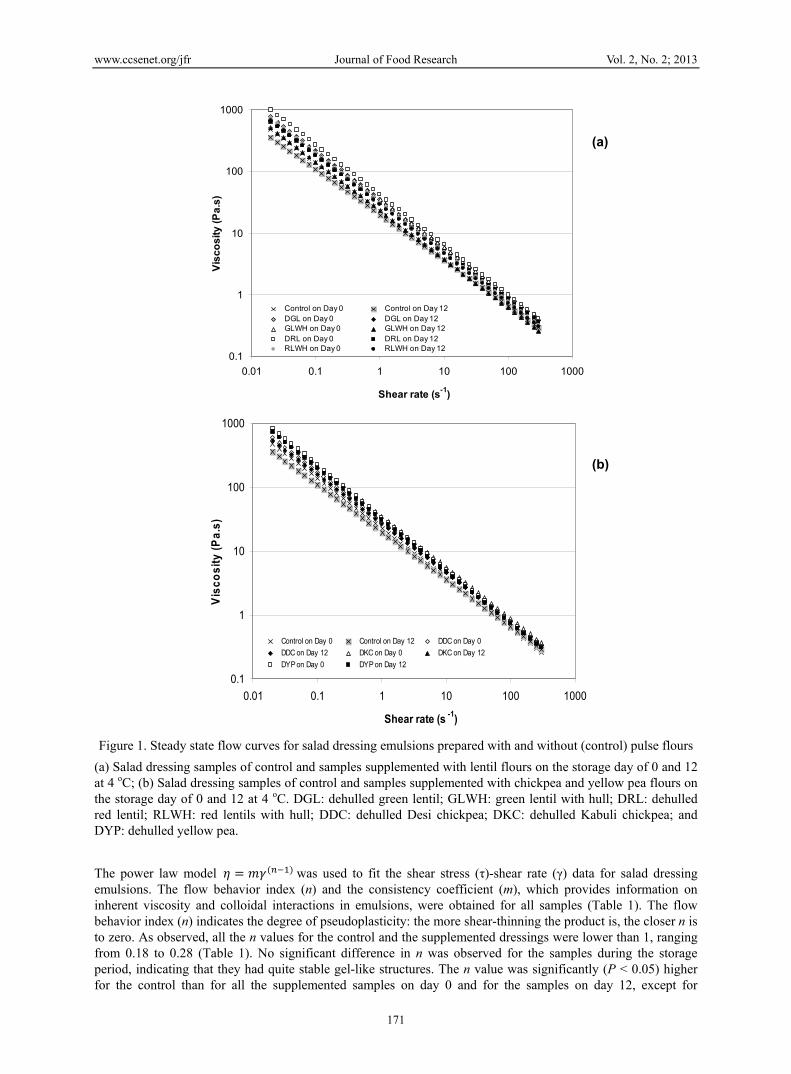
The steady state flow curves for the salad dressing samples with or without pulse flour supplementation are presented in Figure 1a and 1b. All the supplemented and control samples exhibited pronounced shear-thinning (pseudoplastic) behavior over the shear rate range from 0.02 to 300 s-1. This occurs as a result of an increasing breakdown in structure which is reflected in the decrease in the apparent viscosity as shear stress increased. The results are consistent with previous reports in the literature describing the characteristics of salad dressing-type emulsions (Paredes, Rao, & Bourne, 1989; Zhang et al., 2008). Shear-thinning behavior has been attributed to the change in the spatial distribution of particles in an emulsion. Non-spherical particles may become aligned with the shear field, and random coil polymers such as xanthan gum may elongate and break owing to the shear stress applied. In addition, the disruption of droplet flocculation that occurs with increasing shear rate also contributes to pseudoplastic behavior (McClements, 2005; Sherman, 1983).
Table 1. Power law parameters obtained from flow tests for salad dressing samples prepared with or without pulse flours on storage days 0 and 12 at 4°C
Model salad dressing emulsions
Storage day 0 Storage day 12
m*(Pa) n* R2 * m * (Pa) n* R2 *
Control a 22.70a ±1.65 0.28a ±0.00 0.978 19.68a ±2.89 0.26a ±0.01 0.989
DGL* 34.99bc ±2.72 0.21b ±0.00 0.972 25.75bc±1.48 0.22dc ±0.01 0.963
GLWH* 34.47bc ±3.49 0.22b ±0.01 0.990 23.14ab±2.37 0.21bc ±0.01 0.964
DRL* 42.07b ±1.67 0.19b ±0.02 0.975 30.38c±1.37 0.22cd ±0.00 0.971
RLWH* 31.14cd ±1.81 0.20b ±0.01 0.979 29.24c±1.66 0.19bd ±0.02 0.969
DDC* 28.31c ±1.55 0.22b ±0.01 0.969 26.85bc±0.49 0.23ac ±0.00 0.988
DKC* 37.02bd ±5.93 0.20b ±0.02 0.963 29.57c±2.62 0.23ac ±0.01 0.986
DYP* 33.91bc ±0.97 0.19b ±0.00 0.952 31.03c±0.89 0.18b ±0.02 0.976 a Control refers to the salad dressing samples prepared without pulse flour.
* The consistency coefficient (m) and the flow behavior index (n) were obtained based on raw data fitted to a power-law model after performing a steady state flow test, , where n is the flow behavior index (dimensionless), n < 1 for a shear-thinning fluid and n=1 for a Newtonian fluid, η is the shear viscosity (Pa.s), m is the consistency coefficient (Pa.sn), is the shear rate (s-1). R2 values are the correlation coefficients of the raw data fitted to the power-law model regression analysis.
* refers to salad dressing samples supplemented with flours of DGL: dehulled green lentil; GLWH: green lentil with hull; DRL: dehulled red lentil; RLWH: red lentils with hull; DDC: dehulled Desi chickpea; DKC: dehulled Kabuli chickpea; and DYP: dehulled yellow pea.
Mean values with different lower case letters (a, b, and c) in the same column for each type of pulse are significantly different (P < 0.05) based on Tukey’s multiple comparison test.
www.ccsenet.org/jfr Journal of Food Research Vol. 2, No. 2; 2013
171
Figure 1. Steady state flow curves for salad dressing emulsions prepared with and without (control) pulse flours
(a) Salad dressing samples of control and samples supplemented with lentil flours on the storage day of 0 and 12 at 4 oC; (b) Salad dressing samples of control and samples supplemented with chickpea and yellow pea flours on the storage day of 0 and 12 at 4 oC. DGL: dehulled green lentil; GLWH: green lentil with hull; DRL: dehulled red lentil; RLWH: red lentils with hull; DDC: dehulled Desi chickpea; DKC: dehulled Kabuli chickpea; and DYP: dehulled yellow pea.
The power law model was used to fit the shear stress (τ)-shear rate (γ) data for salad dressing emulsions. The flow behavior index (n) and the consistency coefficient (m), which provides information on inherent viscosity and colloidal interactions in emulsions, were obtained for all samples (Table 1). The flow behavior index (n) indicates the degree of pseudoplasticity: the more shear-thinning the product is, the closer n is to zero. As observed, all the n values for the control and the supplemented dressings were lower than 1, ranging from 0.18 to 0.28 (Table 1). No significant difference in n was observed for the samples during the storage period, indicating that they had quite stable gel-like structures. The n value was significantly (P < 0.05) higher for the control than for all the supplemented samples on day 0 and for the samples on day 12, except for
0.1
1
10
100
1000
0.01 0.1 1 10 100 1000
Shear rate (s-1)
Vis
co
sit
y (
Pa
.s)
Control on Day 0 Control on Day 12DGL on Day 0 DGL on Day 12GLWH on Day 0 GLWH on Day 12DRL on Day 0 DRL on Day 12RLWH on Day 0 RLWH on Day 12
0.1
1
10
100
1000
0.01 0.1 1 10 100 1000
Shear rate (s -1)
Vis
co
sit
y (
Pa
.s)
Control on Day 0 Control on Day 12 DDC on Day 0
DDC on Day 12 DKC on Day 0 DKC on Day 12
DYP on Day 0 DYP on Day 12
(a)
(b)
www.ccsenet.org/jfr Journal of Food Research Vol. 2, No. 2; 2013
172
dressings supplemented with DDC and DKC flours. This result indicates that the addition of pulse flour led to a more pronounced pseudoplastic behavior.
As can be observed in Figures 1a and 1b, the viscosity of the control was generally lower than that of all the supplemented samples across the range of shear rates studied. A significantly (P < 0.05) higher consistency coefficient (m) was observed for pulse-supplemented dressing samples compared with the control on day 0 and on day 12, except for GLWH-supplemented dressing (Table 1). Since a higher value of m represents a more viscous consistency in emulsions (Paredes et al., 1989), this suggests that the addition of pulse flours enhanced the viscous properties of the salad dressings and that the flours likely acted as thickeners.
There was a general decrease in the consistency coefficient (m) with increasing storage time which was statistically significant (P < 0.05) in the case of the dressings supplemented with DGL, GLWH, and DRL. This indicates that droplet interactions tended to decrease and that the emulsions were less structured after 11 days of storage. Mandala, Savvas, and Kostaropoulos (2004) also reported a decrease in consistency index k of a white model-sauce emulsion during 10 days of storage.
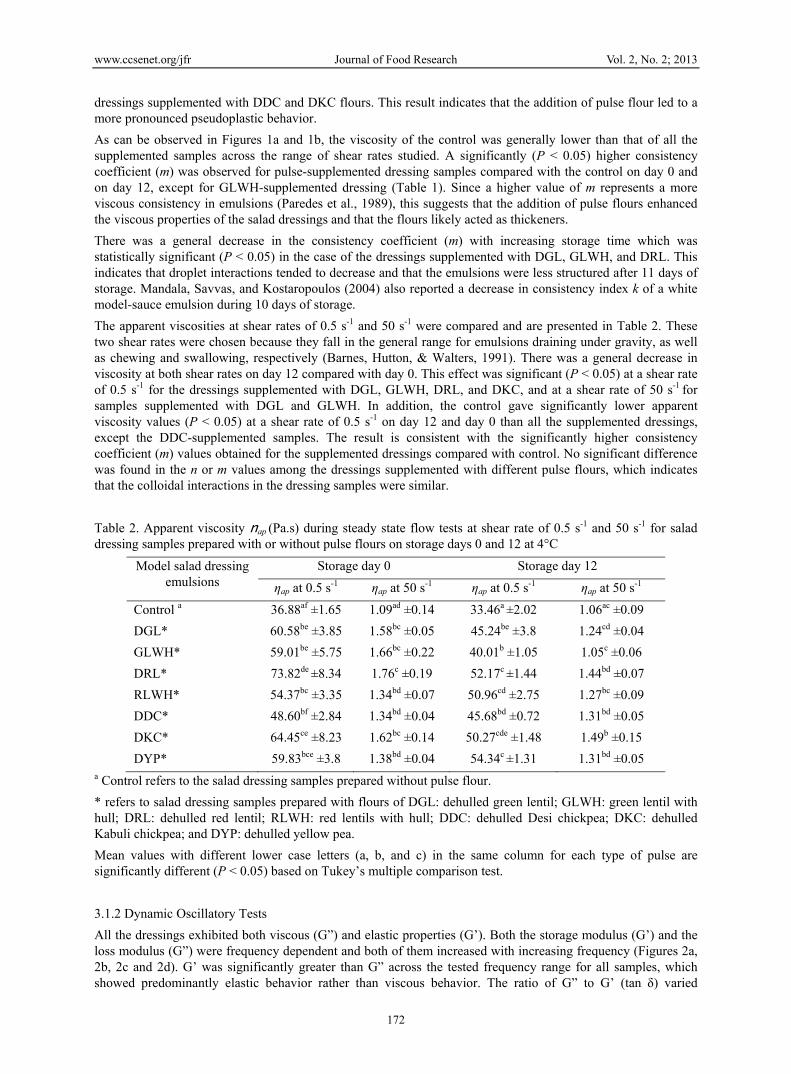
The apparent viscosities at shear rates of 0.5 s-1 and 50 s-1 were compared and are presented in Table 2. These two shear rates were chosen because they fall in the general range for emulsions draining under gravity, as well as chewing and swallowing, respectively (Barnes, Hutton, & Walters, 1991). There was a general decrease in viscosity at both shear rates on day 12 compared with day 0. This effect was significant (P < 0.05) at a shear rate of 0.5 s-1 for the dressings supplemented with DGL, GLWH, DRL, and DKC, and at a shear rate of 50 s-1 for samples supplemented with DGL and GLWH. In addition, the control gave significantly lower apparent viscosity values (P < 0.05) at a shear rate of 0.5 s-1 on day 12 and day 0 than all the supplemented dressings, except the DDC-supplemented samples. The result is consistent with the significantly higher consistency coefficient (m) values obtained for the supplemented dressings compared with control. No significant difference was found in the n or m values among the dressings supplemented with different pulse flours, which indicates that the colloidal interactions in the dressing samples were similar.
Table 2. Apparent viscosity ƞap (Pa.s) during steady state flow tests at shear rate of 0.5 s-1 and 50 s-1 for salad dressing samples prepared with or without pulse flours on storage days 0 and 12 at 4°C
Model salad dressing emulsions
Storage day 0 Storage day 12
ηap at 0.5 s-1 ηap at 50 s-1 ηap at 0.5 s-1 ηap at 50 s-1
Control a 36.88af ±1.65 1.09ad ±0.14 33.46a ±2.02 1.06ac ±0.09
DGL* 60.58be ±3.85 1.58bc ±0.05 45.24be ±3.8 1.24cd ±0.04
GLWH* 59.01be ±5.75 1.66bc ±0.22 40.01b ±1.05 1.05c ±0.06
DRL* 73.82de ±8.34 1.76c ±0.19 52.17c ±1.44 1.44bd ±0.07
RLWH* 54.37bc ±3.35 1.34bd ±0.07 50.96cd ±2.75 1.27bc ±0.09
DDC* 48.60bf ±2.84 1.34bd ±0.04 45.68bd ±0.72 1.31bd ±0.05
DKC* 64.45ce ±8.23 1.62bc ±0.14 50.27cde ±1.48 1.49b ±0.15
DYP* 59.83bce ±3.8 1.38bd ±0.04 54.34c ±1.31 1.31bd ±0.05 a Control refers to the salad dressing samples prepared without pulse flour.
* refers to salad dressing samples prepared with flours of DGL: dehulled green lentil; GLWH: green lentil with hull; DRL: dehulled red lentil; RLWH: red lentils with hull; DDC: dehulled Desi chickpea; DKC: dehulled Kabuli chickpea; and DYP: dehulled yellow pea.
Mean values with different lower case letters (a, b, and c) in the same column for each type of pulse are significantly different (P < 0.05) based on Tukey’s multiple comparison test.
3.1.2 Dynamic Oscillatory Tests
All the dressings exhibited both viscous (G”) and elastic properties (G’). Both the storage modulus (G’) and the loss modulus (G”) were frequency dependent and both of them increased with increasing frequency (Figures 2a, 2b, 2c and 2d). G’ was significantly greater than G” across the tested frequency range for all samples, which showed predominantly elastic behavior rather than viscous behavior. The ratio of G” to G’ (tan δ) varied

www.ccsenet.org/jfr Journal of Food Research Vol. 2, No. 2; 2013
173
between 0.2 and 0.4 for all the samples; these are typical values for dressing emulsions which can be characterized as weak gels (Zhang et al., 2008).
Figure 2. (a) Storage modulus (G’) as a function of angular frequency during dynamic oscillation tests for salad dressing emulsions prepared with and without (control) lentil flours on the storage day of 0 and 12 at 4°C; (b)
Storage modulus (G’) for salad dressing samples of control and samples supplemented with chickpea and yellow pea flours on the storage day of 0 and 12 at 4°C; (c) loss modulus (G”) as a function of angular frequency during dynamic oscillation tests for control and samples supplemented with lentil flours on the storage day of 0 and 12
at 4°C; (d) loss modulus (G”) for salad dressing samples of control and samples supplemented with chickpea and yellow pea flours on the storage day of 0 and 12 at 4°C
DGL: dehulled green lentil; GLWH: green lentil with hull; DRL: dehulled red lentil; RLWH: red lentils with hull; DDC: dehulled Desi chickpea; DKC: dehulled Kabuli chickpea; and DYP: dehulled yellow pea.
10
100
0.1 1 10 100 1000
Angular frequency (rad/s)
G"
(Pa
)
Control on Day 0 Control on Day 12
DDC on Day 0 DDC on Day 12
DKC on Day 0 DKC on Day 12DYP on Day 0 DYP on Day 12
10
100
0.1 1 10 100 1000
Angular frequency (rad/s)
G"
(Pa
)
Control on Day 0 Control on Day 12DGL on Day 0 DGL on Day 12GLWH on Day 0 GLWH on Day 12DRL on Day 0 DRL on Day 12RLWH on Day 0 RLWH on Day 12
10
100
1000
0.1 1 10 100 1000
Angular frequency (rad/s)G
' (P
a)
Control on Day 0 Control on Day 12
DDC on Day 0 DDC on Day 12
DKC on Day 0 DKC on Day 12
DYP on Day 0 DYP on Day 12
10
100
1000
0.1 1 10 100 1000
Angular frequency (rad/s)
G' (
Pa)
Control on Day 0 Control on Day 12DGL on Day 0 DGL on Day 12GLWH on Day 0 GLWH on Day 12DRL on Day 0 DRL on Day 12RLWH on Day 0 RLWH on Day 12
(b)(a)
(d) (c)

www.ccsenet.org/jfr Journal of Food Research Vol. 2, No. 2; 2013
174
Table 3. Plateau modulus (Pa) during dynamic oscillatory tests and recoverable strain Q(t) % during creep and recovery tests for salad dressing samples prepared with or without pulse flours on storage days 0 and 12
Model salad dressing emulsions
(Pa)a Q(t)%b
Storage day of 0 Storage day of 12 Storage day of 0 Storage day of 12
Control a 160.53afA ±8.59 98.72egB ±9.94 44.13acA ±1.03 45.25aA ±1.07
DGL* 168.5aA ±6.31 150.68aA ±8.49 62.7beA ±2.51 62.3bA ±2.86
GLWH* 90.60bA ±7.24 79.06fdA ±8.63 56.1cA±0.62 55.7cA ±1.42
DRL* 165.70aA ±4.38 113.70beB ±8.57 56.0cA ±2.35 57.9bcA ±2.09
RLWH* 96.96bdA ±7.13 87.58dgA ±3.79 48.7dA ±0.94 54.2cA ±3.27
DDC* 138.03eA ±8.09 117.2beB ±0.25 57.7bcA ±1.49 62.4bA ±1.51
DKC* 135.97eA ±8.12 125.52bcA ±0.23 68.2eA ±1.39 54.2cB ±0.42
DYP* 144.75efA ±7.85 95.34edB ±5.37 66.4eA ±2.04 61.1bA ±1.67 a Control refers to the salad dressing samples prepared without pulse flour.
* refers to salad dressing samples prepared with flours of DGL: dehulled green lentil; GLWH: green lentil with hull; DRL: dehulled red lentil; RLWH: red lentils with hull; DDC: dehulled Desi chickpea; DKC: dehulled Kabuli chickpea; and DYP: dehulled yellow pea. a The plateau modulus, 0
NG , which is defined as an extrapolation of the contribution of the interdroplet interactions to G’ at high frequencies, was estimated by an approximate procedure: ′ ; b
)%(tQ refers to the extent of recovery of the dressing samples, it is calculated as the percentage difference of the strains measured at t = 600 s during creep and at t = 1200 s during recovery respectively (i.e., ).
Mean values with different lower case letters (a, b, and c) in the same column for each type of pulse are significantly different (P < 0.05) based on Tukey’s multiple comparison test; mean values with different capitalized letters (A and B) in the same row are significantly different (P < 0.05).
No significant variations in G’ and G” were found between the control and the supplemented dressings, in contrast with the differences found in the steady state flow tests (Figure 1). This discrepancy may be attributable to minimal damage to samples suggesting no lasting breakdown of structure during the small amplitude oscillatory measurements conducted within the LVE region, in comparison with the irreversible (coalescence) and reversible (deflocculation) processes associated with the steady state flow tests (which possibly results in dramatic structural damage) (Worrasinchai, Suphantharika, Pinjai, & Jamnong, 2006).
A general decreasing trend in G’ and G” was observed over storage across the tested frequency range for all samples (Figure 2), pointing to slightly decreased viscoelastic properties over time in the highly compacted emulsions.
can be considered a measure of the intensity of the entangled network and is closely related to the formation of a structural network due to extensive flocculation processes (Franco, Berjano, & Gallegos, 1997; Moros, Franco, & Gallegos, 2002). No significant difference was observed between the control samples and the supplemented samples. When the values of on day 0 and day 12 were compared (Table 3), it was found that
tended to decrease with increasing storage time, and this storage effect was significant (P < 0.05) for samples supplemented with DGL, DRL, DDC, and DYP flours. Thus, storage could lead to increased shear sensitivity in the viscoelastic network for the model salad dressings.
3.1.3 Creep and Recovery Tests
In addition to dynamic oscillatory tests, creep and recovery tests are widely used to gain insight into deformation behavior as a function of time. The data in this study were plotted as compliance (J) versus time, as shown in Figure3. J is the ratio of strain to applied stress. The curves for all samples were similar (Figure 3): J increased steadily with time during the creep stage when subjected to a stress of 0.5 Pa. The compliance rate (the slope of J) decreased with time until the maximum value was attained. After the stress was removed, the elastic component of the deformation recovered instantaneously, as evidenced by a sharp decrease at the beginning of the recovery phase (Figures 3a and 3b).
( )% (600 ) (1200 ) / (600 ) 100Q t s s s

www.ccsenet.org/jfr Journal of Food Research Vol. 2, No. 2; 2013
175
Figure 3. Creep and recovery curves for salad dressing emulsions prepared with and without (control) pulse flours
(a) Salad dressing samples of control and samples supplemented with lentil flours on the storage day of 0 and 12 at 4°C; (b) Salad dressing samples of control and samples supplemented with chickpea and yellow pea flours on the storage day of 0 and 12 at 4°C. DGL: dehulled green lentil; GLWH: green lentil with hull; DRL: dehulled red lentil; RLWH: red lentils with hull; DDC: dehulled Desi chickpea; DKC: dehulled Kabuli chickpea; and DYP: dehulled yellow pea.
All the samples exhibited typical viscoelastic characteristics during creep and recovery phases. This finding is consistent with the results reported by Li, Du, Chen, and Yeo (2002) and Zhang et al. (2008). The control samples exhibited significant higher J values than the pulse flour-supplemented samples in the tests (Figure 3), indicating that the control with a relatively weak network structure underwent a larger deformation than the supplemented dressings when subject to the same stress. As shown in Table 3, the recoverable strain Q(t) % ranged from 48.7% to 68.2% for all supplemented dressings on day 0, and from 54.2% to 62.4% on day 12. Thus, most of the strain was recovered likely owing to the predominantly elastic behavior of the dressings, as discussed earlier. Although not all statistically significant, the control sample had the lowest value of Q(t) %, indicative of its lower elasticity compared with the supplemented samples.
0.00
1.00
2.00
3.00
4.00
5.00
6.00
7.00
8.00
9.00
10.00
0 200 400 600 800 1000 1200 1400
Time (s)
Co
mp
lia
nc
e J
% (
1/P
a)
Control on Day 0 Control on Day 12DGL on Day 0 DGL on Day 12GLWH on Day 0 GLWH on Day 12DRL on Day 0 DRL on Day 12RLWH on Day 0 RLWH on Day 12
0.00
1.00
2.00
3.00
4.00
5.00
6.00
7.00
8.00
0 200 400 600 800 1000 1200 1400
Time (s)
Co
mp
lia
nc
e J
% (
1/P
a)
Control on Day 0 Control on Day 12
DDC on Day 0 DDC on Day 12
DKC on Day 0 DKC on Day 12
DYP on Day 0 DYP on Day 12
(b)
(a)

www.ccsenet.org/jfr Journal of Food Research Vol. 2, No. 2; 2013
176
3.2 Colormeasurements
The variations in lightness (L*), redness (a*) and yellowness (b*) values over time for the different model salad dressing samples are presented in Table 4.
Table 4. Color measurement for salad dressing emulsions during 28 days of storage
Samples Day 0 Day 1 Day 2 Day 3 Day 4 Day 5 Day 6 Day 7 Day 12 Day 28
Control L 68.49±0.97 68.82±0.66 68.79±0.69 68.78±0.72 68.61±0.63 68.50±0.51 68.49±0.65 68.11±0.36 67.86±0.52 67.46±0.34
a -0.52±0.05 -0.61±0.01 -0.61±0.01 -0.60±0.02 -0.64±0.01 -0.63±0.01 -0.62±0.01 -0.67±0.04 -0.64±0.05 -0.71±0.06
b 5.70±0.01 5.68±0.08 5.77±0.03 5.74±0.04 5.70±0.05 5.75±0.05 5.70±0.05 5.66±0.09 5.69±0.06 5.68±0.12
DGL L 66.04±0.49 63.01±1.21 63.11±0.61 61.89±3.73 75.29±0.42 68.43±6.31 70.20±3.96 66.48±4.48 68.16±5.61 71.10±5.59
a -0.81±0.02 0.71±0.01 -0.70±0.01 -0.53±0.03 -0.72±0.08 -0.62±0.01 -0.60±0.09 -0.52±0.07 -0.48±0.10 -061±0.11
b 7.55±0.18 7.56±0.17 7.48±0.10 7.49±0.15 7.82±0.28 7.76±0.43 7.64±0.30 7.90±0.13 7.66±0.28 8.16±0.05
GLWH L 61.09±0.17 61.18±0.39 63.53±0.92 73.49±0.60 69.02±6.95 61.86±0.64 69.01±0.49 70.53±6.12 61.26±0.75 68.37±4.63
a -0.45±0.08 -0.27±0.07 -0.26±0.04 -0.37±0.08 -0.29±0.05 -0.13±0.05 -0.19±0.08 -0.18±0.11 -0.01±0.00 -0.05±0.02
b 8.68±0.24 8.61±0.32 8.86±0.14 8.97±0.39 8.91±0.09 8.48±0.15 8.96±0.39 8.66±0.34 8.70±0.02 9.96±0.05
DRL L 64.01±1.23 66.67±4.76 75.11±0.59 68.99±6.85 66.13±4.42 67.35±4.74 71.26±5.75 63.85±0.72 72.96±4.31 65.47±5.07
a 0.93±0.08 1.04±0.08 0.97±0.01 0.96±0.10 0.99±0.09 0.99±0.04 1.03±0.05 1.14±0.03 1.05±0.02 0.97±0.02
b 7.89±0.23 7.89±0.20 8.23±0.19 7.77±0.15 7.85±0.23 7.99±0.06 7.91±0.23 7.73±0.10 7.88±0.03 8.34±0.28
RLWH L 57.73±1.04 67.59±6.66 73.23±0.57 63.61±5.69 69.97±5.25 60.44±0.97 72.65±0.24 67.32±4.64 72.17±0.27 68.18±3.58
a 1.02±0.02 1.13±0.03 1.08±0.05 1.15±0.15 1.23±0.07 1.17±0.15 1.27±0.07 1.34±0.03 1.11±0.08 1.18±0.11
b 8.88±0.17 9.49±0.41 9.52±0.21 8.82±0.12 9.76±0.20 8.60±0.37 9.61±0.21 9.32±0.33 9.39±0.09 9.79±0.17
DDC L 71.45±3.06 65.92±7.32 70.60±6.82 64.60±3.16 71.80±5.26 69.05±4.82 68.95±3.98 62.61±2.66 63.48±3.11 65.25±3.46
a -0.91±0.12 -0.86±0.08 -0.83±0.10 -0.76±0.07 -0.81±0.08 -0.71±0.10 -0.60±0.05 -0.55±0.03 -0.64±0.08 -0.57±0.16
b 9.73±0.31 9.42±0.32 9.36±0.26 9.41±0.42 9.42±0.09 9.16±0.03 9.15±0.12 8.98±0.19 8.42±0.31 8.82±0.21
DKC L 66.21±7.40 74.63±0.54 71.13±4.18 70.45±3.90 66.94±6.97 66.63±3.71 70.54±2.60 70.19±3.39 66.87±5.38 65.89±6.78
a -0.84±0.11 -0.90±0.04 -0.91±0.04 -0.80±0.14 -0.69±0.11 -0.64±0.09 -0.67±0.12 -0.73±0.14 -0.71±0.07 -0.76±0.08
b 8.38±0.59 8.43±0.18 8.51±0.12 8.38±0.26 8.18±0.38 8.16±0.18 8.18±0.21 7.95±0.23 7.38±0.29 7.41±0.27
DYP L 64.17±5.52 66.36±5.51 74.65±0.84 66.91±8.31 63.32±1.31 70.86±6.11 66.93±7.21 70.76±7.45 70.64±5.43 65.79±5.29
a -0.70±0.08 -0.57±0.09 -0.66±0.08 -0.53±0.12 -0.47±0.01 -0.63±0.10 -0.59±0.07 -0.75±0.06 -0.68±0.03 -0.61±0.10
b 7.66±0.22 7.59±0.04 7.91±0.09 7.75±0.09 7.60±0.11 7.79±0.11 7.47±0.19 7.31±0.15 7.75±0.28 7.88±0.35
DGL: dehulled green lentil; GLWH: green lentil with hull; DRL: dehulled red lentil; RLWH: red lentils with hull; DDC: dehulledDesi chickpea; DKC: dehulled Kabuli chickpea; and DYP: dehulled yellow pea.
Among the freshly made samples (day 0), salad dressing supplemented with dehulled Desi chickpea showed the highest (P < 0.05) b* values, therefore ranking first for yellowness. The highest a* values were obtained for DRL and RLWH supplemented salad dressings, indicating that the use of these two types of pulse flour could increase the reddish tint in dressings. The other supplemented samples as well as the control samples gave negative a* (-ve) values, indicative of a pronounced green tint. Given that all the other ingredients are the same, the difference in color is most likely attributable to supplementation with the different pulse flour varieties. There was little variation in a* and b* values during the 28 days relative to the initial color. The control had similar L* values but significantly (P < 0.05) lower b* values than the pulse flour-supplemented samples. L* values of all the pulse flour-supplemented samples were also stable. Lightness is of great importance since it has a major impact on the perceived appearance of salad dressing products. These observations are consistent with the results of Laca et al. (2010) which found that storage did not have a significant effect on the color of mayonnaise samples.
www.ccsenet.org/jfr Journal of Food Research Vol. 2, No. 2; 2013
177
3.3 Physical Stability
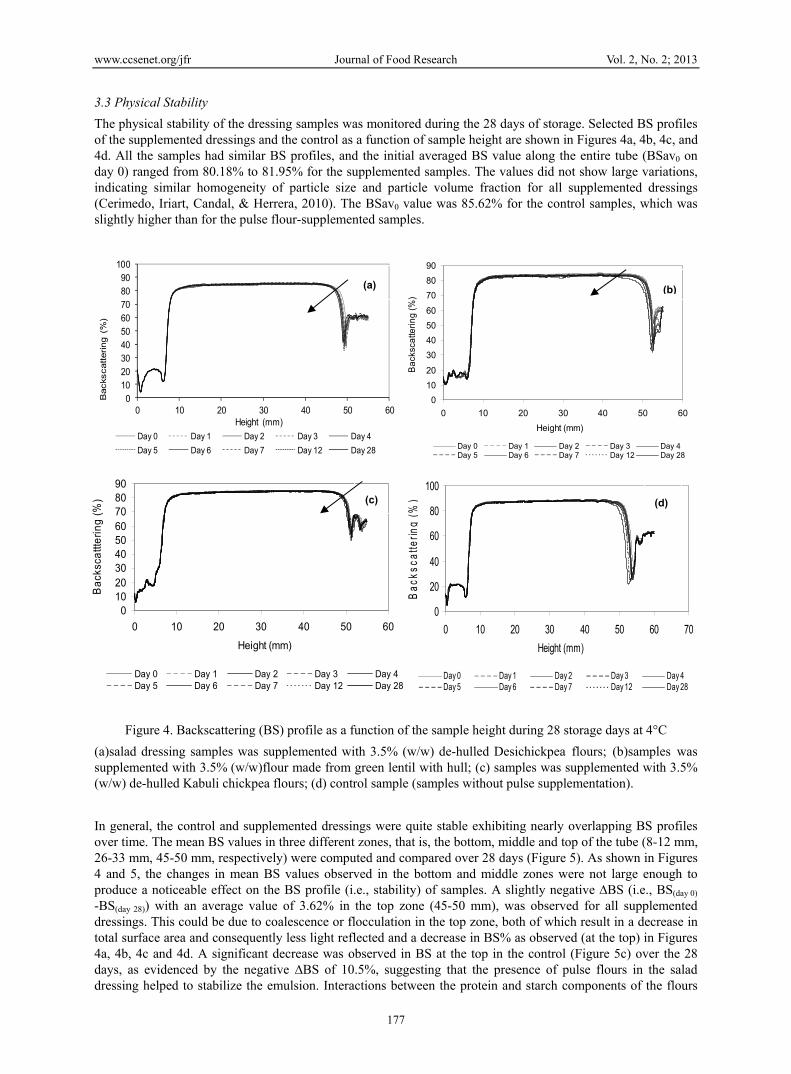
The physical stability of the dressing samples was monitored during the 28 days of storage. Selected BS profiles of the supplemented dressings and the control as a function of sample height are shown in Figures 4a, 4b, 4c, and 4d. All the samples had similar BS profiles, and the initial averaged BS value along the entire tube (BSav0 on day 0) ranged from 80.18% to 81.95% for the supplemented samples. The values did not show large variations, indicating similar homogeneity of particle size and particle volume fraction for all supplemented dressings (Cerimedo, Iriart, Candal, & Herrera, 2010). The BSav0 value was 85.62% for the control samples, which was slightly higher than for the pulse flour-supplemented samples.
Figure 4. Backscattering (BS) profile as a function of the sample height during 28 storage days at 4°C
(a)salad dressing samples was supplemented with 3.5% (w/w) de-hulled Desichickpea flours; (b)samples was supplemented with 3.5% (w/w)flour made from green lentil with hull; (c) samples was supplemented with 3.5% (w/w) de-hulled Kabuli chickpea flours; (d) control sample (samples without pulse supplementation).
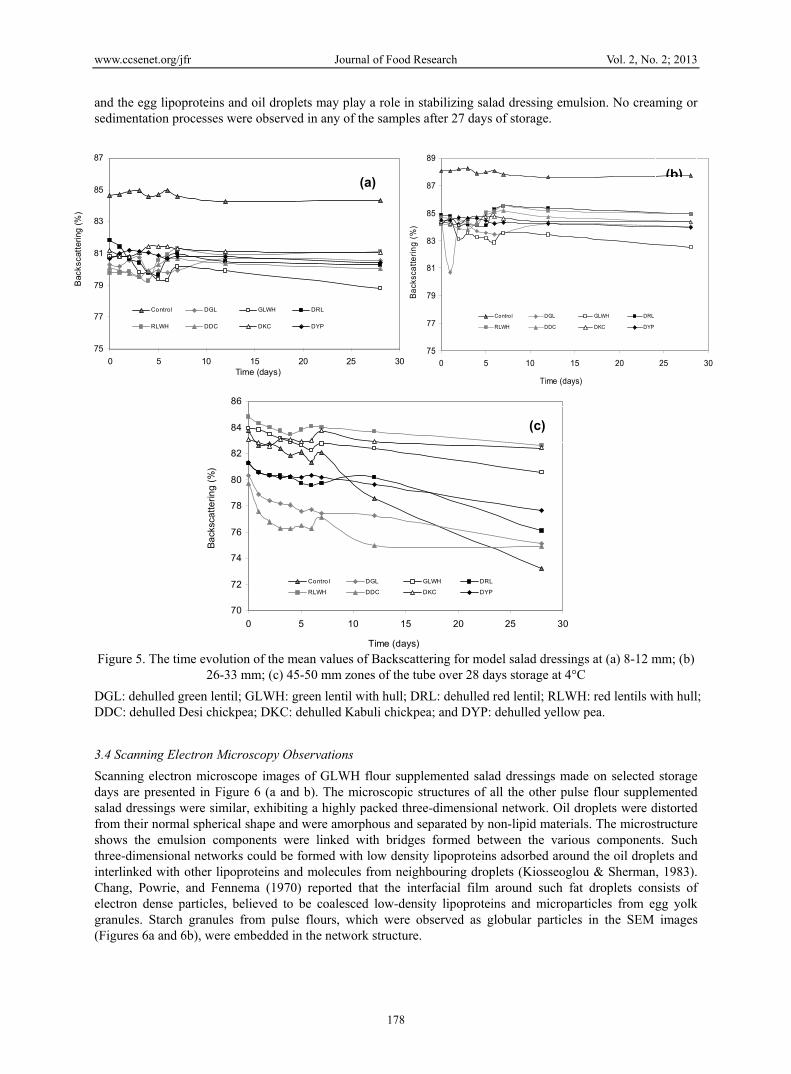
In general, the control and supplemented dressings were quite stable exhibiting nearly overlapping BS profiles over time. The mean BS values in three different zones, that is, the bottom, middle and top of the tube (8-12 mm, 26-33 mm, 45-50 mm, respectively) were computed and compared over 28 days (Figure 5). As shown in Figures 4 and 5, the changes in mean BS values observed in the bottom and middle zones were not large enough to produce a noticeable effect on the BS profile (i.e., stability) of samples. A slightly negative ∆BS (i.e., BS(day 0) -BS(day 28)) with an average value of 3.62% in the top zone (45-50 mm), was observed for all supplemented dressings. This could be due to coalescence or flocculation in the top zone, both of which result in a decrease in total surface area and consequently less light reflected and a decrease in BS% as observed (at the top) in Figures 4a, 4b, 4c and 4d. A significant decrease was observed in BS at the top in the control (Figure 5c) over the 28 days, as evidenced by the negative ∆BS of 10.5%, suggesting that the presence of pulse flours in the salad dressing helped to stabilize the emulsion. Interactions between the protein and starch components of the flours
0
10
20
30
40
50
60
70
80
90
0 10 20 30 40 50 60
Height (mm)
Ba
cksc
atte
rin
g (
%)
Day 0 Day 1 Day 2 Day 3 Day 4Day 5 Day 6 Day 7 Day 12 Day 28
(b)
0102030405060708090
100
0 10 20 30 40 50 60
Backs
cattering (
%)
Height (mm)
Day 0 Day 1 Day 2 Day 3 Day 4
Day 5 Day 6 Day 7 Day 12 Day 28
(a)
0102030405060708090
0 10 20 30 40 50 60
Height (mm)
Ba
cksc
attt
eri
ng
(%
)
Day 0 Day 1 Day 2 Day 3 Day 4Day 5 Day 6 Day 7 Day 12 Day 28
(c)
0
20
40
60
80
100
0 10 20 30 40 50 60 70
Height (mm)
Bac
ksca
tterin
g (%
)
Day 0 Day 1 Day 2 Day 3 Day 4Day 5 Day 6 Day 7 Day 12 Day 28
(d)
www.ccsenet.org/jfr Journal of Food Research Vol. 2, No. 2; 2013
178
and the egg lipoproteins and oil droplets may play a role in stabilizing salad dressing emulsion. No creaming or sedimentation processes were observed in any of the samples after 27 days of storage.
Figure 5. The time evolution of the mean values of Backscattering for model salad dressings at (a) 8-12 mm; (b)
26-33 mm; (c) 45-50 mm zones of the tube over 28 days storage at 4°C
DGL: dehulled green lentil; GLWH: green lentil with hull; DRL: dehulled red lentil; RLWH: red lentils with hull; DDC: dehulled Desi chickpea; DKC: dehulled Kabuli chickpea; and DYP: dehulled yellow pea.
3.4 Scanning Electron Microscopy Observations
Scanning electron microscope images of GLWH flour supplemented salad dressings made on selected storage days are presented in Figure 6 (a and b). The microscopic structures of all the other pulse flour supplemented salad dressings were similar, exhibiting a highly packed three-dimensional network. Oil droplets were distorted from their normal spherical shape and were amorphous and separated by non-lipid materials. The microstructure shows the emulsion components were linked with bridges formed between the various components. Such three-dimensional networks could be formed with low density lipoproteins adsorbed around the oil droplets and interlinked with other lipoproteins and molecules from neighbouring droplets (Kiosseoglou & Sherman, 1983). Chang, Powrie, and Fennema (1970) reported that the interfacial film around such fat droplets consists of electron dense particles, believed to be coalesced low-density lipoproteins and microparticles from egg yolk granules. Starch granules from pulse flours, which were observed as globular particles in the SEM images (Figures 6a and 6b), were embedded in the network structure.
70
72
74
76
78
80
82
84
86
0 5 10 15 20 25 30
Time (days)
Ba
cksc
att
eri
ng
(%
)
Contro l DGL GLWH DRL
RLWH DDC DKC DYP
(c)
75
77
79
81
83
85
87
0 5 10 15 20 25 30Time (days)
Bac
ksca
tter
ing
(%)
Contro l DGL GLWH DRL
RLWH DDC DKC DYP
(a)
75
77
79
81
83
85
87
89
0 5 10 15 20 25 30
Time (days)
Ba
cksc
att
eri
ng
(%
)
Contro l DGL GLWH DRL
RLWH DDC DKC DYP
(b)

www.ccsenet.org/jfr Journal of Food Research Vol. 2, No. 2; 2013
179
Figure 6. Scanning electron micrograph of salad dressing emulsion prepared with and without (control) flours of
green lentil with hull (GLWH)
(a) sample made with GLWH flour on day 0; (b) sample made with GLWH flour on day 28 stored at 4 °C; (c) control on day 0; (d) control on day 28.
The network contained a large number of interspaced voids of varying dimensions; the voids represent the aqueous continuous phase in the dressing emulsions (Worrasinchai et al., 2006) which was removed by dehydration during sample preparation. Results show that the network structure tended to break up with increasing storage time (Figure 6a and 6b). In the SEM image on day 28 (Figure 6b), the network has a less compact cross-linked network. Cavella, Di Monaco, Torrieri and Masi (2009) also reported that mayonnaise samples had a less closely packed structure during storage. The microstructure results are generally consistent with the decreased consistency coefficient and apparent viscosity observed in the steady state flow tests.
The SEM images of the control (i.e., the salad dressings without pulse supplementation) are shown in Figure 6 (c and d). The control did not contain the starch granules found in the supplemented dressings. The structures in the control also seemed to be less compact and less uniform compared with those in the supplemented ones. This supports our rheological findings (i.e., significant increase in apparent viscosity (ƞap), consistency coefficient (m value), degree of pseudoplasticity (n value), and recoverable strain (Q(t)%) on addition of pulse flours) indicating that the pulse flours may have acted as thickeners in the salad dressing emulsions.
4. Conclusion
Pulses have been shown to have health and nutritional benefits. To increase their consumption novel approaches need to be explored to enhance their use in food formulation. This study demonstrated the feasibility of using pulse flours in salad dressing emulsions. A significantly (P < 0.05) higher consistency coefficient (m) and increased recoverable strain Q(t) % was obtained for pulse-supplemented dressings compared with the control, suggesting that pulse flours might contribute to viscoelastic properties and may act as thickeners and contribute stability to salad dressing emulsion systems. Indeed, supplementation with the pulse flours increased the physical stability and also modified color by increasing yellowness and redness hues depending on the type of flour used. In the future, further studies using different proportions of pulse flours with and without egg yolk (example to
a
dc
b
www.ccsenet.org/jfr Journal of Food Research Vol. 2, No. 2; 2013
180
target the egg-free category) and with different types and concentrations of gums coupled with sensory studies will be useful.
Acknowledgements
This study was funded by the Agriculture and Agri-Food Canada Agricultural Bio-product Innovation Program. We wish to thank the Canadian International Grains Institute (Winnipeg, MB, Canada), Diefenbaker Seed Processors Ltd. (Elbow, SK, Canada) and Parrheim Foods Inc. (Saskatoon, SK, Canada) for supplying the pulse flours used for the study.
References
Adebamowo, C. A., Cho, E., Sampson, L., Katan, M. B., Spiegelman, D., Willett, W. C., & Holmes, M. D. (2005). Dietary flavonols and flavonol-rich foods intake and the risk of breast cancer. International Journal of Cancer, 114(4), 628-633. http://dx.doi.org/10.1002/ijc.20741
Anton, A. A., Ross, K. A., Lukow, O. M., Fulcher, R. G., & Arntfield, S. D. (2008). Influence of added bean flour (Phaseolus vulgaris L.) on some physical and nutritional properties of wheat flour tortillas. Food Chemistry, 109(1), 33-41. http://dx.doi.org/10.1016/j.foodchem.2007.12.005
Barnes, H. A., Hutton, J. F., & Walters, K. (1991). An introduction to rheology.Amsterdam: Elsevier Science Publishers.
Bazzano, L. A., He, J., Ogden, L. G., Loria, C., Vupputuri, S., Myers, L., & Whelton, P. K. (2001). Legume consumption and risk of coronary heart disease in US men and women: NHANES I Epidemiologic Follow-up Study. Archives of Internal Medicine, 161(21), 2573. http://dx.doi.org/10.1001/archinte.161.21.2573
Boye, J. I., & Ma, Z. (2012). Finger on the pulse. Food Science & Technology (London), 26(2), 20-24.
Cavella, S., Di Monaco, R., Torrieri, E., & Masi, P. (2009). Structure of a new functional walnut oil-enriched mayonnaise. Chemical engineering, 17, 79.
Cerimedo, M., Iriart, C. H., Candal, R. J., & Herrera, M. L. (2010). Stability of emulsions formulated with high concentrations of sodium caseinate and trehalose. Food Research International. http://dx.doi.org/10.1016/j.foodres.2010.04.008
Chang, C. M., Powrie, W. D., & Fennema, O. (1970). Electron microscopy of mayonnaise. J. Food Sci., 5(1), 134-137.
Franceschi, S. (1999). Nutrients and food groups and large bowel cancer in Europe. European Journal of Cancer Prevention, 8(6), S53.
Franco, J. M., Berjano, M., & Gallegos, C. (1997). Linear viscoelasticity of salad dressing emulsions. J. Agric. Food Chem, 45(3), 713-719. http://dx.doi.org/10.1021/jf9605355
Jain, M. G., Hislop, G. T., Howe, G. R., & Ghadirian, P. (1999). Plant foods, antioxidants, and prostate cancer risk: findings from case-control studies in Canada. Nutrition and cancer, 34 (2), 173-184.
Kiosseoglou, V. D. (2003). Egg yolk protein gels and emulsions. Current opinion in colloid & interface science, 8(4-5), 365-370. http://dx.doi.org/10.1016/S1359-0294(03)00094-3
Kiosseoglou, V. D., & Sherman, P. (1983). Influence of egg yolk lipoproteins on the rheology and stability of o/w emulsions and mayonnaise 1. viscoelasticity of groundnut oil in water emulsions and mayonnaise. Journal of texture studies, 14(4), 397-417. http://dx.doi.org/10.1111/j.1745-4603.1983.tb00358.x
Laca, A., Sáenz, M. C., Paredes, B., & Díaz, M. (2010). Rheological properties, stability and sensory evaluation of low-cholesterol mayonnaises prepared using egg yolk granules as emulsifying agent. Journal of food engineering, 97(2), 243-252. http://dx.doi.org/10.1016/j.jfoodeng.2009.10.017,
Lazou, A., & Krokida, M. (2009). Functional properties of corn and corn-lentil extrudates. Food Research International. http://dx.doi.org/10.1016/j.foodres.2009.09.017
Li, W. H., Du, H., Chen, G., & Yeo, S. H. (2002). Experimental investigation of creep and recovery behaviors of magnetorheological fluids. Materials Science and Engineering A, 333(1-2), 368-376. http://dx.doi.org/10.1016/S0921-5093(01)01865-2
Ma, Z., Boye, J. I., Simpson, B. K., Prasher, S. O., Monpetit, D., & Malcolmson, L. (2011). Thermal processing effects on the functional properties and microstructure of lentil, chickpea, and pea flours. Food Research International, 44(8), 2534-2544. http://dx.doi.org/10.1016/j.foodres.2010.12.017

www.ccsenet.org/jfr Journal of Food Research Vol. 2, No. 2; 2013
181
Mandala, I. G., Savvas, T. P., & Kostaropoulos, A. E. (2004). Xanthan and locust bean gum influence on the rheology and structure of a white model-sauce. Journal of food engineering, 64(3), 335-342. http://dx.doi.org/10.1016/j.jfoodeng.2003.10.018
McClements, D. J. (2005). Food emulsions principles, practices, and techniques. In CRC series in contemporary food science (2nd ed.). Boca Raton: CRC Press.
Moros, J. E., Franco, J. M., & Gallegos, C. (2002). Rheology of spray dried egg yolk stabilized emulsions. International journal of food science & technology, 37(3), 297-307.
Nor Hayati, I., Che Man, Y. B., Tan, C. P., & Nor Aini, I. (2009). Droplet characterization and stability of soybean oil/palm kernel olein O/W emulsions with the presence of selected polysaccharides. Food hydrocolloids, 23(2), 233-243. http://dx.doi.org/10.1016/j.foodhyd.2008.01.004
Pan, L. G., Tomás, M. C., & Añón, M. C., (2004). Oil-in-Water emulsions formulated with sunflower lecithins: vesicle formation and stability. Journal of the American Oil Chemists' Society, 81(3), 241-244. http://doi.org/bc68f9
Paredes, M. D. C., Rao, M. A., & Bourne, M. C. (1989). Rheological characterization of salad dressings 2: effect of storage. Journal of texture studies, 20(2), 235-250. http://dx.doi.org/10.1111/j.1745-4603.1989.tb00436.x
Rasmay, N., El-Shatanovi, G., & Hassan, K. (2001). High-protein macaroni from legume flours and their protein concentrates. Annals of Agricultural Science, 45(2), 555-570.
Romero, A., Cordobés, F., Puppo, M. C., Guerrero, A., & Bengoechea, C. (2008). Rheology and droplet size distribution of emulsions stabilized by crayfish flour. Food Hydrocolloids, 22(6), 1033-1043. http://dx.doi.org/10.1016/j.foodhyd.2007.05.019
Sadowska, J., Fornal, J., Vidal-Valverde, C., & Frias, J. (1999). Natural fermentation of lentils. Functional properties and potential in breadmaking of fermented lentil flour. Nahrung/Food, 43(6), 396-401. http://dx.doi.org/10.1002/(SICI)1521-3803(19991201)43:6<396::AID-FOOD396>3.0.CO;2-N
Serdaroglu, M., YildIz-Turp, G., & Abrodímov, K. (2005). Quality of low-fat meatballs containing Legume flours as extenders. Meat Science, 70(1), 99-105. http://dx.doi.org/10.1016/j.meatsci.2004.12.015
Sherman, P. (1983). Rheological properties of emulsions. Encyclopedia of emulsion technology, 1, 405-437.
Worrasinchai, S., Suphantharika, M., Pinjai, S., & Jamnong, P. (2006). β-Glucan prepared from spent brewer’s yeast as a fat replacer in mayonnaise. Food Hydrocolloids, 20(1), 68-78. http://dx.doi.org/10.1016/j.foodhyd.2005.03.005
Wu, S. (2003). Chain structure and entanglement. Journal of Polymer Science Part B: Polymer Physics, 27(4), 723-741. http://dx.doi.org/10.1002/polb.1989.090270401
Zare, F., Boye, J. I., Orsat, V., Champagne, C., Simpson, B. K. (2011). Microbial, physical and sensory properties of yogurt supplemented with lentil flour. Food Research International, 44(8), 2482-2488. http://dx.doi.org/10.1016/j.foodres.2011.01.002
Zhang, C., Quek, S. Y., Lam, G., & Easteal, A. J. (2008). The rheological behaviour of low fat soy-based salad dressing. International Journal of Food Science & Technology, 43(12), 2204-2212. http://dx.doi.org/10.1111/j.1365-2621.2008.01852.x