microsoft word - 1_47-5-main menu.doc reports.doc · web viewreporting . training guide v6.0....
TRANSCRIPT

TRAVELTRAX DESKTOPREPORTING Training Guide v6.0
September 21, 2011

TABLE OF CONTENTS
TRAVELTRAX Overview...............................................................................................................4Agency ETL (DataMan)............................................................................................................................ 4Credit Card ETL (CreditCardMan)............................................................................................................5Process Scheduler (Auto Processor).......................................................................................................6Hotel Name Normalization....................................................................................................................... 7Currency Converter (MoneyMan).............................................................................................................8TTX Desktop Reporting (TravelMan).......................................................................................................9Data Quality Manager (QualityMan).......................................................................................................10Airline Contract Management................................................................................................................. 11TTX Web Reporting (WebMan)..............................................................................................................12
Executive Overview Dashboard..........................................................................................................12TRX Healthcare Reporting.................................................................................................................12
TRAVELTRAX Portal............................................................................................................................. 13
Relational Databases..................................................................................................................14Automated Global Travel Data Consolidation........................................................................................16Entity Relational Diagram....................................................................................................................... 17
Configuring ODBC and BDE.......................................................................................................18Overview................................................................................................................................................ 18Configure ODBC.................................................................................................................................... 19Configure BDE....................................................................................................................................... 24
Desktop Reporting.......................................................................................................................28Introduction............................................................................................................................................ 28
Main Menu...................................................................................................................................29Overview................................................................................................................................................ 29Tool Bar................................................................................................................................................. 30Menu Bar............................................................................................................................................... 32Tools...................................................................................................................................................... 34
Databases.......................................................................................................................................... 34System Setup..................................................................................................................................... 35Licensing............................................................................................................................................ 35
Help........................................................................................................................................................ 36Right Click Options................................................................................................................................. 36Report Options....................................................................................................................................... 37Data Dictionary....................................................................................................................................... 38
Profiles.........................................................................................................................................39Overview................................................................................................................................................ 39Profile Exercise...................................................................................................................................... 40
Single Profile...................................................................................................................................... 42
Reports........................................................................................................................................43Overview................................................................................................................................................ 43
TRAVELTRAX Desktop Reporting Page 2Confidential TRX, Inc.

Report 1 – Detail Report..............................................................................................................44Create Report......................................................................................................................................... 45
Report Properties............................................................................................................................... 46Section Properties.............................................................................................................................. 46
Report Query.......................................................................................................................................... 47Calculations........................................................................................................................................ 48Expression Builder.............................................................................................................................. 48Filters.................................................................................................................................................. 49
Design.................................................................................................................................................... 52
Paradox (PDF) Report Design.....................................................................................................53
Report 2 – Summary Report........................................................................................................62Create Report......................................................................................................................................... 63Report Query.......................................................................................................................................... 64
Summary Types................................................................................................................................. 65
Report 3 – Ranking Report..........................................................................................................70Create Report......................................................................................................................................... 71Report Query.......................................................................................................................................... 72
Ranking.............................................................................................................................................. 73
Report 4 – Multi-level Ranking Report.........................................................................................75Create Report......................................................................................................................................... 76Report Query.......................................................................................................................................... 77
Customization..............................................................................................................................78Calculations........................................................................................................................................... 78Filter Assist............................................................................................................................................ 79Reporting Periods.................................................................................................................................. 80Category Editor...................................................................................................................................... 80Lookups................................................................................................................................................. 81Lists........................................................................................................................................................ 84
Troubleshooting and Tips............................................................................................................86Export..................................................................................................................................................... 86Import..................................................................................................................................................... 87
Linking Reports............................................................................................................................88One to Many Link Overview................................................................................................................... 89Report 5................................................................................................................................................. 90Report 6................................................................................................................................................. 93One to One Link Overview.....................................................................................................................95Report 7................................................................................................................................................. 96
Union Reports..............................................................................................................................99Report 8............................................................................................................................................... 100
Excel Design Reports................................................................................................................102Excel Design Steps.............................................................................................................................. 104Report 10............................................................................................................................................. 107
Prompts.....................................................................................................................................110
TRAVELTRAX Desktop Reporting Page 3Confidential TRX, Inc.
Relationships.............................................................................................................................110
TRAVELTRAX Desktop Reporting Page 4Confidential TRX, Inc.
TRAVELTRAX Overview
Agency ETL (DataMan)Agency ETL is the data management tool used to convert data from back-office systems into a format that TRAVELTRAX Desktop Reporting can recognize and use. The menu options in Agency ETL provide the user a high level of flexibility in customizing the way data is imported into TRAVELTRAX Desktop Reporting.
Request OptionsThis tab provides the ability to designate how daily car rates are derived, how the Advance Purchase Group data is calculated and Archive Options.
Parsed FieldsThis Tab provides a means to parse data from an existing data field, provided by your back-office system, and place it in a reserved TRAVELTRAX Desktop Reporting field.
An example of this can be explained with the data entry Low Fare. Normally, this value resides in a field reserved for miscellaneous information like a UDID (User Defined Interface Data) or Sort field. TRAVELTRAX Desktop Reporting has
a Low Fare field within its data dictionary that needs to be filled with the data from the UDID field in order to be used on a report that uses Low Fare. This is accomplished by properly filling out this Tab.
Download PurgeThese options are used when performing a download directly from your back-office or purging data previously imported into the TRAVELTRAX Desktop Reporting database. Multiple profiles may be created that limit the data downloaded from the back office system or purged from the TRAVELTRAX Desktop Reporting database.
Internet TransferThis tab permits users to utilize the Internet or Email to transfer files downloaded via Agency ETL Download.
TRAVELTRAX Desktop Reporting Page 5Confidential TRX, Inc.

Credit Card ETL (CreditCardMan)Credit Card ETL is the data management tool you’ll use for credit card consolidation, to perform the following functions:
1. Extract data from credit card agency-provided transaction files.
2. Import credit card transactions to the TRAVELTRAX Client database.
3. Match Booking information (Air Ticket, Car and Hotel Reservations) to Credit Card Transactions for subsequent reporting by the TRAVELTRAX Client reporting application.
Credit Card ETL Processing – Detailed instructions on how to successfully use Credit Card ETL to import and/or transfer data for local or data consolidation services provided by TRX.
Match Process Descriptions – A high level explanation of the processes that occur during the matching of booking information to credit card transactions.
Command Line Options – A complete list of command line options for users who may want to call Credit Card ETL from other applications, such as Windows Scheduler.
Credit Card Record Types – A list of all record types imported by the Credit Card ETL application into the TRAVELTRAX Client database, a well as their corresponding Industry codes and a brief description of each.
TRAVELTRAX Desktop Reporting Page 6Confidential TRX, Inc.

Process Scheduler (Auto Processor)Process Scheduler is a highly scalable system for securely transferring, processing, and tracking file based data in an automated, timely, and consistent manor. It includes a number of significant enhancements that further automate manual processes, validate, track, and troubleshoot data feeds.
The Process Scheduler functions as both a set-up tool, for defining users and scheduled events, as well as for monitoring the progress of those events. A scheduled event is set up in the Auto-Processor as a Request Set, which is a set of parameters that defines the scheduled event – and includes the definition of files to be received, where to find them, where to put them, how to process them, when to process them, who to alert when the event occurs, etc.
The Process Scheduler performs 2 primary functions: it defines and monitors the receipt of Extract files from an originator, such as a credit card agency or a travel agency, and it automatically schedules and monitors the processing of those files by one of two applications – Agency ETL or Credit Card ETL. It is typically used in a Service Bureau setting. The Process Scheduler capabilities include the following:
1. Allows Data Services personnel the ability to define Users, identify their email contact information, and provide a means to enable their access to the Data Services file delivery mechanisms.
2. Monitors the receipt of data and transaction files from Travel Agencies, Credit Card providers, etc. Works in conjunction with the TRAVELTRAX FTP monitor application, as well as third party applications such as those provided by American Express for Secure Internet File Transfer (SIFT).
3. Schedules the import of those files into a central database.
4. Initiate the data import processes, including the support of ancillary processes such as data normalization, file movement, data verification, etc.
5. Provides a means for Data Services Personnel to monitor the progress of each scheduled process.
6. Provides a structured logging facility to document the progress of scheduled process and to provide an audit trail that supports timely manual intervention and correction, in the event of errors.
7. Provides a means of sending electronic alerts (emails) to multiple recipients as to the receipt of files and the progress of each scheduled process.
TRAVELTRAX Desktop Reporting Page 7Confidential TRX, Inc.

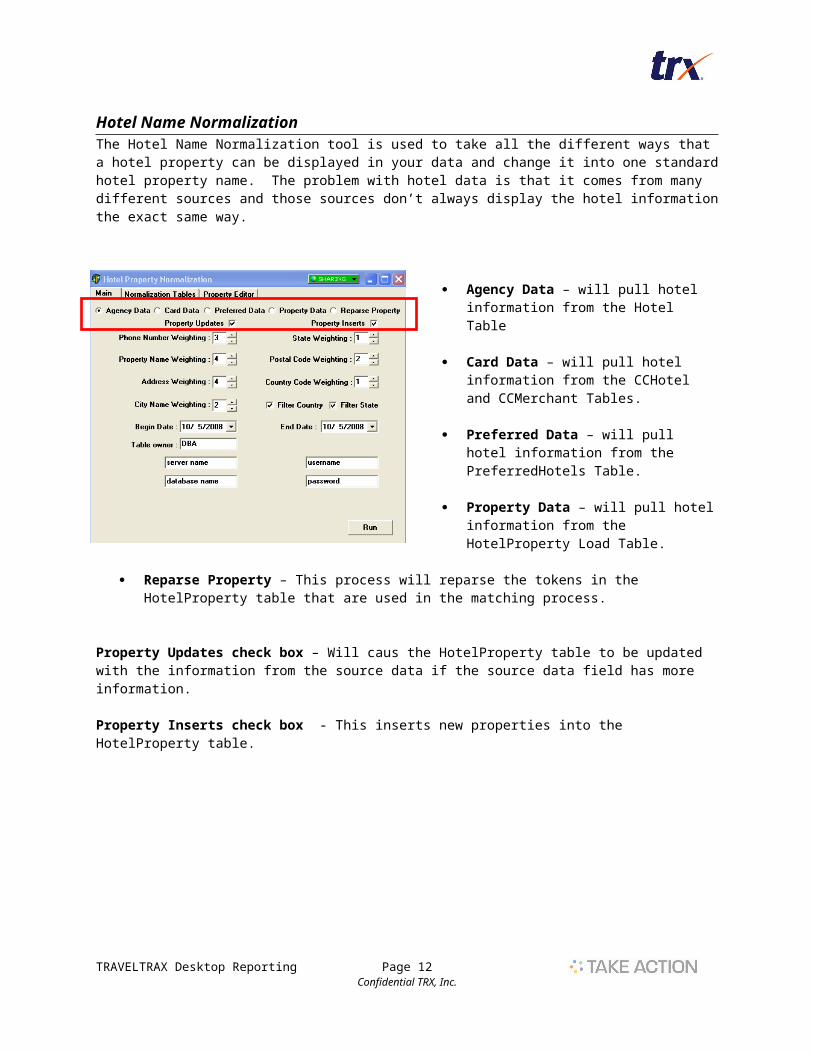
Hotel Name NormalizationThe Hotel Name Normalization tool is used to take all the different ways that a hotel property can be displayed in your data and change it into one standard hotel property name. The problem with hotel data is that it comes from many different sources and those sources don’t always display the hotel information the exact same way.
Agency Data – will pull hotel information from the Hotel Table
Card Data – will pull hotel information from the CCHotel and CCMerchant Tables.
Preferred Data – will pull hotel information from the PreferredHotels Table.
Property Data – will pull hotel information from the HotelProperty Load Table.
Reparse Property – This process will reparse the tokens in the HotelProperty table that are used in the matching process.
Property Updates check box – Will caus the HotelProperty table to be updated with the information from the source data if the source data field has more information.
Property Inserts check box - This inserts new properties into the HotelProperty table.
TRAVELTRAX Desktop Reporting Page 8Confidential TRX, Inc.

Currency Converter (MoneyMan)Currency Converter is a tool that will allow a user to enter currency code tables in their TRAVELTRAX Desktop Reporting tables for specific dates.
TRAVELTRAX Desktop Reporting Page 9Confidential TRX, Inc.

TTX Desktop Reporting (TravelMan)TRAVELTRAX Desktop Reporting is a data reporting tool. This tool allows your company to build your own reports, as well as build profiles, lookup lists and batches. You will also be able to customize things such as reporting periods, category names, and corporate structures.
TRAVELTRAX Desktop Reporting Page 10Confidential TRX, Inc.
Data Quality Manager (QualityMan)Data Quality Manager is a state of the art database management program. It complements TRAVELTRAX Desktop Reporting by providing a user friendly tool to correct, modify, or append the data displayed on your report results. Data Quality Manager fixes data at the source, before you generate your reports, saving you the time and expense of constantly redoing your work.
Example: You have a report that displays the Validating carrier code, the total ticket amount and the low fare. If you want to keep that report like it is but you want to edit it just this one time so you can run the report and ONLY return the following data, you can create those edits in Data Quality Manager and the results will only display the following:
Delta Airline ticket amounts where the low fares were greater than $1000.00OR
Northwest Airline ticket amounts greater than $1500.00 AND low fares greater than $300.00
OR United Airline ticket amounts greater than $1000.00
The result set might look something like the example below:
TRAVELTRAX Desktop Reporting Page 11Confidential TRX, Inc.
Airline Contract ManagementTRX's Airline Contract Management program provides an end to end solution for companies to manage their airline contracts; from planning, performance evaluation and utilization to compliance and ROI measurement. The result is improved contracts and maximized savings through enhanced forecasting and negotiation, on-going optimization, monitoring and compliance auditing.
The foundation of the Airline Contract Management System (ACM) is TRX's ability to acquire and consolidate detail global travel spend data from virtually all travel data sources to TRX’s industry leading travel management data warehouse. Traditional travel transaction data is sourced from the travel management company(s)’s back office (post trip or ticketed data) and GDS systems (pre-trip or planned travel).
ACM functions are enhanced with additional benchmark data such as QSI or Fair Market Share and vendor provided data when available (flown or lifted data). The ability to integrate detail level data with the terms and conditions of a company’s airline agreements distinguishes TRX from all others providing airline contact management services. This important ACM feature allows travel managers to include all the variables and factors that effect performance, compliance and ultimately savings to the company. WebMan provides the ability to deliver real time, actionable information and analytics to decision makers.
The Airline Contract Management (ACM) system is used to profile a corporation’s agreements with one or more airlines. ACM is designed to accommodate multiple contracts for different airlines as well as contract with multiple airlines or airline alliances. Each contract has one or more exhibits to define a particular type of contracted discount and performance (goals) program.
Each exhibit has one or more markets to define the city pairs and market specific rules for each exhibit.
All rules defined in an exhibit apply to all markets attached to that exhibit.
Goals and discounts may be assigned to an overall contract or specific exhibits or markets.
TRAVELTRAX Desktop Reporting Page 12Confidential TRX, Inc.
SalesData
Customer
Contract
Exhibit
Market(s)
Exhibit
Market(s)
Market(s)
Exhibit
Market(s)
Contract
Exhibit
Market(s)
FlownData

TTX Web Reporting (WebMan)TRAVELTRAX Web Reporting provides you the ability to access and run reports via the Internet. Reports can be run quickly to share throughout your organization or set up as automated report distributions. With Web Reporting access to your travel related information is limited only by your access to the Internet. Reports are returned to you in numerous formats, including Microsoft Excel, a Printable Document Format (PDF), Xcelsius dashboard (Adobe Flash).
Executive Overview DashboardThis is a report that is made up of many individual reports. It gives an overview of all travel information for the current period data and the year to date data. This report can be set up to display as soon as a use logs onto a Web Reporting site, or they can run the report under a specific category.
TRX Healthcare ReportingMost of what we’ve already seen has been for travel information. We do also have one account that we do reporting for that has health information. The tools are the same, but the data is different.
TRAVELTRAX Desktop Reporting Page 13Confidential TRX, Inc.

TRAVELTRAX PortalThe TRAVELTRAX Portal is a site for our clients to use to enter a support request when they have a problem with any of the TTX applications. The client can then track the incident to find the status and communicate with the TRX Helpdesk about the incident.
TRAVELTRAX Desktop Reporting Page 14Confidential TRX, Inc.

Relational Databases
TRAVELTRAX Desktop Reporting retrieves the data it displays on reports from a relational database. Within a database like Tman.db there exits TABLES where the data is stored. In TRAVELTRAX Desktop Reporting those tables might look similar to the screenshot below.
These tables are similar to a spreadsheet in that the data is stored in a tabular format.
Each column in a table is referred to as a FIELD. Within each table you will normally find many fields. Each field must have a unique name (e.g. TicketNum, ClientCode, etc.). The rows are usually called RECORDS or ROWS and are made up of these unique fields. Within each field, the values for the rows are stored. Each record contains a complete set of data for a specific occurrence. In the example above,
each row represents an individual ticket invoice.
Every table contained in a relational database must have one or more fields that will uniquely identify a record. These unique fields are called the PRIMARY KEY. Using our example above, the primary key for the ticket table is made up of the RecordKey and the IataNum.
The purpose of these Primary Keys is critically important in a relational database structure. In the Tman.db, there are many tables (e.g. Ticket, Car, Hotel, etc.). Each of these tables contains data from thousands of invoices. However, each table contains only that portion of the invoice that is related to it. (E.g. INVOICE DETAIL contains air travel data, CAR contains car rental data, and HOTEL contains data on hotel stays.) To keep track (within the relational database) of which row of invoice detail data goes with which row of car data and/or hotel data the Primary Key is used.
TRAVELTRAX Desktop Reporting Page 15Confidential TRX, Inc.

To understand the relationship of the Primary Key in the above tables, let’s examine the first record in the ticket table. Notice that the PassengerName field is Cochrane/Richard J. When this individual booked his travel plans they called for air, car, and hotel reservations. Now look at the first record of the car table and the first and second records of the hotel table. The PassengerName field entries are Cochran/Richard. The middle initial J is missing. To the computer this is a different person.
Now look at the RecordKey and IataNum of each of these records. You will see that these field entries match between the tables. Using this unique Primary Key, the computer is able to select the matching car and hotel records that go with Cochrane/Richard J’s ticket record.
TRAVELTRAX Desktop Reporting Page 16Confidential TRX, Inc.

Automated Global Travel Data Consolidation
TRAVELTRAX Desktop Reporting Page 17Confidential TRX, Inc.

Entity Relational Diagram
TRAVELTRAX Desktop Reporting Page 18Confidential TRX, Inc.
InvoiceHeader
ClientCommonRemarks
Car Hotel
TranSeg
1 to 1
1 to Many
1 to 1CommonRemarks
InvoiceDetail

Configuring ODBC and BDE
OverviewMicrosoft SQL Server
Data is stored in databases. The data in a database is organized into the logical components visible to users. Each instance of SQL Server has one or more user databases. Your organization likely has only one user database containing all your post-ticketed data.
When connecting to an instance of SQL Server, your connection is associated with a particular database on the server. In the normal TRAVELTRAX Desktop Reporting installation, this database connection is typically called “TMAN”.
ODBCODBC (open database connectivity) is a database access standard that permits applications to connect to a variety of external database servers and other sources of data. ODBC's goal is to provide seamless access to enterprise data. The ODBC data source name (DSN) will refer to the configuration that connects to your SQL Server (“TMAN”). And this ODBC alias is typically called “TMAN45”.
BDEThe TRAVELTRAX Desktop Reporting application is written in a programming language called Delphi. Delphi is made by a company called Borland. The Borland Database Engine (BDE) is what Delphi uses to access desktop and client/server databases. The BDE alias refers to the configuration that connects to your ODBC data source name. It is the BDE alias that is used within the TRAVELTRAX Desktop Reporting application to recognize the database.
TRAVELTRAX Desktop Reporting Page 19Confidential TRX, Inc.
PhysicalDatabase
“TMAN” = SQL Server connection
“TMAN45” = ODBC configuration
“TMAN” =BDE configuration TRAVELTRAX
Desktop Reporting application

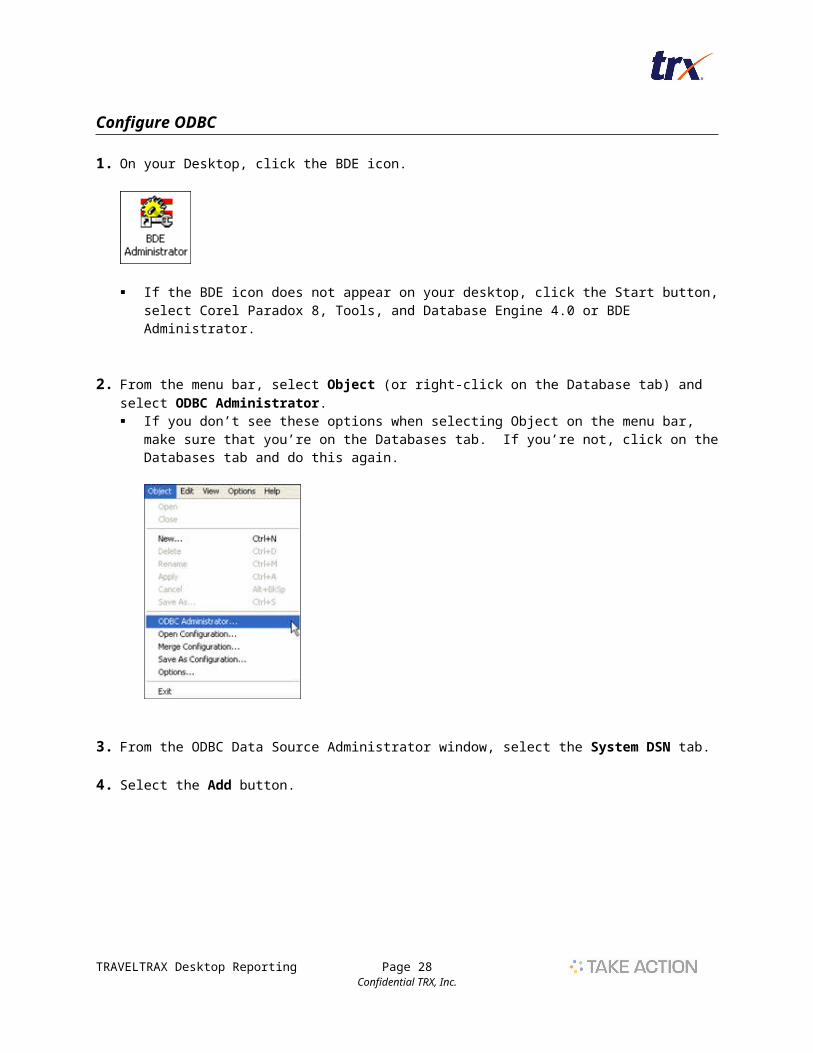
Configure ODBC
1. On your Desktop, click the BDE icon.
If the BDE icon does not appear on your desktop, click the Start button, select Corel Paradox 8, Tools, and Database Engine 4.0 or BDE Administrator.
2. From the menu bar, select Object (or right-click on the Database tab) and select ODBC Administrator. If you don’t see these options when selecting Object on the menu bar, make sure that you’re on
the Databases tab. If you’re not, click on the Databases tab and do this again.
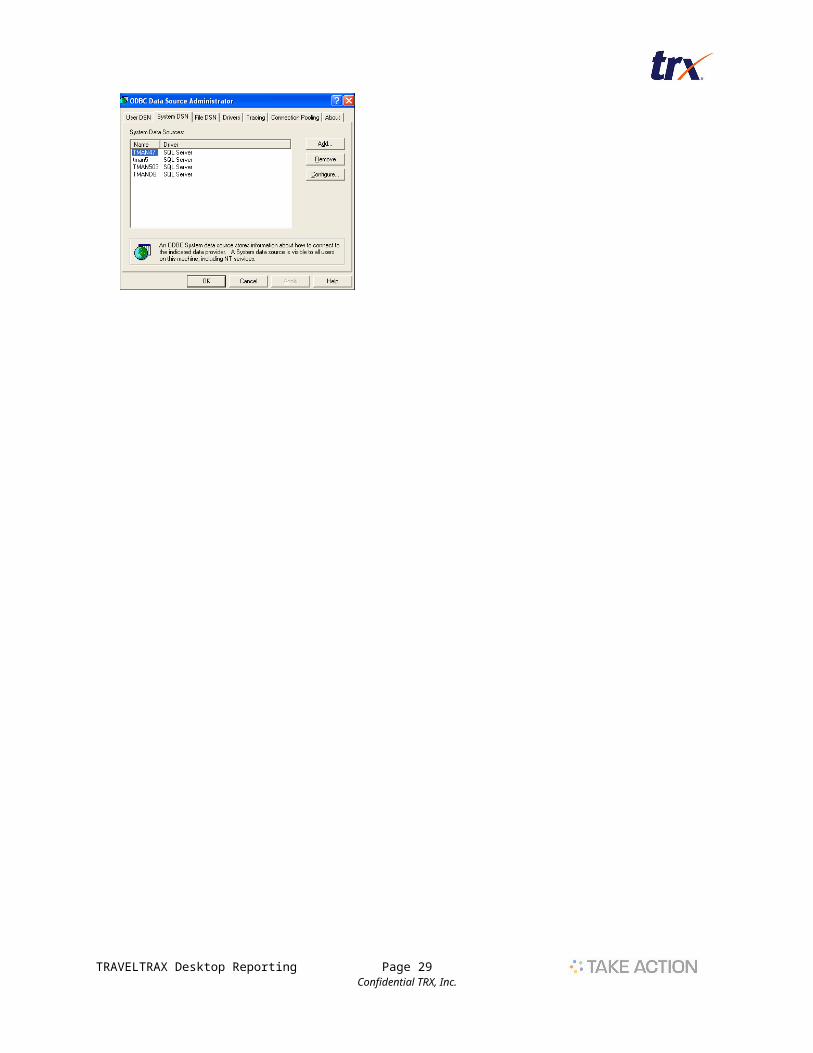
3. From the ODBC Data Source Administrator window, select the System DSN tab.
4. Select the Add button.
TRAVELTRAX Desktop Reporting Page 20Confidential TRX, Inc.

Configure ODBC continued
5. In the System Data Source list of drivers, select the Add button.
6. Select a driver for which you want to set up a data source - SQL Server.
7. Select the Finish button.
TRAVELTRAX Desktop Reporting Page 21Confidential TRX, Inc.

Configure ODBC continued
8. In the Create a New Data Source to SQL Server window, give the data source a name.
9. Enter a description (optional).
10. Enter the server name or select the sever from the drop-down list. NOTE: For assistance, contact your network administrator or TRAVELTRAX technical support.
11. Select the Next button.
TRAVELTRAX Desktop Reporting Page 22Confidential TRX, Inc.

Configure ODBC continued
12. There are two options under ‘How should SQL Server verify the authenticity of the login ID?’ Use the one you need for your company.
Choosing SQL Server authentication enables the Login ID and Password fields to display (see screenshot below).
For assistance, contact your network administrator or TRAVELTRAX Technical Support.
13. Select the Next button.
14. Select the Change the default database to checkbox.
15. From the drop-down list, select the name of the SQL Server connection that refers to your TRAVELTRAX database.
TRAVELTRAX Desktop Reporting Page 23Confidential TRX, Inc.

Configure ODBC continued
16. Select the Next button.
17. On the next screen, select Finish.
18. On the final screen, select the Test Data Source button.
If the configuration is properly test up, you will be rewarded with a message that reads, ‘TESTS COMPLETED SUCCESSFULLY’.
If you do not receive this message, review your steps to reconfigure the ODBC connection. If you need assistance, contact your network administrator or TRX Technical Support.
19. Select OK on the following screens until you return to the BDE administrator window.
The ODBC has now been established. Next, we have to configure BDE.
TRAVELTRAX Desktop Reporting Page 24Confidential TRX, Inc.

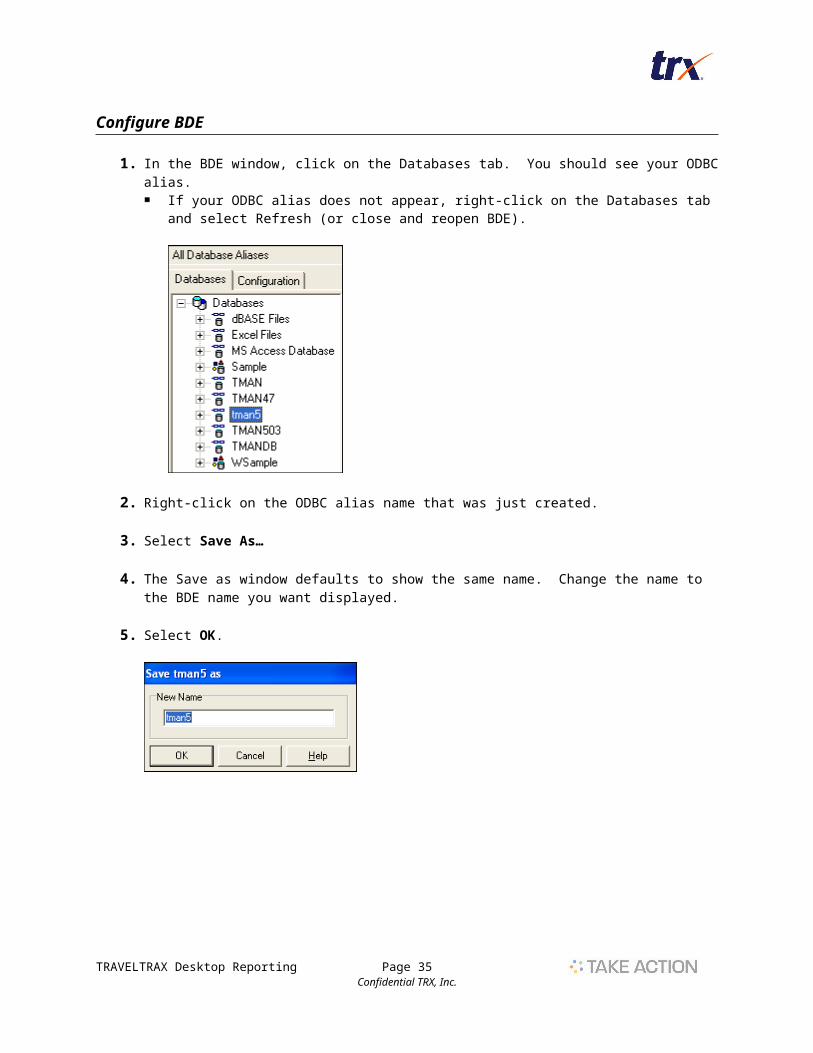
Configure BDE
1. In the BDE window, click on the Databases tab. You should see your ODBC alias. If your ODBC alias does not appear, right-click on the Databases tab and select Refresh (or
close and reopen BDE).
2. Right-click on the ODBC alias name that was just created.
3. Select Save As…
4. The Save as window defaults to show the same name. Change the name to the BDE name you want displayed.
5. Select OK.
TRAVELTRAX Desktop Reporting Page 25Confidential TRX, Inc.

Configure BDE continued
6. The new BDE alias name is now included in the list. Display the definition of the alias by selecting the name.
7. On the Definition tab, change the parameters as follows: BLOB SIZE = 1000 BLOBS TO CACHE = 16384
8. Select the Configuration tab.
9. From the Configuration tab, expand Systems by clicking the plus sign (+) to the left of it.
10. Click on INIT.
TRAVELTRAX Desktop Reporting Page 26Confidential TRX, Inc.

Configure BDE continued
11. On the Definition tab, change the parameters as follows: MAXBUFSIZE = 2048 MAXFILEHANDLES = 512 MEMSIZE = 205 MINBUFSIZE = 2048 SHAREDMEMLOCATION = 4E90 SHAREDMEMSIZE = 16384
12. From the Configuration tab, expand Configuration, Drivers, and Native by clicking the plus sign (+) to the left of each.
13. Select Paradox.
14. On the Definition tab, change the parameters as follows: BLOCK SIZE = 16384 LEVEL = 7
TRAVELTRAX Desktop Reporting Page 27Confidential TRX, Inc.
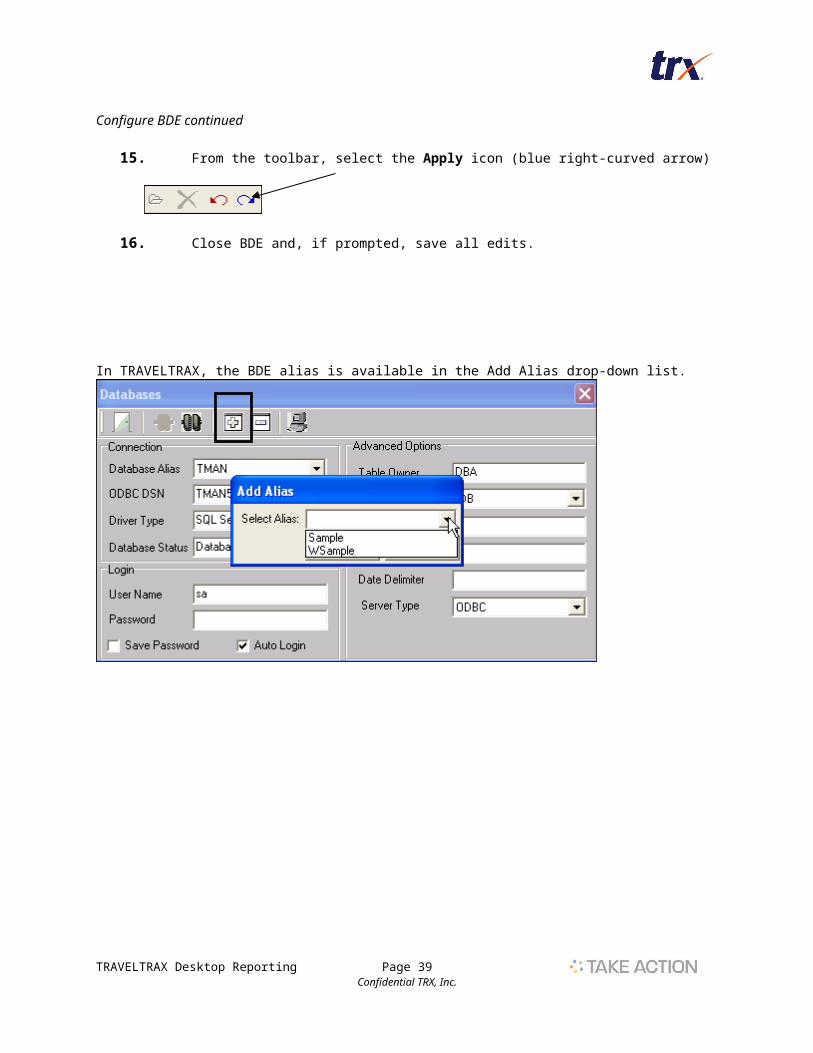
Configure BDE continued
15. From the toolbar, select the Apply icon (blue right-curved arrow)
16. Close BDE and, if prompted, save all edits.
In TRAVELTRAX, the BDE alias is available in the Add Alias drop-down list.
TRAVELTRAX Desktop Reporting Page 28Confidential TRX, Inc.
Desktop Reporting
IntroductionTRAVELTRAX Desktop Reporting is a data reporting tool that can be purchased as a standalone tool or in conjunction with a Web Reporting site. In Desktop Reporting, users have the capability to create reports, profiles, lookups, and lists as well as create a design for reports. They can also run reports manually, create batches to automate the running of reports (another tool has to be used to schedule these batches to run), view report results, and have report results emailed (if they have purchased MailMan).
During implementation, TRX will work with you to download and configure everything needed for this system to work. TRX will also work with your company to create your Data Dictionary according to your unique data.
During this training, you will learn how to: Create queries Create Profiles Create and run Batches Create a Lookup Create a List that can be used when creating your query Customize category names and reporting periods Import and Export reports for troubleshooting purposes
TRAVELTRAX Desktop Reporting Page 29Confidential TRX, Inc.

Main Menu
OverviewThe Main Menu is the primary operating screen for TRAVELTRAX Desktop Reporting. From it, you initiate most of the main functions within the program. It provides an easy to read platform that displays information in a standard windows format; customizable to your needs.
The following information is provided to enhance the learning process within the TRAVELTRAX training environment. If you require detailed information about a specific TRAVELTRAX function, please refer to the TRAVELTRAX User Guide.
Main Menu
TRAVELTRAX Desktop Reporting Page 30Confidential TRX, Inc.

Tool Bar The Tool Bar is a shortcut method of performing many of the functions associated with the main menu.
Exit TRAVELTRAX – This closes TRAVELTRAX.
New – This displays a drop-down list that allows the user to create a new Report, Profile, Batch, Lookup, List, Dictionary, or Script.
Copy – Allows the user to copy any highlighted Report, Profile, Batch, Lookup, List, Dictionary, and Script.
Delete - Allows the user to delete any highlighted Report, Profile, Batch, Lookup, List, Dictionary, and Script.
Data Dictionary – Displays the master Data Dictionary (more information to follow).
TRAVELTRAX Export - Allows the user to export (to a directory of your choice) any highlighted Report, Profile, Batch, Lookup, List, Dictionary, or Script.
TRAVELTRAX Import - Allows the user to import previously exported Reports, Profiles, Batches, Lookups, Lists, Dictionaries, or Scripts.
Run – Provides a quick method to generate any highlighted report. This will run against the company’s entire database.
TRAVELTRAX Desktop Reporting Page 31Confidential TRX, Inc.

Toolbar continued
The following seven icons allow you to display any combination of Reports, Profiles, Batches, Lookups, Lists, Dictionaries, and Scripts in the main window.
Show Reports – Will display a list of all reports for the company.
Show Profiles – Will display a list of all profiles for the company.
Show Batch Requests – Will display a list of batch requests.
Show Lookups – Will display a list of lookup tables.
Show Lists – Will display customized lists that can be used when building a query.
Show Dictionaries – Will display a list of dictionaries.
Show User Exit Scripts – Will display a list of exit scripts.
Views – Drop-down list to choose the way you want to display your Reports, Profiles, Batches, etc. The options are: Large Icons Small Icons List Details Arrange (By Name, By Description, By Category, By Type, and By Date)
TRAVELTRAX Desktop Reporting Page 32Confidential TRX, Inc.

Menu Bar The Menu Bar accomplishes many of the same functions as the Icon Bar, but requires more steps. However, there are other functions that are only available from the Menu Bar. A description of the functions that will be covered in training follows:
FileNew – From the New icon, click on the drop-down menu to create the following:
Reports Profiles Batches Lookups Lists Dictionaries Scripts
Open, Copy, Delete1. To open, copy, or delete a file (report, lookup, etc.), click on that file.
2. Select File on the menu bar.
3. Select Open, Copy, or Delete. This will either open, copy, or delete the file you have highlighted.
TRAVELTRAX Desktop Reporting Page 33Confidential TRX, Inc.

Menu Bar continued
ViewThe View Drop Down list accomplishes the same function as the icons covered earlier. It changes how you display the lists of Reports, Profiles, Batches, etc.
Refresh is used to update the main window. When you create a new Report, Profile, Batch, etc. it will not be visible until you select Refresh. You can also select the F5 keyboard key.
TRAVELTRAX Desktop Reporting Page 34Confidential TRX, Inc.
ToolsThe tools section allows the user to see what database they’re currently connected to, it will give them access to certain Desktop Reporting settings, it will allow them to create customized reporting periods, categories, and structures as well as the ability to import or export reports, profiles, lists, etc. They also have the ability to pull up Query Explorer and enter SQL expressions and look at the outcome.
Databases Use this window to configure the databases that Desktop Reporting is connected to. Normally, this only needs to be completed when you first install Desktop Reporting.
TRAVELTRAX Desktop Reporting Page 35Confidential TRX, Inc.

Tools continued
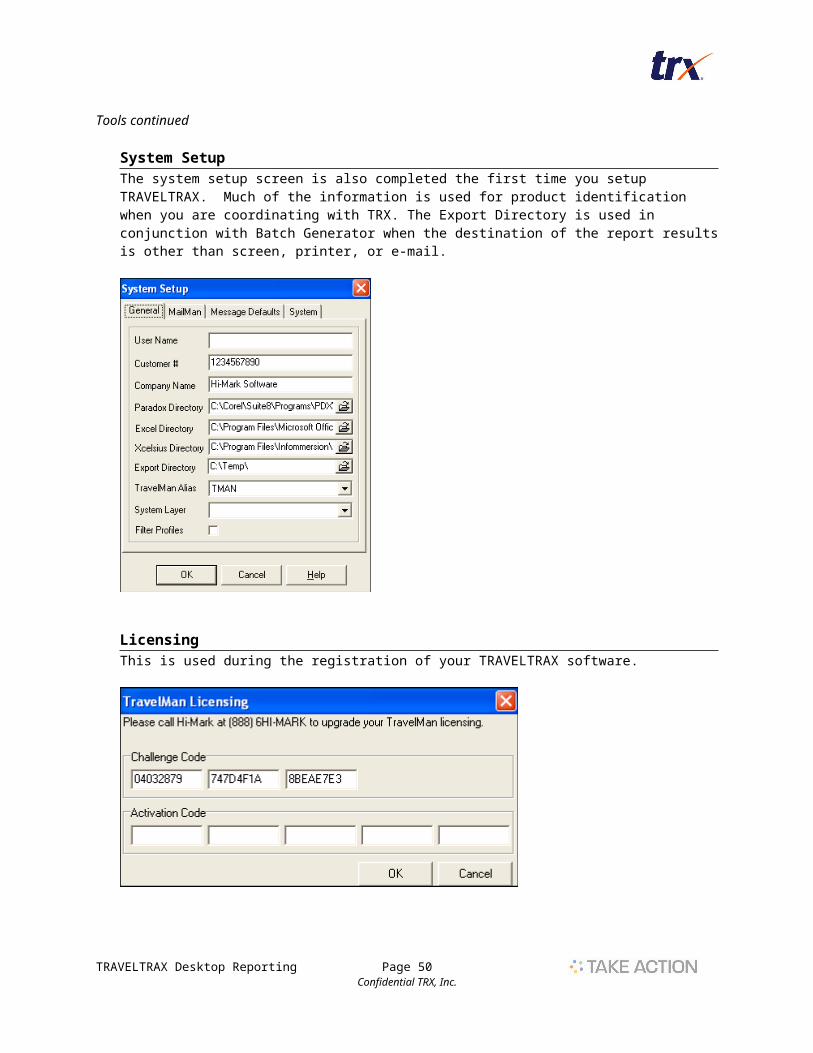
System Setup The system setup screen is also completed the first time you setup TRAVELTRAX. Much of the information is used for product identification when you are coordinating with TRX. The Export Directory is used in conjunction with Batch Generator when the destination of the report results is other than screen, printer, or e-mail.
Licensing This is used during the registration of your TRAVELTRAX software.
TRAVELTRAX Desktop Reporting Page 36Confidential TRX, Inc.

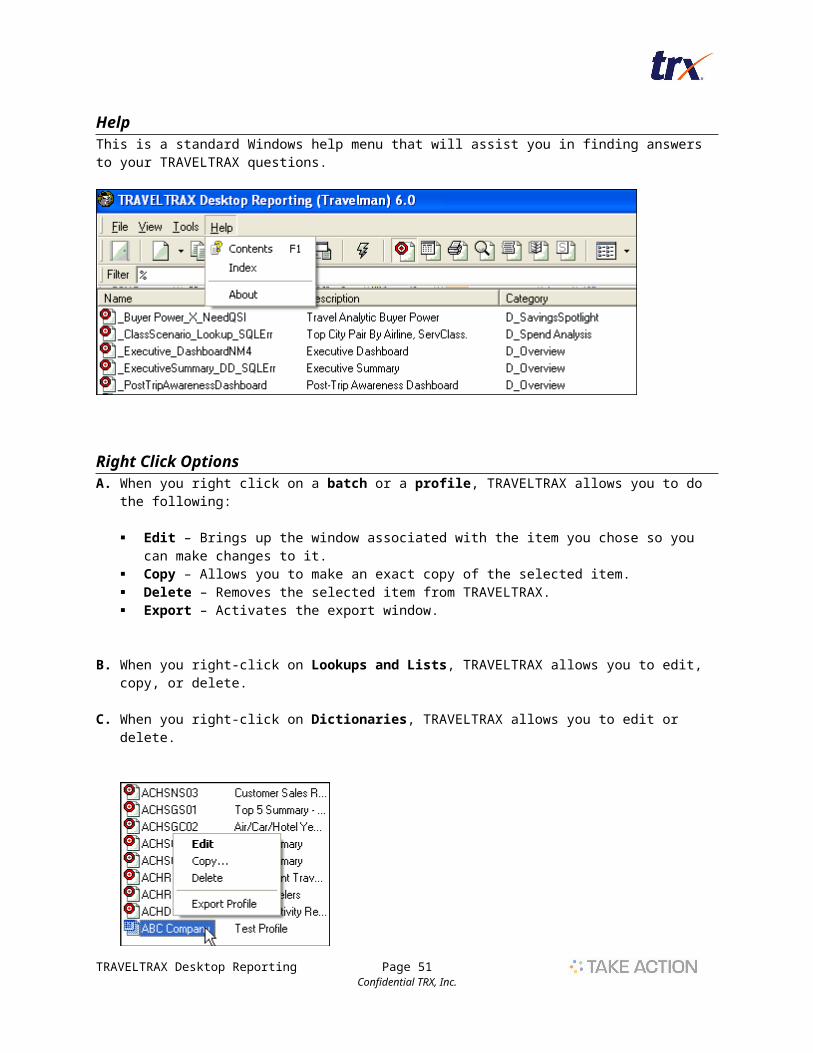
Help This is a standard Windows help menu that will assist you in finding answers to your TRAVELTRAX questions.
Right Click Options A. When you right click on a batch or a profile, TRAVELTRAX allows you to do the following:
Edit – Brings up the window associated with the item you chose so you can make changes to it. Copy – Allows you to make an exact copy of the selected item. Delete – Removes the selected item from TRAVELTRAX. Export – Activates the export window.
B. When you right-click on Lookups and Lists, TRAVELTRAX allows you to edit, copy, or delete.
C. When you right-click on Dictionaries, TRAVELTRAX allows you to edit or delete.
TRAVELTRAX Desktop Reporting Page 37Confidential TRX, Inc.

Report Options When you right-click on a report, you get a list of options associated with Reports. Many, like Copy and Delete, have already been covered. Below are the other options:
Edit Query – Opens the query window for the report you have selected so you can make changes to it.
Edit Design – Opens an existing report design or allows you to create a new one if one doesn’t already exist.
Delete Design – Deletes any existing design for the selected report.
Assign To – Allows you to assign reports to existing Profiles without having to open the designated Profile.
Run – Generates the selected report to the screen for the default date period you’ve setup in the master Reporting Periods window. This report will include data for all clients by default.
Run With – Same as Run, except the report pulls data for the Profile you select.
Export Report – Activates the export window.
TRAVELTRAX Desktop Reporting Page 38Confidential TRX, Inc.
Data DictionaryThe Data Dictionary is used extensively throughout Desktop Reporting. It contains fields from each of the tables in your database. These fields directly correspond to data element columns within the table.
Example:When you use ID021 - VendorName in a report, you are simply asking to pull selected data from the Vendor Name column of the Invoice Detail table.
The icon shown on the Main Menu will take you to the Main Data Dictionary for the client you are connected to. You will be able to see the Joins, Dependencies, etc. for all the data fields in the dictionary.
The data dictionary that will be used when creating a report, profile, etc. can be accessed once you’ve created one of those items.
When a user is in a report/profile/lookup and they need to locate a specific item in the Data Dictionary, they can either scroll down using the scroll bar or they can perform a quick locate.
To perform a quick locate, left click on any item in the Data Dictionary and type the first one or two letters of the field # you are looking for. This will take you to the first occurrence of the field # starting with those letters. Then just scroll down a short way to find the specific entry you’re seeking.
Drag and DropThe Data Dictionary is a list of fields. You will encounter many other lists within TRAVELTRAX. These lists are collections of items created for or by you that you will use repeatedly. To use an item from a list like the Data Dictionary, you simply drag the item from the list and drop it in the appropriate destination window.
Drag-and-Drop procedure: 1. Locate the item.
2. Using your mouse, click on the item.
3. While continuing to hold down the left mouse button, drag the mouse pointer (with item icon attached) to its destination and release the left mouse button. The item will drop into the destination window.
TRAVELTRAX Desktop Reporting Page 39Confidential TRX, Inc.

Profiles
OverviewProfiles are critical when generating reports. Profiles allow you to filter your data so that data for the entire company is not returned. It allows you to give access to only certain subsets of data to certain users (if the client purchased a Web Reporting site) or it allows you to run reports against only certain subsets of data instead data for the entire company.
For example, if you want to run management reports for a specific company, you have to build a profile for that company. If you want to run agency reports for a group of agencies, you have to build a profile and list each of the agencies in the filters.
A Profile can be defined with any field from the Data Dictionary: Client codes (normal), agent sines, passenger names, etc… For the most part, you will probably build profiles with one or more client codes.
Those Profiles assigned with multiple values are considered to be a group. For example, a profile with multiple agent codes assigned to it or a Profile with multiple account numbers assigned is a group because all data is consolidated.
TRAVELTRAX Desktop Reporting Page 40Confidential TRX, Inc.

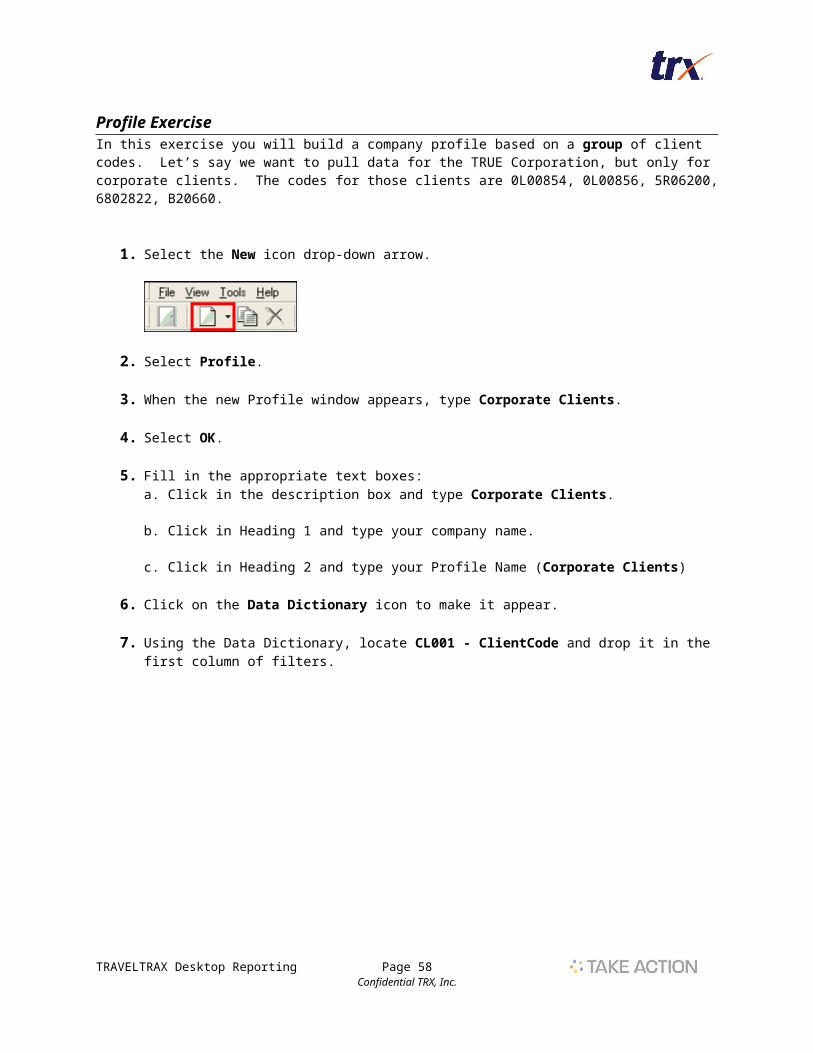
Profile ExerciseIn this exercise you will build a company profile based on a group of client codes. Let’s say we want to pull data for the TRUE Corporation, but only for corporate clients. The codes for those clients are 0L00854, 0L00856, 5R06200, 6802822, B20660.
1. Select the New icon drop-down arrow.
2. Select Profile.
3. When the new Profile window appears, type Corporate Clients.
4. Select OK.
5. Fill in the appropriate text boxes: a. Click in the description box and type Corporate Clients.
b. Click in Heading 1 and type your company name.
c. Click in Heading 2 and type your Profile Name (Corporate Clients)
6. Click on the Data Dictionary icon to make it appear.
7. Using the Data Dictionary, locate CL001 - ClientCode and drop it in the first column of filters.
TRAVELTRAX Desktop Reporting Page 41Confidential TRX, Inc.

Profile Exercise continued
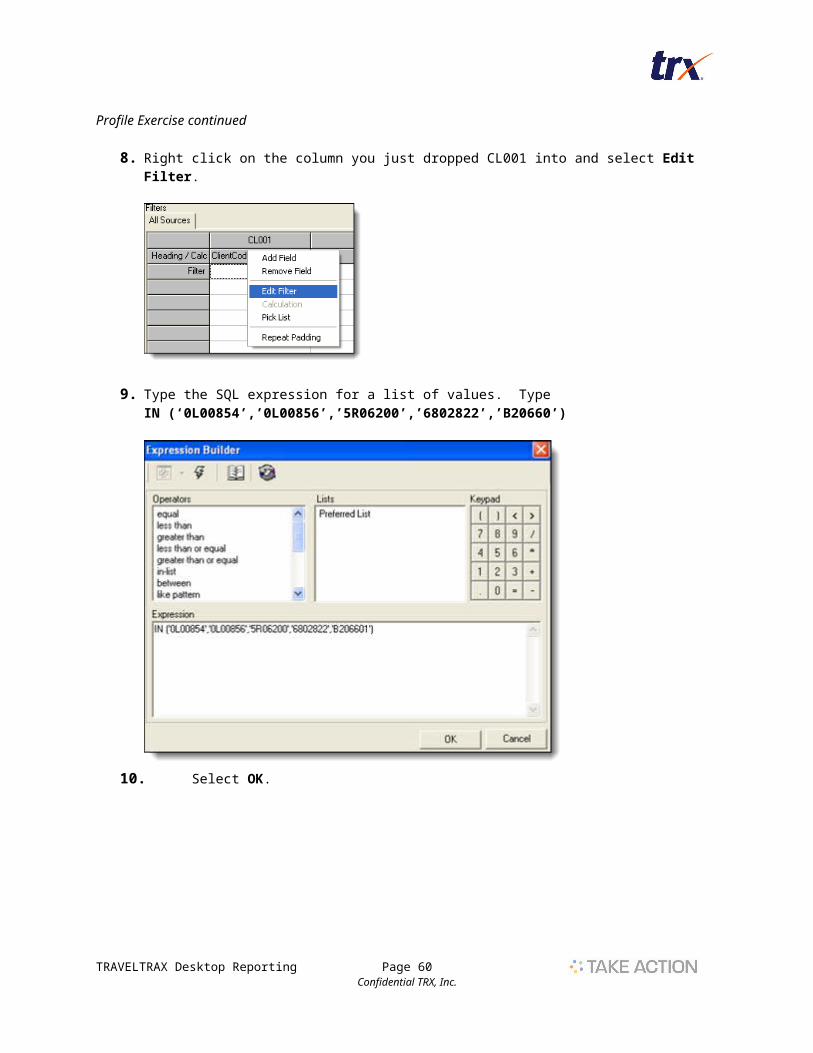
8. Right click on the column you just dropped CL001 into and select Edit Filter.
9. Type the SQL expression for a list of values. Type IN (‘0L00854’,’0L00856’,’5R06200’,’6802822’,’B20660’)
10. Select OK.
TRAVELTRAX Desktop Reporting Page 42Confidential TRX, Inc.

Profile Exercise continued
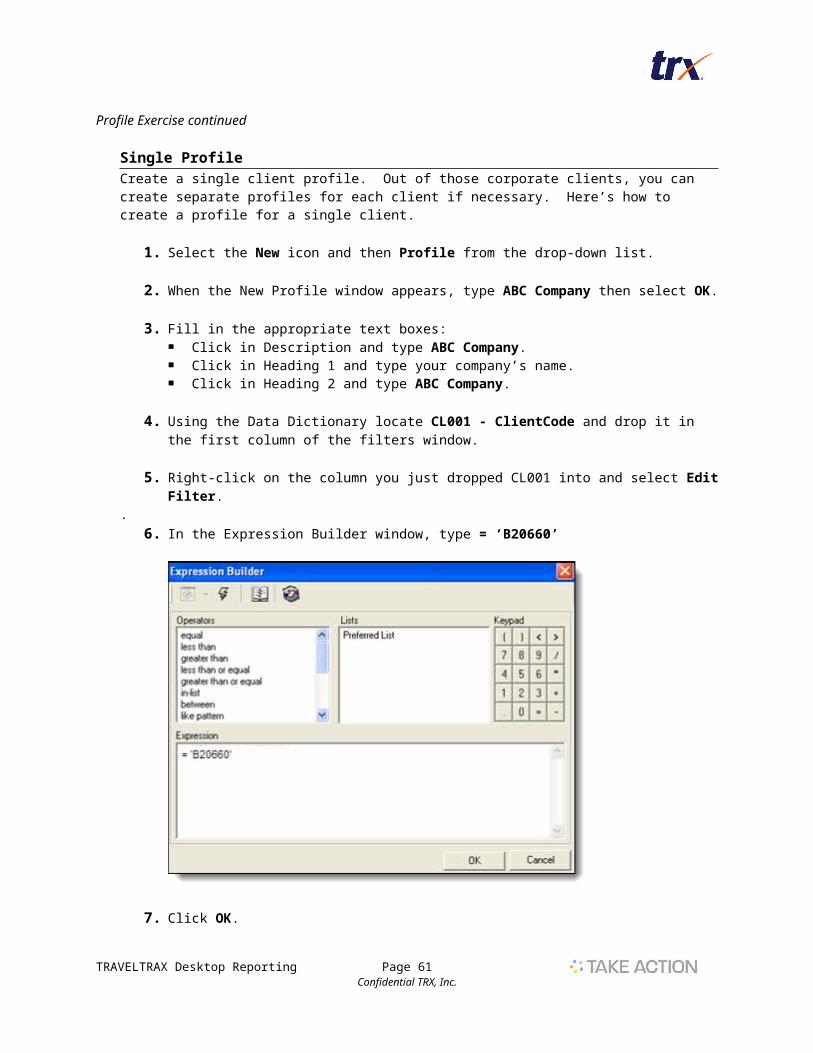
Single ProfileCreate a single client profile. Out of those corporate clients, you can create separate profiles for each client if necessary. Here’s how to create a profile for a single client.
1. Select the New icon and then Profile from the drop-down list.
2. When the New Profile window appears, type ABC Company then select OK.
3. Fill in the appropriate text boxes: Click in Description and type ABC Company. Click in Heading 1 and type your company’s name. Click in Heading 2 and type ABC Company.
4. Using the Data Dictionary locate CL001 - ClientCode and drop it in the first column of the filters window.
5. Right-click on the column you just dropped CL001 into and select Edit Filter. .
6. In the Expression Builder window, type = ‘B20660’
7. Click OK.
TRAVELTRAX Desktop Reporting Page 43Confidential TRX, Inc.

Reports
OverviewIn this section you will learn the process of building custom reports. You will build four reports:
Detail Summary Ranking Summary Ranking.
In each of these reports, you will learn different procedures and techniques important in building any report. The process of learning these reports is progressive. The techniques learned in each successive report are carried over to the next report.
TRAVELTRAX Desktop Reporting Page 44Confidential TRX, Inc.

Report 1 – Detail Report
The first report you will build will be a DETAIL report. A Detail Report will return one row in your report for every row it finds in the Database. It will display selected transaction information at the invoice level. In addition, you will learn to remove voided invoices and you will learn how to select specific vendor types such as airline and rail.
TRAVELTRAX Desktop Reporting Page 45Confidential TRX, Inc.

Report 1 continued
Create Report
1. Select the New icon.
2. Select Report from drop-down menu. The New Report pop-up window appears.
3. Enter a name for the new report: REPORT1
4. Select OK.
TRAVELTRAX Desktop Reporting Page 46Confidential TRX, Inc.

Report 1 continued
Report Properties In the report properties, you will set up the title that is referenced in report headers, what category the report will display under and the description of the report if the customer has purchased a TRAVELTRAX Web Reporting site. When creating your own reports, enter the appropriate title, category and description based on each report. For this training session, use the following:
5. Click on Report then Properties. 6. Add the following information:
Title –Detail Report Category – Air Travel Details Description - Fare comparison by passenger.
7. Select OK.
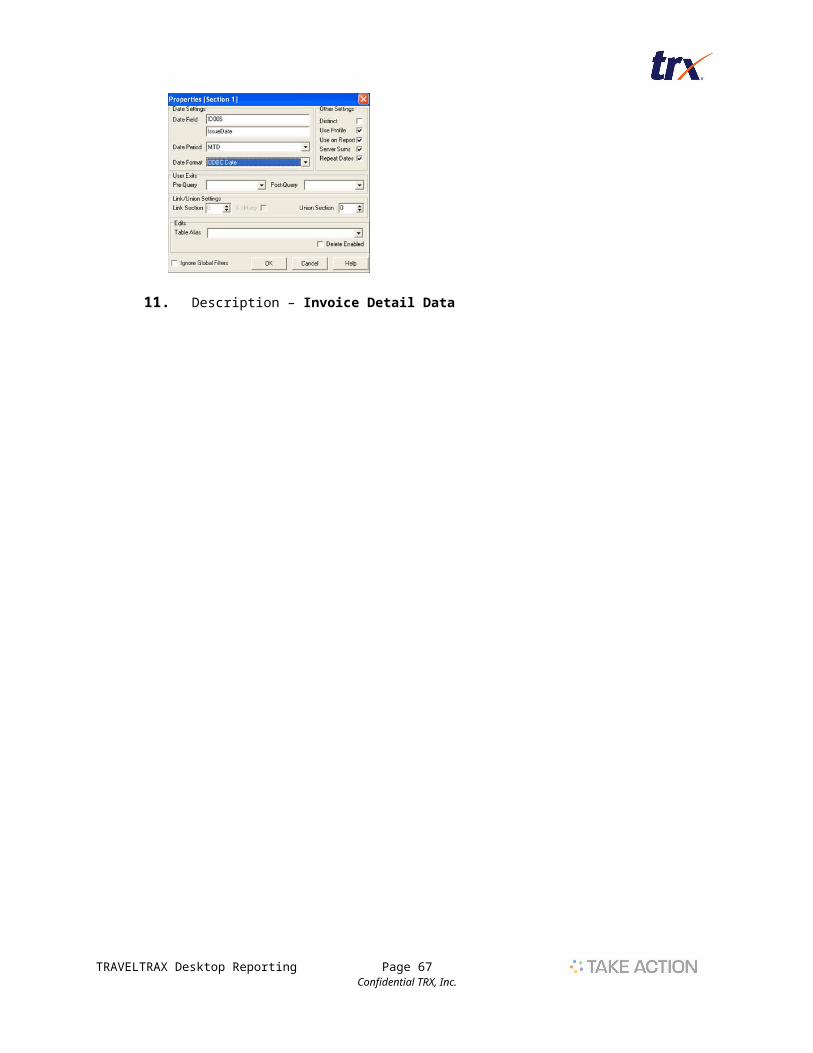
Section Properties Section Properties will set up the date properties, links, unions, etc for each section of a report. Since a report can have more than one section, these properties could possibly be different in different sections.
8. From the menu bar, select Section then Properties.9. Enter the following fields/data:
Date Field – In the data dictionary, find the Issue Date field [ID006]. Drag and Drop it into the Date Field.
Date Period – Using the drop-down arrow, select MTD from the list. Date Format – Select ODBC from the drop-down-list.
10. Select OK.
11. Description – Invoice Detail Data
TRAVELTRAX Desktop Reporting Page 47Confidential TRX, Inc.

Report 1 continued
Report Query Now you will be selecting the data elements you want to see in your report. You will drag and drop fields from the Data Dictionary to the Fields area of your query window.
Query Fields12. Place the following fields in your first seven Query Fields:
ID006 IssueDate ID015 DocumentNumber ID021 Vendor Name ID029 TotalAmt ID035 Full Fare (this may be called something else on your screen) ID033 Low Fare (this may be called something else on your screen) CAL1 Calc$
13. Change the names of the following Field Headings: Change ID015 to Ticket Number Change ID021 to Airline Name Change ID035 to Full Fare Change ID033 to Low Fare Change Calc$ to Amount Saved.
NOTES If you drag a field from the dictionary and place it on top of an existing field in your query, it will push
that field to the right and take its position.
If you want to remove an existing field, right click on it and select Delete Field.
If you want to change the order of fields, click on the field number and drag the column to the right or left.
TRAVELTRAX Desktop Reporting Page 48Confidential TRX, Inc.

Report 1 continued
CalculationsWhen there is no data field in the data dictionary that will return the data you need in a report, you can possibly create a calculation to get that data. You will place a CAL field into the query and assign a value to that calculated field (a value is normally some form of a mathematical function). In this exercise, we want to calculate the Amount Saved. This is accomplished by subtracting the Total Amount from the Full Fare. You must enter a calculation into a CAL field or you will get an SQL error when you run the report.
14. Right click anywhere in the CAL1 column and select Calculation from the pop-up menu.
Expression Builder You will then get the Expression Builder box, you have to enter an SQL statement into the box. (Expression Builder is used when creating calculations or filters.)
15. Locate the Full Fare (ID035) In the Data Dictionary and drag it to the Expression Builder window.
16. Add a minus sign after ID035 with the keyboard or the on-screen keypad.
17. Locate Total Amount (ID029) in the Data Dictionary and drag it to the Expression Builder window and drop it after the minus sign.
18. Select OK to save your work.
TRAVELTRAX Desktop Reporting Page 49Confidential TRX, Inc.
TRAVELTRAX Desktop Reporting Page 50Confidential TRX, Inc.
(ID035)-
Report 1 continued
FiltersThe next step is to filter the data you want displayed on your report. In a standard ticket report, you’ll want to remove voids and select airline and rail tickets only.
Exclude Voids
19. Locate the void indicator (VoidInd - ID007) and drag it to the first column in Filters.
20. Right-click on the field you pasted and select Edit Filter to bring up the Expression Builder.
21. Drag the operator equal to the Expression area.
22. Type ‘N’ (a single quote (an apostrophe), an uppercase N, and another single quote).
23. Select OK to finish.
TRAVELTRAX Desktop Reporting Page 51Confidential TRX, Inc.
=

Report 1 continued
Select Airline and Rail Vendor Types
24. Locate the Vendor Type field (VendorType - ID018) and drag it to the second column of Filters.
25. Right-click on the field you pasted and select Edit Filter to bring up the Expression Builder.
26. Drag the operator in list to the Expression area (or you could just type IN).
27. Click between the parentheses and type: (‘BSP’, ‘NONBSP’) NOTE: If Split Ticketing functionality has been purchased, add the following vendor types as
well: BSPSTP and BSPSTP.
28. Select OK to finish. You have now built the query and established filters. Now, save your work.
29. Select Report and then Save from the menu bar.
TRAVELTRAX Desktop Reporting Page 52Confidential TRX, Inc.
IN (‘BSP’,’NONBSP’)

Report 1 continued
Run ReportWhen you run a report and a design has not been selected, the report output will automatically be XLSDATA, which is raw Excel data. Once you have selected a design type, then the report will automatically run to that design type.
30. Run the report to make sure you receive data. This is a good habit to get into after you create a
report. You don’t want to build a design that may take hours only to find that your data won’t pull up or you used the wrong data fields.
Click the run report icon .
Select the output for the report and select the date range or select a System Date (we’ll only be using Date Range in training).
Click OK. The report will run in Excel (Excel is the default when you have not created a design for your report).
If your report shows data and you think the data is correct, then you can start the design for your report.
TRAVELTRAX Desktop Reporting Page 53Confidential TRX, Inc.

Report 1 continued
DesignThis is where you will design the look of the report. You will select a design type and go into that application to design the look of the report. Desktop Reporting currently uses 5 design types:
Access 2000 Paradox – this will produce a PDF design. Excel – this will produce an Excel design (it is different from the Excel raw data). Xcelcius – this will produce an Excel, interactive dashboard. Flash – this will produce an interactive, dashboard.
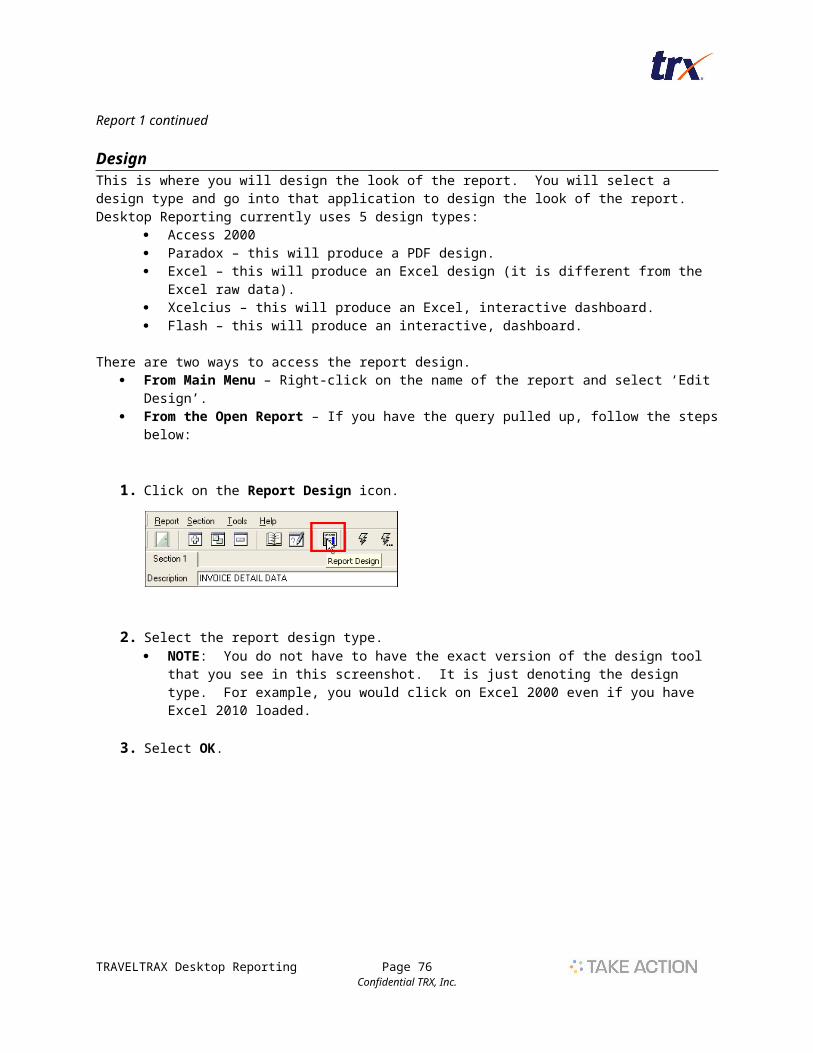
There are two ways to access the report design. From Main Menu – Right-click on the name of the report and select ‘Edit Design’. From the Open Report – If you have the query pulled up, follow the steps below:
1. Click on the Report Design icon.
2. Select the report design type. NOTE: You do not have to have the exact version of the design tool that you see in this
screenshot. It is just denoting the design type. For example, you would click on Excel 2000 even if you have Excel 2010 loaded.
3. Select OK.
TRAVELTRAX Desktop Reporting Page 54Confidential TRX, Inc.

Paradox (PDF) Report DesignParadox is a design tool that will give a PDF design output. Below you will find an overview of the design basics. A good tip to remember is that everything you see within the design is an object and has its own properties. You have to make sure you have the correct object selected when you modify the design or you may be changing something you didn’t mean to change.
BandsBands are Horizontal Bars which appear in the Report Design. There are three default bands:
Report Band – Objects placed here print once at the beginning or ending of a report (header and footer).
Page Band – Objects placed here print once per page (header and footer for each page).
Record Band – This is the body of the report where all the data appears
You can also add a band to the report. This is accomplished through a button called Add Group Band. These bands allow you to break your data into groups.
TRAVELTRAX Desktop Reporting Page 55Confidential TRX, Inc.

Paradox Overview continued
Before we begin to create the design for Report 1, we need to cover some basics. The designer is where you layout the report. You choose fields from the query and put them in the design using a multitude of tools.
These tools are very important for you to learn. If you forget the name of a specific tool, hover your mouse across the button bar (tool icons), and the name of the tool will appear as a hint.
Let’s now define each of the tools you’ll be using in your report design.
Run Report ButtonUse this button to see the report on the screen. After the initial designing of the report, it’s a good idea to generate the report to the screen to see what the design looks like with data in the tables.
Design ButtonAfter viewing the report on the screen, it is possible to change the design if an object needs to be redefined in some way (such as changing the color, size, alignment, etc.).
Use the View Data and Design buttons in conjunction with each other. Generate the report to the screen, select the Design button to modify an object, and then select the View Data button to see how the change affected the report.
Selection ArrowUse the Selection Arrow to select objects in order to manipulate them. After the object is selected, you can size it, move it, and edit it.
Box ToolUse the box tool to make boxes of any size, shape, color, etc. on the report.
Line ToolUse the line tool to draw vertical, horizontal, and diagonal lines of different lengths and widths on the report.
Ellipse ToolUse the Ellipse tool to make circles and ellipses of differing types and sizes.
Text ToolUse the Text Tool to create hard-coded words on the report.
Graphic ToolUse the Graphic Tool to add graphics such as your company logo to the report. You can paste them from the clipboard or bring them in using a graphic file.
TRAVELTRAX Desktop Reporting Page 56Confidential TRX, Inc.

Paradox Overview continued
OLE ToolUse the OLE Tool to add a linked object to the report design.
You can bring in charts and graphs from other software programs.
As the linked object gets updated in the other programs, it will also change in your design.
Field ToolUse the Field Tool to put fields from the Query in the report design. Each Query field is laid out individually using this object.
Table Frame ToolUse the Table Frame Tool to add all of the fields from a section to your report design.
This object allows you to select every field at once (if you wish). When the report is printed, it will appear in a Tabular Format.
Multi-Record ToolUse the Multi-Record Tool to layout repeating values in the report design. The layout is set for one record and then you specify how many times you want the record to repeat down and/or across the page.
Mailing labels are generally laid out using this format.
It is also used quite a bit to put segment data on the design because, if a ticket has more than one segment, you generally want it to repeat down the page.
The Table tool also repeats data down the page. It is not as flexible as the Multi-Record Took because it only repeats down, not across.
Chart ToolUse this tool to show data as a chart or graph in the report design.
Crosstab ToolUse the Crosstab Tool to show your data in a spreadsheet like format.
Add Group Band ToolUse this tool to break your data into groups.
Data ModelUse the Data Model to show what tables are included in the design and to show a diagram of the relationships between those tables.
TRAVELTRAX Desktop Reporting Page 57Confidential TRX, Inc.
Paradox Overview continued
Using Tools Click on the tool you want to use.
Drag the mouse into the report and create the design you need from that tool.
PracticeUse the appropriate tools to create a box, a circle, text, and two fields.
Objects Every item in the design is considered an object: Tables, Fields, Lines, Text, Graphs, etc.
Select an object by clicking on the Selection Arrow icon on the toolbar.
Click on the object in the report. The selected object(s) will have little black boxes called Handles around them.
To perform the same task to many objects at one time (i.e. change font sizes, align fields, change field sizes, etc.), you can select multiple objects at one time. There are many ways to select multiple objects.
o Select the first object, hold down the Shift Key and click on the other object(s) you want to select.
o Select the Band which holds the objects to be selected. Then, select the Edit option on the Text Bar, then select Select-All. All objects in the highlighted band will be selected. Rest your mouse to the left of all objects to be chosen, hold down the left mouse button, hold down the Shift Key, and draw a box around the chosen objects.
Every object in the design has a name. You can determine whether you have the right object selected by looking at the bottom right corner of the screen that shows the Status Bar (see callout box under screenshot above) after you select it. The name also appears when you inspect an object. The name becomes important when formulas are defined in the design.
TRAVELTRAX Desktop Reporting Page 58Confidential TRX, Inc.
StatusBar

Paradox Overview continued
ContainershipContainership has to do with the way objects interact with one another. As we stated before, every item on a report is an object. You can have objects within objects (this is where Containership comes into being). If you have one object within another object, the surrounding object by default contains the inner object.
If one object is contained within another, you must click multiple times in order to get to the inner object. For example, you could have a Box, an Ellipse, and a line on the report. If the Line is within the Ellipse, which is within the Box, the Box could contain both the Ellipse and the Line, while the Ellipse could contain the Line. In order to select the Line, you need to point at the line and click three times.
While Containership is turned on, when the Box moves, the Ellipse and Line also move.
You can turn Containership off. You do this by Inspecting (right-clicking) on the Box, selecting Properties, Design, and Left-Clicking on Contain Objects. The option is selected if there is a Checkmark out beside in it.
If we turn Containership off the Box, but leave it on the Ellipse, we can move the Box without moving the Ellipse and the Line, but we can’t move the Ellipse without moving the Line.
As another example, a table is an object in the design. Within the table, you have the Record (which is a row) and within the Record, you have a Field. In order to get to the Field, you need to point the mouse at it and then click once to select the table, again to select the record, and again to select the field.
You must be aware of which object is selected when laying out the report design.
TRAVELTRAX Desktop Reporting Page 59Confidential TRX, Inc.
Paradox Overview continued
Containership Practice 1. Draw a large Box in the record band.
2. Draw an Ellipse inside the Box - By default, the Box will contain the Ellipse.
3. Draw a Line inside the Ellipse - By default, the line will have the handles.
4. Press [Esc]. - The Ellipse is selected.
5. Press [Esc] again. - The Box is selected.
6. Pressing [Esc] - Moves you back one level.
7. With handles around the Box, move the Box with the arrows of the Keyboard. The Ellipse and the Line move with it (containership).
8. Select the Ellipse - You know you have selected it by seeing handles on it and by seeing Ellipse in the status bar.
9. Move the Ellipse with the keyboard arrows the Ellipse and Line move but not the Box.
10. Select the Box.
11. Right-click the mouse to inspect the box.
12. Select Properties, Design from the menu.
13. Click on Contain Objects to remove the check mark. (No � = Turned Off)
14. Move the Box. Notice that the Ellipse and Line do not move.
TRAVELTRAX Desktop Reporting Page 60Confidential TRX, Inc.
Paradox Overview continued
Data ModelThe Data Model contains the query information, the date information, and some profile information. It will always have at least 3 tables listed on the right hand side of the screen:
Sec1.db -You have to have at least one section for each report. If you rest your mouse on this field and right-click, a list of all the fields from Section one will be displayed. You can choose these fields and add them to the report design. If your report contains more than one section, you will have one field for each section in the data model. For example, if you have 3 sections in your report, you will see Sect1.db, Sect2.db, and Sect3.db.
Sect1dt.db -This table is added to the design when you click on the Check Box beside the Reporting Period. The fields in this table are the Beg Date, End Date, and the Date Range. This table enables you to put date ranges in the design. If you have 3 sections to a report, with an X in this Check Box on all three sections, you will have Sect1dt.db, Sect2dt.db, and Sect3dt.db in the Data Model. Remember, Section One must be selected. The others are optional.
Rpthdng.db – This is a table that TRAVELTRAX automatically adds to the Data Model. It allows you to put fields such as the Client Code, Client Name, Address Info, and Prompts in the report design.
TRAVELTRAX Desktop Reporting Page 61Confidential TRX, Inc.

Paradox Overview continued
FormulasA formula is a calculation that is defined in the design.
PropertiesProperties are selections which can be defined for all objects in the design. Some properties are the font size, color, font style, word wrap, format, etc... Properties affect the way the data looks when the report is printed.
Activate Property Menu Right-click on an object (or objects – if you want to do the same thing to multiple objects). Using
the right mouse button means to Inspect an object.
Select Properties.
Select the properties needed for that object to make it look the way you’d like it to look.
TRAVELTRAX Desktop Reporting Page 62Confidential TRX, Inc.

Profiles Unless you assign a report to a profile, it will not display on a Web Reporting site. There are two ways to assign a report to a profile:
1. Open a profile – You can open a profile and assign all the necessary reports to that profile. Use this option when you’ve created a new profile & need to assign several reports to it.
2. Right-click & Assign To – You can right-click on a report & Assign To the correct profile(s). Use this option when you’ve created a new report & you need to assign it to several profiles.
Assign Report1 to all your profiles.
1. Click the View profile button.
2. Find the Corporate Client Profile and open it.
3. Click on the Report List tab
4. Assign Report1 to this profile and save.
5. From the Main Menu, right-click on Report1 and select Assign To.
6. Assign this report to the Agencies profile.
TRAVELTRAX Desktop Reporting Page 63Confidential TRX, Inc.

Report 2 – Summary Report
Report two is a summary report. A summary report will summarize data instead of returning each result separately. In this example, it will display the total car cost and the average daily rate per car company instead of showing each car reservation and its cost. We will be filtering the data to remove voided car invoices.
TRAVELTRAX Desktop Reporting Page 64Confidential TRX, Inc.

Report 2 continued
Create Report
1. Select the New icon and select Report from drop down menu.
2. Enter name for new report: REPORT2.
3. Select OK. The Report Properties window will appear.
Report Properties
4. Add the report properties. Title – Summary Report. Category – Car Description – Car agency comparison.
5. Select OK when finished.
TRAVELTRAX Desktop Reporting Page 65Confidential TRX, Inc.

Report 2 continued
Section PropertiesYou can either click on Section, and then Properties on the menu bar or you can add the information in the Date Settings section (see screenshot below). The instructions below follow the Sections from the menu bar.
6. Add the section properties by clicking on Sections from the menu bar, then Properties. Date Field – (CAR007) In the Data Dictionary, scroll down until you find the car issue date
then drag and drop it into the Date field space. Date Period – Using the drop-down-arrow, select MTD from the available list. Date Format – Select ODBC from the drop-down-list.
7. Select OK.
8. Add the section description. Type in Car Data.
Report Query Now we’re going to add the data fields to the query. If the data dictionary is not already displayed, click
on the Data Dictionary icon.
Query Fields
1. Drag the following fields you want displayed in your report from the Data Dictionary into the FIELDS position of your DART Query window:
CAR015 – Chain Code CAL2 – Calc Number CAL2 – Calc Number CAL2 – Calc Number
2. Click in the field heading of each column and rename the field headings as follows: CAR15 – Chain Code CAL2 – Car Days CAL2 – Total Car Cost CAL2 – Avg Daily Rate
TRAVELTRAX Desktop Reporting Page 66Confidential TRX, Inc.
Report 2 continued
Summary Types In all queries that return summarized data, any field that returns a number must have a Summary Type assigned.
3. Right click anywhere in the Car Days column and select Summary Type. 4. Select Sum from the pop-up menu.
5. Repeat for Total Car Cost.
6. For Avg Daily Rate, select summary type Weighted. A weighted average is when all units are valued according to the percentage of the total
they represent, not the total number of units.
Example: Four people get on a scale. To calculate the weighted average, each person is responsible for their own weight, not the total weight divided by four.
RESULTS
TRAVELTRAX Desktop Reporting Page 67Confidential TRX, Inc.

Report 2 continued
CalculationsSince you now have three undefined Calc Fields in your query, you’ll need to add calculations to those fields to make them valid.
7. Right-click anywhere in the Car Days column and select Calculation from the pop-up menu.
8. The calculation you will be building multiplies the Number of Cars [CAR024] rented by the Number of Days [CAR023] those cars were rented.
9. Repeat the process for the Total Car Cost. The Calculation should be the number of days times the number of cars, times the car daily rate. [CAR023]*[CAR024]*[CAR027].
TRAVELTRAX Desktop Reporting Page 68Confidential TRX, Inc.

Report 2 continued
When you need to build a calculation that will be based on the results that come back after a query runs, you have to use the Section Field Names button to build the calculation. This will be built using Java instead of SQL.
10. For the Average Daily Rate, right-click anywhere in the Avg Daily Rate column and select Calculation.
11. When the Expression Builder displays, select the Section Field Names button . 12. Choose 003 – Total Car Cost and drag it into the Expression window.13. Add a divide symbol /.14. Then choose 002 – Car Days. This expression divides the value of query field 3 by the value of
query field 2.
15. Select the Calculation Type drop-down arrow and select JavaScript if it has not defaulted to that calculation type.
16. Select OK to close the Expression Builder.
TRAVELTRAX Desktop Reporting Page 69Confidential TRX, Inc.

Report 2 continued
FiltersThe next step is to filter out (exclude) voided car invoices.
17. Locate CAR008 (VoidInd) and drag it to the first column in Filters.
18. Right-click on the field you dropped it in and select Edit Filter to bring up the Expression Builder.
19. Type the word equal in the Expression area.
20. Type a single quote (apostrophe), an uppercase N, and close with another single quote. ‘N’
21. Select OK to finish. You have now built the query and established filters.
22. Now, save your work by selecting Report from the menu bar and Save from the drop-down menu.
23. Run the report with your ABC profile.
24. Add a prompt for a specific car chain code(s). Drag CAR015 into the filter section. Edit filter and enter IN (’~{Car Chain Code}’)
25. Save and run the report again. Enter ZI, ZE when prompted for the car chain.
TRAVELTRAX Desktop Reporting Page 70Confidential TRX, Inc.

Report 2 continued
Profiles You can assign profiles to reports 2 different ways. You can assign the reports by opening the profile and selecting the reports or you can right-click on the report from the main menu and select Assign To.
Assign Report2 to all your profiles.
7. Select your Corporate Clients’ Profile from the main menu.
8. Assign Report2 to this profile and save.
9. From the Main Menu, right-click on Report2 and select Assign To.
10. Assign this report to the Agencies profile.
TRAVELTRAX Desktop Reporting Page 71Confidential TRX, Inc.

Report 3 – Ranking ReportReport three is a ranking report. A ranking report, by default, is a summary type report. You will learn how to rank data and you will learn about the properties associated with ranking. This report example will display the top 10 City Pairs based on segment values, filtering the data to remove voided invoices for airline and rail tickets only.
TRAVELTRAX Desktop Reporting Page 72Confidential TRX, Inc.

Create ReportIn this section, you’ll be creating a new report file. You will create the report properties and the section properties as well as add a section description.
1. Create a new report. Select the New icon from main menu. Select Report from the drop down menu. A pop-up window appears. Enter REPORT3 for the name of the report. Select OK.
2. Enter Report Property information. Click on Report from the menu bar then on Properties. Title – Ranking Report Category – Air Travel Description – Top 10 City Pair Ranking Select OK.
3. Enter Section Property information. Click on Section from the menu bar. Select Properties. Date Field – TS015 Date Period – MTD Date Format – ODBC Select OK.
4. Enter City Pairs in the Description text box type.
TRAVELTRAX Desktop Reporting Page 73Confidential TRX, Inc.

Report 3 Continued
Report QueryIn this section, you’ll be creating the query for the report. You’ll be adding data fields and you’ll be creating calculations for text fields as well as fields that will count the number of transactions. For this report example, we need the top 10 city pairs based on the number of segments.
1. Add Data Fields – Drag the fields you want displayed in your report from the Data Dictionary in the Fields position of your DART Query window.
CAL4 – CALC TEXT CAL2 – Calc Number TS030 – SegSegmentValue
2. Change Field Headings – Click in the Field Heading of each column and rename the fields as follows:
CAL4 – City Pair CAL2 – Num of Segments TS030 – Segment Value
3. Designate Summary Types – Remember, in all queries that return summarized data, any field that returns a number must have a Summary Type assigned.
Right-click anywhere in the Num Segments column and select the Summary Type of Sum.
Repeat for Segment Value.
TRAVELTRAX Desktop Reporting Page 74Confidential TRX, Inc.

Report 3 Continued
RankingIf you want to Rank any information in a report (Example: Top 10 city pairs), you need to add a field called RANK to the left of the data field you want ranked. In the Tree view, you can find the Rank field in the Calc table. If you’re in the List view, you can just type in R and it will bring you to the Rank field.
For this report, we want the Top 10 city pairs based on the number of segments.
4. Add the Rank Field – Drag the Rank field from the Data Dictionary and drop it on top of the City Pair field. This will put it before (to the left of) the City Pair field and automatically display the Ranking box.
5. Add Ranking information – Add the following information for this report: Rank Type – Top Item Limit – 10 items Rank by Value – Number of Segments.
6. Designate the Data Field to rank – The system doesn’t know which data field to rank. You have to assign the field by doing the following:
Right-click in the City Pair field. Select Rank. This will display the level of ranking in the Rank Name section.
TRAVELTRAX Desktop Reporting Page 75Confidential TRX, Inc.
Report 3 Continued
7. Add Calculations to the report – In this report, we’ll have two calculated fields.
a) City Pairs – We want the city pairs using the city name, not the code. The calculation you will be building is a SQL statement that will be adding together the Origin City Name and the Destination City Name. [TS009]'+-'+[TS026].
Right click in City Pairs column. Select Calculation. Locate the origin city [TS009] in the Data Dictionary and drag and drop it into the
calculation field. Add a dash in between the cities. Do this by typing a plus sign, single parenthesis, dash,
single parenthesis, plus sign. +’-‘+ Locate the destination city [TS026] and drag and drop it into the calculation after the last
plus sign.
b) Number of Segments Right-click anywhere in the Num Segments column. Select Calculation from the pop-up menu. The calculation you will be building is how we count items in TRAVELTRAX. Type a 1 in the Expression window. That’s it.
8. Add Filters – For this report, add a filter so that no voids are returned and that we’re only getting segment information from airline and train tickets. Click and drag the following data fields to the filter section.
ID007 (Issue Date) – Right click and Edit Filter
ID018 (Vendor Type) – Right click and Edit Filter
9. Save your work.
TRAVELTRAX Desktop Reporting Page 76Confidential TRX, Inc.
(TS009)+’-‘+(TS026)
IN (‘BSP’,’BSPSTP’,’NONBSP’,’NONBSPSTP’)
= ‘N’

Report 4 – Multi-level Ranking ReportReport 4 is a multi-level ranking report. When ranking more than one data field, it is important to put those data fields in the correct order so the ranking will also be done in the correct order. For this sample report, we want the top 10 airlines for the top 5 travelers, so we need the system to rank the top 5 travelers first and then rank the top 10 airlines that those top 5 travelers use. We will filter the data to remove voided invoices for airline and rail tickets only.
TRAVELTRAX Desktop Reporting Page 77Confidential TRX, Inc.

Create ReportIn this section, we’ll create the new report file, add the report properties, add the section properties, and enter the section description.
1. Create a new report. Select the New icon from main menu. Select Report from the drop down menu. A pop-up window appears. Enter REPORT4 for the name of the report. Select OK.
2. Enter Report Property Information Click on Report from the menu bar. Click on Properties. Title – Top 5 Airlines Category – Air Travel Description – Top 5 Airlines for the Top 10 Travelers Select OK.
3. Enter Section Property Information. Click on Section from the menu bar. Select Properties. Date Field – ID006 Date Period – MTD Date Format – ODBC Select OK.
4. Enter the Section Description as Top 5 Travelers/Top 10 Airlines.
TRAVELTRAX Desktop Reporting Page 78Confidential TRX, Inc.

Report 4 continued
Report Query In this section, you’ll be adding the data fields which will create the query for this report. Think about the information you’re trying to get out of this report (in our example, we’re looking for the Top 10 Airlines for the Top 5 Travelers). Once you determine the results you need, then you’ll be able to determine what data table to go into for that information.
1. Enter the following data fields: CAL04 – Passenger Name (Last/First calculated field) – Rename it Passenger Name
Vendor Name – Rename it Airline Name Total Amount – Rename it Amount Calc Number – Rename it Bookings
2. Add the Summary Types – Add Sum for Amount and Bookings.
3. Rank the top 5 Travelers (passengers) and the top 10 Airlines. a. Passenger Name
Select the Rank field and drag it on top of the Passenger Name column. We want the Top 3 passengers based on Bookings.
Rename the Rank field heading to Top 3 Clients. Set your Client column to Rank (right-click in the column Traveler column and select
Rank).
b. Airlines Select the Rank field and drag it on top of the Airline column. We want the Top 5 airlines
based on Amount. Rename the Rank field heading to Top 5 Airlines. Set your Airline column to Rank (right-click in the Airline column and select Rank).
4. Add calculations – We need the number of bookings. Right-click in the Booking column. Select Calculation. Enter a 1 as the calculation – this will add a 1 every time a specific traveler and airline is
found in the data, thereby counting the number of bookings.
5. Add any necessary filters – We do not want voided transactions and we only want airline and rail tickets. Click and drag the following data fields to the filter section.
ID007 (Issue Date) – Right click and Edit Filter
ID018 (Vendor Type) – Right click and Edit Filter
6. Save your work.
TRAVELTRAX Desktop Reporting Page 79Confidential TRX, Inc.
IN (‘BSP’,’BSPSTP’,’NONBSP’,’NONBSPSTP’)
= ‘N’
HINT: If you haven’t set up your summary types before doing your ranking, you will not see any options under the Rank by Value box.

Customization
Calculations To create a calculation that will be saved in the Data Dictionary for each client:
1. Click on the Data Dictionary icon.
2. In the left column under Data Dictionary, click on Calculations.
3. Then, right-click on Calculations and select New Calculations.
4. Complete the New Calculation window. Field number – Default is the next number available but can be changed to anything you
want. It has to start with CAL. Field name – Name the field so people know what data will be returned. Field heading – Enter the heading you want displayed for this data field. Type – select the type of field this will be (see User Guide for type descriptions). Length – Enter the maximum length you want for this field. Calculation – Enter the calculation by typing it in the box or clicking on the button to open the
Expression Builder window.
TRAVELTRAX Desktop Reporting Page 80Confidential TRX, Inc.
Expression Builder Icon

Filter AssistIf you use the same filters over and over again in reports, you may want to put them into the Filter Assist so you don’t have to create them for each report.
1. You have to add the filters to your query page and enter the SQL statements.
2. Click on the Filter Assist button . It will display the box on the left, below.
3. To enter an entire row of filters (if you want to add multiple filters at one time) click at the beginning of the row where you see the word ‘Filter’ and you drag that into the left box called Rows.
4. To enter each filter separately, click on the name of the data field and drag it into the Columns box. The filters are then ready to use.
To Use the filters in Filter AssistOnce the filters are in Filter Assist, they can be used by anyone in that particular company that has access to TRAVELTRAX Desktop Reporting. To enter a filter that exists in Filter Assist, click on the filter (or row of filters) you need to add and drag & drop it into the filter field.
TRAVELTRAX Desktop Reporting Page 81Confidential TRX, Inc.

Reporting Periods This screen contains the master Reporting Periods for TRAVELTRAX. Batch Generator uses these reporting periods when you generate reports.
1. Click on Tools2. Select Reporting Periods
Category Editor
Use this screen to add, copy, or delete categories. You can create categories for both Profiles and Reports. Select Profiles or Reports from the Category Type drop-down list before you add, copy, or delete a category.
1. Click on Tools2. Select Category Editor
TRAVELTRAX Desktop Reporting Page 82Confidential TRX, Inc.
Add Delete
Copy
LookupsThe Lookup option allows you to build a new field based on an existing field in the Data Dictionary. One reason to do this is to provide meaning to coded fields within your database.
For example, the Domestic/International field could have the following codes: D, I, T, and F. If you want to see the words Domestic and International instead of the codes, you would build a Lookup. The code D would be set up to be Domestic and the codes I, T, and F would be set up to be International.
Building a Lookup ExerciseIn this exercise you will build a Lookup (table) on the International Indicator (IND025). When you’re finished, you’ll be able to display the words Domestic and International in your reports just as easily but with more meaning than the D and I that reside in your database.
1. Select the New icon, and then Lookup from the drop-down list.
2. Using the drop-down-list, select the Alias associated to your database (usually TMAN).
3. In Lookup Name text box, type DOMINT.
4. Add a description: International Indicator.
5. Select OK.
TRAVELTRAX Desktop Reporting Page 83Confidential TRX, Inc.

Building a Lookup continued
6. Drag ID025 - InternationalInd to the left window.
7. Click the Add values for the topmost field icon.
Add Values to Lookup By selecting load values, you will retrieve a distinct list of values from the database that define the International Indicator. (A blank row can also be a value.)
8. Complete the Text column with D for Domestic and I for International.
9. Select OK.
TRAVELTRAX Desktop Reporting Page 84Confidential TRX, Inc.

Building a Lookup continued
Completed Lookup Your Lookup window should now look like the figure below.
10. Select the Exit Lookups icon to save your work and to return to the Main Menu.
TRAVELTRAX Desktop Reporting Page 85Confidential TRX, Inc.
Lists This option allows you to build a list of data that can be used to build SQL expressions. Lists can be used anywhere you enter a SQL expression such as Calculations or Filters in reports or in profiles. Please see the steps below to create a new list.
Build a List Exercise
1. Select the New icon (or File – New ) and select List.
2. Enter the name of the list (example: Preferred Airlines).
3. Enter a description of the list.
TRAVELTRAX Desktop Reporting Page 86Confidential TRX, Inc.

Build a List continued
4. Click the Add Value button and enter one value. Repeat this step for every value that needs to be added.
5. When the list is complete, either click on List – Save, or click on the Exit List Editor button and it will prompt the user to save the list.
How to Use a ListTo use the list, either within a calculation or a filter, you will have the Expression Builder box open. Enter the other parts of the SQL statement and then click on the name of the list and drag it into the expression box.
Reminder: You still have to create the rest of the SQL statement in the expression box. When you use a list, you’re just inserting that list into your SQL statement instead of having to type it out manually.
TRAVELTRAX Desktop Reporting Page 87Confidential TRX, Inc.
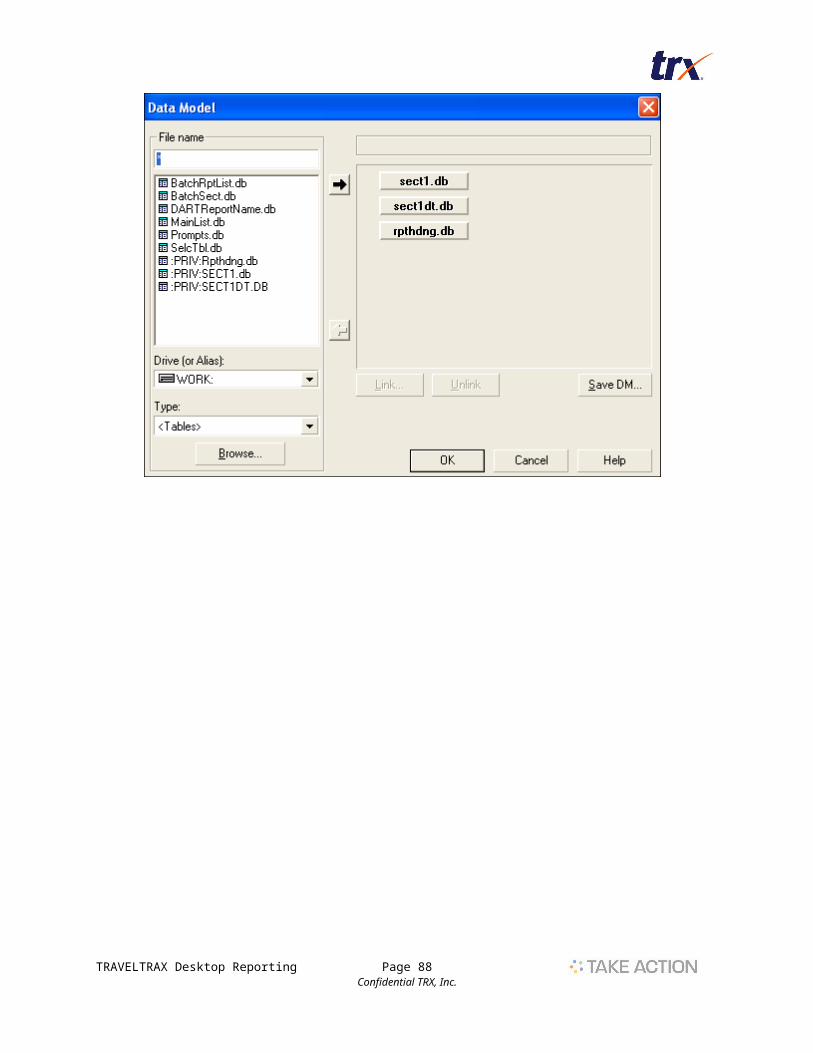
Troubleshooting and Tips
Export You can export any object so that it can be transferred to someone else’s TRAVELTRAX, or to create a back-up copy of reports, profiles, batches, etc.
1. From the main menu, choose Tools.
2. Select Export to XML or Export to Paradox.
3. Select the type of object to be exported. You can also Select All to choose all objects.
4. Choose the item(s) to be exported.
5. Select the Export button. It will prompt you to choose a directory.
Export Reports Screen
TRAVELTRAX Desktop Reporting Page 88Confidential TRX, Inc.

Import Choose this option to Import TRAVELTRAX Reports, Profiles, Batches, etc. that were exported from your or another person’s copy of TRAVELTRAX. You must select the directory where the files are located before you can begin the import process.
TRAVELTRAX Desktop Reporting Page 89Confidential TRX, Inc.

Linking Reports
With multi-section reports, sections may have data from different tables in the database or data from the same table for different time periods. For PDF (Paradox) designed reports, linking is necessary in order to display this data in a meaningful format. For other report designs, the data may have to be put in different sections, but the fields don’t have to be linked. You would have to create code in the other design tools to get the data to display correctly.
Example: Suppose you wanted to produce a report that displayed a list of passengers, the amount of their tickets, and the air segments they flew. If you put both ticket information and segment information in the same section (they are in different tables), you would get a report that duplicated the ticket price for each segment the passenger flew. Also, if there was a passenger with no segment information, the passenger would not display even though he existed in the ticket table. (This is a function of relational databases.)
If you put ticket information in the first section and segment information in the second section, you would get a report that made no sense. Passenger names and ticket prices would be displayed independent of segment information. You would have a hard time determining which segment information went with which passenger.
To solve these problems a linking report needs to be created. Section one would contain ticket information and section two would contain air segment information. Section two would then be linked to section one. The specific procedures will be shown later.
TRAVELTRAX Desktop Reporting Page 90Confidential TRX, Inc.

One to Many Link OverviewA One to Many Link should be used when the linked sections’ result tables do not match (e.g. when there are multiple segments for each ticket).
If these sections were not linked, you would have two separate tables on the report showing separate sets of data. Each table could be a different size. Because passengers generally have multiple segments on one ticket, the section 2 table would be bigger than section 1 and individual segments would probably not be on the same line as the ticket record for each passenger.
TRAVELTRAX Desktop Reporting Page 91Confidential TRX, Inc.

Report 5In this report, we are going to create a report with two sections. The first section will hold the ticket data and the second section will hold the segment data. We need to link these sections by specific data fields. In this example, we will link them by the Primary Keys (RecordKey, IataNum, SeqNum).
Linking is a 2 step process. You need to tell the system what section to link to and then what data field(s) to link by.
1. Create a new report and name it REPORT5.
2. Report Properties Title – TICKET DATA Category – Air Travel Description – One to Many link report
3. Section Properties – Enter the following: Date Field – ID006 Date Period – Monthly Date Format – ODBC Date
4. Enter the following data fields in section 1. ID001 – Record Key ID002 – IataNum ID003 - SeqNum ID015 – Ticket Number ID006 – Issue Date CAL4 – Passenger Name
Right-click and create a calculation ID011+’/’+ID010
ID029 – Ticket Amount
5. Add Global Filters – No voids and airline and rail tickets only. Global Filters – When there is more than one section, filters can be added to each
section separately or the user can click on Global and add a filter that will apply to each section in the report.
Ignore Global Filters – In section properties, when this check-box is checked, the system will ignore the global filters for that section only.
6. Add a new section to the report by click on Section – New.
TRAVELTRAX Desktop Reporting Page 92Confidential TRX, Inc.

Report 5 continued
7. Enter the following properties for Section 2 Date Field: TS008 – IssueDate Date Period: MONTHLY Date Format: ODBC Date Link: Enter a 1 in the Link Section to link this section back to section 1. Relationship: Enter a checkmark in 1>Many.
8. Add the section Description of Segment Data.
9. Place the following data fields in the Section 2 Query: TS001 – Record Key TS002 – IataNum TS003 – SeqNum TS009 – Origin City Code TS026 – Segment Destination City Code TS015 – Departure Date
TRAVELTRAX Desktop Reporting Page 93Confidential TRX, Inc.

Report 5 continued
10. Link each primary key in section 2 to the primary keys in section 1.
a) Right-click on Record Key and select Properties.b) Link by – Click the drop-down and select RecordKey.c) Follow the same steps for IataNum and SeqNum. (IataNum to IataNum, SeqNum to
SeqNum)d) Click OK. This completes the link process within query fields.
11. Run the report with the ABC Corporation profile. In Excel, there will be one tab for each section of a report. The linking we did will not do
anything and would not need to be done if the design were to be created in Excel. Instead, code must be written to link the fields together.
TRAVELTRAX Desktop Reporting Page 94Confidential TRX, Inc.
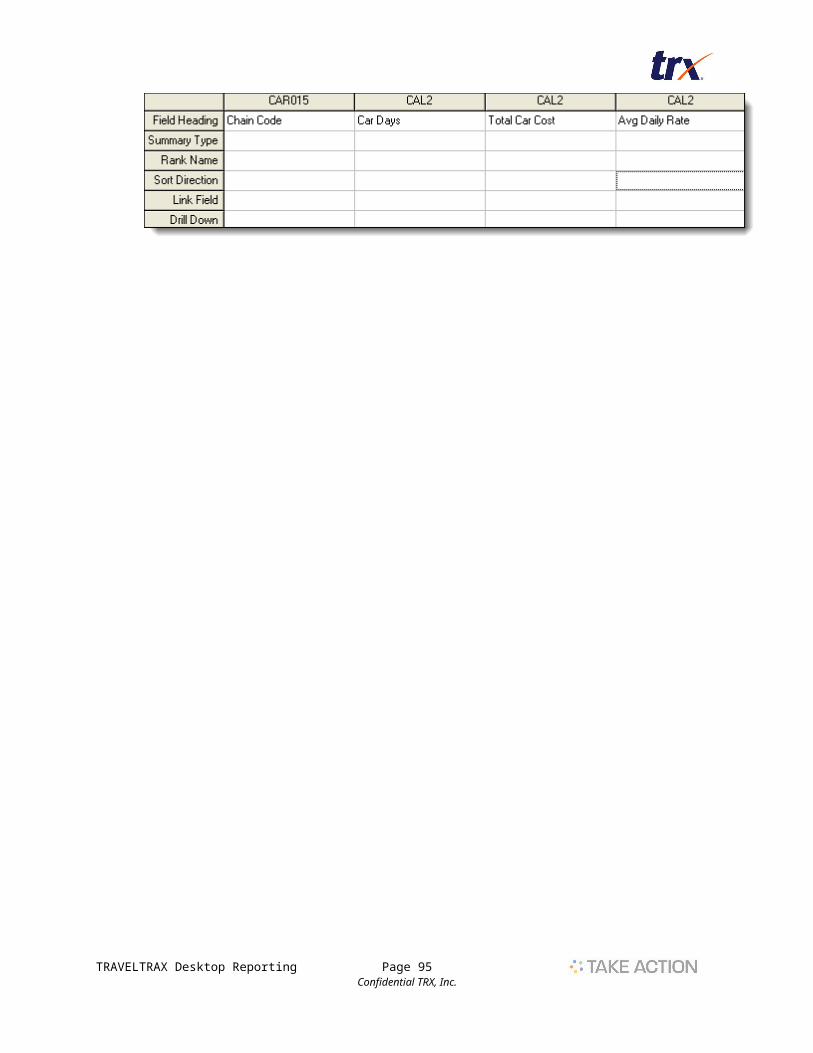
Report 6The objective of this report will be to combine the features of Linking with Summary Ranking using the one-to-many linking concept.
1. Start a new report and name it REPORT6
2. Add Report Properties Title – Client Data Category – Air Travel Description – One to many link and ranking report
3. Add Section Properties Date – Issue Date (ID006) Date Period – Monthly Date Format – ODBC Date
4. Add the section description – Ticket Information.
5. Add the data fields CL001 – Client Code ID029 – Ticket Amount – Set the summary type to Sum.
6. Add the filters No Voids Air and Rail only
7. Rank the Top 10 Client Codes by Total Amount. Drag and drop the Rank field into the query field section before the Client Code column. Rank the Top 10 Client Codes by Total Amount.
TRAVELTRAX Desktop Reporting Page 95Confidential TRX, Inc.

Report 6 continued
8. Insert a new section.
9. Add Section Properties for section 2. Date – Departure Date (TS015) Date Period – Monthly Date Format – ODBC Date Link to section one – one to many link
10. Add the section description – Segment Information.
11. Add the data fields CL001 – Client Code TS010 – Segment carrier code TS030 – Segment value: Set the summary type to Sum.
12. Add the Filters No Voids Air and Rail only
13. Link Section 2 by the Client Code Right-click and select Properties Link by Client Code
14. Rank the Top 10 Segment Carriers by Segment Value.
15. Save
16. Run the report with the ABC Corporation profile.
.
TRAVELTRAX Desktop Reporting Page 96Confidential TRX, Inc.

One to One Link OverviewA One to One Link should be used when the results from the linked sections match row by row. If you are ever in doubt that a link is a one to one versus a one to many, always select one to many.
In the example below, Section 2 and 3 are linking back to section 1. Section 1 is the Master Table. Sections 2 and 3 are matching their records back to section 1. One result field from section 1 links to one result field in section 2 and one result field in section 3.
This type of linking allows the data from each section to be put in one table in the PDF report design.
TRAVELTRAX Desktop Reporting Page 97Confidential TRX, Inc.
O n e t o O n e L i n k
S e c t i o n 1 S e c t i o n 2 S e c t i o n 3T i c k e t I n f o R e f u n d s E x c h a n g e sR e s u l t T a b l e R e s u l t T a b l e R e s u l t T a b l e
P a s s e n g e r T o t a l $
S m i t h $ 5 0 0 . 0 0
J o n e s $ 3 0 0 . 0 0
B l a c k $ 4 0 0 . 0 0
P a s s e n g e r T o t a l $
S m i t h $ 2 0 0 . 0 0
J o n e s $ 1 0 0 . 0 0
B l a c k $ 1 0 0 . 0 0
P a s s e n g e r T o t a l $
S m i t h $ 1 0 0 . 0 0
J o n e s $ 2 0 0 . 0 0
B l a c k $ 3 0 0 . 0 0
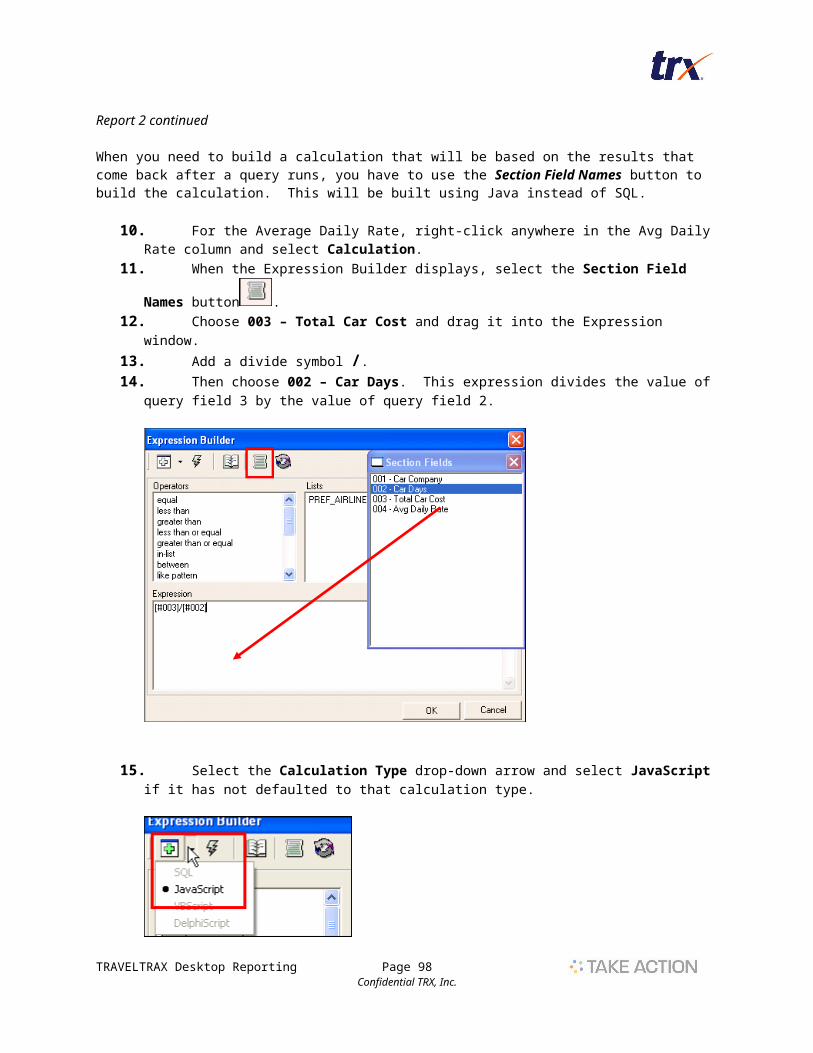
Report 7This will be a three section report with sections 2 and 3 linking back to section 1. Section 1 will be the master section containing the main ticket information; section 2 will be similar but will only include refunds, and section 3 will only include exchanges.
1. Go to the Main Menu and create a new report called REPORT7.
2. Add Report Properties Title – One to One Link Category – Air Description – Ticket, refund, and exchange information.
3. Add Section 1 Properties Date Field: ID006 Date Period: MTD Date Format: ODBC Date
4. Section 1 Description – Ticket Data
5. Add data fields for section 1. CL003 – Customer Name ID029 – Total Ticket Amount : Set the summary type to SUM
6. Enter the filters – Section 1 should only return regular tickets; no refunds or exchanges, so we need to add filters for those parameters.
ID074 – Refund Indicator = ‘N’ ID047 – Exchange indicator = ‘N’ ID007 – Void Indicator = ‘N’ ID018 – Vendor Type IN (‘BSP’,’NONBSP’)
TRAVELTRAX Desktop Reporting Page 98Confidential TRX, Inc.
Report 7 continued
7. Add a new section or copy section 1. We are going to Copy the section by clicking on copy
section button .
8. Add section 2 Properties. Since we copied section 1, some of the section properties already exist. Keep the properties for date field, date period and date format, but add the link to section 1
Link section 2 to section 1. Do this by entering a 1 in the Link section. We do not want to add a checkmark in the 1>Many box this time because we’re doing a
one to one link.
9. Change the section description to Refund Amount.
10. We’re using the same data fields so we don’t need to add them again.
11. We do need to rename the ID029 field to Refunds and set the summary type to Sum.
12. Add/modify filters for section 2. We only want refund information, so we need to change the filter for ID074. ID074 - Edit the filter and change the SQL to <> ‘N’. This means, ‘does not equal NO’. There are 2 types of refunds, partial and full refunds so we
have to include both indicators. You also could have done a list to include the Y indicator and the P indicator.
13. Add a link to the Customer Name in Section 1. Right-click in the Customer Name field. Select Properties. Click the drop-down box next to Link By. Select ClientCode. Select OK.
TRAVELTRAX Desktop Reporting Page 99Confidential TRX, Inc.

Report 7 continued
Add a 3rd section for the exchange information.
1. Copy section 2.
2. Add the section description – Exchanges.
3. Section 3 Properties Keep the same Date Field, Date Period, and Date Format Link this section to section 1 with a one to one relationship.
4. Rename the ID029 field to Exchange Amount.
5. Set the summary type to Sum for the ID029 field.
6. Edit the Exchange Ind filter ID047 – Exchange Indicator Enter = ‘Y’
7. Edit the Refund Ind filter ID074 – Refund Ind Enter = ‘N’
8. The link should already be created since we copied section 2, but check to verify.
9. Save the report.
10. Run the report with the ABC Corporation profile.
TRAVELTRAX Desktop Reporting Page 100Confidential TRX, Inc.

Union ReportsThe unioning of sections is necessary in order to add data from subsequent sections into a previous section. You will not have a Union in every report. The type of report you want to build and the results you’re trying to achieve are the determining factors. In a union, Desktop Reporting takes the result set of one section and adds it to the result set of another section in order to get data from unlike sources into one result table.
For unions to work, the length and data types of each field from subsequent sections must match the length and data types of the section they’re unioning into. Example:
Field 1 Field 2 Field 3Section 1 (Ticket) Passenger Issue Date Ticket AmtLength 20 8 14Data Type A D $
Section 2 (Car Passenger Issue Date Total Car CostLength 20 8 14Data Type A D $
In the above example, the length and data type in Field 1 (Section 1) matches the length and data type in Field 1 (Section 2) and appears in the same order. Both Field 2s match as do Field 3s.
If an amount field in a subsequent section is not used or available, you can substitute a CAL1 field in its position. Enter a zero as the calculation.
TRAVELTRAX Desktop Reporting Page 101Confidential TRX, Inc.

Report 8In this report we want to find out the total amount that a client spent on air tickets, car, and hotel. We want one total for everything and we’ll call it Total Expenses.
1. Create a new report.
2. Name it REPORT8.
3. Add Report Properties Title – Union Report Category – Air Travel Description – Union Report example
4. Add Section 1 Properties Date Field – ID006 Date Period – MTD Date Format – ODBC DATE
5. Section 1 Description – Total Expenses
6. Add the data fields CL003 – Customer Name ID029 – Total Ticket Amount
o Set summary type to Sum. o Rename the field heading to Total Cost.
7. Section 1 Filters – We only want airline and rail tickets and we don’t want any voids.
8. Add a new section.
9. Add Section 2 Properties: Date Field: CAR007 Date Period: MTD Date Format: ODBC Date Union – Enter a 1 in the Union Section. We’re unioning section 2 with section 1 in order to
get one total amount.
TRAVELTRAX Desktop Reporting Page 102Confidential TRX, Inc.

Report 8 continued
10. Section 2 Description – Car Data
11. Add data fields to section 2. CL003 – Customer Name CAR028 – Total Car Cost. Set the summary type to Sum.
12. Add filters to section 2 CAR008 (Car Void Indicator) = ‘N’
13. Add a new section.
14. Add section 3 Properties: Date Field – HTL007 (Hotel Issue Date) Date Period – MTD Date Format – ODBC Date Union – Union section 3 to section 1 by adding a 1 in the union box.
15. Enter Section 3 description: Hotel Data
16. Add data fields to section 3. CL003 – Customer Name HTL035 – Total Hotel Cost. Set the summary type to Sum.
17. Add filters to section 3. HTL008 (Hotel Void Indicator) = ‘N’
18. Run the report using the ABC Corporation profile.
TRAVELTRAX Desktop Reporting Page 103Confidential TRX, Inc.
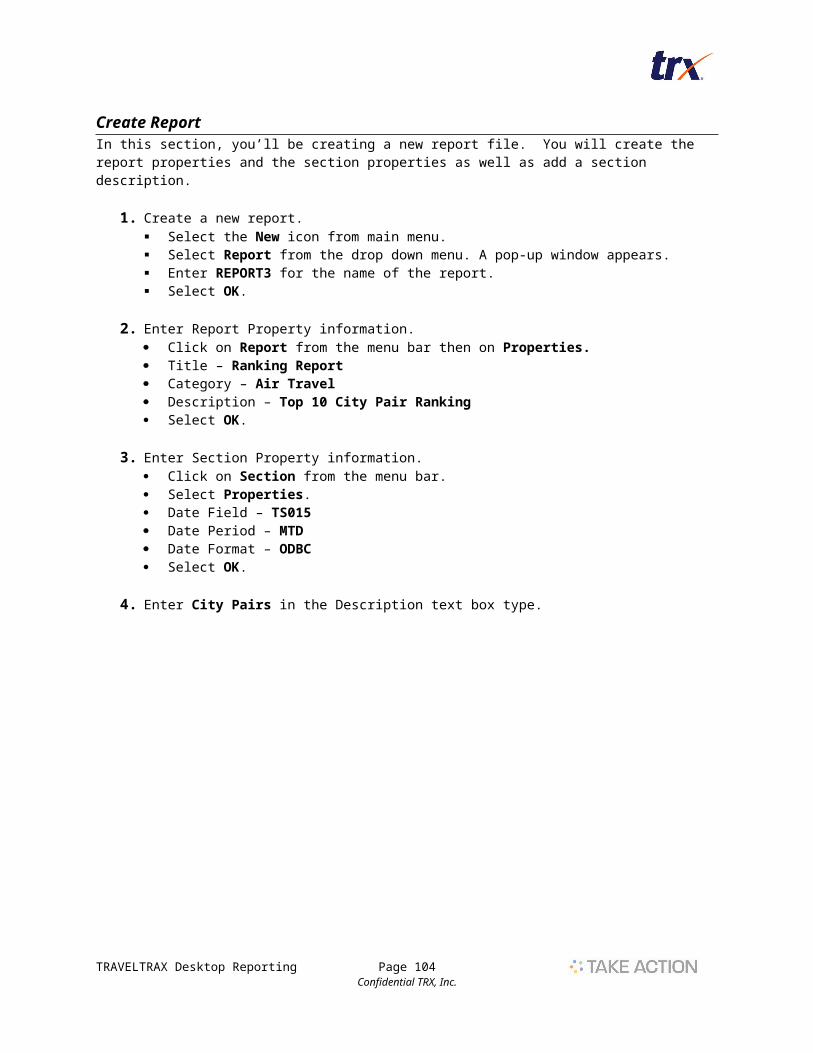
Excel Design ReportsSelecting Excel as the design tool for your report is different than having Desktop Reporting do an Excel data dump.
When a report is created and no design tool is selected, TRAVELTRAX Desktop Reporting defaults to an Excel data dump (Excel raw data). There is no design to the report, but the results of the query will display in Excel. There will be one tab for every section in the query.
Below is an example of a data dump with 3 sections in the query
TRAVELTRAX Desktop Reporting Page 104Confidential TRX, Inc.
3 Tabs = 3 sections in the query.

Explanation of tabs for Excel DesignWhen you select Excel as the design tool, you will see one tab for each section of the report, one tab for the dates of each section of the report, and one tab for each section for a Multilanguage header (not currently in use for most clients). You will also see a tab for the profile information (Rpthdng)
Below is an example of the tabs of a report and an explanation of each:
Test – This is the name of the report. This tab contains no data.
Rpthdng – This tab contains the data that comes from the profile. It contains the Profile ID, any headers that were entered into the profile, the report name, and any remarks that were entered in the profile. This data can be moved to the main sheet for the report to create a header for the report.
Sect – Each section of a report will have its own tab in the Excel design that contains the data results from the query. So, if we have 3 sections, we’ll have Sect1, Sect2, and Sect3 tabs in the design.
Sect1dt – Each section of a report will have its own tab in the Excel design that contains the date information. If we have 3 sections, we’ll have Sect1dt, Sect2dt, and Sect3dt tabs.
Sect1MLHdr – Each section of a report will have its own tab in the Excel design that contains any multi-language header information. If we have 3 sections in the query, then the design will have Sect1MLHdr, Sect2MLHdr, and Sect3MLHdr.
TRAVELTRAX Desktop Reporting Page 105Confidential TRX, Inc.

Excel Reports continued
Report 10This is a report to show the top 20 hotels for the Month to Date and the Year to Date and will have an excel design. We will select Excel as the design tool. You can make changes to the design when in Edit Mode. However, it is recommended that you follow the steps below to edit an Excel design. These steps will allow you to save many iterations of the design. You will also be assured that your changes will be saved.
1. Create a new report called REPORT9.
2. Report Properties Title Excel Design Category Hotel Summary Description Top 20 Hotels MTD and YTD
3. Section Properties Date Field HTL007 Date Period MTD Date Format ODBC Date
4. Section Description Top 20 Hotels MTD
5. Query Fields City Name HTL022 Number of Nights HTL030 (SUM) Total Hotel Cost HTL035 (SUM) Rank Top 20 Cities by Cost
6. Filter HTL008 = ‘N’ (Global)
7. Copy Section 1
8. Section Properties Date Period YTD
9. Section Description Top 20 Hotels YTD
TRAVELTRAX Desktop Reporting Page 106Confidential TRX, Inc.

Report 10 continued
10. Run the report and use the default reporting periods. This is a data dump and will only display 2 tabs: one for each section
Report 10 Design
11. Exit out of Excel and select Excel as the design tool (if on the main menu, right-click the report and select “Edit Design”).
12. Make changes to the design in the Edit Design mode only. When using Excel as a design tool, you have the data has to be in Excel in order to create
the design around it. So, the system has you run the report with the profile (if you want to run it without the profile, hit cancel).
TRAVELTRAX Desktop Reporting Page 107Confidential TRX, Inc.
NOTE: **** If changes are made to the design when ‘Run’ or ‘Run with’ are selected, then the changes will not be saved. ***

Report 10 continued
13. Once the report displays, exit out of Excel.
14. Access C:\\WINDOWS\Temp\TMANPRIV When you run a report in Desktop Reporting, a temporary file is created and put in the
location above. A copy of the report you just ran will be kept in this location until you run another report in
Desktop Reporting.
15. Pull up the Excel file with the same name as the report.
16. Save As or copy the file to another folder (any folder you choose).
17. Make changes to the copy you’ve saved. This is where you’ll create the design. You can create multiple copies as long as you keep doing Save As.
18. In the final copy, test the report to ensure macros and formulas function as planned.
19. If all are correct, make sure the report is kept in its pre-processed form (the macro has not run and all sheets are visible).
20. When all changes have been made and the report is ready to save to the database, run the report in Desktop Reporting in the Edit Design mode.
21. When the report display, close the workbook but NOT Excel (click the lower X in the upper-right corner).
TRAVELTRAX Desktop Reporting Page 108Confidential TRX, Inc.
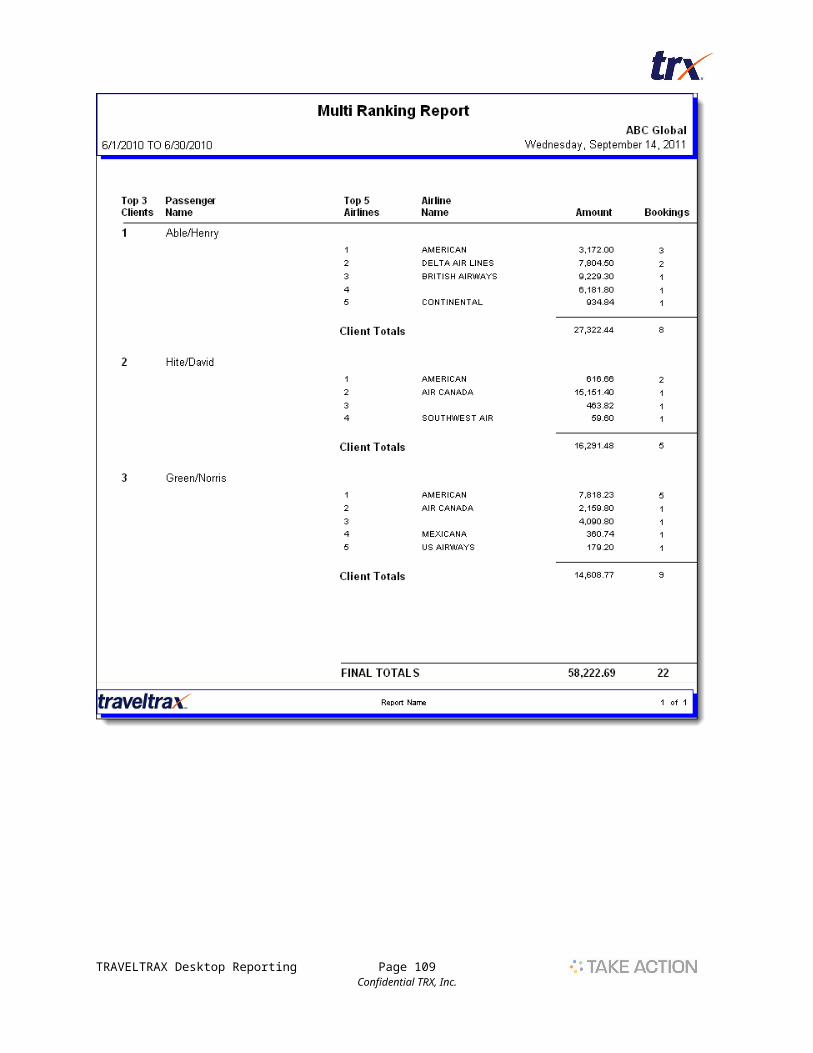
Report 10 continued
22. Select File – Open and browse to the folder containing your modified Excel design.
23. Select your Excel report.
24. Prevent any macros from running and clear most, or all, data from each Section tab.
25. Save As and save the report to C:\WINDOWS\Temp\TMANPRIV.
26. Instead of entering a name, select your original report and choose to overwrite when prompted.
27. Close Excel. The report with all your changes is now saved to the database.
28. To verify this, go back into TRAVELTRAX Desktop Reporting and run the report.
TRAVELTRAX Desktop Reporting Page 109Confidential TRX, Inc.

Prompts
This section will show you how to create prompts in a report. To give a user the ability to select specific data within a data field, you can create a prompt that allows them to enter the data or to choose the data from a list. Below are the different types of prompts that you can create along with an example and an explanation.
When you enter a prompt into the data fields, it is mandatory for the user to select/add a value. When you enter a prompt into the filter section, it is not mandatory. The user has the option to
override the prompt and still return all data for that specific data field.
Regular PromptsThis type of prompt will display when the user runs the report.
=’~{Airline Code}’The format is explained as:
Equals sign, single quote, tilde, left French brace , the words you want to display for the prompt (in this example it is Airline Code), right French brace, single quote.
The equals prompt above will display the name of the prompt (in this example Airline Code) and allow the user to enter one specific data field.
IN (’~{Airline Code}’)The format is:
The word IN, open parenthesis, single quote, tilde, left French brace, the words you want to display for the prompt, right French brace, single quote, close parenthesis.
The In List prompt above will display the name of the prompt (in this example, Airline Code) and allow the user to enter multiple, specific data fields.
Default PromptDefault prompts will display the name of the prompt AND display a default value for that prompt. The user has the option to leave the default value or change it if necessary.
= '~{Airline Code},AA}'
This format is:Equals, single quote, tilde, left french brace, prompt name, right french brace, a comma, the default value, right French brace, single quote.
The example above will give the user a prompt that has a default value of AA. They can change this value or leave the default value. This prompt will not allow a blank value, thus returning ALL values.
TRAVELTRAX Desktop Reporting Page 110Confidential TRX, Inc.
Pick List PromptA Pick List prompt will display a list of values that the user can select from. This option allows the user to pick from the list or enter a value(s) manually. The list has to be created before doing the steps below.
In the filter section, click and drag the data field that holds the value needed. Right-click in that column and select Pick List
Select List Object and the pick list box will activate. Select the list you need from the options that display. Click OK.
Pick List report: A Pick List report is a separate report you create to run a query and return data that will then be used to display a list that the user can select from. The advantage of using this is that it will only allow the user to select from a list of values that currently have data.
Create Pick List Report Create a new report. Name it using a naming convention that will let everyone know this is a pick list report. In the section properties, you have to select Distinct for this to work.
Select the data field that will return the value you need for the list. Enter any filters necessary. Save the report.
TRAVELTRAX Desktop Reporting Page 111Confidential TRX, Inc.

Create a Pick List from a Pick List Report Click and drag the data field you need for the list into the filter section. Right-click that data field and select Pick List. Select DART report and click OK. A list of all your reports will display. Select the correct pick list report. Then select the Return Value From field you need (the data field entered into the pick list
report. Click OK.
Char Index PromptThe CHARINDEX function is used to search a character string for a specific character or set of characters. If the character string being searched contains the characters being searched for, then this function returns a non-zero integer value. This integer value is the starting location of where the character string being searched for is located within the string being searched.
CHARINDEX ( expression1 , expression2 [ , start_location ] )
Where expression1 is the string of characters to be found in expression2, and start_location is the position where the CHARINDEX function will start looking for expression1 in expression2. start_location is an optional field. If you don't specify a start location or if you specify 0 or negative number, the search starts from beginning of expression2.
Here is an example of a charindex: CHARINDEX('~{Airline Code1}',[ID020])*[ID029]
CHARINDEX the statement expression
{‘~{Prompt Name}’ A prompt will display for the user to add the value they want to search for.In the example above, the user will enter an airline code and the query will search for that airline code in the ID020 data field.
,[ID020] This is expression 2 of a charindex statement – The query will look in this data field, ID020, for the value that has been added in the prompt.
*[ID029] In this example, every time the query finds each airline code the user added in the prompt, it will return a value of 1. Then it will multiply 1 times ID029 which is the ticket amount. This will give us ticket amounts for specific airlines only. If the airline code chosen in the prompt is not in the data, it will return a 0 (zero) and when it multiplies 0 x ticket amount, it will return 0 as the result.
TRAVELTRAX Desktop Reporting Page 112Confidential TRX, Inc.

SQL StatementsSQL is used when creating calculations and filters. This section will show you the most common SQL statements used in reports.
ISNULL([ID021],’Unknown’)The ISNULL function is used to replace NULL values with another value. Here is an example of an ISNULL statement:
ISNULL SQL expression([ID021] The data field to check for Null values,’Unknown’) The replacement value for any results that are returned with a Null value.
IN (‘BSP’,’NONBSP’)This SQL statement is used to select air and rail as the only vendor types returned in a report. BSP and NONBSP are vendor types that will return air and rail tickets that were issued through ARC, BSP, or were consolidator tickets.
IN SQL Expression to start an IN-List. Use this when you have more than one value.(‘BSP’ Open parenthesis, single quote, value, single quote.,’NONBSP’) Comma to separate each value, single quote, value, single quote, close
parenthesis.
TRAVELTRAX Desktop Reporting Page 113Confidential TRX, Inc.

Relationships Under normal conditions, all Relationships required by TRAVELTRAX Desktop Reporting already exist. However, if you decide to add a new table to the TRAVELTRAX database, it will require you to build a relationship(s) between your new table and existing tables within TRAVELTRAX if you want to get reports that execute properly.
Let’s look at an example of an existing relationship to begin understanding them. Note: Building or editing relationships is accomplished in the Master Data Dictionary.
Double-click on the Car table in the right window.
Below, you’ll see the joins that have been created between the Ticket and Car tables. The join is between the two fields in the Ticket and Car tables that make up the primary key of the Ticket table. The purpose of these two joins is to allow the return of ticket and car records that match based on Record Key and IATA Number. Without these joins you’ll get significantly different results as we’ll demonstrate next.
TRAVELTRAX Desktop Reporting Page 114Confidential TRX, Inc.

Relationships continued
To show how relational databases function using tables with and without relationships, we will construct a new table and experiment using it.
1. Select the Master Data Dictionary icon from the Main Menu in TRAVELTRAX.
2. Click on the or right click in the left window of the Dictionary and choose New Table.
3. Complete the New Table window as illustrated in Figure and select Add. Notice that ACAR has been added to the Dictionary.
4. Expand the ACAR table.
5. Right-click on the Field Folder.
6. Select New Field.
TRAVELTRAX Desktop Reporting Page 115Confidential TRX, Inc.

Relationships continued
7. Highlight all the fields in the Add Field window and select OK. The result will be that all fields in the car table will be added to the ACAR alias.
8. Highlight all the fields in the Add Field window and select OK. Result: All fields in the car table will be added to the ACAR alias.
9. With your new table added, showing the effect of relationships between tables is relatively easy.
10. Build a new report that includes Record Key and Passenger Name from the TK table and Record Key, Passenger Name, and Car Sequence Number from the ACAR table. (No need for a report design for this example.)
11. Assign this report to a Profile and Generate it. Go to Paradox and open the table Sect1.db. and notice the number of records displayed. The number of records returned is large because for each ticket record found the program will return every car record. Also, you’ll notice that there is no sensible correlation between the tickets and cars. (Which ticketed passenger rented what car.)
TRAVELTRAX Desktop Reporting Page 116Confidential TRX, Inc.

Relationships continued
12. To fix the problems observed with our report, you’ll need to build a relationship between TK and ACAR. The process is simple.
a. Go to the Data Dictionary from the Main Menu.b. Expand ACAR.c. Right-click on Join – then New Join.d. From the Join Table drop-down-list select ID (Invoice Detail). e. Below the Join Table list are three other drop-down-lists. From the left and right drop-down-
lists select RecordKey. Then select the ADD button. The relationship between TK and ACAR is now complete. When you rerun your sample report, the number of records returned will be significantly reduced. This is because the query will now only return ticket records that have a matching car record based on Record Key.
TRAVELTRAX Desktop Reporting Page 117Confidential TRX, Inc.

Data Dictionary Help Pages
Type Origin City Code
Destination City Code
Origin City Name
Destination City Name
Origin Region Code
Destination Region Code
All Connections
TS009 TS026 ORIG003 SDEST003 ORIG005 SDEST005
No Connections (NOX)
TS009 TS037 ORIG003 XDEST003 ORIG005 XDEST005
No Connections - Minute Rule
TS009 TS049 ORIG003 MDEST003 ORIG005 MDEST005
Market City Pairs (All Connections)
TS034 TS035 SMORIG003 SMDEST003 SMORIG005 SMDEST005
Market City Pairs (NOX)
TS045 TS046 XMORIG003 XMDEST003 XMORIG005 XMDEST005
Market City Pairs - Minute Rule
TS057 TS058 MMORIG003 MMDEST003 MMORIG005 MMORIG006
TRAVELTRAX Desktop Reporting Page 118Confidential TRX, Inc.
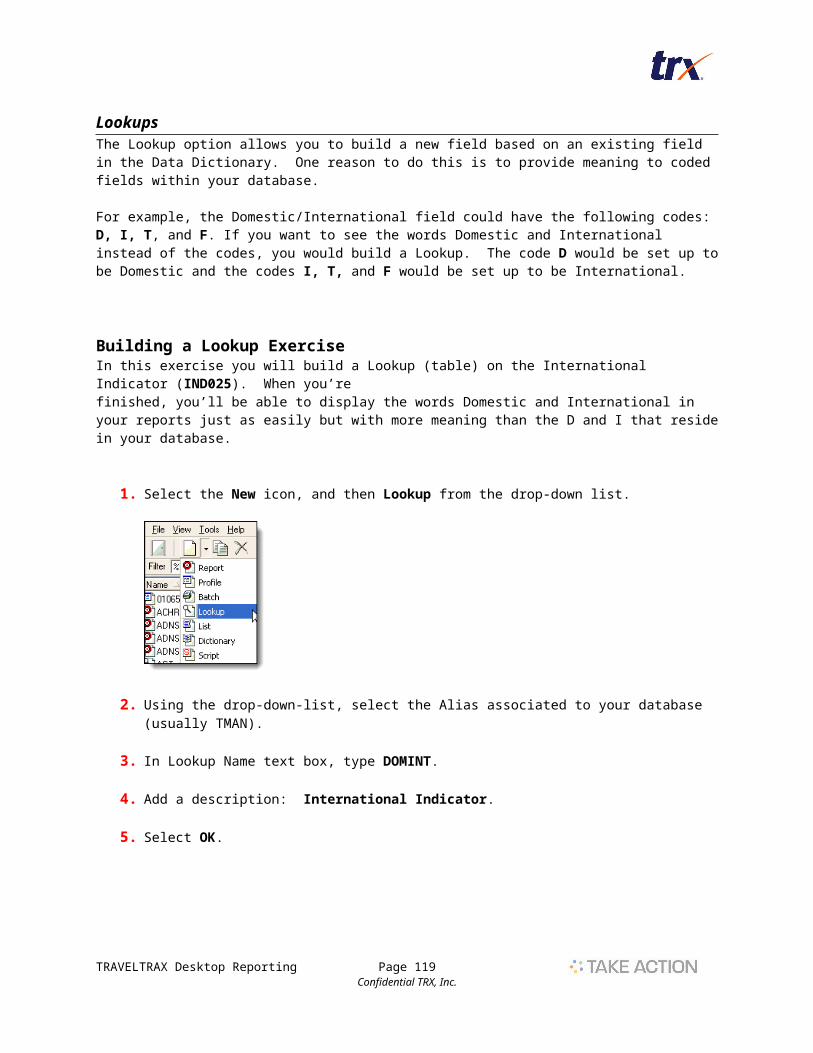
Type Origin Region Name
Destination Region Name
Return Indicator (is not null)
Segment Value
Intl/Dom Ind (D or I )
Seg Miles
Total Miles
Selection Criteria
All Connections ORIG006 SDEST006 TS036 TS030 TS027 TS031 TS032 None
No Connections (NOX)
ORIG006 XDEST006 TS048 TS041 TS038 TS042 TS043 TS037>A
No Connections - Min Rule
ORIG006 MDEST006 TS060 TS053 TS050 TS054 TS055 TS049>A
Market City Pairs (All Connections)
SMORIG006 SMDEST006 TS036 TS030 TS027 TS031 TS032 TS035>A
Market City Pairs (NOX)
XMORIG006 XMDEST006 TS048 TS041 TS038 TS042 TS043 TS046>A
Market City Pairs - Min Rule
MMORIG006 MMDEST006 TS060 TS053 TS050 TS054 TS055 TS058>A
TRAVELTRAX Desktop Reporting Page 119Confidential TRX, Inc.
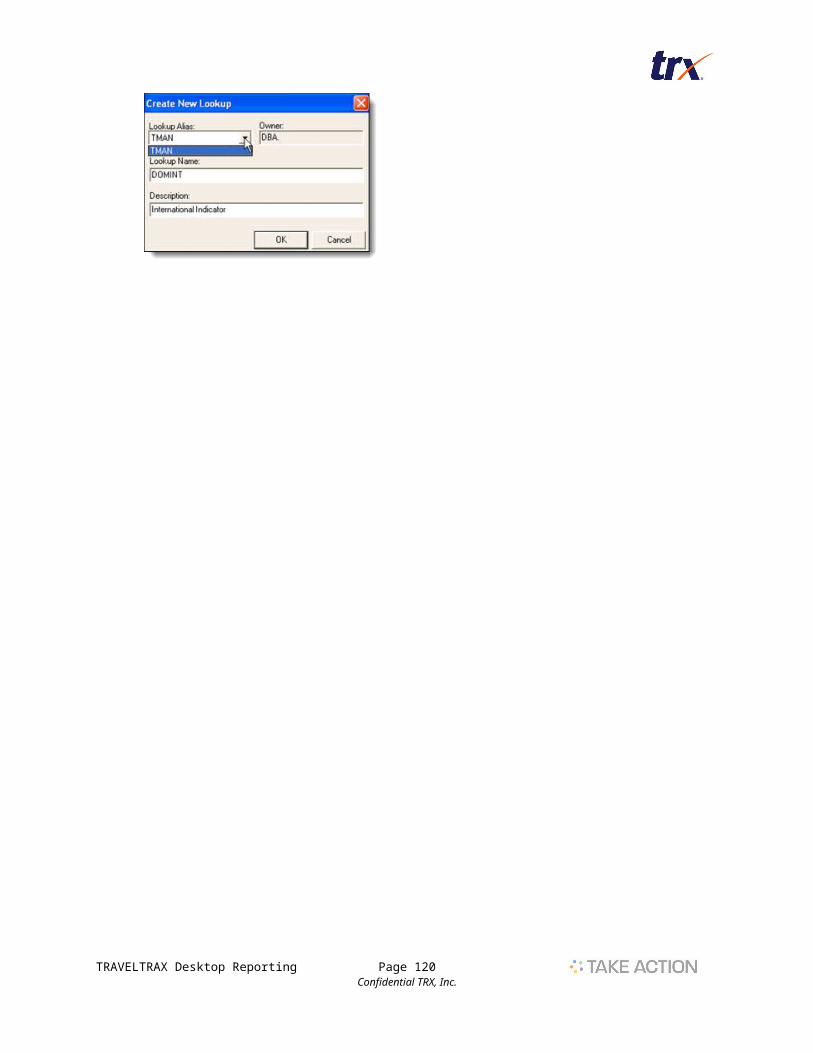
Tips for Segment Reporting:
If you want to use the segment value that comes from your back office system you can choose that field from the TranSeg table.
To prorate the segment value based on the segments mileage as compared to the total mileage use the following formula:
SegmentMileage / TotalMileage x Amount - the amount can be the Ticket Price, Base Fare, etc.
To make a query with no return segments use the following in selection criteria: ReturnInd is null
To enter string data (text) you must place it within a SQL statement (e.g. OriginCity + DestinationCity) You must use the MS SQL Server format function. This function takes the arguments and strings them together.
argument1 + argument2
To place a separator between the two arguments you must add in the separating characters enclosed in single quotes.
The result: [ORIG003] + ' - ' + [SDEST003]
Sample Travel Itinerary:1 DL 928F 07JUN J *MIAJFK HK1 235P 545P 2 DL 82J 07JUN J JFKNCE* HK1 700P 940A+1 (08JUN)3 LX 563C 14JUN J *NCEZRH HK1 1040A 1200N 4 LX 64C 14JUN J ZRHMIA* HK1 105P 530P
Flight(s)A Flight corresponds to a segment flown. Segment 1 above is a flight between MIA (Miami) and JFK (New York JFK Airport). Reporting flights would be represented by 4 unique city pairs for the sample itinerary. In TRAVELTRAX refer to "All Connections".
Trip(s)Some companies might use this term to mean the number of airline tickets, but the strict definition refers to the true destination. That means an origin city to a destination city where you stay overnight, not where you connect to another flight.
For the sample above there are 2 trips. One trip is MIA (Miami) to NCE (Nice) and 1 trip NCE-MIA. In TRAVELTRAX we refer to this as the MIN Destination field.
Market(s)Similar to a trip, a market is the origin and destination of a trip reflected alphabetically. In this example, there are 2 trips in the NCE-MIA market (but only one market). In TRAVELTRAX refer to Min Market Destination.
TRAVELTRAX Desktop Reporting Page 120Confidential TRX, Inc.