microsoft report builder 3.0 1. welcome name company affiliation title/function job...
TRANSCRIPT

Microsoft Report Builder 3.0
1

Welcome
Name
Company Affiliation
Title/Function
Job Responsibility
Business Intelligence Experience
Did you take the evaluation?
Expectations for the Course
2

Modules
1. Welcome
2. Introduction to Report Builder 3.0
3. Introduction to Report Builder 3.0
4. Report Builder 3.0 Wizards
5. Report Builder 3.0 Graphics
6. Intermediate Reports
7. Report Builder 3.0 Tips and Tricks
3

How to get the most out of this course.
Ask Questions
If you can’t do it you didn’t learn it.
Carbohydrates are for breakfast not lunch
Multitasking kills learning
4
Facilities
Hours
Parking
Cell Phones
Internet Access
5

Your Installation
Your Computer Name is:
Your Administrative Name:
Your Password:
Your SQL Instance name is:
6

Table of Contents
7
Introduction to Report Builder 3.0

Introduction to Report Builder
3.0

Plan your reports
Variances between SQL versions
The Report Builder 3.0 interface
SQL Express 2012 and Report Builder 3.0 specifics
Data sources
Data sets
Module Topics

Configure your data source
Configure your data set which is essentially a query
Plan your data region on the report
Plan your reports
Report Builder 3.0 with SQL 2012 is backwardly compatible to SQL 2008 R2
Reports designed with Report Builder 3.0 and SQL 2012 have new exporting capabilities.
Variances between SQL versions

Home Tab
Insert Tab
View Tab
Menu
Data Sources (covered later in module)
Data Sets (covered later in module)
The Report Builder 3.0 interfacefrom left to right

1. Views
2. Clipboard
3. Font
4. Paragraph
5. Border
6. Number
7. Layout
Home Tab

Report Parts
Data regions
Data visualizations
Report items
Subreports
Header and Footer
Insert Tab
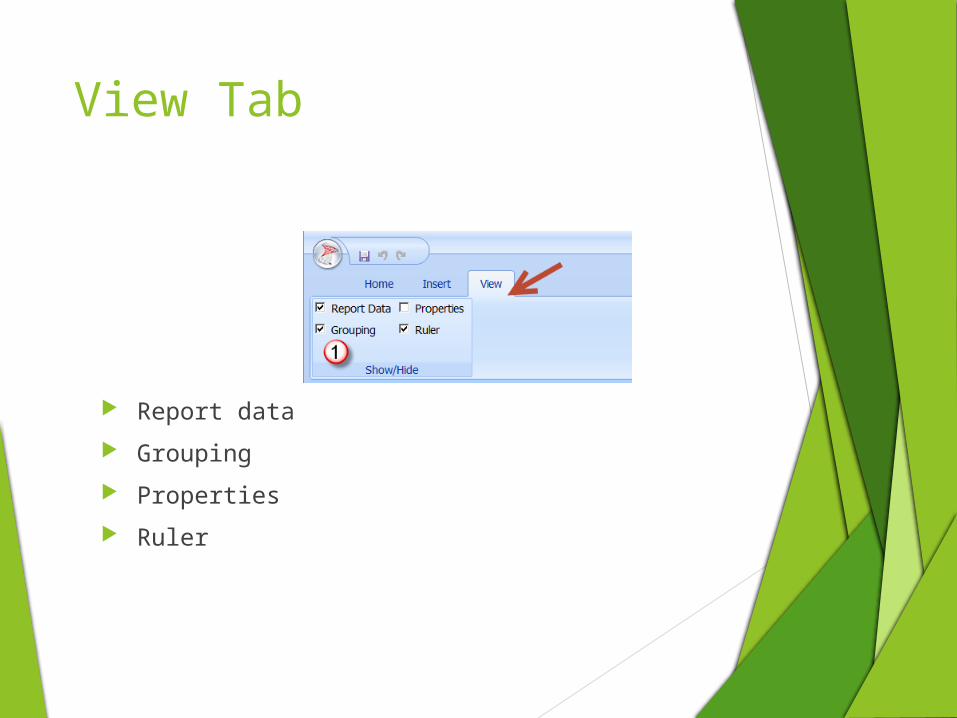
Report data
Grouping
Properties
Ruler
View Tab
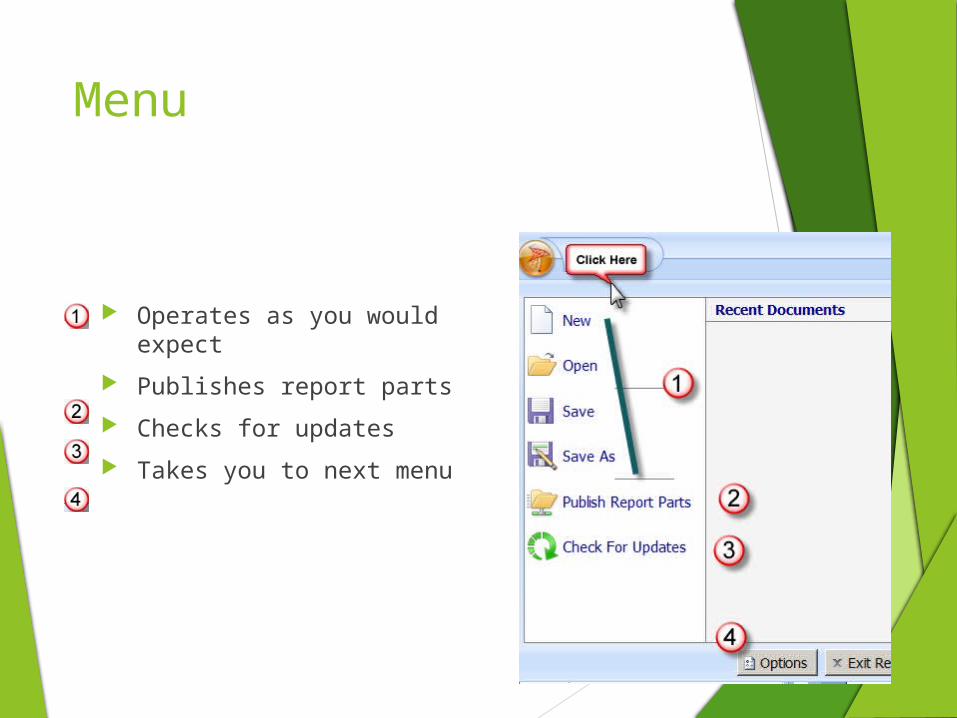
Operates as you would expect
Publishes report parts
Checks for updates
Takes you to next menu
Menu

Demonstration
Report Builder 3.0 Interface

Source must be SQL Express!
SQL Express 2012 and Report Builder 3.0 specifics

Data sources
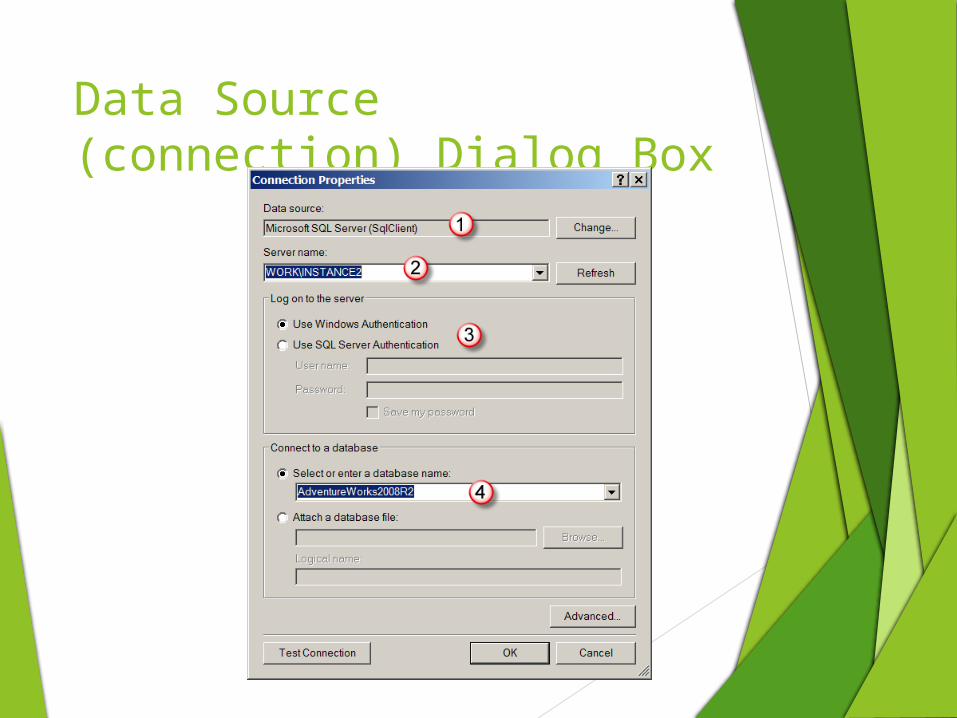
Data Source (connection) Dialog Box

Shared Datasets
Embedded Datasets
Query Designer for Relational
Query Designer for Analysis Services
Data sets

Query Designer (Relational)

Query Designer (Multidimensional)

Demonstration Connecting to a Report Server
Demonstration of how to connect into a Report Server

Create embedded data sources
Create shared data sources
Create embedded data set (relational)
Create embedded data set (multidimensional)
Create shared data sets
Demonstration

Looks like a Lab!
Lab

Module Objective
Lab Review
Module Review

Review Questions

Review Question Answers

Module 3 Report Builder
Wizards
Familiarizations with the Wizards
Data source (Previously shown)
Data Set (Previously shown)
Data Set (Previously shown)
Query Designer (Previously shown)
Table or Matrix Wizard
Chart Wizard
Map Wizard
Module Topics

Table or Matrix Wizard

Chart Wizard

Map Wizard

Table or Matrix Wizard
Chart Wizard
Map Wizard
Demonstrations

.
Lab

Module Objective
Lab Review
Module Review

Review Questions

Review Question Answers

4 Report Builder Basic Reports

Report Lists
Report Tables
Report Matrix
Data Region(s)
Report Parameters
Report Expressions
Formatting Reports
Report Parts
Module Topics

Report Lists

Demonstration
Report Builder 3.0 Lists

Report Tables

Demonstration
Report Builder 3.0 Tables

Report Matrix

Demonstration
Report Builder 3.0 Matrix

Data Region(s)

Report Parameters

Demonstration
Report Builder 3.0 Parameters
• Query Parameters• Report Parameter with a Shared
Dataset• Report Parameter with dataset as a
lookup
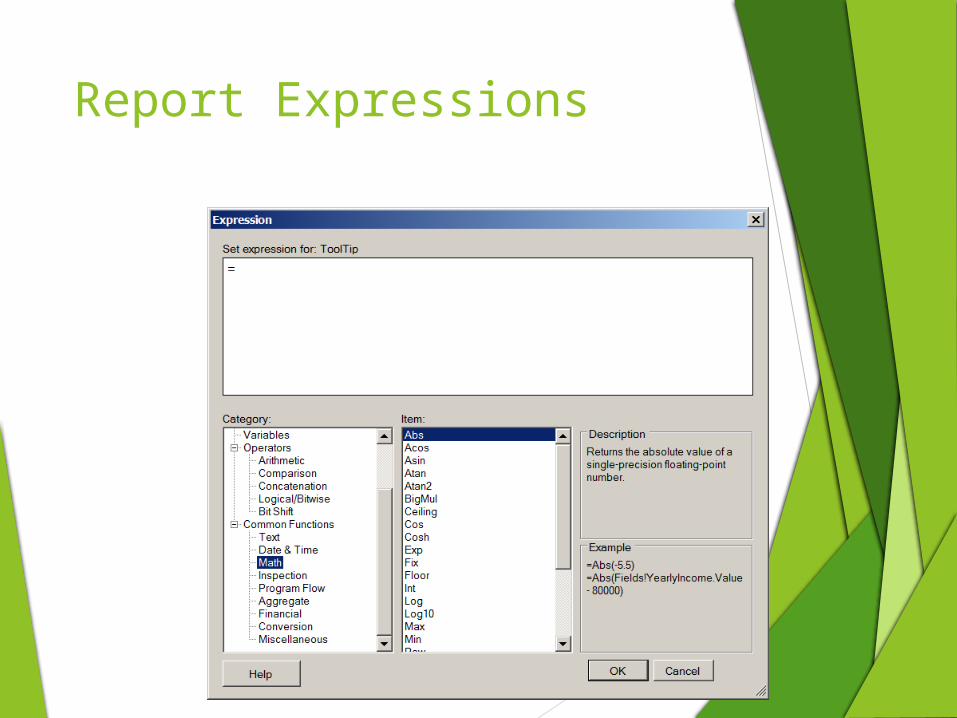
Report Expressions

Demonstration
Report Builder 3.0 Expressions

Report Parts

Demonstration
Report Builder 3.0 Report Parts

Formatting Reports

Demonstration
Report Builder 3.0 Formatting Reports

.
Lab

Module Objective
Lab Review
Module Review

Review Questions

Review Question Answers

5 Report Builder 3.0 Graphics

Overview of Visualizations
Charts
Gauges
Maps
Module Topics

Overview of Visualizations
Colors
Text
Icons

Colors

Text Less is Better!
May Reduce Effectiveness of Visualization
Here is the reverse demonstrated. Without the text the graphic is meaningless and thus the graphic is a waste of time.

Icons

Charts

Choosing A Chart Type
Type Time Rank Part to Whole
Deviation Distribution Correlation Nominal Comparison
Area
Bar
Column
Line
Shape
Polar
Range
Scatter

Sparklines, Databar, Indicator

Demonstration

Borders
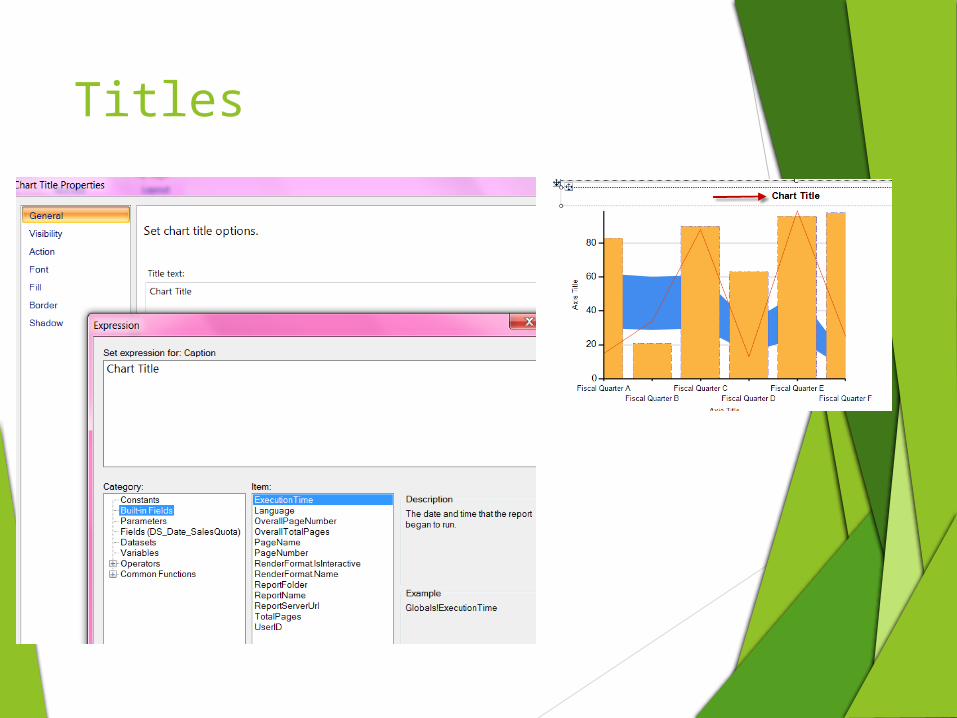
Titles

Data Labels/Legends

Demonstration

Demonstration

Demonstration

Spatial Data
Basic Maps
Analyzing with Color
Geography Display
Color Points
Maps

Demonstration
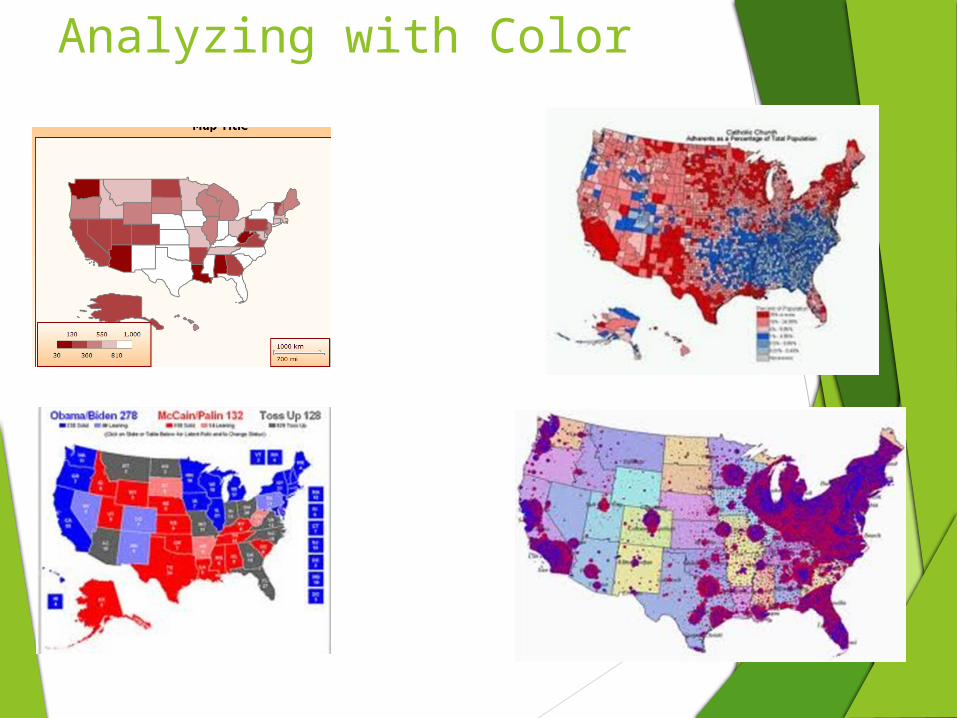
Analyzing with Color

Color Points

Demonstration

.
Lab

Module Objective
Lab Review
Module Review

Review Questions

Review Question Answers

6 Intermediate Reporting

Dynamic Headers and Footers
Your Company Report Templates
HTML5 and Textboxes
Using the List object to Combine Other Items
Subreports
Module Topics
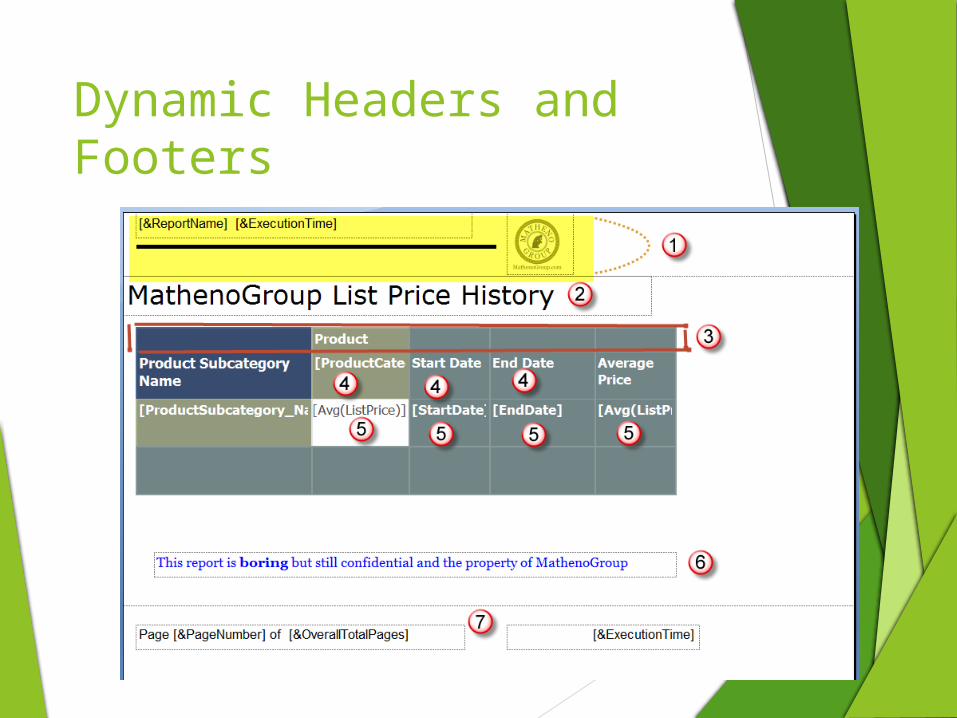
Dynamic Headers and Footers

Demonstration

Demonstration

HTML5 and Textboxes

Demonstration

Using the List object to Combine Other Items

Demonstration

Subreports

Demonstration

.
Lab

Module Objective
Lab Review
Module Review

Review Questions

Review Question Answers

7 Report Builder Tips and Tricks

.
Lab