microsoft powerpoint - oliver_forescene2006oct26
DESCRIPTION
O. Dilly 1 , B. U. Schneider 1 , T. Plieninger 2 , R. F. Hüttl 1 and T. Stuczynski 3 EU FP 6 Integrated Project 33 Partners // 12.3 M€ // Dec 2004 – Nov 2008 To deliver ex-ante Impact Assessment Tools (SIAT) to support decision making on policies related to multifunctional land use in European regions Humans have more than doubled the natural rate of N input to ecosystemsTRANSCRIPT

‘Visions on Land Use in Industrial Regions in Europe‘, Budapest, October 26, 2006 - 1
PD Dr. Oliver DillyEmail [email protected]
Land use in European industrial regions –
a vision of sustainability
O. Dilly1, B. U. Schneider1, T. Plieninger2, R. F. Hüttl1 and T. Stuczynski3
1 Brandenburg University of Technology, Cottbus, Germany2 Berlin-Brandenburg Academy of Sciences, Berlin, Germany
3 Institute of Soil Science and Plant Cultivation, Pulawy, Poland
Email [email protected]
‘Visions on Land Use in Industrial Regions in Europe‘, Budapest, October 26, 2006 - 2
PD Dr. Oliver DillyEmail [email protected]
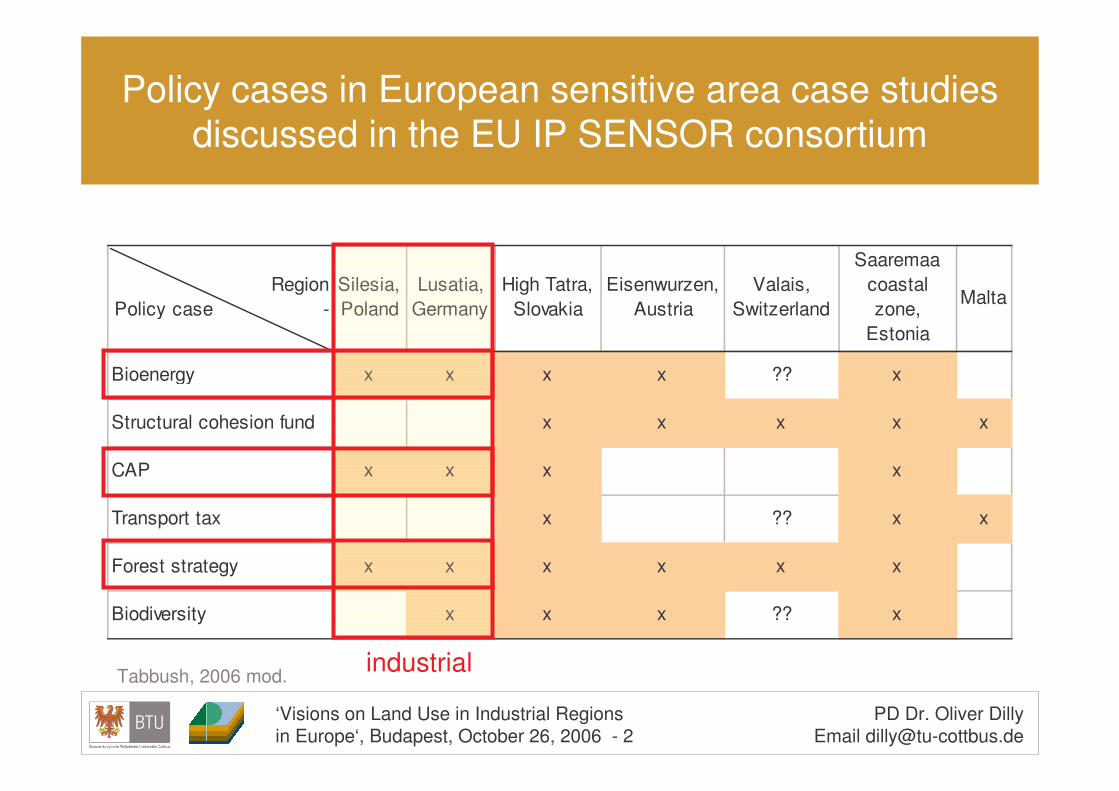
RegionPolicy case -
Silesia, Poland
Lusatia, Germany
High Tatra, Slovakia
Eisenwurzen, Austria
Valais, Switzerland
Saaremaa coastal zone,
Estonia
Malta
Bioenergy x x x x ?? x
Structural cohesion fund x x x x x
CAP x x x x
Transport tax x ?? x x
Forest strategy x x x x x x
Biodiversity x x x ?? x
Policy cases in European sensitive area case studies discussed in the EU IP SENSOR consortium
industrialTabbush, 2006 mod.

‘Visions on Land Use in Industrial Regions in Europe‘, Budapest, October 26, 2006 - 3
PD Dr. Oliver DillyEmail [email protected]
SENSOR Sustainability Impact Assessment: Tools for Environmental, Social and Economic Effects of Multifunctional Land Use in European Regions //
www.sensor-ip.org
� EU FP 6 Integrated Project 33 Partners // 12.3 M€ // Dec 2004 – Nov 2008Central coordination: Leibniz-Centre for Agricultural Landscape and Land Use Research ZALF, Müncheberg Germany (Katharina Helming)
� To deliver ex-ante Impact Assessment Tools (SIAT) to support decision making on policies related to multifunctional land use in European regionsIntegration of European and regional scale, spatial and temporal dimension, various land use sectors, social, economic, and environmental issues, top-down and bottom-up approach
‘Visions on Land Use in Industrial Regions in Europe‘, Budapest, October 26, 2006 - 4
PD Dr. Oliver DillyEmail [email protected]
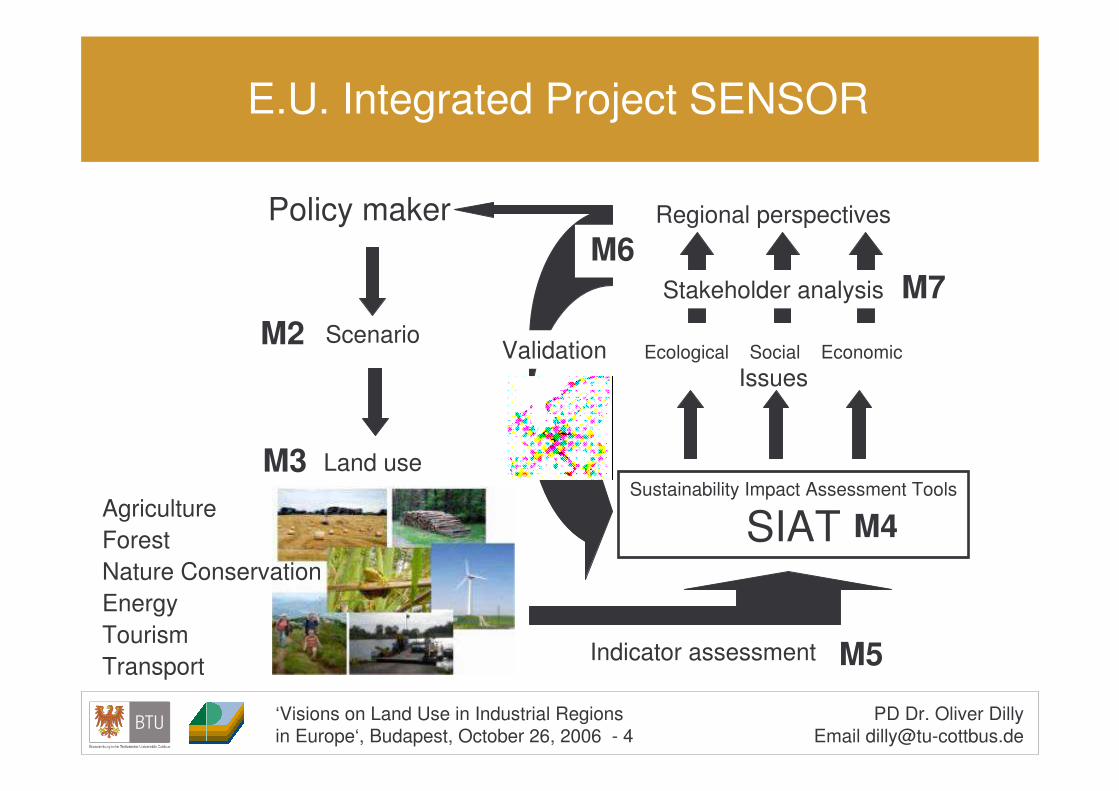
E.U. Integrated Project SENSOR
M2
M6M7
M3
Policy maker
Scenario
Land use
Indicator assessment
Sustainability Impact Assessment Tools
SIAT
Ecological Social EconomicIssues
Regional perspectives
M5
M4
Stakeholder analysis
Validation
Agriculture ForestNature ConservationEnergyTourismTransport

‘Visions on Land Use in Industrial Regions in Europe‘, Budapest, October 26, 2006 - 5
PD Dr. Oliver DillyEmail [email protected]
EC Impact Assessment GuidelinesJuly 15, 2005 - SEC(2005)791
Impact Assessment• Identifying the policy problem• Defining the objectives• Developing the main policy
options• Analysing their impact• Comparing the options• Outlining policy monitoring
and evaluation
IQ ToolsSIATetc.
Stakeholders in response to
critical issues
EC levelconsultation

‘Visions on Land Use in Industrial Regions in Europe‘, Budapest, October 26, 2006 - 6
PD Dr. Oliver DillyEmail [email protected]
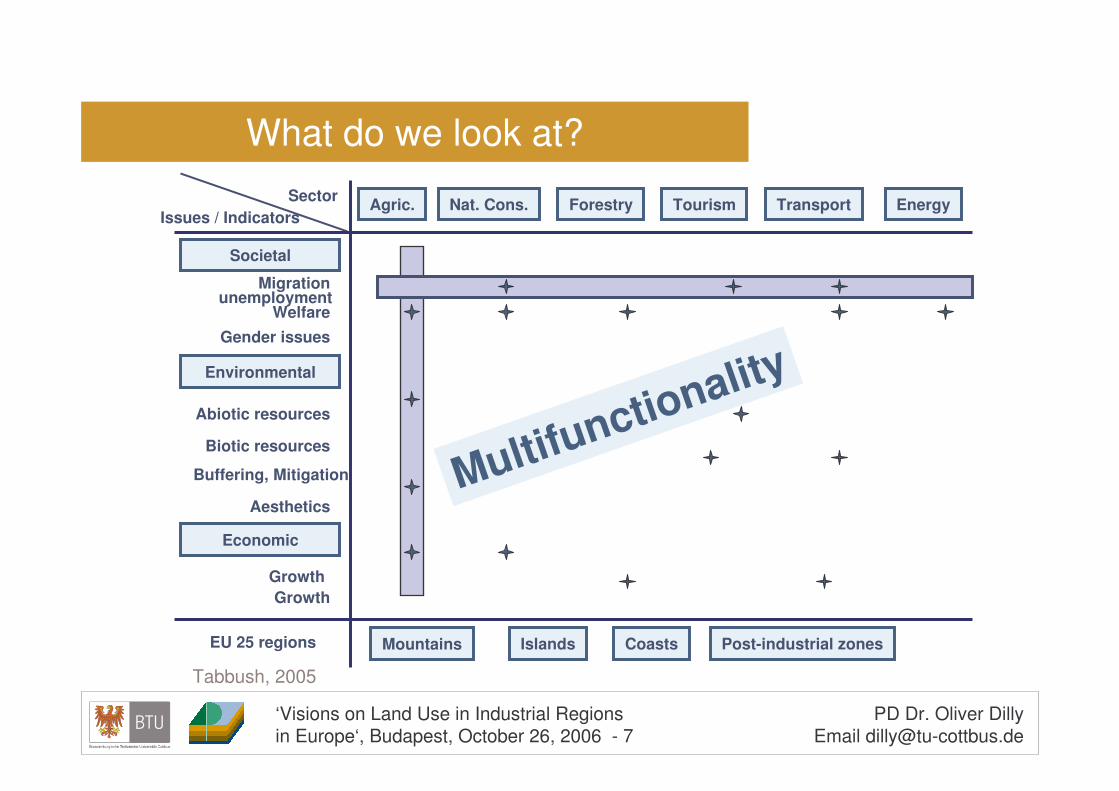
Impact issues in sensitive regions in Europe
� Most impact issues are addressed.
������������� �� ������� ��������������������� �����������������������������
‘Visions on Land Use in Industrial Regions in Europe‘, Budapest, October 26, 2006 - 7
PD Dr. Oliver DillyEmail [email protected]
Agric. Forestry Tourism Transport EnergyNat. Cons.
Societal
Environmental
Economic
Migration
Welfare
Abiotic resources
Biotic resources
Buffering, Mitigation
Aesthetics
unemployment
Growth
Gender issues
SectorIssues / Indicators
Multifunctionality
Mountains Islands Coasts Post-industrial zonesEU 25 regions
Growth
What do we look at?
Tabbush, 2005

‘Visions on Land Use in Industrial Regions in Europe‘, Budapest, October 26, 2006 - 8
PD Dr. Oliver DillyEmail [email protected]
SENSOR NUTS-X resolution (NUTS2 to NUTS3)
� 484 cells for EU-25� 581 cells for
EU-25+5~ 31 % are located in
sensitive post-industrial zones, mountains, coasts and islands.
‘Visions on Land Use in Industrial Regions in Europe‘, Budapest, October 26, 2006 - 9
PD Dr. Oliver DillyEmail [email protected]
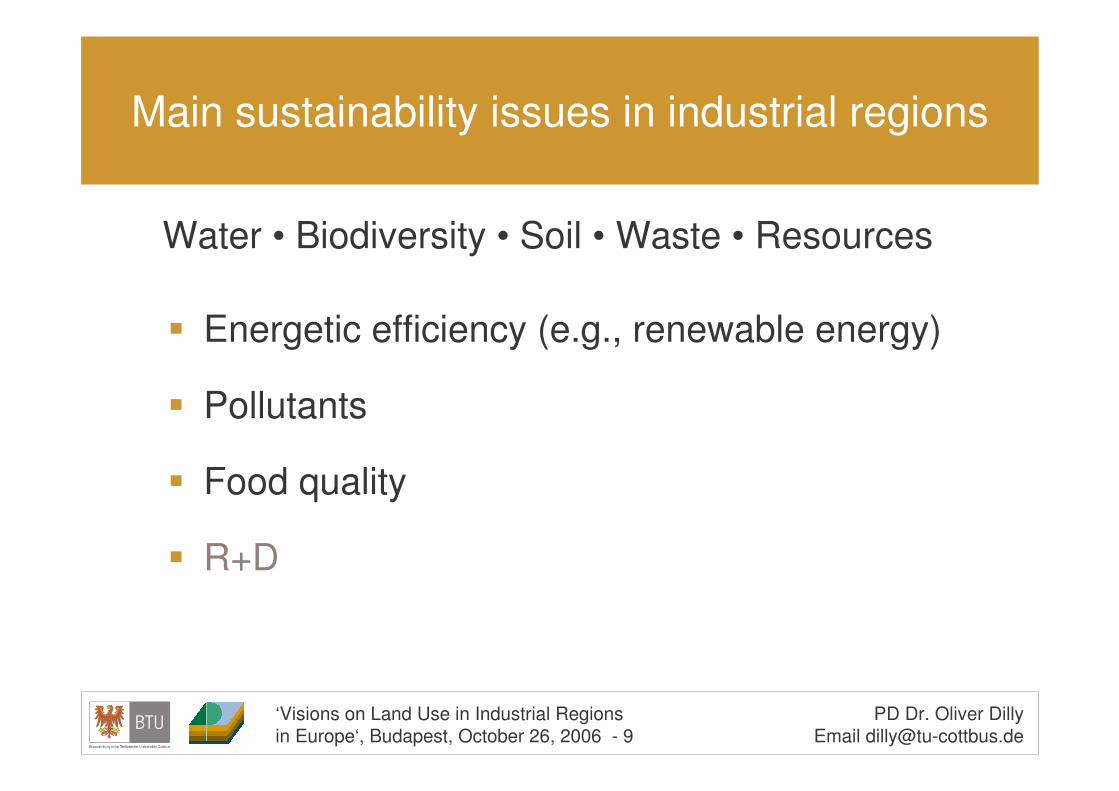
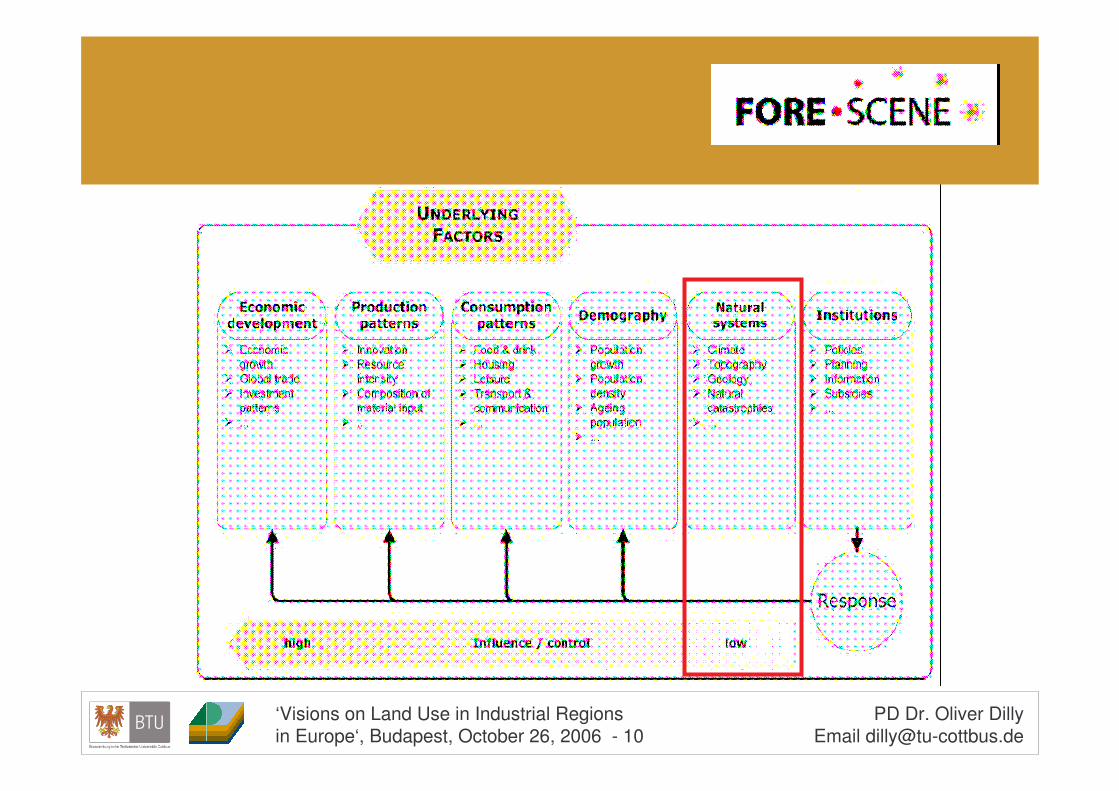
Main sustainability issues in industrial regions
� Energetic efficiency (e.g., renewable energy)
� Pollutants
� Food quality
� R+D
Water • Biodiversity • Soil • Waste • Resources
‘Visions on Land Use in Industrial Regions in Europe‘, Budapest, October 26, 2006 - 10
PD Dr. Oliver DillyEmail [email protected]
‘Visions on Land Use in Industrial Regions in Europe‘, Budapest, October 26, 2006 - 11
PD Dr. Oliver DillyEmail [email protected]
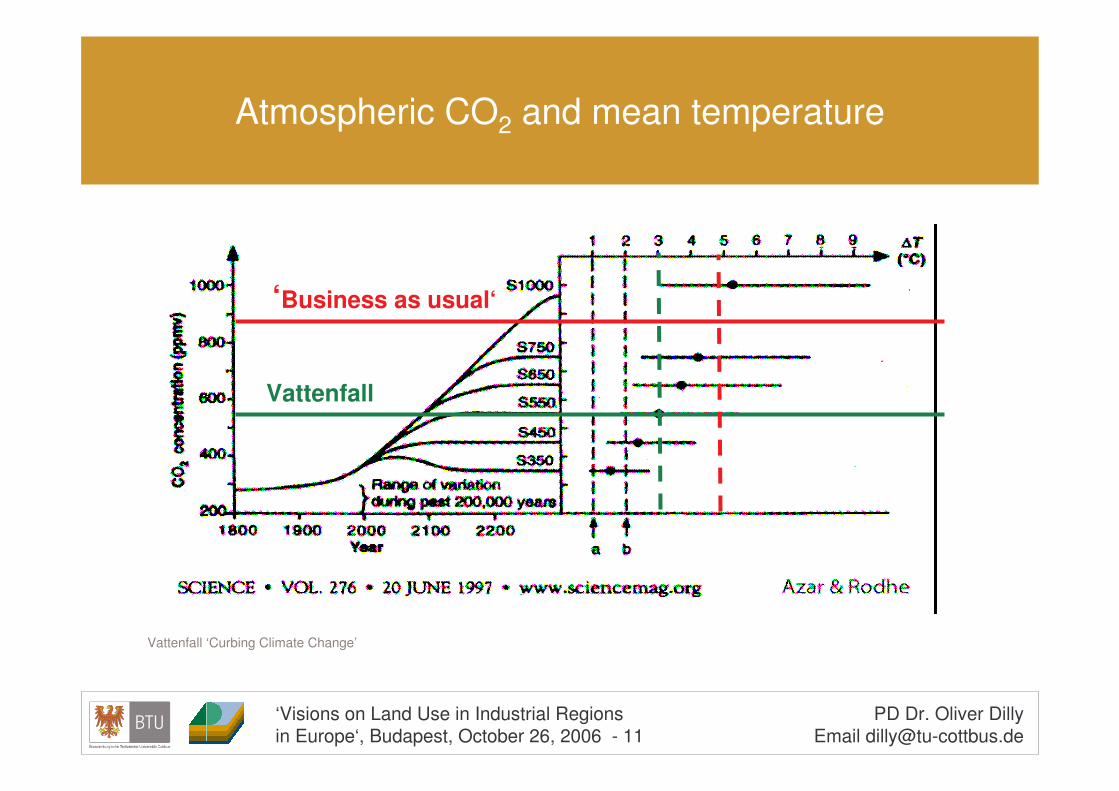
Atmospheric CO2 and mean temperature
Vattenfall ‘Curbing Climate Change’
Vattenfall
‘Business as usual‘
‘Visions on Land Use in Industrial Regions in Europe‘, Budapest, October 26, 2006 - 12
PD Dr. Oliver DillyEmail [email protected]
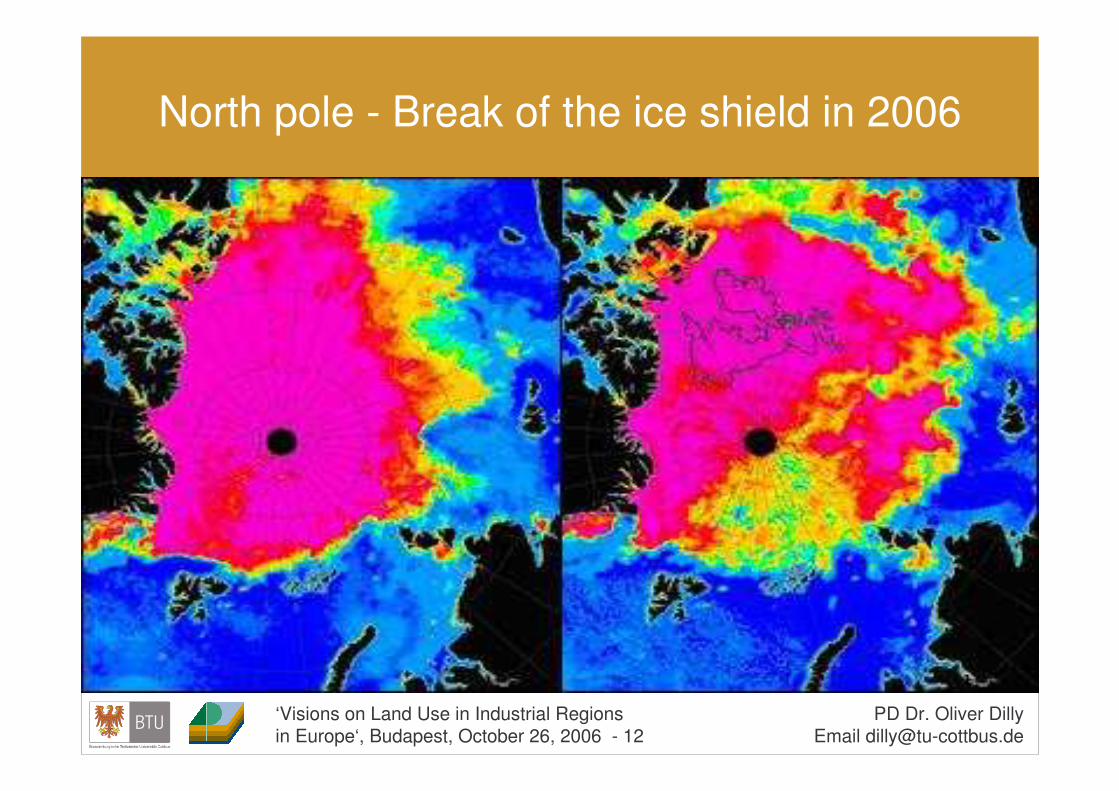
North pole - Break of the ice shield in 2006
‘Visions on Land Use in Industrial Regions in Europe‘, Budapest, October 26, 2006 - 13
PD Dr. Oliver DillyEmail [email protected]
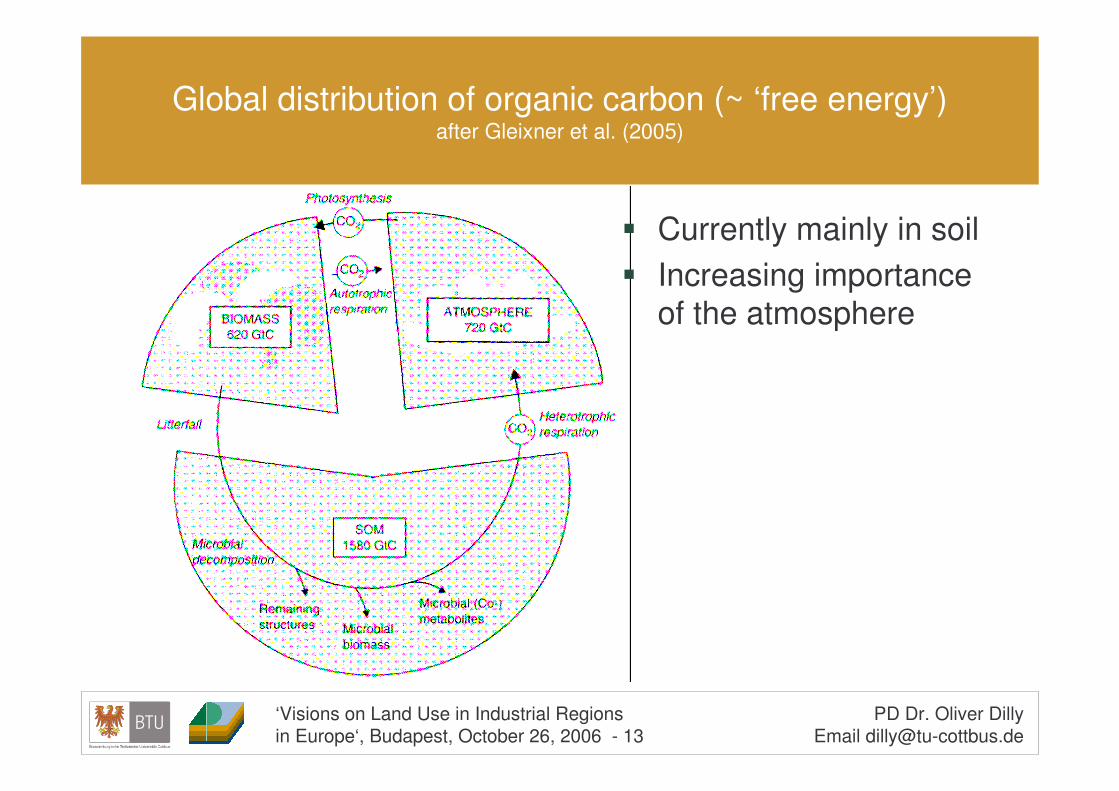
Global distribution of organic carbon (~ ‘free energy’)after Gleixner et al. (2005)
� Currently mainly in soil� Increasing importance
of the atmosphere
‘Visions on Land Use in Industrial Regions in Europe‘, Budapest, October 26, 2006 - 14
PD Dr. Oliver DillyEmail [email protected]
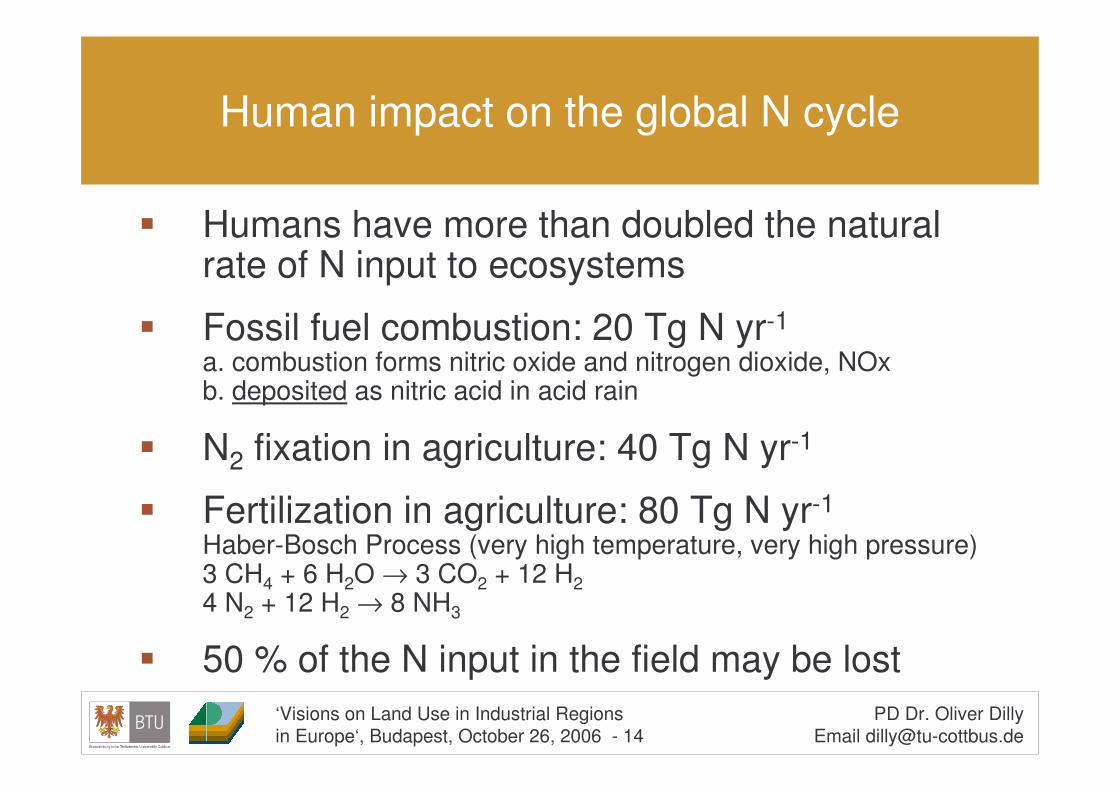
Human impact on the global N cycle
� Humans have more than doubled the natural rate of N input to ecosystems
� Fossil fuel combustion: 20 Tg N yr-1
a. combustion forms nitric oxide and nitrogen dioxide, NOxb. deposited as nitric acid in acid rain
� N2 fixation in agriculture: 40 Tg N yr-1
� Fertilization in agriculture: 80 Tg N yr-1
Haber-Bosch Process (very high temperature, very high pressure)3 CH4 + 6 H2O → 3 CO2 + 12 H24 N2 + 12 H2 → 8 NH3
� 50 % of the N input in the field may be lost
‘Visions on Land Use in Industrial Regions in Europe‘, Budapest, October 26, 2006 - 15
PD Dr. Oliver DillyEmail [email protected]
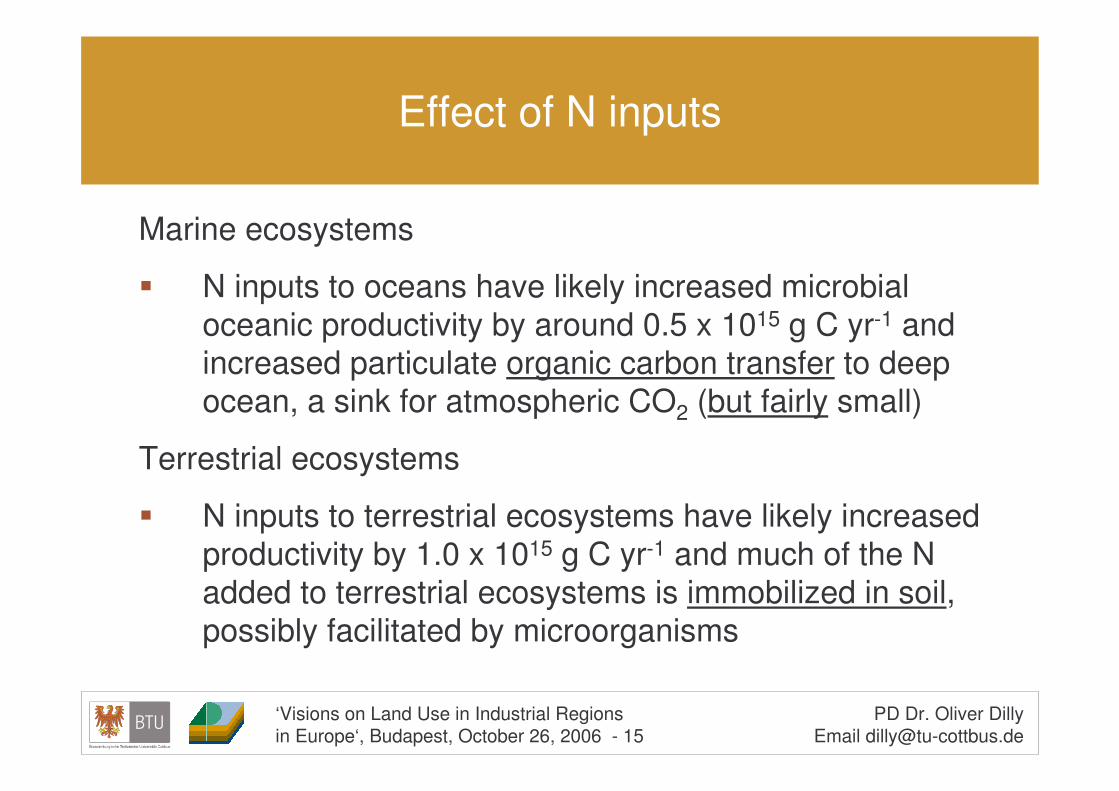
Effect of N inputs
Marine ecosystems
� N inputs to oceans have likely increased microbial oceanic productivity by around 0.5 x 10¹⁵ g C yr-1 and increased particulate organic carbon transfer to deep ocean, a sink for atmospheric CO2 (but fairly small)
Terrestrial ecosystems
� N inputs to terrestrial ecosystems have likely increased productivity by 1.0 x 10¹⁵ g C yr-1 and much of the N added to terrestrial ecosystems is immobilized in soil, possibly facilitated by microorganisms
‘Visions on Land Use in Industrial Regions in Europe‘, Budapest, October 26, 2006 - 16
PD Dr. Oliver DillyEmail [email protected]
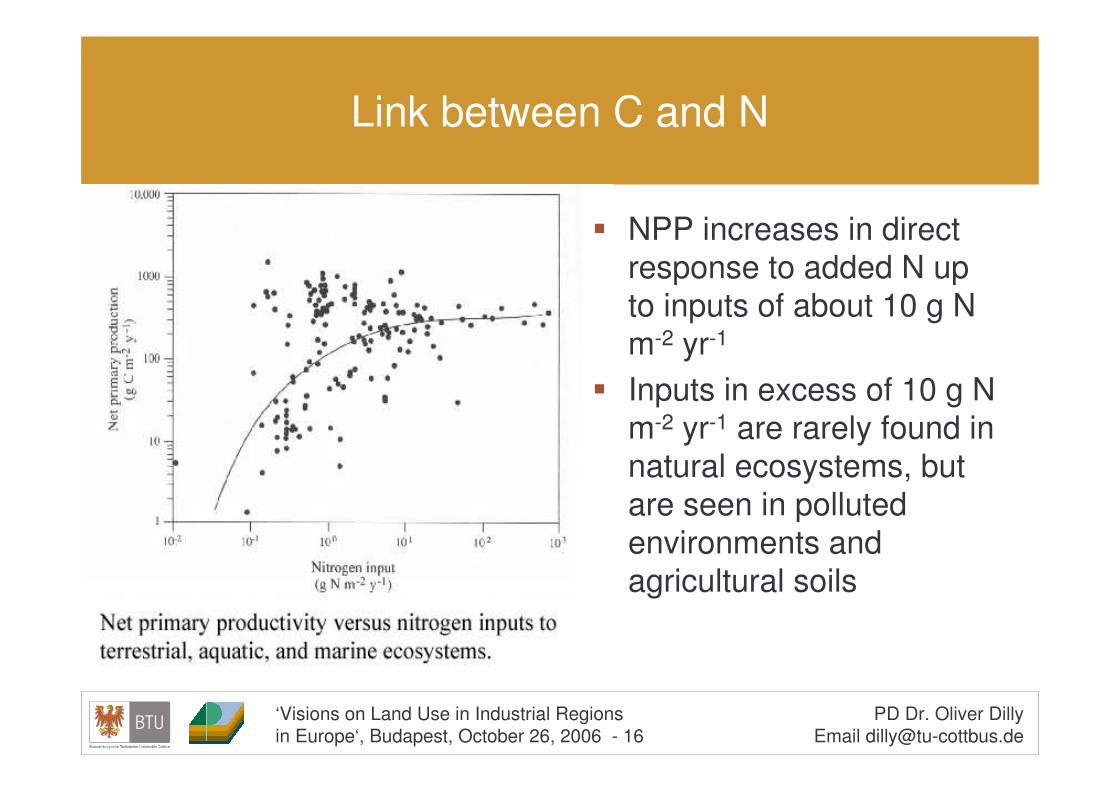
Link between C and N
� NPP increases in direct response to added N up to inputs of about 10 g N m-2 yr-1
� Inputs in excess of 10 g N m-2 yr-1 are rarely found in natural ecosystems, but are seen in polluted environments and agricultural soils
‘Visions on Land Use in Industrial Regions in Europe‘, Budapest, October 26, 2006 - 17
PD Dr. Oliver DillyEmail [email protected]
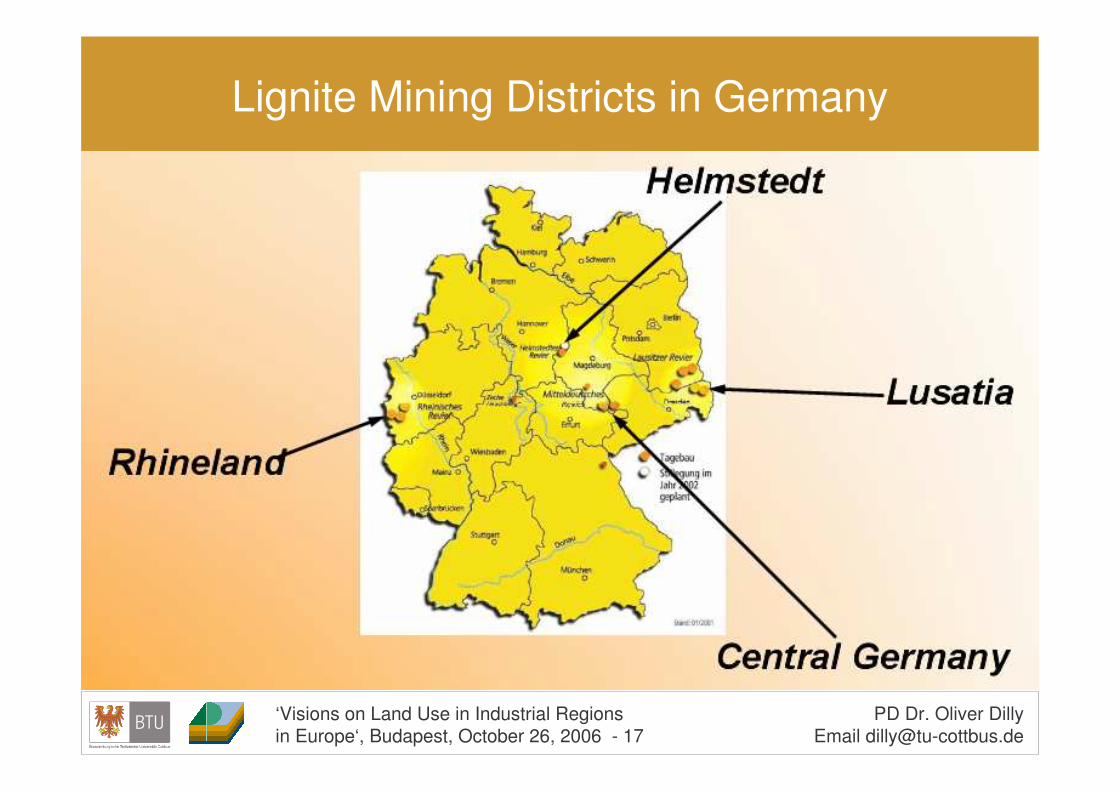
Lignite Mining Districts in Germany

‘Visions on Land Use in Industrial Regions in Europe‘, Budapest, October 26, 2006 - 18
PD Dr. Oliver DillyEmail [email protected]
Lignite mining

‘Visions on Land Use in Industrial Regions in Europe‘, Budapest, October 26, 2006 - 19
PD Dr. Oliver DillyEmail [email protected]
� Lowering of the water table on 2000 km2
� Water supply for long-distant users (e.g. Berlin)� Landscape fragmentation and soil degradation � Emigration and immigration: Loss of cultural integrity
(Decline 35 % with 30 % immigration and 65 % emigration)
� Multifunctional land use systems� Regional mining/energy industry
- Sustaining employment- Change of paradigm: fossil + regenerative energy
Post-industrial zone near Cottbus, GermanyBerlin
Cottbus
120 km
Taken from Google Earth for non-commercial use
‘Visions on Land Use in Industrial Regions in Europe‘, Budapest, October 26, 2006 - 20
PD Dr. Oliver DillyEmail [email protected]
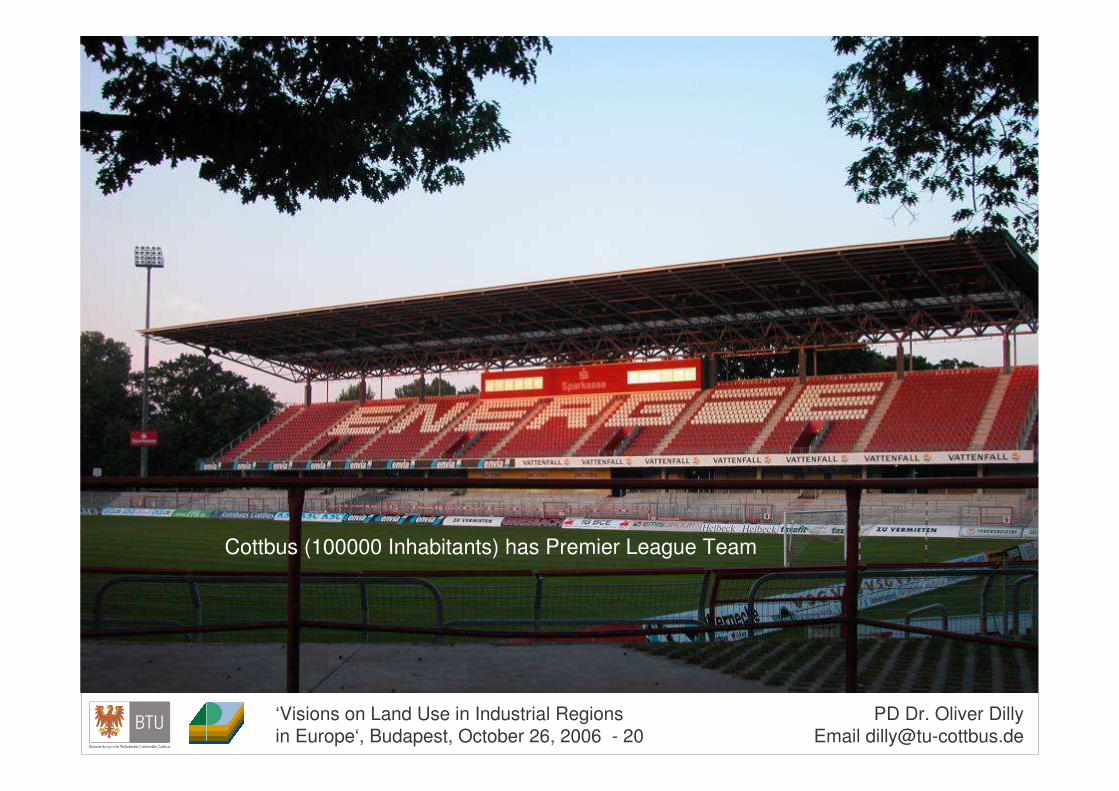
Cottbus (100000 Inhabitants) has Premier League Team

‘Visions on Land Use in Industrial Regions in Europe‘, Budapest, October 26, 2006 - 21
PD Dr. Oliver DillyEmail [email protected]
Brandenburg University of TechnologyCottbus (BTU), Germany
Chair of Soil Protection and Rehabilitation
‘Visions on Land Use in Industrial Regions in Europe‘, Budapest, October 26, 2006 - 22
PD Dr. Oliver DillyEmail [email protected]
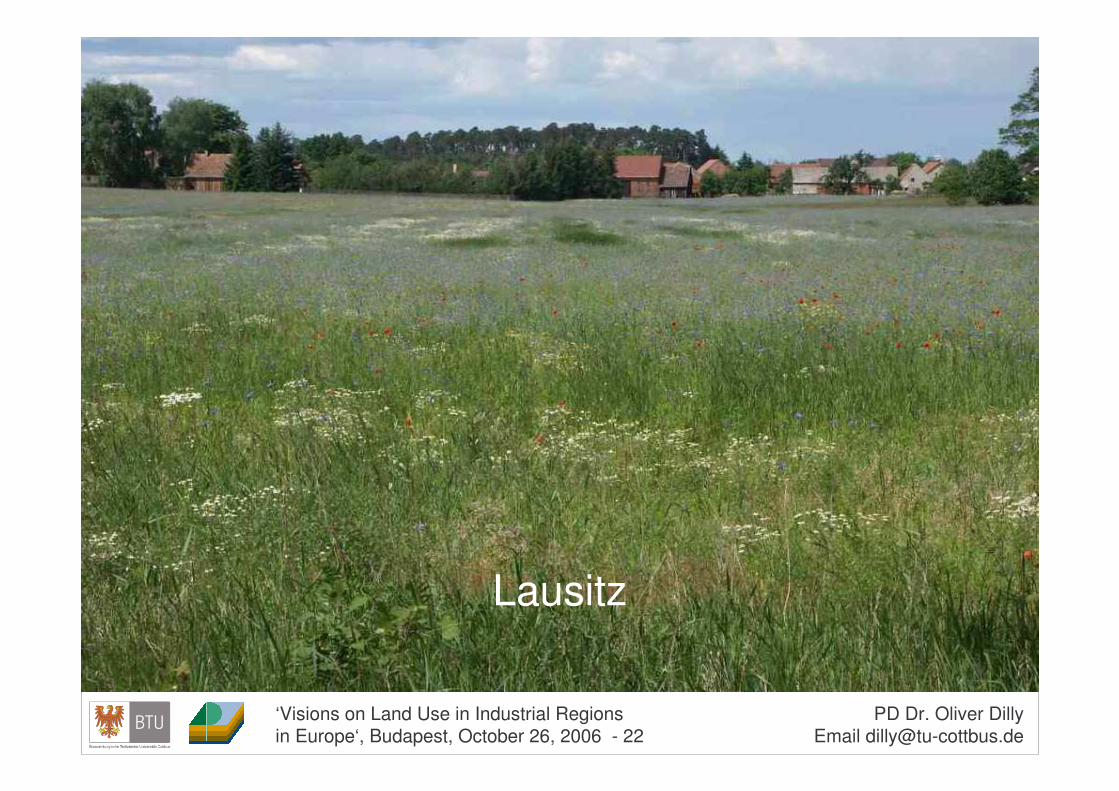
Lausitz

‘Visions on Land Use in Industrial Regions in Europe‘, Budapest, October 26, 2006 - 23
PD Dr. Oliver DillyEmail [email protected]
Post-industrial zone in Poland
Taken from Google Earth for non-commercial useTaken from Google Earth for non-commercial use
‘Visions on Land Use in Industrial Regions in Europe‘, Budapest, October 26, 2006 - 24
PD Dr. Oliver DillyEmail [email protected]
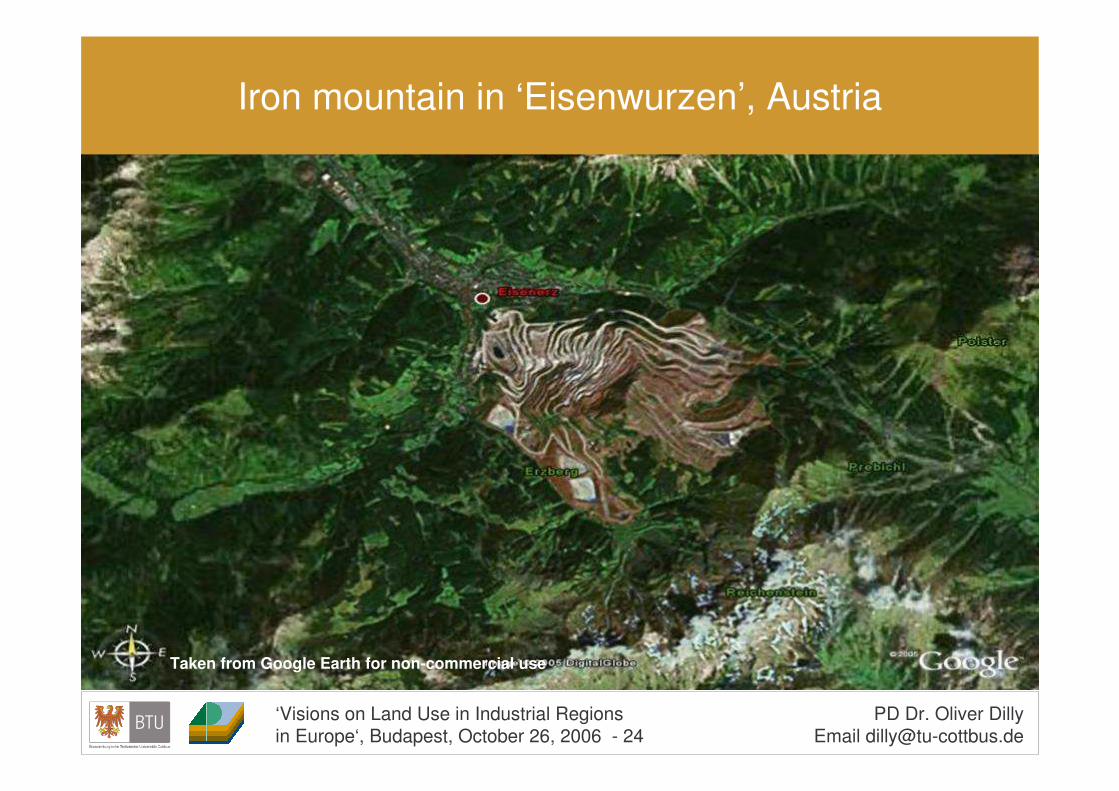
Iron mountain in ‘Eisenwurzen’, Austria
Taken from Google Earth for non-commercial use
‘Visions on Land Use in Industrial Regions in Europe‘, Budapest, October 26, 2006 - 25
PD Dr. Oliver DillyEmail [email protected]
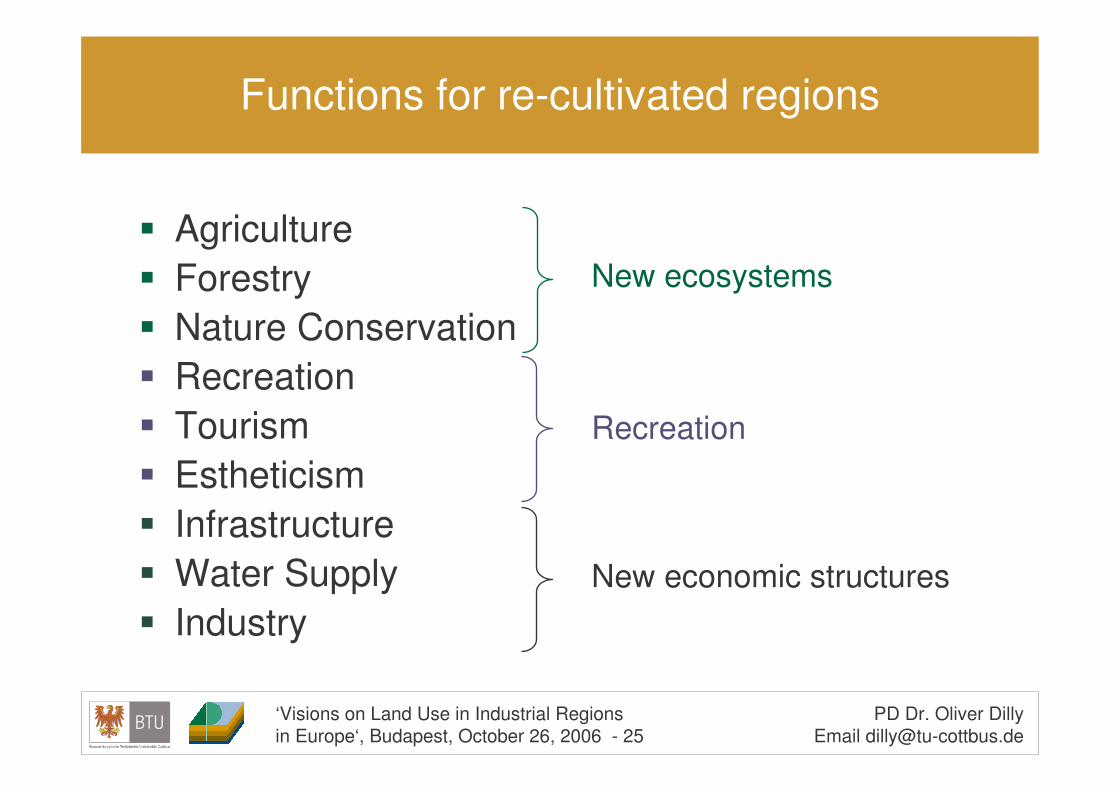
Functions for re-cultivated regions
� Agriculture� Forestry� Nature Conservation � Recreation� Tourism� Estheticism� Infrastructure� Water Supply� Industry
New ecosystems
Recreation
New economic structures

‘Visions on Land Use in Industrial Regions in Europe‘, Budapest, October 26, 2006 - 26
PD Dr. Oliver DillyEmail [email protected]
“
Nature conservation
� Integrated nature conservation, e.g. alley cropping
� Priority regions for nature conservation, e.g. succession
Photo from the archive of the Chair of Soil Protection and Recultivation, BTUC
Photo from the archive of the Chair of Soil Protection and Recultivation, BTUC
‘Visions on Land Use in Industrial Regions in Europe‘, Budapest, October 26, 2006 - 27
PD Dr. Oliver DillyEmail [email protected]
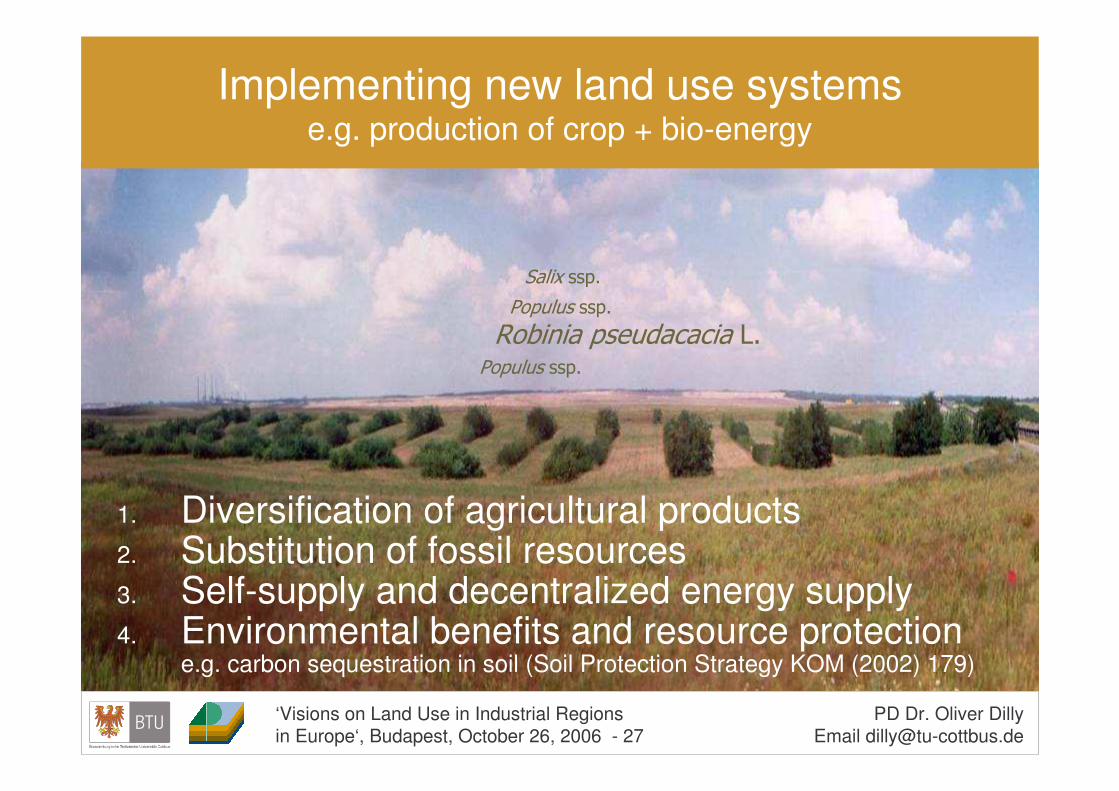
Implementing new land use systemse.g. production of crop + bio-energy
1. Diversification of agricultural products2. Substitution of fossil resources 3. Self-supply and decentralized energy supply4. Environmental benefits and resource protection
e.g. carbon sequestration in soil (Soil Protection Strategy KOM (2002) 179)
����� �!
������� � ��������� "!
����#� �!
����� �!
‘Visions on Land Use in Industrial Regions in Europe‘, Budapest, October 26, 2006 - 28
PD Dr. Oliver DillyEmail [email protected]
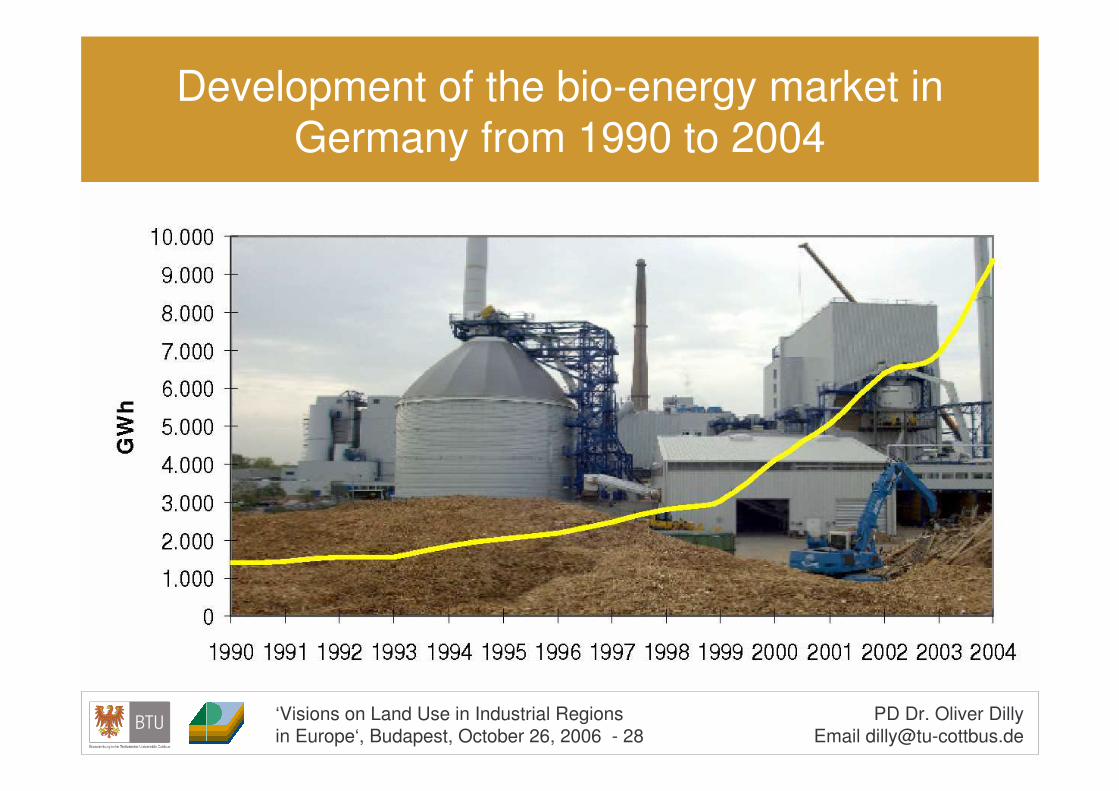
Development of the bio-energy market in Germany from 1990 to 2004

‘Visions on Land Use in Industrial Regions in Europe‘, Budapest, October 26, 2006 - 29
PD Dr. Oliver DillyEmail [email protected]
CO2
� 60 %aboveground
� 40 %belowground
5MgC•ha-1•a-1
Short-rotation plantation
CO2
� 60 %aboveground
� 40 %belowground
5MgC•ha-1•a-1
Short-rotation plantationModified after Rytter 2001
C-Sequestration
‘Visions on Land Use in Industrial Regions in Europe‘, Budapest, October 26, 2006 - 30
PD Dr. Oliver DillyEmail [email protected]
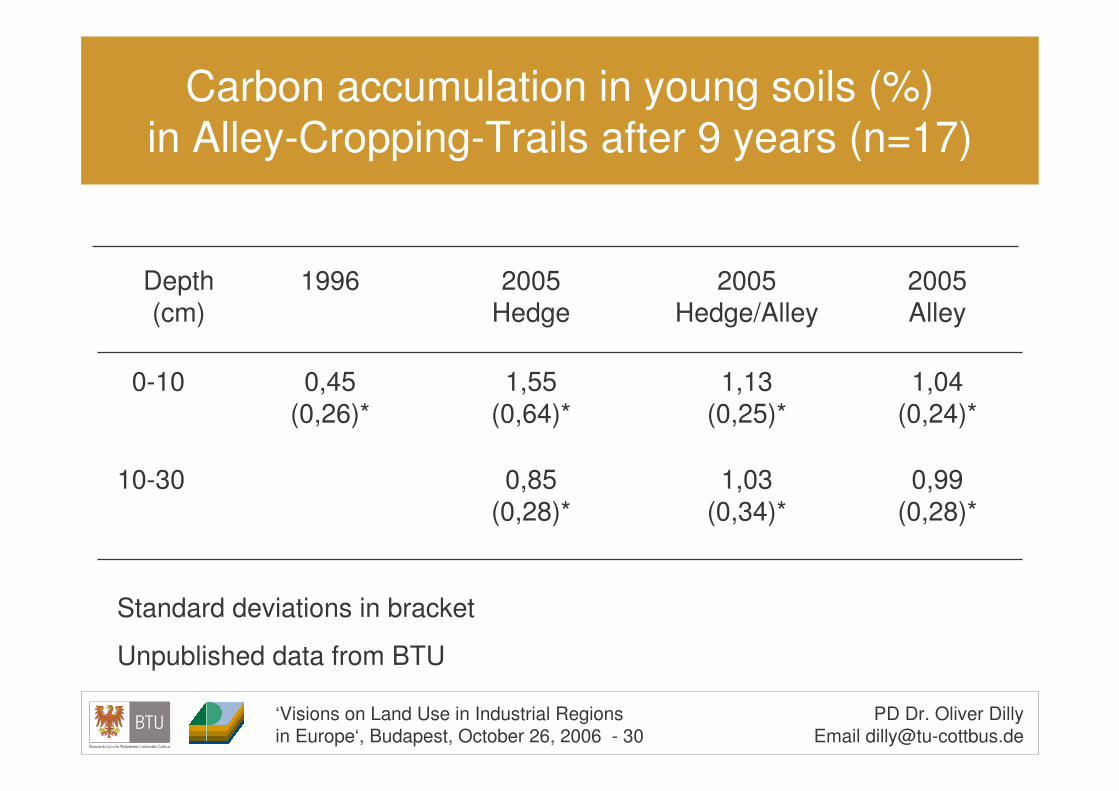
Carbon accumulation in young soils (%)in Alley-Cropping-Trails after 9 years (n=17)
2005Alley
2005Hedge/Alley
2005Hedge
1996Depth(cm)
0,99(0,28)*
1,03(0,34)*
0,85(0,28)*
10-30
1,04(0,24)*
1,13(0,25)*
1,55(0,64)*
0,45(0,26)*
0-10
Standard deviations in bracket
Unpublished data from BTU
‘Visions on Land Use in Industrial Regions in Europe‘, Budapest, October 26, 2006 - 31
PD Dr. Oliver DillyEmail [email protected]
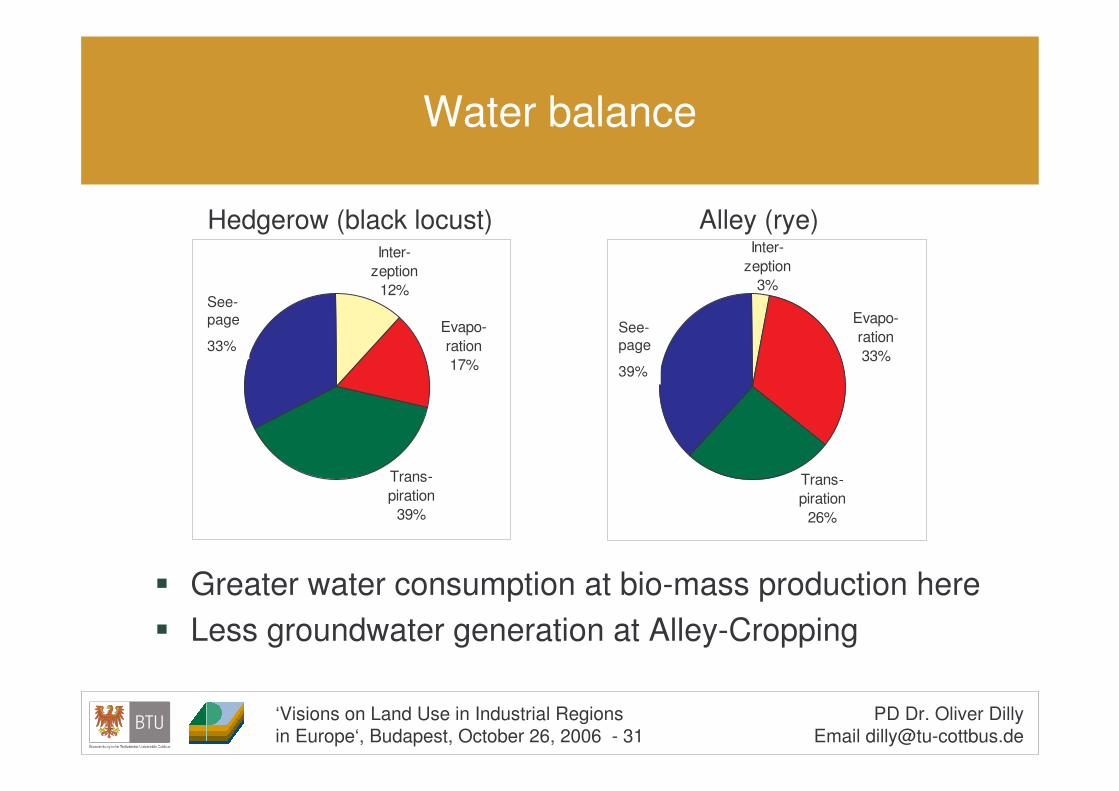
Hedgerow (black locust)
Evapo-ration17%
Inter-zeption
12%Tiefen-sicke-rung33%
Trans-piration
39%
Alley (rye)
Trans-piration
26%
Tiefen-sicke-rung39%
Inter-zeption
3%
Evapo-ration33%
See-page
33%See-page
39%
� Greater water consumption at bio-mass production here� Less groundwater generation at Alley-Cropping
Water balance
‘Visions on Land Use in Industrial Regions in Europe‘, Budapest, October 26, 2006 - 32
PD Dr. Oliver DillyEmail [email protected]
Regional advantages of bioenergy production
� Impulse for jobs and investment in rural regions(In entire Germany: 57.000 workplaces in 2004)
� Minus 84 Mio t (11 % of the German CO2 emissions)
� Vision of Germany‘s sustainability strategy: 50% of total energy supply with renewable energy by 2050
‘Visions on Land Use in Industrial Regions in Europe‘, Budapest, October 26, 2006 - 33
PD Dr. Oliver DillyEmail [email protected]
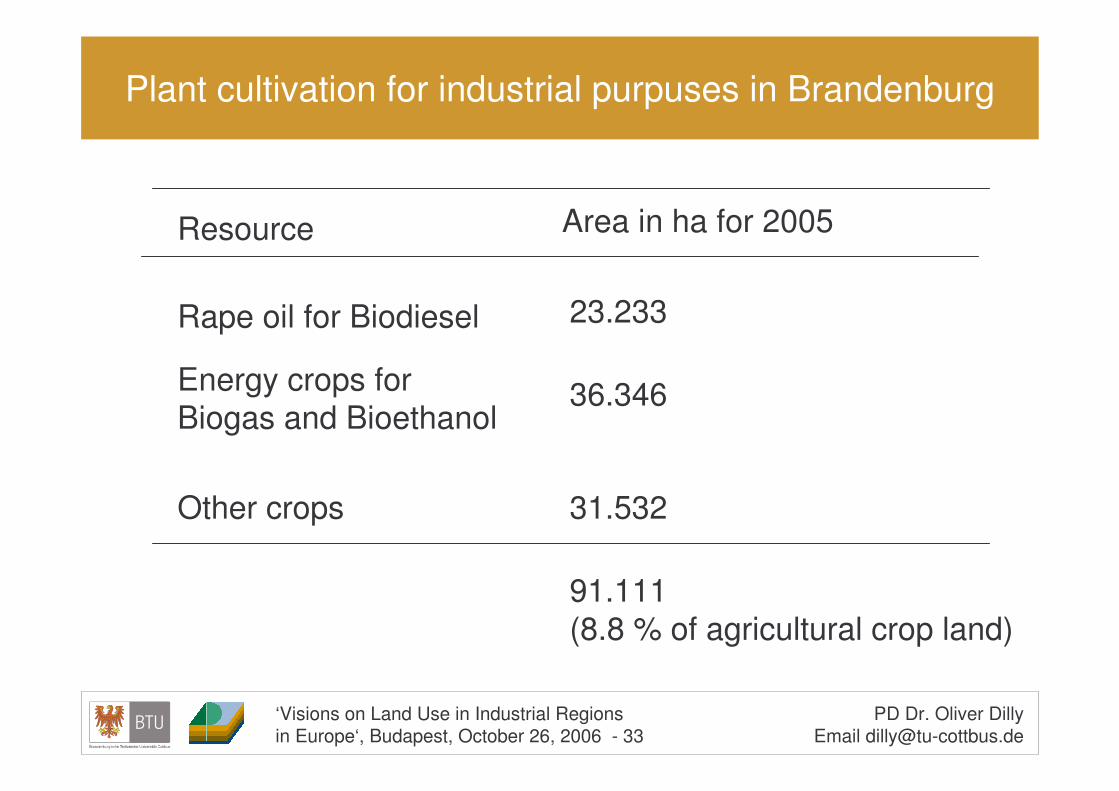
Plant cultivation for industrial purpuses in Brandenburg
Resource Area in ha for 2005
Other crops
23.233
Energy crops for Biogas and Bioethanol
31.532
91.111 (8.8 % of agricultural crop land)
Rape oil for Biodiesel
36.346
‘Visions on Land Use in Industrial Regions in Europe‘, Budapest, October 26, 2006 - 34
PD Dr. Oliver DillyEmail [email protected]
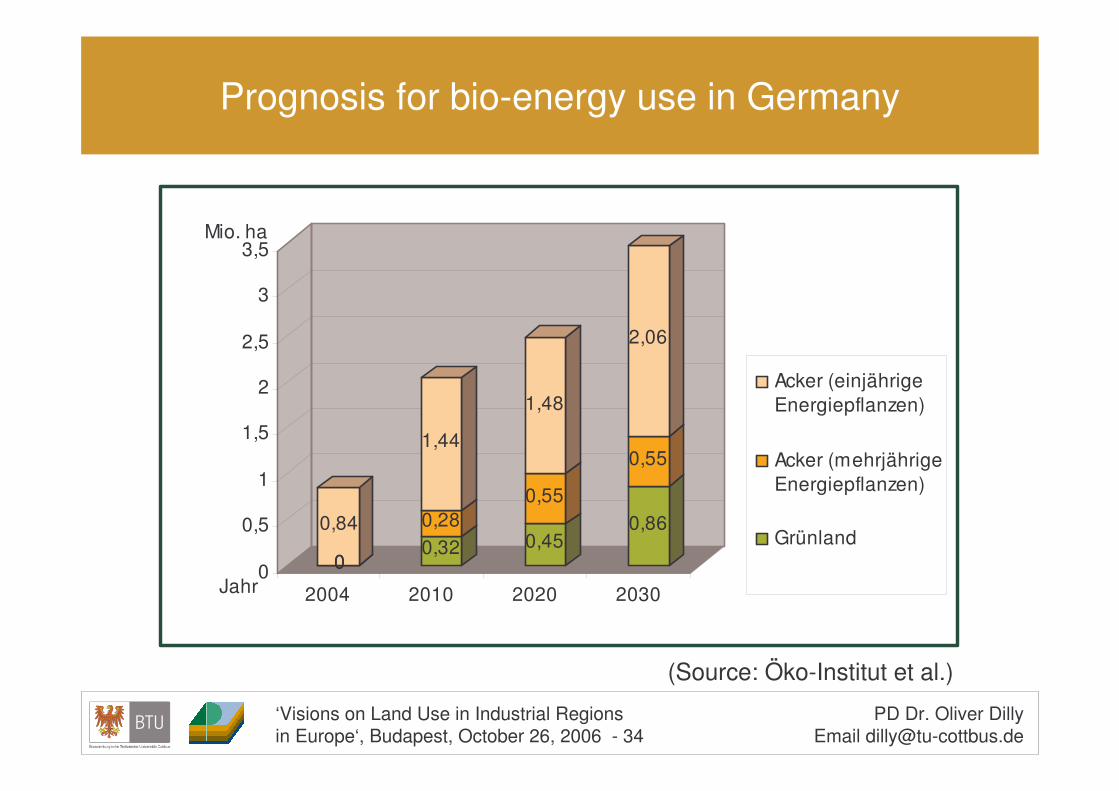
Prognosis for bio-energy use in Germany
00
0,840,320,28
1,44
0,45
0,55
1,48
0,86
0,55
2,06
0
0,5
1
1,5
2
2,5
3
3,5Mio. ha
2004 2010 2020 2030
Acker (einjährigeEnergiepflanzen)
Acker (mehrjährigeEnergiepflanzen)
Grünland
Jahr
(Source: Öko-Institut et al.)
‘Visions on Land Use in Industrial Regions in Europe‘, Budapest, October 26, 2006 - 35
PD Dr. Oliver DillyEmail [email protected]
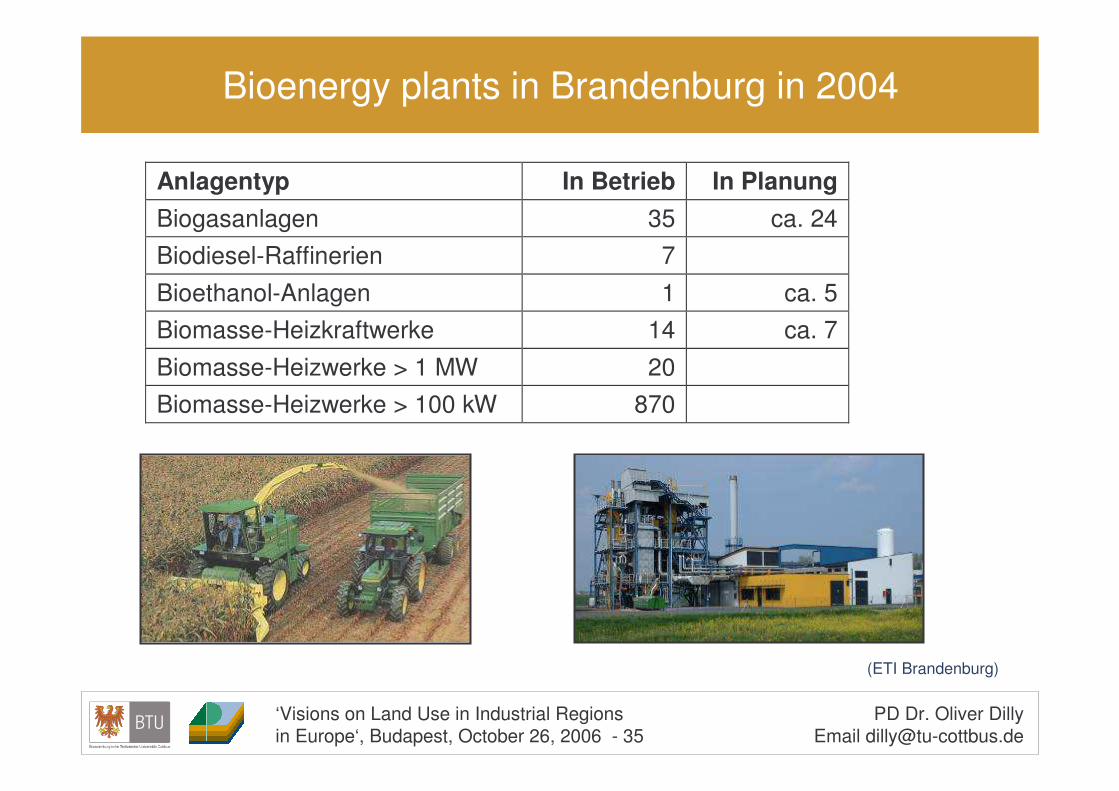
Bioenergy plants in Brandenburg in 2004
Anlagentyp In Betrieb In Planung Biogasanlagen 35 ca. 24 Biodiesel-Raffinerien 7 Bioethanol-Anlagen 1 ca. 5 Biomasse-Heizkraftwerke 14 ca. 7 Biomasse-Heizwerke > 1 MW 20 Biomasse-Heizwerke > 100 kW 870 �
(ETI Brandenburg)
‘Visions on Land Use in Industrial Regions in Europe‘, Budapest, October 26, 2006 - 36
PD Dr. Oliver DillyEmail [email protected]
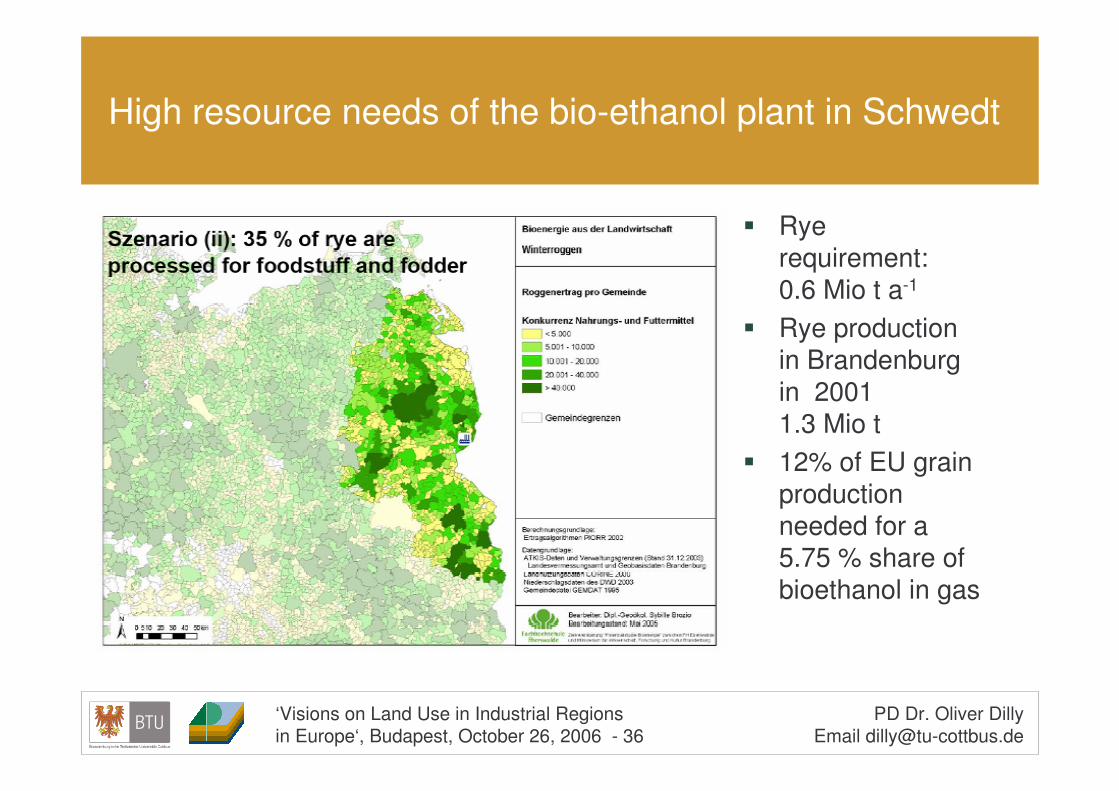
High resource needs of the bio-ethanol plant in Schwedt
� Rye requirement: 0.6 Mio t a-1
� Rye production in Brandenburg in 20011.3 Mio t
� 12% of EU grain production needed for a 5.75 % share of bioethanol in gas
‘Visions on Land Use in Industrial Regions in Europe‘, Budapest, October 26, 2006 - 37
PD Dr. Oliver DillyEmail [email protected]
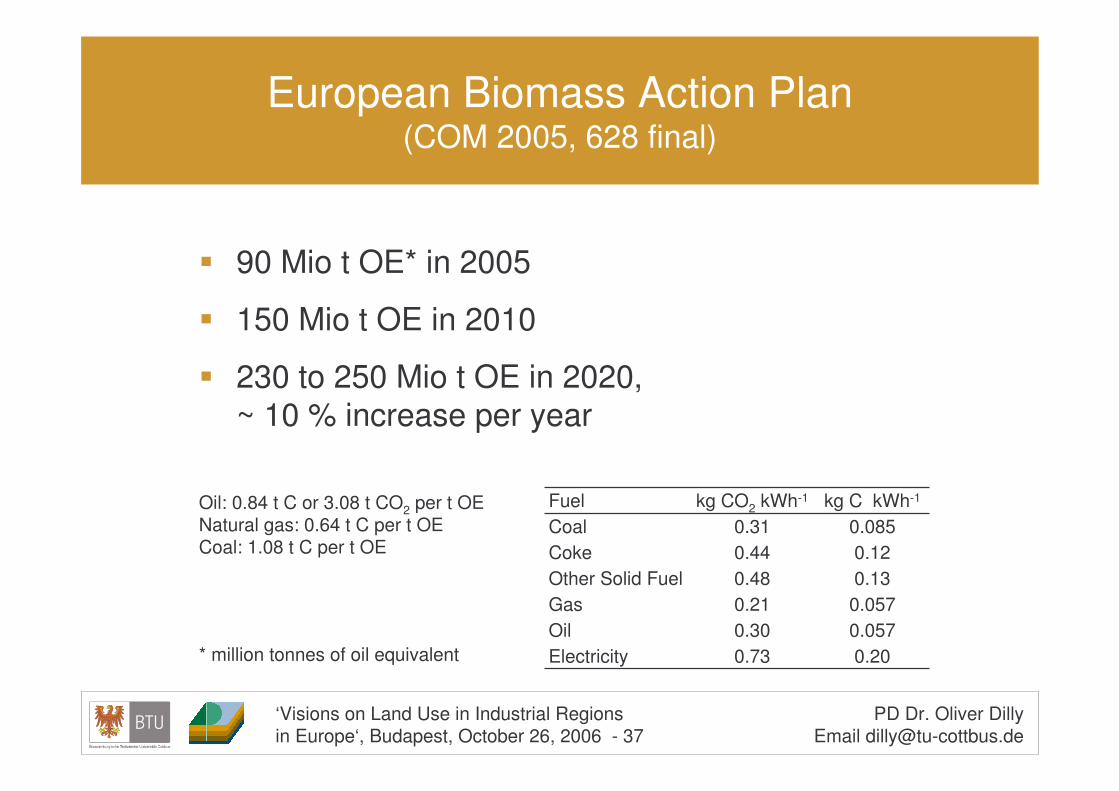
European Biomass Action Plan (COM 2005, 628 final)
� 90 Mio t OE* in 2005
� 150 Mio t OE in 2010
� 230 to 250 Mio t OE in 2020, ~ 10 % increase per year
* million tonnes of oil equivalent
Oil: 0.84 t C or 3.08 t CO2 per t OE Natural gas: 0.64 t C per t OECoal: 1.08 t C per t OE
0.200.73Electricity0.0570.30Oil0.0570.21Gas0.130.48Other Solid Fuel0.120.44Coke0.0850.31Coal
kg C kWh-1kg CO2 kWh-1Fuel
‘Visions on Land Use in Industrial Regions in Europe‘, Budapest, October 26, 2006 - 38
PD Dr. Oliver DillyEmail [email protected]
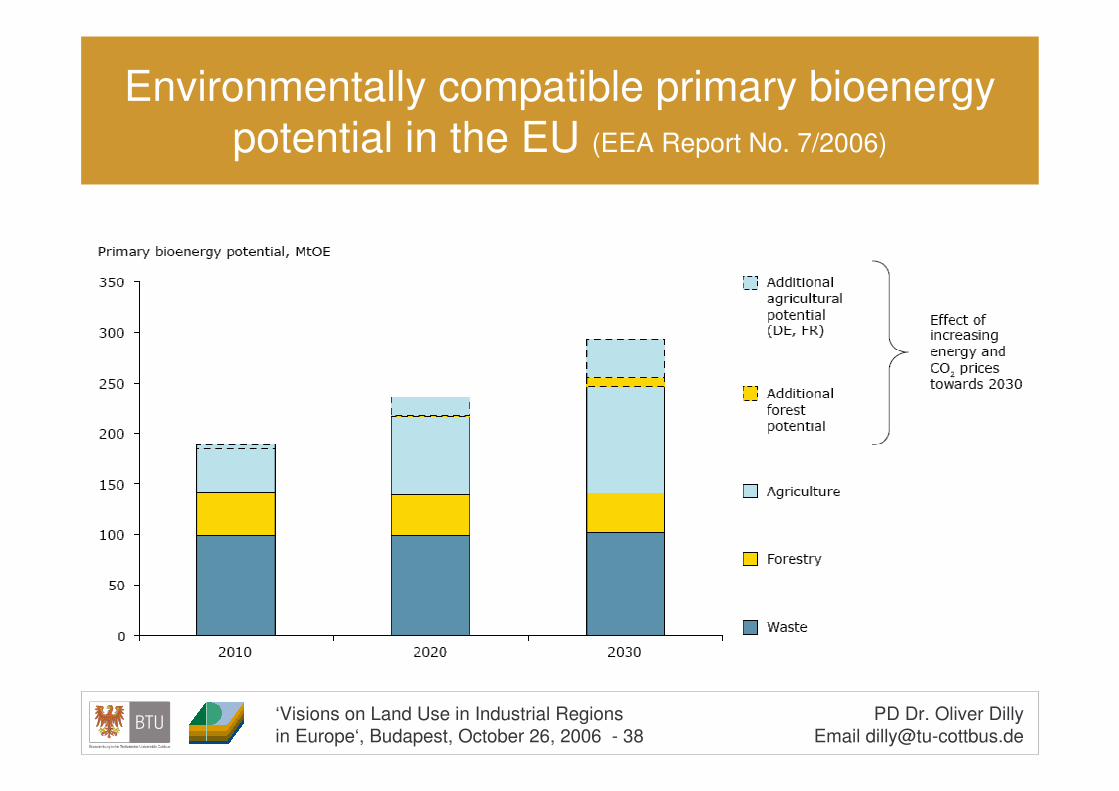
Environmentally compatible primary bioenergypotential in the EU (EEA Report No. 7/2006)

‘Visions on Land Use in Industrial Regions in Europe‘, Budapest, October 26, 2006 - 39
PD Dr. Oliver DillyEmail [email protected]
Risks when producing too much bioenergy(EEA Report No. 7/2006)
� Soil erosion
� Soil compaction
� Nutrient leaching
� Water deficiency
� Salinisation
� Loss in biodiversity of cultivated plants

‘Visions on Land Use in Industrial Regions in Europe‘, Budapest, October 26, 2006 - 40
PD Dr. Oliver DillyEmail [email protected]
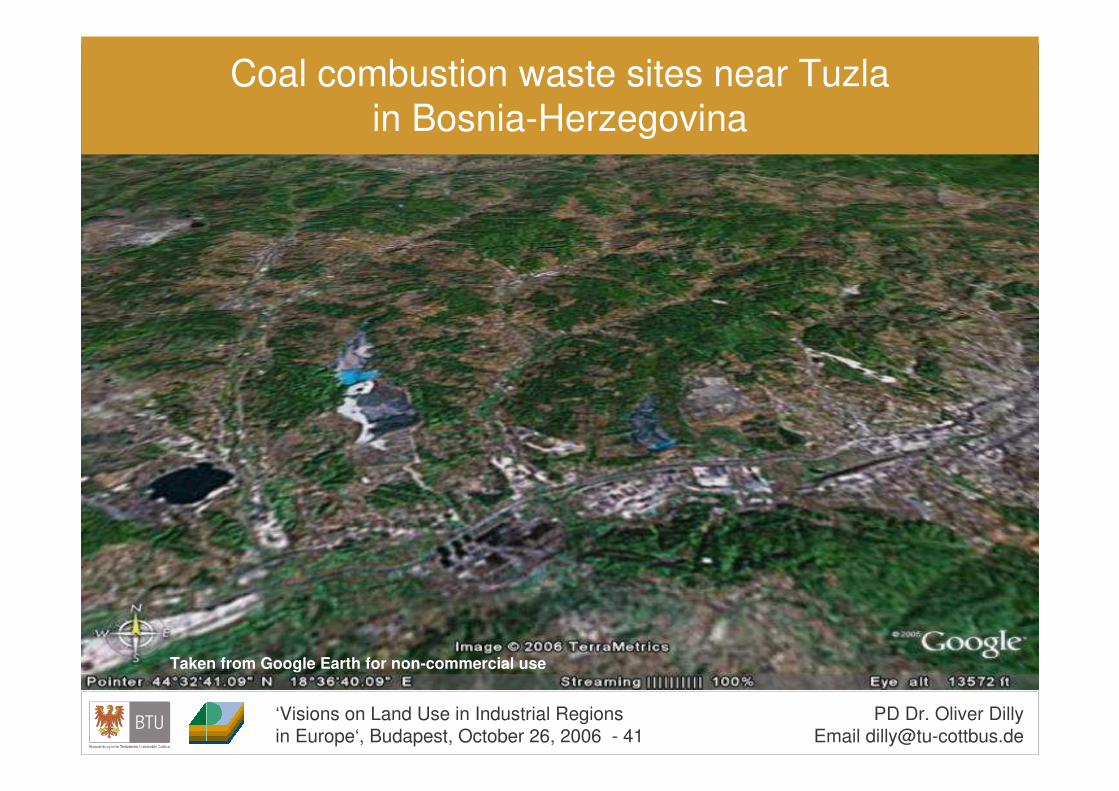
Coal combustion waste sites near Tuzla in Bosnia-Herzegovina
Power Plant Tuzla
45 ha
N
1000 m
Divkovici
Drežnik
Jezero
Plane
Figure by Frank Repmann, mod.
‘Visions on Land Use in Industrial Regions in Europe‘, Budapest, October 26, 2006 - 41
PD Dr. Oliver DillyEmail [email protected]
Coal combustion waste sites near Tuzla in Bosnia-Herzegovina
Taken from Google Earth for non-commercial use

‘Visions on Land Use in Industrial Regions in Europe‘, Budapest, October 26, 2006 - 42
PD Dr. Oliver DillyEmail [email protected]
Plane, near Tuzla in Bosnia-Herzegovina
Photo by Frank Repmann
‘Visions on Land Use in Industrial Regions in Europe‘, Budapest, October 26, 2006 - 43
PD Dr. Oliver DillyEmail [email protected]
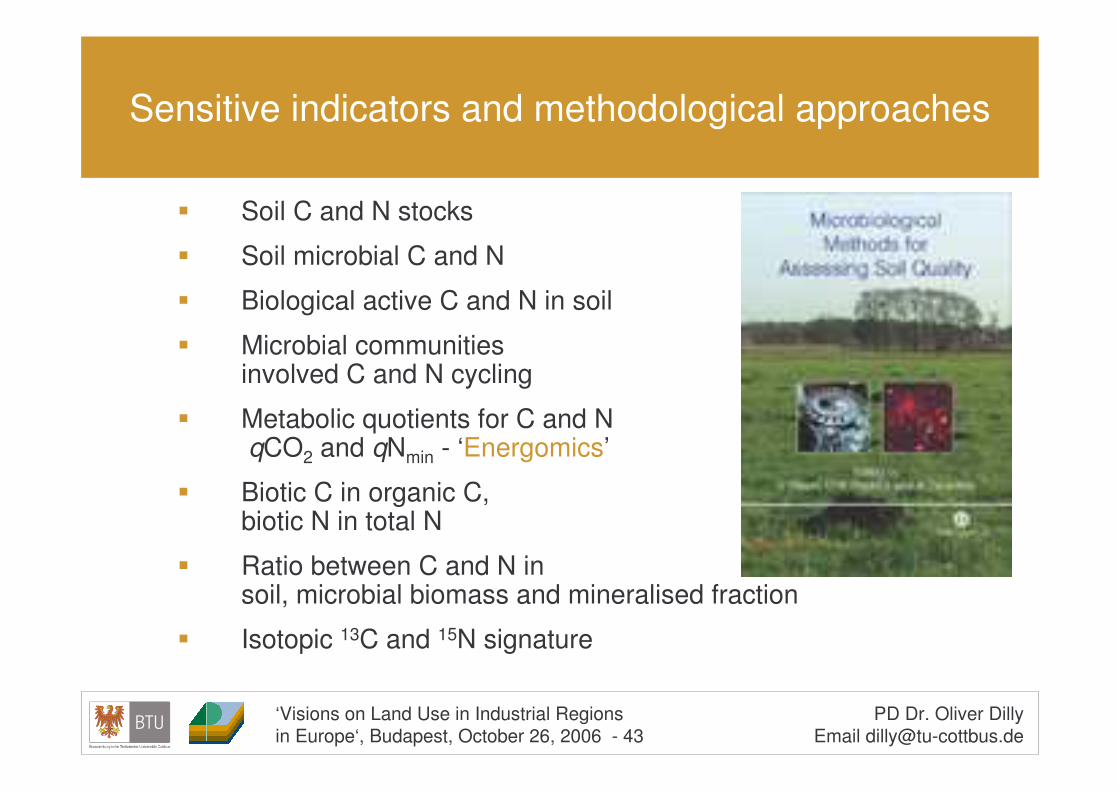
Sensitive indicators and methodological approaches
� Soil C and N stocks
� Soil microbial C and N
� Biological active C and N in soil
� Microbial communities involved C and N cycling
� Metabolic quotients for C and NqCO2 and qNmin - ‘Energomics’
� Biotic C in organic C, biotic N in total N
� Ratio between C and N in soil, microbial biomass and mineralised fraction
� Isotopic 13C and 15N signature
‘Visions on Land Use in Industrial Regions in Europe‘, Budapest, October 26, 2006 - 44
PD Dr. Oliver DillyEmail [email protected]
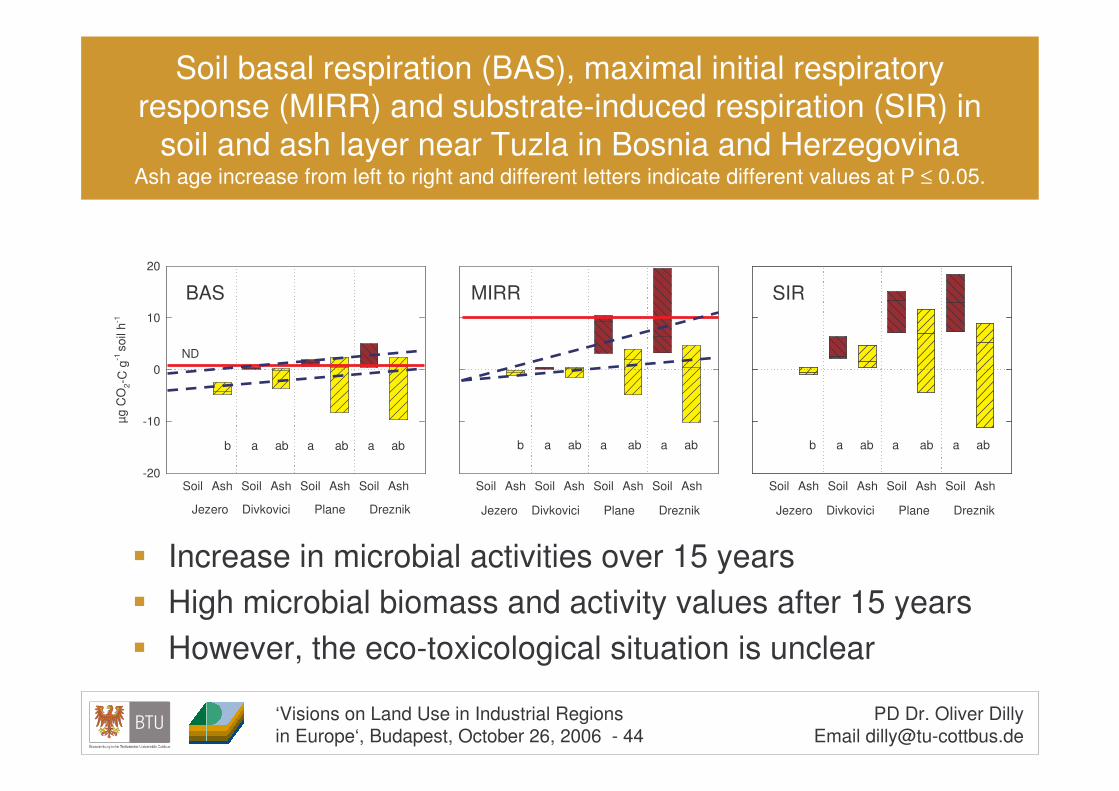
Soil basal respiration (BAS), maximal initial respiratory response (MIRR) and substrate-induced respiration (SIR) in
soil and ash layer near Tuzla in Bosnia and HerzegovinaAsh age increase from left to right and different letters indicate different values at P ≤ 0.05.
� Increase in microbial activities over 15 years� High microbial biomass and activity values after 15 years� However, the eco-toxicological situation is unclear
MIRR
Jezero Divkovici Plane Dreznik
Soil Ash Soil Ash Soil Ash Soil Ash
BAS
Jezero Divkovici Plane Dreznik
Soil Ash Soil Ash Soil Ash Soil Ash
µg C
O2-
C g
-1 so
il h-1
-20
-10
0
10
20
ND
b a a ab a abab
SIR
Jezero Divkovici Plane Dreznik
Soil Ash Soil Ash Soil Ash Soil Ash
b a a ab a abab b a a ab a abab

‘Visions on Land Use in Industrial Regions in Europe‘, Budapest, October 26, 2006 - 45
PD Dr. Oliver DillyEmail [email protected]
����������
�
��
�
��
��
���
���
� ��� ��� �� �� ��� ���
�������������������
���
Relationship between area of abandoned lands and soil quality index in Silesia, Poland
‘Visions on Land Use in Industrial Regions in Europe‘, Budapest, October 26, 2006 - 46
PD Dr. Oliver DillyEmail [email protected]
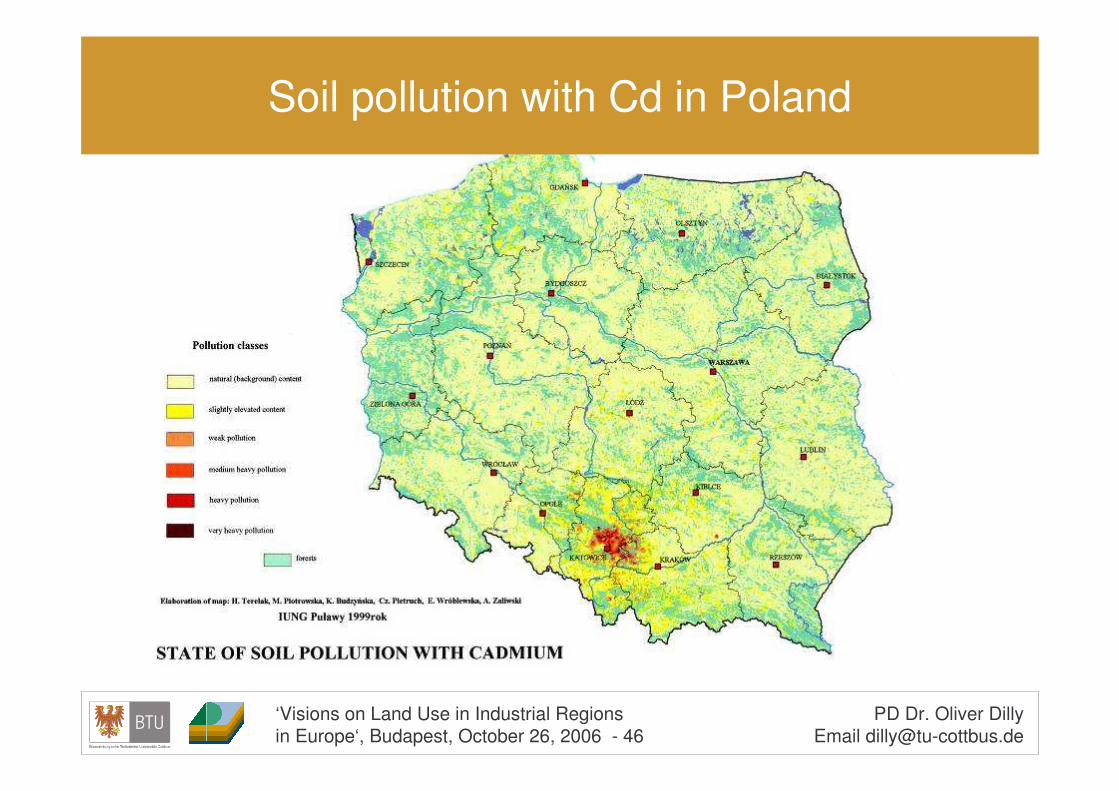
Soil pollution with Cd in Poland

‘Visions on Land Use in Industrial Regions in Europe‘, Budapest, October 26, 2006 - 47
PD Dr. Oliver DillyEmail [email protected]
Land abandonment relative to soil pollution with heavy metals in 2002 and 2005 in Silesia, Poland
� Decrease in abandonment land due to European Agricultural Policy
Lead
Arable land [ha]
Abandoned land [ha]
2002
Abandoned land [ha]
2005
difference 2002-2005
[ha]
% change 2002-2005
Non polluted (0 - 50) 70228 8424 7012 -1412 -16,8Elevated levels (50 - 100) 18758 1953 1562 -391 -20,0Above legal threshold (>100) 4305 475 410 -65 -13,7CadmiumNon polluted (0 -1) 63115 7582 6355 -1227 -16,2Elevated levels (1-4) 27958 3054 2437 -617 -20,2Above legal threshold (>4) 2218 216 192 -24 -11,1ZincNon polluted (0 - 100) 58750 7306 6104 -1202 -16,5Elevated levels (100-300) 29070 3044 2466 -578 -19,0Above legal threshold (>300) 5471 502 414 -88 -17,5
‘Visions on Land Use in Industrial Regions in Europe‘, Budapest, October 26, 2006 - 48
PD Dr. Oliver DillyEmail [email protected]
Summary
1. Multifunctional optimisation of land, e.g. for food + energy and tourism.
2. Research needed to study the impact of land-use changes, e.g. for bio-energy production, on cross-cutting ecological, social and economic issues.
3. Special attention needs to be given on contaminated sites, e.g. when used for food production.
‘Visions on Land Use in Industrial Regions in Europe‘, Budapest, October 26, 2006 - 49
PD Dr. Oliver DillyEmail [email protected]
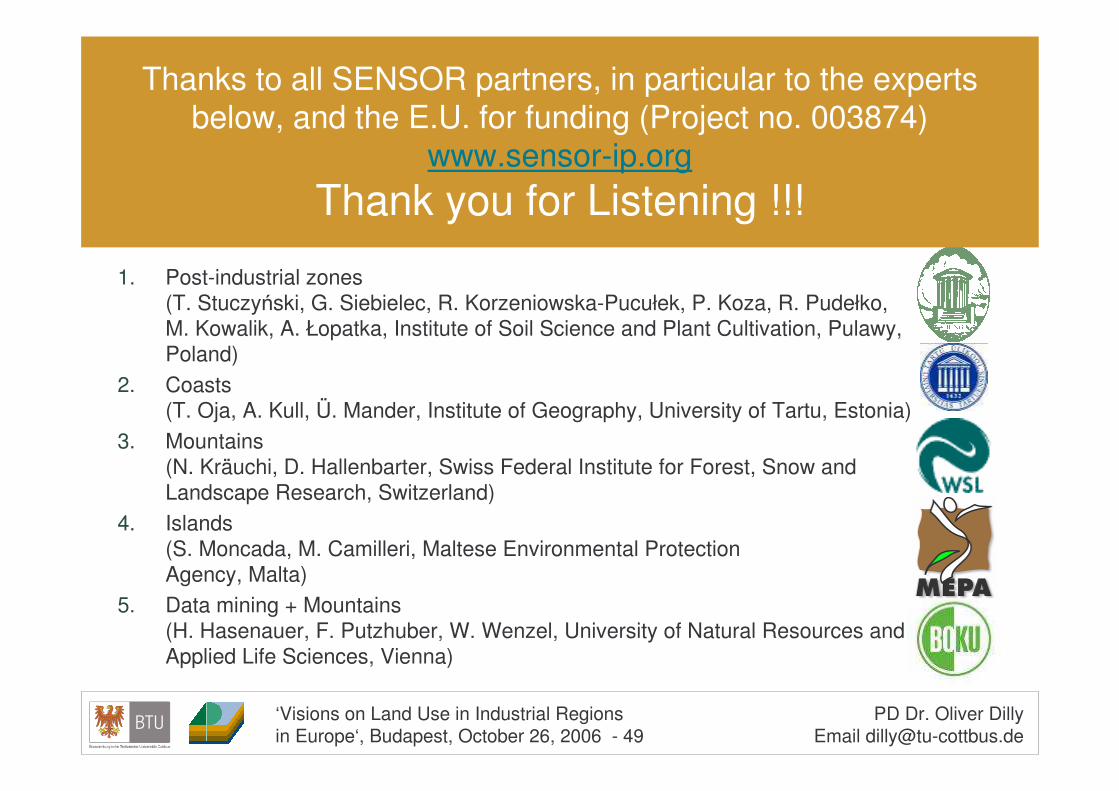
Thanks to all SENSOR partners, in particular to the experts below, and the E.U. for funding (Project no. 003874)
www.sensor-ip.orgThank you for Listening !!!
1. Post-industrial zones (T. Stuczy�ski, G. Siebielec, R. Korzeniowska-Pucułek, P. Koza, R. Pudełko, M. Kowalik, A. Łopatka, Institute of Soil Science and Plant Cultivation, Pulawy, Poland)
2. Coasts(T. Oja, A. Kull, Ü. Mander, Institute of Geography, University of Tartu, Estonia)
3. Mountains(N. Kräuchi, D. Hallenbarter, Swiss Federal Institute for Forest, Snow and Landscape Research, Switzerland)
4. Islands(S. Moncada, M. Camilleri, Maltese Environmental ProtectionAgency, Malta)
5. Data mining + Mountains(H. Hasenauer, F. Putzhuber, W. Wenzel, University of Natural Resources and Applied Life Sciences, Vienna)