microsoft core infrastructure overview
DESCRIPTION
Overview of Microsoft Optimized Infrastructure ValueTRANSCRIPT

1
Taking the Core Infrastructure Optimization Journey
1
STA
ND
AR
DIZ
ED
BA
SIC
RA
TIO
NA
LIZ
ED
DY
NA
MIC
Identity & Access Management
Desktop, Device& Server Management
Security & Networking
Data Protection& Recovery
Jessie L. Anderson III Strategic Engagement ManagerMicrosoft Corporation
2
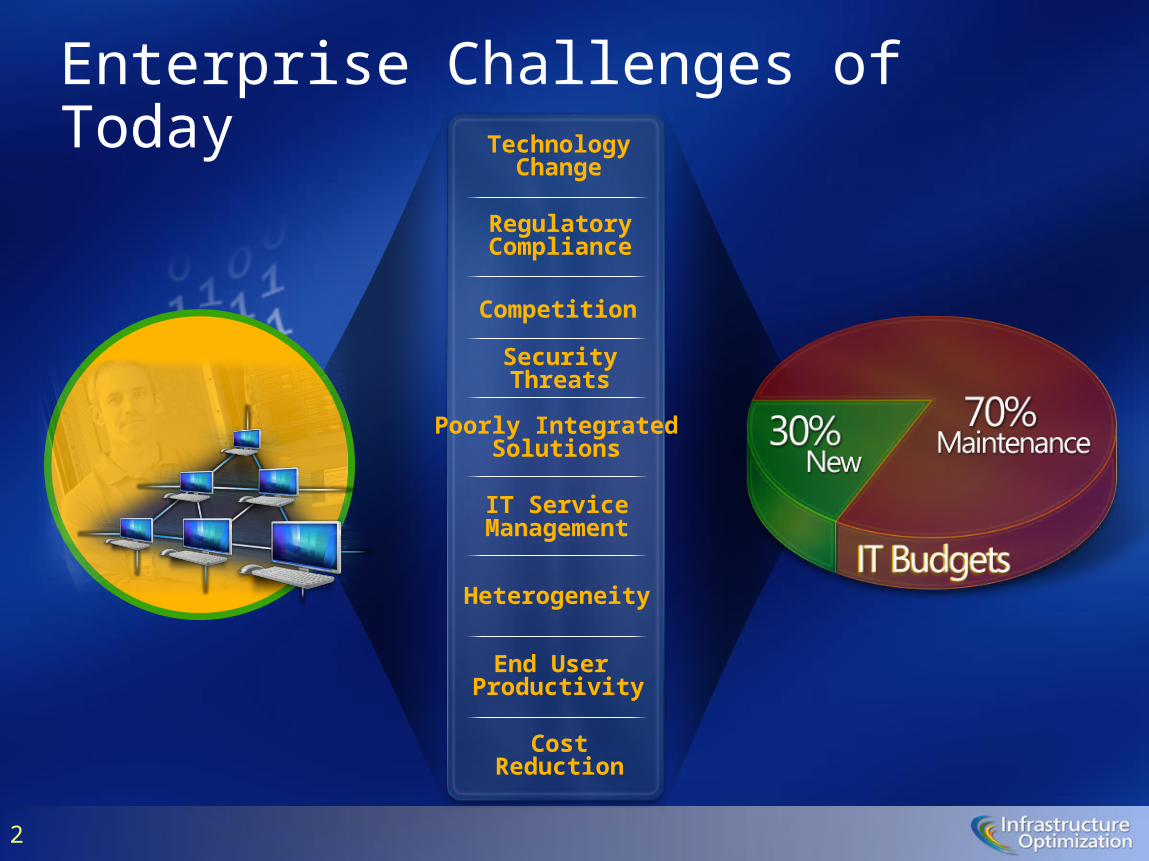
End User Productivity
Poorly IntegratedSolutions
SecurityThreats
Competition
TechnologyChange
RegulatoryCompliance
CostReduction
Heterogeneity
IT ServiceManagement
Enterprise Challenges of Today

3
Information technology fuelsprofitable revenue growth
Linking Your Infrastructure to the Business
Companies in the top 25% of IT capability grew revenue 6.8% faster per year than their peers in the bottom 25% of IT capability.
The firms in the top 25% of IT capability enjoy 23% higher revenue per employee than their peers in the bottom 25% of IT capability.
Isolating the impact of all IT functions on Productivity shows that IT Infrastructure is a key determinant of superior productivity.
Managers in firms that are supported by better information systems have significantly better insight into, and control over, key dimensions of their business.
Source: Enterprise IT Capabilities and Business Performance, Marco Iansiti, David Sarnoff Professor of Business Administration, Harvard Business School George Favaloro, Principal, Keystone Strategy, Inc-March 2006
Firms with better IT havemore productive employees
Robust IT infrastructure is akey driver of productivityand growth
Information technologygives managers more insightand control

4
Key Enablers
• Network Access
• Identity• Presence• Rights
Management
• Portals• Search• Messaging• Forms
Optimization CapabilitiesApplication Platform Optimization Model
Business Intelligence
Enterprise Content Management
Collaboration
Unified Communications
Enterprise Search
Business Productivity Infrastructure Optimization Model
Development
SOA and Business Process
Business Intelligence
User Experience
Data Management
Data Protection and Recovery
Desktop, Device, and Server Mgmt
Identity and Access Management
Security and Networking
Core Infrastructure Optimization ModelIT a
nd
Secu
rity
Pro
cess
BA
SIC
STA
ND
AR
DIZ
ED
RATIO
NA
LIZED
DYN
AM
IC
BA
SIC
STA
ND
AR
DIZ
ED
RATIO
NA
LIZED
DYN
AM
IC
BA
SIC
STA
ND
AR
DIZ
ED
AD
VA
NC
ED
DYN
AM
IC

5
Capability Overview for Infrastructure
6
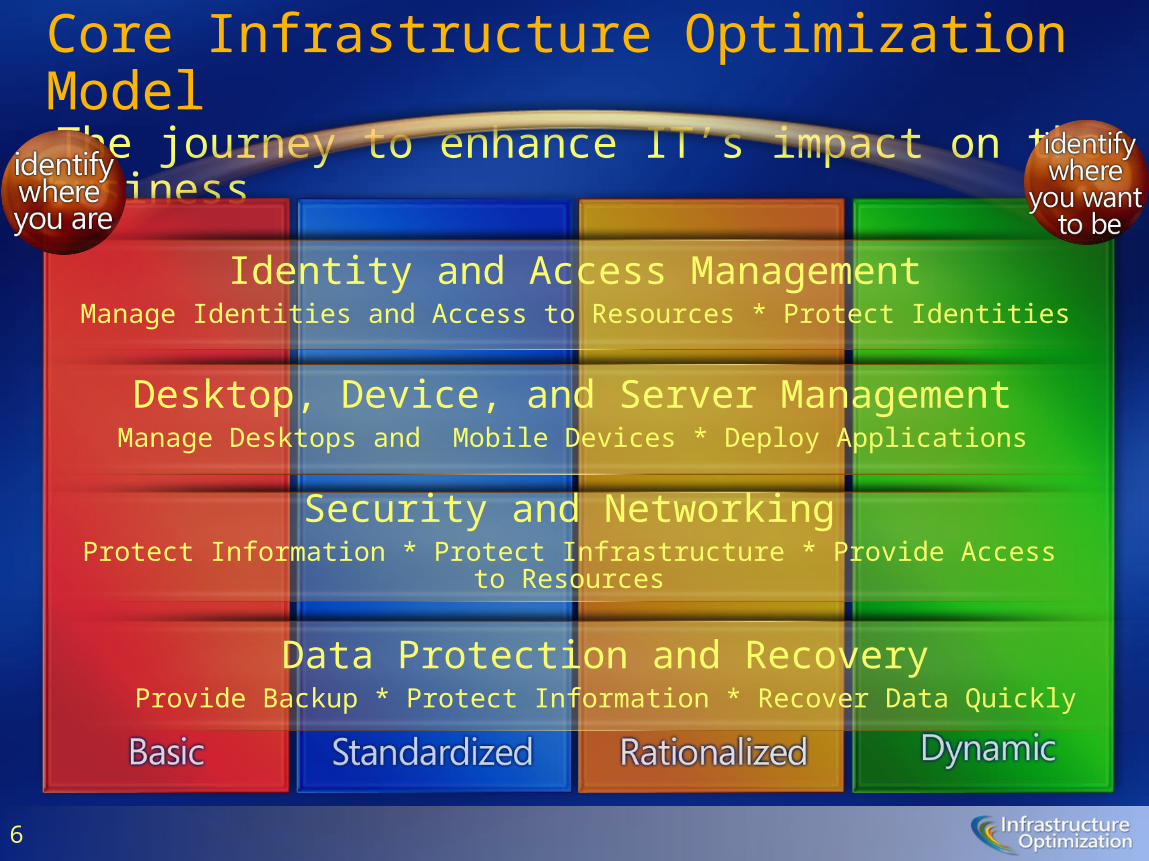
Core Infrastructure Optimization Model The journey to enhance IT’s impact on the business
Identity and Access ManagementManage Identities and Access to Resources * Protect Identities
Security and NetworkingProtect Information * Protect Infrastructure * Provide Access to Resources
Data Protection and RecoveryProvide Backup * Protect Information * Recover Data Quickly
Desktop, Device, and Server ManagementManage Desktops and Mobile Devices * Deploy Applications

7
Managed ITInfrastructure
LimitedKnowledge
Capture
LimitedAutomation
Managed &Consolidated ITInfrastructure
ExtensiveKnowledgeCapture &
Use
ExtensiveAutomation
Uncoordinated,Manual
Infrastructure
KnowledgeNot Captured
Security Risk
Inefficient
FullyAutomated
Management
AutomatedKnowledge
Capture & Use
DynamicResource Usage
Business-linkedSLAs
Infrastructure Optimization Model

8
Best Practice Benefits: Cost Savings
PC Configuration and Standardization
Savings:$110
Savings:$190
Identity & Access Management
PC Security
Systems Management
Savings:$120
Savings:$50
Savings:$130
Savings:$110
Savings:$120
$230
$130
$170
$300

9
100
200
300
400
PCs
0
500
600
Average PCs Managed per IT FTE
76 172 442
Best Practice Benefits: IT Efficiency

10
SP2
Standardized
$507/PCImproved image
management and deployment tools
Improved security
Improved reliability
Improved diagnostics
Advanced Group Policy
Advanced data protection
Better event viewing, tracking
Standardized
$470/PCStandard Desktop
Strategy
Centrally Managed PC Settings and Configuration
Comprehensive PC Security
Rationalized
$200/PC
Analysis of Business Value of Windows Vista
$37/PC $277/PC
© 2006 Microsoft Corporation. All rights reserved. Microsoft, Windows, Windows Vista and other product names are or may be registered trademarks and/or trademarks in the U.S. and/or other countries.
The information herein is for informational purposes only and represents the current view of Microsoft Corporation as of the date of this presentation. Because Microsoft must respond to changing market conditions, it should not be interpreted to be a commitment on the part of Microsoft, and Microsoft cannot guarantee the accuracy of any information provided after the date of this
presentation. MICROSOFT MAKES NO WARRANTIES, EXPRESS, IMPLIED OR STATUTORY, AS TO THE INFORMATION IN THIS PRESENTATION.