microsimulation for urban transportation planning: miracle or mirage?
TRANSCRIPT
This article was downloaded by: [Oklahoma State University]On: 20 December 2014, At: 23:56Publisher: RoutledgeInforma Ltd Registered in England and Wales Registered Number: 1072954 Registeredoffice: Mortimer House, 37-41 Mortimer Street, London W1T 3JH, UK
Journal of Urban TechnologyPublication details, including instructions for authors andsubscription information:http://www.tandfonline.com/loi/cjut20
Microsimulation for urbantransportation planning: Miracle ormirage?Catherine T. LawsonPublished online: 21 Dec 2010.
To cite this article: Catherine T. Lawson (2006) Microsimulation for urban transportation planning:Miracle or mirage?, Journal of Urban Technology, 13:1, 55-80, DOI: 10.1080/10630730600752868
To link to this article: http://dx.doi.org/10.1080/10630730600752868
PLEASE SCROLL DOWN FOR ARTICLE
Taylor & Francis makes every effort to ensure the accuracy of all the information (the“Content”) contained in the publications on our platform. However, Taylor & Francis,our agents, and our licensors make no representations or warranties whatsoever as tothe accuracy, completeness, or suitability for any purpose of the Content. Any opinionsand views expressed in this publication are the opinions and views of the authors,and are not the views of or endorsed by Taylor & Francis. The accuracy of the Contentshould not be relied upon and should be independently verified with primary sourcesof information. Taylor and Francis shall not be liable for any losses, actions, claims,proceedings, demands, costs, expenses, damages, and other liabilities whatsoeveror howsoever caused arising directly or indirectly in connection with, in relation to orarising out of the use of the Content.
This article may be used for research, teaching, and private study purposes. Anysubstantial or systematic reproduction, redistribution, reselling, loan, sub-licensing,systematic supply, or distribution in any form to anyone is expressly forbidden. Terms &Conditions of access and use can be found at http://www.tandfonline.com/page/terms-and-conditions
Microsimulation for UrbanTransportation Planning:Miracle or Mirage?
Catherine T. Lawson
CITIES by their nature are multi-player, multi-activity,
complex weavings of people, materials, activities, and
infrastructures. In the past, only crude aggregate
models were available to understand their complex urban
transportation systems. However, an emerging technology—
microsimulation—offers a set of new tools that are well-suited
for transportation and other urban systems and are capable of
providing many benefits to a variety of users. Microsimulation is
a modeling technique that operates with individual units (i.e.,
persons, households, vehicles, or firms), providing a level of
analysis on a unit-by-unit basis. There are many variations of
microsimulation, including combinations of individual units and
time periods (i.e., persons in vehicles moving on a network on a
continuous basis or households paying taxes on an annual basis).
Over the last decade, experiments with high-performance
supercomputing clusters and advancements in computational
mathematics have expanded the realm of research and applications
in microsimulation models. As models that operate at the level of
the individual behavioral entity, any circumstance where individ-
ual entities act, interact, or react to anything in their environment
or to each other is a potential opportunity for microsimulation. For
example, O’Donoghue and Evans looked at reforming social
assistance in three European countries using a cross-national
Journal of Urban Technology, Volume 13, Number 1, pages 55–80.
Copyright # 2006 by The Society of Urban Technology.
All rights of reproduction in any form reserved.
ISSN: 1063-0732 paper=ISSN: 1466-1853 online
DOI: 10.1080=10630730600752868
Microsimulation for Urban Transportation Planning 55
Dow
nloa
ded
by [
Okl
ahom
a St
ate
Uni
vers
ity]
at 2
3:56
20
Dec
embe
r 20
14
microsimulation model. Social science applications include labor
markets, tax policy, day care, and public pensions. Microsimula-
tion models are now being used in medical research, telecommu-
nication, and other disciplines. Advances being made in
microsimulation research in these diverse fields have value to
other seemingly unrelated users of the technology. The very
nature of this expansive field suggests the need for a “pan-
disciplinary” approach to research, where a researcher with little
or no interest in the inputs or outcomes of a particular area never-
theless learns lessons from the techniques developed and/or
applied in that area.
A pan-disciplinary world creates a challenge for the
exchange of ideas. Consider Lakshmanan and Anderson’s use of
the term “hyperarchy” to describe today’s world of rapid change
and interdependence, where team-based collaborations work
with permeable organizational boundaries. An example of this
phenomenon is the cross-fertilization of ideas in microsimulation
techniques used to “create” synthetic populations for research in
homeland security applications, based on previous work in trans-
portation planning. This article examines the challenges faced in
applying microsimulation to transportation planning and how
overcoming those challenges contributes to making further
advances in microsimulation in general.
Transportation Planning: A Case Study for the Introductionof Microsimulation
Transportation planning is currently undergoing a metamorphosis
from a traditional modeling process to microsimulation. The
passage of the Federal-Aid Highway Act of 1962 required urban
areas to use a comprehensive transportation planning process to
qualify for federal matching funds for the construction of transpor-
tation improvements. The invention of computers helped acceler-
ate a standardized approach to data collection and the development
of travel demand forecasting models. These models were designed
to help planners forecast where new highway capacity was needed,
given estimates of population and employment in some future
year. While these models have grown increasingly complex
since they were first devised, their underlying modeling
approaches have remained relatively unchanged.
The structure of the models requires urban areas to be broken
into zones. Census, traffic data, and survey data from these zones
Harding
Troitzsch et al.
Puvimanasinghe et al.
Habbema et al.
Edwards
56 Journal of Urban Technology/April 2006
Dow
nloa
ded
by [
Okl
ahom
a St
ate
Uni
vers
ity]
at 2
3:56
20
Dec
embe
r 20
14
are aggregated into zonal averages. The aggregate models have
four separate components:
. trip generation (forecasts the number of trips leading to or
from each zone)
. trip distribution (matches origins with destinations)
. mode choice (predicts what travel modes will be used for
each trip)
. network assignment (estimates the resulting traffic volumes
on major arterials).
Although most metropolitan planning organizations in the
United States continue to use travel demand forecasting models
with this four-step structure, these models have long been criti-
cized for shortcomings that limit the validity of their results.
Trip GenerationEfforts to enhance and update these models remain an active
endeavor for transportation researchers, software vendors, and
planning professionals. For example, the trip-generation procedure
was designed to estimate trip origins and destinations as a linear
function of the characteristics of households. It has been enhanced
to incorporate time of day, characteristics of employers, and other
activity centers in each zone. However, the process still only pro-
vides zone-specific outputs, relying solely on average calculations
as proxies for behavioral responses. In some cases, survey and
census data are used to determine who travels and how far. Yet,
the models have no mechanism for incorporating changes in
trip-making practices when individual household members
respond to policy changes or household conditions, such as new
parking regulations or the use of zoning language that would
allow mixed-use commercial developments.
Trip DistributionIn the trip distribution process, the original versions of travel
demand forecasting models were based on the notion of a
gravity model. This refers to the concept of “attractiveness,”
where trips are distributed across all zones, based on how attrac-
tive one zone is in relation to all other zones. Attractiveness
encompasses employment and other descriptors of destinations.
Attractiveness generally increases as employment and other activi-
ties increase and declines sharply as distance and travel time
between zone pairs increases. Efforts at improving models
Microsimulation for Urban Transportation Planning 57
Dow
nloa
ded
by [
Okl
ahom
a St
ate
Uni
vers
ity]
at 2
3:56
20
Dec
embe
r 20
14

include “matching” manufacturing workers to manufacturing jobs.
However, this technique, which still relies on zone-specific
outputs, is less effective in urban areas where the predominant
employment sites are not easily diagnosed.
Mode ChoiceModels used for mode choice traditionally divide trips into travel
by automobile or by transit. In this modeling process, the number
of trips and destinations are fixed and an estimation is made to
determine the percentage of trips carried by each mode.
Using an econometric technique known as a multi-nominal
logit model, recent attempts have been made to include a larger
variety of modes such as various forms of transit, as well as car-
pooling, bicycling, and walking. Although survey data is collected
from individual households (disaggregate data), the modeling
process continues to rely on a zonal structure which is not necess-
arily geographically scaled to incorporate information on user-
friendly infrastructures (i.e., bike paths and sidewalks).
Network AssignmentThe final process, the network assignment of trips, requires analysts
to develop computerized routines that, in most cases, look for the
shortest route from the origin to the destination (minimal path
program). The program runs iteratively until an “acceptable”
solution is found. This technique has often been referred to as
“the black box” component because of the level of software knowl-
edge needed to run and interpret the outputs. In the end, the outputs
of the models are compared with observed counts and specific ad
hoc adjustments made to “fix” the models. Although the algorithms
and computerized routines have increased in complexity to include
computerized proxies for congestion and to allow the assignments to
be changed to equalize traffic across the network, the models are still
not able to incorporate human responses to congestion or other
route-specific changes that influence driver behavior.
Although shortcomings have been recognized in technical
aspects of travel-demand forecasting models, they continue to
serve as an adequate methodology for providing planners with
notions on where new capacity needs to be built. Significant socio-
demographic changes have influenced household travel patterns
since the original models were developed including: an increase in
labor force participation by women, smaller household size, more
single-parent households, and an increased propensity to “trip
chain” (e.g., making multiple stops on the way to and from work).
Lawson 1998
58 Journal of Urban Technology/April 2006
Dow
nloa
ded
by [
Okl
ahom
a St
ate
Uni
vers
ity]
at 2
3:56
20
Dec
embe
r 20
14
Concerns over the use of traditional travel demand forecast-
ing models increased after the passage of the Clean Air Act
Amendments and the Intermodal Surface Transportation Equity
Act. It became clear that the analytical requirements of the legis-
lation were far greater than the capability of the travel demand
forecasting model process. Conformity determination standards
explicitly required transportation planners to prepare long-range
demand forecasts and conduct air quality modeling to predict
absolute levels of pollution as a function of travel demand and
changes in the regional transportation system. Overall, the
federal legislation called for an urban technology capable of
including:
. land use and demographic characteristics of different regions
. the natural environment
. multi-modal transportation networks
. populations and commercial environments
. unique travel decisions of individuals
. detailed vehicle representations
. detailed dynamics of regional traffic
. the unique influence of traffic on congestion and air quality.
Developing Microsimulation Technologies for TransportationPlanningRecognizing the need to review and modernize travel models, the
U.S. Department of Transportation (DOT) and the U.S. Environ-
mental Protection Agency (EPA) sponsored a research program
focused on the preparation of, and experimentation with, micro-
simulation, referred to as the TRansportation ANalysis SIMulation
System (TRANSIMS). TRANSIMS was designed at the Los
Alamos National Laboratory by a team of researchers from a
variety of disciplines. The system was designed to simulate the
movements of individuals, vehicles, and households on a
second-by-second basis throughout the day. By modeling the
behavior of individuals in one-second “time-steps,” an entirely
new approach to transportation modeling was to be developed.
At a regional scale, TRANSIMS was intended to provide the capa-
bility to evaluate highly congested operations and overall effects
of infrastructure changes.
The decision to invest almost exclusively in a single
approach was not universally accepted, and some in the transpor-
tation research community would have preferred the funding to
Harvey and Deakin
Beimborn et al.
Morrison and Loose
Microsimulation for Urban Transportation Planning 59
Dow
nloa
ded
by [
Okl
ahom
a St
ate
Uni
vers
ity]
at 2
3:56
20
Dec
embe
r 20
14
have been used as seed money for a variety of smaller model
improvement efforts, competitively awarded. Others were uncom-
fortable with the decision to license the experimental results to the
private sector at the conclusion of the experiment as the means of
promoting implementation.
The TRANSIMS system was originally built around four
modules: the population synthesizer, the activity generator, the
route planner, and the traffic microsimulator. Each of these
modules used a variety of inputs, implemented a series of processes,
and provided outputs that became inputs to the other modules. The
flexibility and interaction among the modules provided an opportu-
nity for feedback and internal consistency within a simulation
environment not previously attainable. The technology was to
make it possible to predict the effects of changing the transportation
infrastructure, using a scientific approach to traffic planning by
allowing the experiment to be precisely re-created.
The following is a brief description of the TRANSIMS
modules:
The population synthesizer is programmed to build a realistic
synthetic population for a region by “creating” the households and
matching them with census data. The flexibility of reassigning
these household characteristics means that any number of popu-
lation changes can be accommodated through mircrosimulation.
For example, the members of a household can “grow older”
over time—simulating the process of aging in place. The
purpose of the population synthesizer is to populate the modeling
process with the most realistic version of the traveling public—
rather than relying upon a set of average data (e.g., average
incomes) used in traditional travel demand forecasting.
Once the synthetic population is generated, the TRANSIMS
procedure produces a list of activities for each of the household
members using the activity generator. The sets of activities are
based on demographic and activity surveys collected from actual
households. The activity sets from the actual households are
matched to like-kind synthetic household members. Each individ-
ual household member is given a set of activities, matched by age,
gender, and relation within the household. Activity types (i.e.,
work, shopping, school, etc.), duration, beginning time and
ending time, and travel preference (i.e., driving or walking) are
assigned over a 24-hour period. The activity location is explicitly
established using geographic information systems (GIS)—thus the
time to go from one place to another and the way to go (mode
choice) can be calculated and tested for reasonableness.
Howard
Beckman et al.
60 Journal of Urban Technology/April 2006
Dow
nloa
ded
by [
Okl
ahom
a St
ate
Uni
vers
ity]
at 2
3:56
20
Dec
embe
r 20
14

The route planner module contains the procedures used to
process the sets of activities, the locations, and the time available
for each activity. It then determines the feasibility of accomplish-
ing the expected travel patterns. The router contains network
layers, each assigned to a particular mode. There is a walk layer,
a street layer, a bus layer, and a rail layer. The computer proces-
sing moves the individual from one place to another by a combi-
nation of one or more of these mode layers. When it is
necessary to transfer between layers, the walk layer is used (e.g.,
transferring from bus to car requires use of the walk layer).
Specific time periods associated with each activity help determine
the feasibility of the mode of travel. For example, if the synthetic
householder needs to be at work by 9:00 AM and lives 20 miles
from the work location, walking would not be a feasible mode
of travel. If a bus is available and could travel the distance in
time, but has a schedule that makes the trip impossible to accom-
plish, only an auto can be used to make the work trip. Thus, every
set of activities, modes, and time constraints becomes part of the
process.
The traffic microsimulator executes the travel plans and com-
putes the overall intra- and inter-modal transportation system
dynamics. The module consists of the road network, vehicle
files, a transit network, a walking network, and traveler plans.
The Traffic Microsimulator has the ability to “navigate” an indi-
vidual from point to point on the transportation network using
an algorithm.
The computer program uses a set of rules that keeps the
vehicles from colliding, moving from one grid cell to another
using a cellular automata principle. However, the vehicles are
capable of creating a traffic jam. Throughout the experimental
phase, a number of studies were conducted to understand traffic
behavior using microsimulation technologies. (See Table 1.)
Early TRANSIMS ExperimentsDallas/Ft. Worth, Texas was the site of the first experiment using
TRANSIMS. A 25-square mile corridor was targeted for analysis,
with attention being paid to a discrete set of infrastructure changes,
primarily using the traffic microsimulator module. The experiment
began in 1995, used 10,000 links, and 200,000 synthetic travelers.
The study focused on a major shopping/business center, the
Galleria area, located near the interchange of the Lyndon
B. Johnson Freeway (I-635), and the Dallas North Tollway.
FHWA 2005
Microsimulation for Urban Transportation Planning 61
Dow
nloa
ded
by [
Okl
ahom
a St
ate
Uni
vers
ity]
at 2
3:56
20
Dec
embe
r 20
14

TABLE 1Sample of Simulation Experiments Using TRANSIMS Technologies at Los Alamos National Laboratory
Author(s) Date Report ID Title Research Findings
Nagel & Schreckenberg 1995 LA-UR 95-2132 Traffic Jam Dynamics in StochasticCellular Automata
Cellular Automata (CA) models aretested with Los Alamos project andNorth-Rhine-Westfalia (NRW) inGermany
Rickert et al. 1995 LA-UR 95-4367 Two Lane Simulations Using CellularAutomata
In trying to simulate lane-changingbehaviors, some inconsistenciesappear in the model
Schreckenberg & Nagel 1995 LA-UR 95-2160 Physical Modeling of Traffic withStochastic Cellular Automata
Comparison of Cellular Automation(CA) to Follow-the-Leader theory forunderstanding cars in lanes
Nagel 1995 LA-UR 95-4018 Particle Hopping vs. Fluid-DynamicalModels for Traffic Flow
Compares Stochastic Traffic CellularAutomaton with other theories (i.e.,car-following and fluid dynamicalmodels)
Nagel et al. 1996b LA-UR 96-659 Network Traffic as a Self-OrganizedCritical Phenomena
Tests in NRW indicate paradox withtraffic management systems
Nagel et al. 1996a LA-UR 96-50 Parallel Traffic Microsimulation byCellular Automata and Applicationfor Large-Scale TransportationModeling
Discussion of computational issues,CA, multi-lane traffic, network andoverview of TRANSIMS
Kelley & Nagel 1997 LA-UR 97-4453 Relaxation Criteria for Iterated TrafficSimulations
TRANSIMS Dallas/Ft. Worth casestudy used to test concept of“relaxed” (vehicles moving out toarterials when freeway fills up duringpeak) network with three regimes: anuncongested network, an “unrelaxed”congested network, and a “relaxed”congested network
62
Jou
rnal
of
Urb
anT
echn
olo
gy
/Ap
ril2
00
6
Dow
nloa
ded
by [
Okl
ahom
a St
ate
Uni
vers
ity]
at 2
3:56
20
Dec
embe
r 20
14
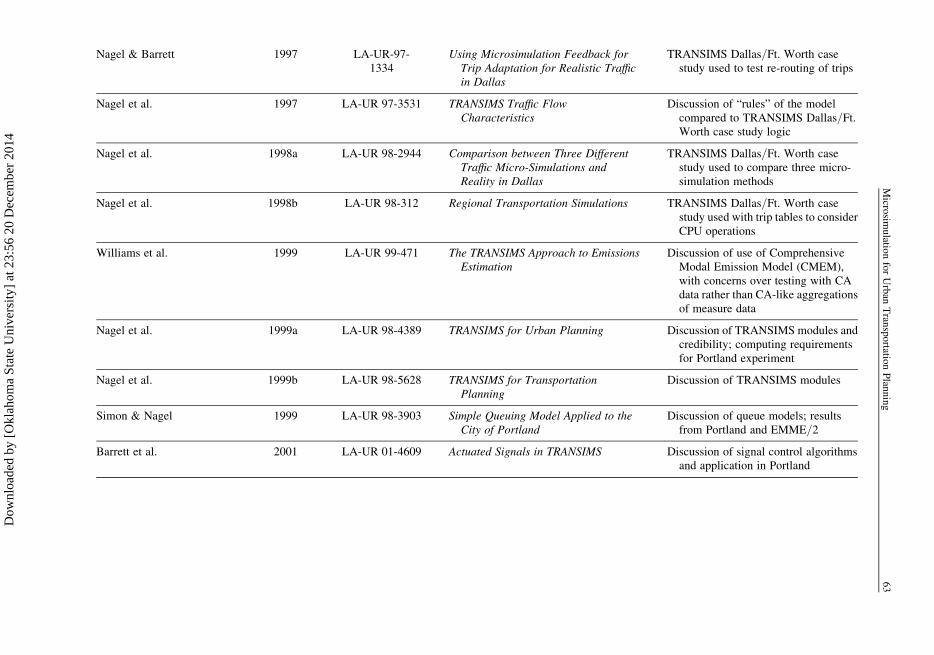
Nagel & Barrett 1997 LA-UR-97-1334
Using Microsimulation Feedback forTrip Adaptation for Realistic Trafficin Dallas
TRANSIMS Dallas/Ft. Worth casestudy used to test re-routing of trips
Nagel et al. 1997 LA-UR 97-3531 TRANSIMS Traffic FlowCharacteristics
Discussion of “rules” of the modelcompared to TRANSIMS Dallas/Ft.Worth case study logic
Nagel et al. 1998a LA-UR 98-2944 Comparison between Three DifferentTraffic Micro-Simulations andReality in Dallas
TRANSIMS Dallas/Ft. Worth casestudy used to compare three micro-simulation methods
Nagel et al. 1998b LA-UR 98-312 Regional Transportation Simulations TRANSIMS Dallas/Ft. Worth casestudy used with trip tables to considerCPU operations
Williams et al. 1999 LA-UR 99-471 The TRANSIMS Approach to EmissionsEstimation
Discussion of use of ComprehensiveModal Emission Model (CMEM),with concerns over testing with CAdata rather than CA-like aggregationsof measure data
Nagel et al. 1999a LA-UR 98-4389 TRANSIMS for Urban Planning Discussion of TRANSIMS modules andcredibility; computing requirementsfor Portland experiment
Nagel et al. 1999b LA-UR 98-5628 TRANSIMS for TransportationPlanning
Discussion of TRANSIMS modules
Simon & Nagel 1999 LA-UR 98-3903 Simple Queuing Model Applied to theCity of Portland
Discussion of queue models; resultsfrom Portland and EMME/2
Barrett et al. 2001 LA-UR 01-4609 Actuated Signals in TRANSIMS Discussion of signal control algorithmsand application in Portland
Micro
simu
lation
for
Urb
anT
ransp
ortatio
nP
lann
ing
63
Dow
nloa
ded
by [
Okl
ahom
a St
ate
Uni
vers
ity]
at 2
3:56
20
Dec
embe
r 20
14
In the experiment, TRANSIMS used local interactions of
simulated vehicles on a second-by-second basis to generate the
speed of each vehicle. As a result, the speeds were sensitive to
signal timing, local traffic conditions, and other “real-world”
experiences. Each synthetic driver/vehicle was tracked and per-
formance measured for comparison with other synthetic drivers.
Rilett points out this major difference between traditional travel
demand forecasting and microsimulation. A stochastic,
microscopic-based model, such as TRANSIMS, is capable of
modeling individual demand responses to changes in supply. In
other words, a synthetic individual’s desire to participate in a
series of activities in different locations on a second-by-second
basis interacts with the ability of the transportation system to
meet this demand. The output from the microsimulation is rich
in information as every traveler and vehicle is modeled explicitly,
which affords model users a great variety of potential metrics. For
example, a primary measure of effectiveness (MOE) was devel-
oped that used a synthetic individual traveler’s time of travel
and average speed from the beginning to the end of her trip.
Other uses include an equity analysis, intended to show how
benefits and costs could be assigned to subgroups of travelers. A
reliability analysis was conducted that focused on the variability
of day-to-day travel times.
The Portland Metropolitan Region, Oregon was the site of the
second major experiment. The objective of the Portland study was
to demonstrate the full capability of TRANSIMS to analyze and
forecast traffic on a regional basis, rather than simply in a corridor.
In 1998, the Portland Metropolitan Planning Organization
(METRO) agreed to allow its transportation planning network
(EMME/2) to be transformed into the TRANSIMS format, the
“all-street” network. The new network included left-turn lanes,
road elevations, traffic signal locations, and other critical represen-
tations.
The goal of the TRANSIMS experiment in Portland was to
track individuals and vehicles on a second-by-second basis,
model the location and duration of activities, and track the location
of individuals as they use a regional transportation system. The
system was expanded to include transit and walking as modes of
travel.
The experiment is still on-going. The current study team is
composed of Portland METRO, AECOM Consult, and PB
Consult with support from the Los Alamos National Laboratory
and IBM. The team developed the following principles to guide
Beckman
Los Alamos National Laboratory
1998
Los Alamos National Laboratory
2002
Ducca
64 Journal of Urban Technology/April 2006
Dow
nloa
ded
by [
Okl
ahom
a St
ate
Uni
vers
ity]
at 2
3:56
20
Dec
embe
r 20
14
its work and to facilitate future applications of the modeling
process:
1. Make maximum use of existing data.
2. Make maximum use of existing demand models.
3. Blend rule-based and behavioral techniques.
4. Incorporate feedback.
5. Represent the entire region.
6. Meet all performance standards of existing models and
provide additional measures.
Early in the study, the team decided to develop the model in two tracks.
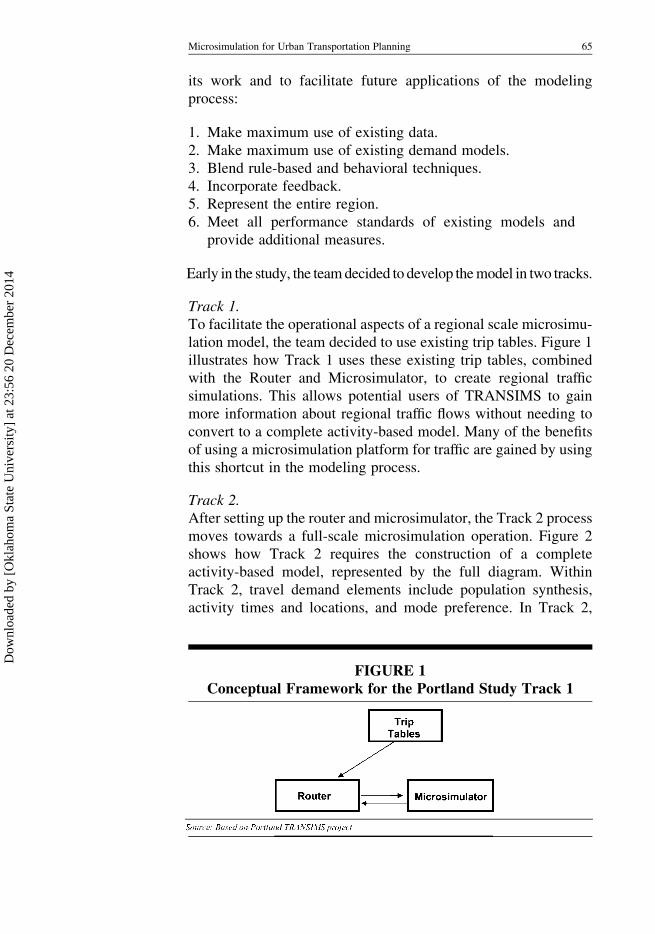
Track 1.
To facilitate the operational aspects of a regional scale microsimu-
lation model, the team decided to use existing trip tables. Figure 1
illustrates how Track 1 uses these existing trip tables, combined
with the Router and Microsimulator, to create regional traffic
simulations. This allows potential users of TRANSIMS to gain
more information about regional traffic flows without needing to
convert to a complete activity-based model. Many of the benefits
of using a microsimulation platform for traffic are gained by using
this shortcut in the modeling process.
Track 2.
After setting up the router and microsimulator, the Track 2 process
moves towards a full-scale microsimulation operation. Figure 2
shows how Track 2 requires the construction of a complete
activity-based model, represented by the full diagram. Within
Track 2, travel demand elements include population synthesis,
activity times and locations, and mode preference. In Track 2,
FIGURE 1Conceptual Framework for the Portland Study Track 1
Microsimulation for Urban Transportation Planning 65
Dow
nloa
ded
by [
Okl
ahom
a St
ate
Uni
vers
ity]
at 2
3:56
20
Dec
embe
r 20
14
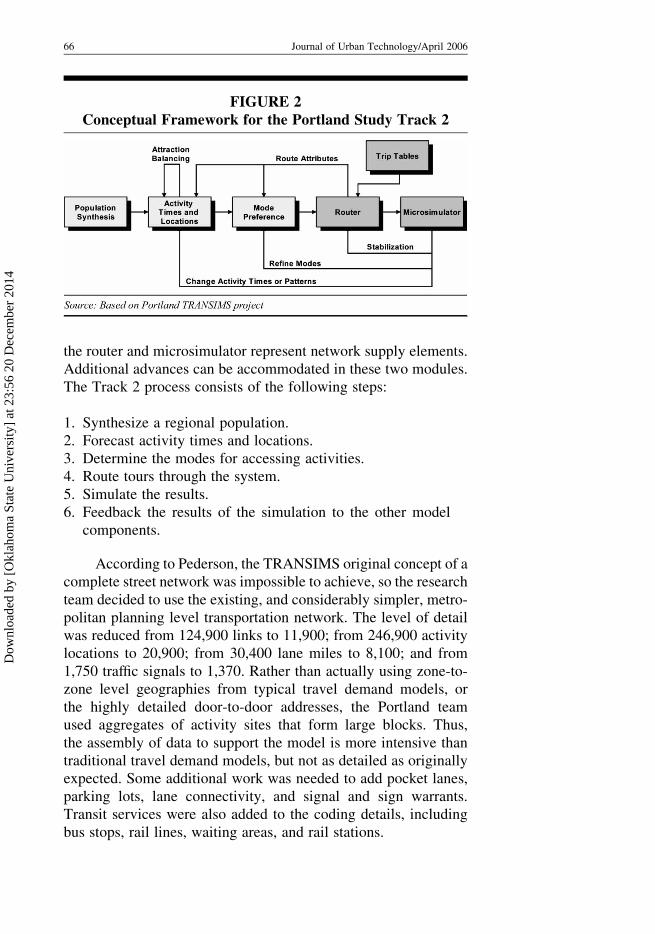
the router and microsimulator represent network supply elements.
Additional advances can be accommodated in these two modules.
The Track 2 process consists of the following steps:
1. Synthesize a regional population.
2. Forecast activity times and locations.
3. Determine the modes for accessing activities.
4. Route tours through the system.
5. Simulate the results.
6. Feedback the results of the simulation to the other model
components.
According to Pederson, the TRANSIMS original concept of a
complete street network was impossible to achieve, so the research
team decided to use the existing, and considerably simpler, metro-
politan planning level transportation network. The level of detail
was reduced from 124,900 links to 11,900; from 246,900 activity
locations to 20,900; from 30,400 lane miles to 8,100; and from
1,750 traffic signals to 1,370. Rather than actually using zone-to-
zone level geographies from typical travel demand models, or
the highly detailed door-to-door addresses, the Portland team
used aggregates of activity sites that form large blocks. Thus,
the assembly of data to support the model is more intensive than
traditional travel demand models, but not as detailed as originally
expected. Some additional work was needed to add pocket lanes,
parking lots, lane connectivity, and signal and sign warrants.
Transit services were also added to the coding details, including
bus stops, rail lines, waiting areas, and rail stations.
FIGURE 2Conceptual Framework for the Portland Study Track 2
66 Journal of Urban Technology/April 2006
Dow
nloa
ded
by [
Okl
ahom
a St
ate
Uni
vers
ity]
at 2
3:56
20
Dec
embe
r 20
14

Figure 3 illustrates the steps to move from a traditional travel
demand forecasting model to a microsimulation process that uses
second-by-second time-steps. For example, after the process data
is assembled to support the modeling effort, dynamic traffic
assignment (DTA) is used to route trips by time of day. The tran-
sition allows planners to use Track 1 and/or Track 2 deployment
strategies. Within the transition framework, individual trips on the
system become tours for individual activity patterns.
Once the tours are generated, the microsimulated traffic volumes
are compared to archived intelligent transportation systems (ITS),
traffic counters, and to the original router demand for trips on a par-
ticular link by time of day, by direction of travel, and by speed.
The visualizations created using geographic information
systems (GIS) and automated graphics provide insights into the
location and duration of congestion and other traffic phenomenon.
Work continues on the Track 2 process to accurately depict
location choice. The research team is incorporating a tour-based
location choice model in place of the traditional trip-based destina-
tion choice model. Many interesting modeling insights are being
gained through the systematic application of microsimulation tech-
niques. For example, elements in the feedback process and the com-
plexity of the decision-making process must be addressed to actually
propel synthetic individuals through a series of daily activities.
FIGURE 3Transition Path for TRANSIMS
Microsimulation for Urban Transportation Planning 67
Dow
nloa
ded
by [
Okl
ahom
a St
ate
Uni
vers
ity]
at 2
3:56
20
Dec
embe
r 20
14

Additional TRANSIMS ExperimentsEarly in its development, TRANSIMS was licensed to universities
for research purposes. Thirty-one copies of version 1.0 and 1.1 and
one copy of version 3.1 were licensed. No consistent attempt was
made to follow up on the use of the licenses. Published results indi-
cate that versions 1.0 and 1.1, while useful for research purposes,
were premature for large-scale applications. Examples of this early
research include an evaluation by the Center for Engineering
Studies at North Carolina State University in Raleigh, experiments
by Rilett et al., and by Kim and Rilett.
Hobeika has developed a tutorial package to teach trans-
portation planning using microsimulation tools. He is also conduct-
ing a small-scale microsimulation demonstration using the
Blacksburg, Virginia network and demographic data as a case
study. Dixon and Chang have received funding for a project using
TRANSIMS to model the entire city of Moscow, Idaho focusing
on a demonstration of software and curriculum enhancements.
Two additional TRANSIMS projects were undertaken in late
Spring 2005. The Federal Highway Administration (FHWA)
began using TRANSIMS to study the impact of street closings
near the White House, and Rutgers University, along with the
New Jersey Institute of Technology, began a study of traffic in
New Jersey’s Middlesex and Monmouth Counties. No results
are available yet from these studies.
FHWA plans call for the continued development and deploy-
ment of TRANSIMS technologies. This includes continuing the
Track 2 research, developing additional applications, providing
training on its use, and supporting metropolitan planning organiz-
ations (MPOs) and state departments of transportation (DOTs) on
their implementation strategies. As part of the deployment of
TRANSIMS, the FHWA has begun distribution on an “open
source”1 basis. Further information on the open source version
can be found at tmip.fhwa.dot.gov/TRANSIMS/. Teaching
materials on the theoretical and practical aspects of TRANSIMS
are also available at this site. The recently enacted legislation—
the Safe, Accountable, Flexible, Efficient Transportation Equity
Act: A Legacy for Users—contains a provision for the advance-
ment of the TRANSIMS program, including studies intended to
focus on freight, airport, and port activities.
A group of researchers have conducted a series of studies in
Switzerland, using TRANSIMS version 1.1. Research was also
conducted to demonstrate a microsimulation methodology for
pedestrian travel.
Stone et al.
Virginia Polytechnic and State
University
Ducca
1Open source is a term used to
describe the concept of allowing
immediate and open access to the
sources of information and data
used in the creation and
organization of knowledge. This
includes the source code used in
software applications.
SAFETEA-LU
Raney et al. 2002
Balmer et al. 2004
Raney et al. 2003
Nagel and Raney
Gloor et al. 2003
Gloor et al. 2004
68 Journal of Urban Technology/April 2006
Dow
nloa
ded
by [
Okl
ahom
a St
ate
Uni
vers
ity]
at 2
3:56
20
Dec
embe
r 20
14
Other Applications of Microsimulation in TransportationPlanningSome transportation researchers describe microsimulation as a
natural extension of the disaggregate modeling technique used in
traditional travel demand forecasting models, rather than an alterna-
tive approach. Microsimulation can be used to generate discrete
choices of individuals. The New York Metropolitan Transportation
Council (NYMTC) is developing a microsimulation model for the
New York-New Jersey-Connecticut metropolitan area using this
concept. The modeling process is referred to as the New York
Best Practices Model (NYBPM) and is run using a propriety soft-
ware application. The research team claims the following advan-
tages when using a discrete-choice microsimulation application:
. substantial savings in terms of calculations and storage of
model outputs
. explicit formulation of chained decisions and time-space
constraints faced by individual travelers
. explicit modeling variability of travel demand rather than the
traditional use of average values
. ability to handle competition for various locations, including
work places.
The system under development has two structures: the household,
auto-ownership, and journey-frequency (HAJ) model and the
mode, destination, and stop choice (MDSC) model. The HAJ
model includes the following elements:
Household Model – forecasts the number and distribution of house-
holds in designated zones, based on census data. The model calcu-
lates the probability of possible combinations of household
characteristics (i.e., income, size, number of workers and non-
workers, number of children). The probabilities are combined
with traditional aggregate demographic forecasts for future years.
Auto-Ownership Model – determines the number of automobiles
available for each household established in the household
model, using household characteristics, vehicle-maintenance
costs, parking availability, transit and highway accessibility,
density and residential nature of the household location.
Journey-Frequency Model – determines the daily number of
paired journeys taken by each person in each household for a set
of purposes, considering intra-household interrelationships,
access to transit, and auto availability.
Vovsha et al.
NYMTC 2006
Microsimulation for Urban Transportation Planning 69
Dow
nloa
ded
by [
Okl
ahom
a St
ate
Uni
vers
ity]
at 2
3:56
20
Dec
embe
r 20
14
The MDSC has the following five submodels:
Pre-Mode Choice Model – uses household characteristics to
distinguish between motorized and non-motorized travel.
Destination Choice Model – based on the previous sorting in the
pre-mode choice, different destination sets with available
attractions for each zone are used to distribute journeys.
Motorized Mode Choice Model – predicts traveler decisions based
on time and cost factors for nine motorized modes.
Stop-Frequency Choice Model – uses four combinations of beha-
viors including: direct journeys without stops; stops on the way to
a destination; stops on the way back from a destination; or stops on
both the way to and the way back from a destination.
Stop-Location Choice Model – predicts a location zone for each
stop, given a set of distance limits that substantially reduce the
choice-set (e.g., a 3- to 5-mile radius around a residential location).
A technique referred to as a Monte Carlo random pick process
is used to generate the microsimulated travel patterns. According to
Vovsha, systematic variation in travel activities (i.e., season, time of
day, particular events) is incorporated in the probability model
structures (the HAJ and MDSC series), while the Monte Carlo
process variation accounts for the non-modeled random factors. In
this microsimulation application, individuals are modeled as the
unit of analysis, however, the modeling techniques are based on
the traditional travel demand forecasting methodology. The core
model uses a 30-minute time-step for the destination and mode
choice procedures; however, these outputs are ultimately aggre-
gated into four time periods (6:00 AM – 10:00 AM; 10:00 AM –
4:00 PM; 4:00 PM – 8:00 PM; and 8:00 PM – 6:00 AM).
Another microsimulation model has been under development
since 2000 by Cambridge Systematics and Parsons Brinckerhoff
for the San Francisco County Transportation Authority. The
model uses a “full-day pattern” of activities that simultaneously
predicts the main components of each person’s travel. A random
Monte Carlo procedure selects a single pattern for each syn-
thesized person. The synthesized tours and trips are aggregated
to represent flows between zones before traffic assignment. The
model is described as a tour-based microsimulation approach to
modeling destination choice and mode choice. According to
Jonnalagadda et al., this approach differs from traditional travel
demand forecasting models because trip productions are
Vovsha et al.
Vovsha 2006
Freedman et al.
Castiglione et al.
70 Journal of Urban Technology/April 2006
Dow
nloa
ded
by [
Okl
ahom
a St
ate
Uni
vers
ity]
at 2
3:56
20
Dec
embe
r 20
14
determined using day-pattern models. The tour-level models used
to determine the primary destination and trip-level models capture
the choice of intermediate stops on a particular tour. The model
uses a decision tree process that explicitly illustrates a series of
travel choices. The model reduces 1,728 zones to forty alternative
potential locations for destination choices. The entire process is
modeled as a disaggregate process in a microsimulation frame-
work. The time-steps are designated as early AM, AM peak,
midday, PM peak, and evening.
The San Francisco model has been used to evaluate a pro-
posed New Central Subway project in downtown San Francisco
in the prescribed manner outlined in the Federal Transit Adminis-
tration (FTA) “New Starts” program. Freedman et al. point out the
challenges of using a microsimulation modeling process in the fra-
mework required for this program. Another application of the San
Francisco model demonstrated its utility for equity analysis for
“communities of concern.” The use of a “disaggregate” structure
made it possible to extract detailed, person-level statistics on
travel with respect to income, marital status, and auto availability
at the household level. These are key components for studying
low-income, single-person headed, and zero-auto households.
Although ethnicity and race are available in the underlying
census data, these characteristics have not yet been incorporated
into the synthesized population used in the microsimulation
model. The model output provides information on mobility and
accessibility benefits from changes in transportation services for
members of various groups in San Francisco.
The Mid-Ohio Regional Planning Commission (MORPC) is
developing an activity/tour-based model applied incorporating
microsimulation. The modeling system was completed in late
2004 and is being used for conformity analysis, transit alternative
analysis, and highway project planning. The model consists of
nine separate linked models, beginning with a model that gener-
ates a synthesized list of household members. The second model
is an auto ownership model. The third model determines the
daily activity pattern for each synthetic person. The fourth
model determines joint travel among household members. The
fifth model generates non-mandatory tours. The sixth, seventh,
and eighth models are used together for tour destination choice,
time of day choice, and tour mode choice models. The time of
day choice model allows for a one-hour temporal resolution
between 5:00 AM and 11:00 PM. The final model determines the
stops and trip-mode choice elements.
Castiglione et al.
Castiglione et al.
Anderson and Donnelly
Vovsha 2005
Microsimulation for Urban Transportation Planning 71
Dow
nloa
ded
by [
Okl
ahom
a St
ate
Uni
vers
ity]
at 2
3:56
20
Dec
embe
r 20
14
The research team describes their process as being a microsi-
mulation application for individuals, using a Monte Carlo
technique with a random number series. However, the population
synthesizer and the auto ownership models perform the microsi-
mulation process using a deterministic “discretizer” procedure to
avoid the variability associated with the Monte Carlo technique.
Table 2 compares the basic elements of the four microsimula-
tion models currently under development. All of the models use
some form of the census at the PUMS level for determining the
characteristics of a synthetic population. Only the TRANSIMS in
Portland, Oregon uses a microsimulation process for traffic
assignment, providing a level of transparency for tracing the
travel patterns of individual household members. This process for
generating individual vehicles is similar to a number of small-
area microsimulation applications, such as INTEGRATION,
CORSIM, and/or PARAMICS. However, the major difference is
development of the traveler characteristics and behaviors associated
with each vehicle on the system in the Portland model.
Another emerging of microsimulation technique incorporates
archived real-time traffic data. For example, researchers at Massa-
chusetts Institute of Technology (MIT) continue to work on their
program, DynaMIT—capable of incorporating archived Intelli-
gent Transportation Systems (ITS) data into a microsimulation
traffic model. (See http://mit.edu/its/dynamit.html.)
According to Barcelo, European concerns over the need to pre-
serve historic city centers and the growing movement of goods has
spawned interest in microsimulation for freight models. The models
are used by planners for evaluating potential locations for city logis-
tics schemes and when consulting with commercial firms that are
keenly concerned about the viability of the analysis.
Barriers and Benefits: Finding a Balance
Any concerted effort to move microsimulation from purely an
experimental exercise to an urban technology used in normal
transportation planning practice faces a number of barriers. For
example, institutional inertia blocks many attempts to “retool”
operations due to the series of decisions and levels of approval
necessary to make changes in the status quo. However, organiz-
ations are now gaining experience with managing “rapid
change” based on their own Information Technology (IT) staff rec-
ommendations. The constant set of software and hardware
72 Journal of Urban Technology/April 2006
Dow
nloa
ded
by [
Okl
ahom
a St
ate
Uni
vers
ity]
at 2
3:56
20
Dec
embe
r 20
14

TABLE 2Comparison of Microsimulation Models Currently in Use in the United States
Model Population Travel Demand Assignment to the Network
Portland, Oregon/METRO TRANSIMS
Creates synthetic personfor each householdmember based on PUMSand is tracked individuallythroughout system
Tours for each household member are based onactivity patterns (location and time range), thentravel plans are built with specific activity timeswith the time and path of each travel leg betweeneach activity location.
Second-by-second, agent-basedmovement on a multi-layered grid usingrouter to build paths through thenetwork. Tracks the movement of bothtravelers and vehicles. Simulates themovement of vehicles on the network.
New York MetropolitanTransportation CouncilBest Practices Model
Uses census data tocalculate probabilities forhousehold types in eachzone
Journey frequency is determined by the dailynumber of paired journeys (outbound and inboundtrip pairs) for each person for each purpose in eachhousehold, given the estimated number of autosper household and is then used with mode,destination, and stop-choice model.
Batch file computer runs using time binsfor highway and transit in four timeperiods.
San Francisco Model Creates synthetic“resident” from PUMS,based on estimatedpopulation distribution. Aseparate visitor model isused for non-residents.
Tour-level based on full-day patterns, includingintermediate trips. Random Monte Carloprocedure is used to select a single pattern.
Aggregated to zones prior to assignmentto network in five time periods.
Mid-Ohio RegionalPlanning CommissionTravel ForecastingModel
Creates a synthesized listof all households in theregion using PUMSperson for each household
Daily activity patterns used to develop tours,using joint choice of departure time from home,arrival time back home, and total durationincluding activity and travel with a temporalresolution of one hour between 5:00 AM and11:00 PM.
Uses traditional trip table assignmentsto highway and transit networks.
Micro
simu
lation
for
Urb
anT
ransp
ortatio
nP
lann
ing
73
Dow
nloa
ded
by [
Okl
ahom
a St
ate
Uni
vers
ity]
at 2
3:56
20
Dec
embe
r 20
14
upgrades required for word processing and e-mail communi-
cations, both assumed fundamental to routine operations, sets
the stage for more aggressive changes related to the computing
environment.
Another concern is the added costs, both for data collection
and model maintenance. The original electronic map (shapefile)
constructed to the Portland TRANSIMS experiment has an esti-
mated value of $250,000. This dataset includes left-turn
lanes, traffic signals, and road elevations for the entire metropoli-
tan region. The current research team is using the transportation
network used for traditional travel demand forecasting, rather
than the highly-detailed shapefile. It is unclear whether the
entire network (including roads rarely traveled) needs to be
modeled. It may be possible to invest more heavily only in those
areas where traffic is heaviest. It is also conceivable that the elec-
tronic datasets currently being used in the design and construction
of road segments could be transformed electronically into a data
form that could be used for microsimulation. Other emerging
cost-saving data “harvesting” strategies include: using global
positioning systems (GPS), a variety of archived Intelligent Trans-
portation Systems (ITS) data, using activity survey samples from
similarly situated areas, and accessing other administrative
datasets for validation or “seed” information for microsimulation.
The maintenance costs of the modeling system are tied to the
cost of workforce training and the retraining of staff. New teaching
tools available on the Internet could reduce these costs consider-
ably, while ensuring a constant source for information on improve-
ments in the software processes. While hardware costs continue to
decline, there remain some issues with the operating systems and
software requirements.
Additional research may reveal an opportunity to use
“hybrid” models that incorporate elements of traditional travel
demand forecasting models (aggregate models), archived ITS
data, and “hot spot” microsimulations—all in a regional or corri-
dor context, using synthetic households and activity data as a foun-
dation. Strategically targeted surveys could be used to acquire
information from areas or individuals not well understood. This
strategy could accommodate the development of economic beha-
vior models, such as home production or other models currently
under development in Europe2.
For those concerned with the compatibility of microsimula-
tion outputs with current federal regulations and/or programs
(e.g., air quality compliance regulations or the FTA’s New
Lawson 1998
2See European Council on
Modelling and Simulation for
additional information available
at http://www.scs-europe.net/
info/index-a.html.
74 Journal of Urban Technology/April 2006
Dow
nloa
ded
by [
Okl
ahom
a St
ate
Uni
vers
ity]
at 2
3:56
20
Dec
embe
r 20
14

Starts program), the move towards open source software (OSS)
applications is perhaps the most exciting and productive means
of addressing such issues. Okunieff and Neuerburg, however,
point out there are still risks associated with OSS including:
code fragmentation, lack of compatible/interoperable appli-
cations, version control, inability to build a viable community of
developers, and/or costs of training staff for support and service.
Some of these risks could be mitigated through partnerships
between planning agencies and local universities and/or the estab-
lishment of other non-profit information organizations.
The use of OSS also offers the opportunity for those using
microsimulation in a broad range of unrelated applications (e.g.,
biological processes, cell tower operations, etc.) to contribute to
software development strategies. In the same fashion as Lakshma-
nan and Anderson’s hyperarchy, ideas and techniques could
migrate into use at a rapid pace. OSS is uniquely suited for evalu-
ation and review by other contributors not available through con-
ventional in-house development or vendor products. As a result, it
may be possible to disseminate many new functions and oper-
ations to all state and local transportation departments and
agencies in the near term. Advances made on land use and other
urban microsimulation systems can also be incorporated into
emerging models in a manner more likely to capture the true
nature of relationships in an urban setting. The use of temporal
aggregation techniques holds the promise of allowing for the
analysis of change, whether in seconds (e.g., important to staff
in traffic management centers) to longer term changes for
periods used more commonly by the planning community (e.g.,
20-year horizons).
Other professionals in the urban arena, including real estate,
construction, and development community members who have
long recognized the value of information, the inherent risks of
the market place, and the need for improved accuracy in regional
and local forecasts have had little opportunity to work closely with
the transportation community in the implementation of microsi-
mulation models. While there have been previous research
attempts to use microsimulation for land-use purposes, the contin-
ued use of aggregate travel demand forecasting models and little
understanding of the latent demand for travel reduce their viability
for widespread use.
Most of the microsimulation models share a common pro-
cedure for creating a synthetic population from census data.
Only the original TRANSIMS models and computer science
Waddell
Microsimulation for Urban Transportation Planning 75
Dow
nloa
ded
by [
Okl
ahom
a St
ate
Uni
vers
ity]
at 2
3:56
20
Dec
embe
r 20
14
extensions (i.e., MATSIM) appear to be using the vast capacity of
an agent-based, decision-making framework and second-by-
second time-steps. Some emerging research suggests decision
making encompasses factors not incorporated in either of these
approaches, including human behavior motivators of altruism or
the self-serving nature of personal decision making. The opportu-
nity for members of various research communities to make great
strides in the near future is being enhanced with the development
of open source tools, new partnerships and pan-disciplinary
exchanges.
Conclusions
The TRANSIMS experiments, while monumental in their forward
thinking strategies, are only the beginning of what needs to be
done to fully exploit the advantages of microsimulation for
urban research. Practicing planners are often constrained by
local decision makers and resource allocations. It is far more
likely that partnerships with universities capable of conducting
experiments will make the transition in the near future. Univer-
sities are able to promote open source options and provide linkages
to a larger community of researchers to share lessons learned the
“hard way.” Commercial firms may be less inclined to share
these lessons or even to attempt more risky ventures (i.e., explor-
ing decision-making patterns) that may or may not have a ready
market in the early stages of development.
More consideration for open source software development
and creative partnerships will provide benefits to the greater com-
munity of researchers while at the same time meeting the current
needs for understanding urban transportation systems. In the end,
for the transportation planning community, only a thorough and
systematic evaluation process can answer the question of
whether the costs and benefits associated with microsimulation
models justify a transition from the current use of traditional
travel demand forecasting models. In other words, is microsimula-
tion a miracle or a mirage? For the broader community of
researchers who are exploring new technologies using a pan-
disciplinary approach, progress will continue and perhaps
accelerate with ever-expanding electronic communications and
opportunities for the cross-fertilization of ideas. It remains to be
seen whether the transportation community gets “on board” in
time to benefit from this surge in research activity.
Balmer et al. 2006
Goulias and Henson
76 Journal of Urban Technology/April 2006
Dow
nloa
ded
by [
Okl
ahom
a St
ate
Uni
vers
ity]
at 2
3:56
20
Dec
embe
r 20
14
Bibliography
R. Anderson and B. Donnelly, “Mid-Ohio Region Travel Forecasting Model,”Travel Model Improvement Program (TMIP) Newsletter Archive Issue 22 (Spring2005) <htpp://tmip.fhwa.dot.gov/clearinghouse/tmip_newsletter/spring05_issue22>.Accessed February 2006.
Association of Metropolitan Planning Organizations, “Moving to Microsimulation/TRANSIMS,” METROS (Spring 2003).
J. Barcelo, “Using Microsimulation to Evaluate City Logistics Schemes,” paper pre-sented at the Transportation Research Board Meetings (Washington, D.C.: January22–26, 2006).
M. Balmer, K.W. Axhausen, and K. Nagel, “An Agent-Based Demand-ModelingFramework for Large-Scale Micro-Simulations,” paper presented at TransportationResearch Board Meeting (Washington, D.C., January 22–26, 2006).
M. Balmer, K. Nagel, and R. Raney, “Large Scale Multi-Agent Simulations forTransportation Applications,” Journal of Intelligent Transport Systems 8 (2004)205–223.
R. J. Beckman, “TRansportation ANalysis SIMulation System (TRANSIMS)”LAUR-97-4502, The Dallas/Ft. Worth Case Study, Release 1:0 (Los Alamos: LosAlamos National Laboratory, 1997).
R. J. Beckman, K. A. Baggerly, and M. D. McKay, “Creating Synthetic BaselinePopulations,” Transportation Research A, 30:6 (1996) 415–429.
E. Beimborn, R. Kennedy, and W. Schaefer, Inside the Black Box: Making Transpor-tation Models Work for Liveable Communities (Milwaukee: Citizens for a BetterEnvironment, 1996) <http://www.scag.ca.gov/modeling/pdf/1859_InsideBlack-Box.pdf>
J. Castiglione, R. Hiatt, T. Chang, and B. Charlton, “Application of a Travel DemandMicrosimulation Model for Equity Analysis,” paper presented at the TransportationResearch Board Meetings (Washington, D.C.: January 22–26, 2006).
M. P. Dixon and K. Chang, “UI Budget No. KLK231” (2004) <www.webs1.uida-ho.edu/niatt/research/ UTC_projects/year6/klk231.htm>. Accessed August 2005.
F. Ducca, Federal Highway Administration, personal communication (2005).
K. Edwards, “Theme 2: The Impact of Information and Communication Technol-ogies (ICT) on the Structure, Organization, and Administration of Social SecuritySchemes,” presented at the International Social Security Association Conference(Cracow, Poland June 3–4, 2004) <http://www.issa.int/pdf/cracow04/2edwards.pdf>. Accessed August 2005.
Microsimulation for Urban Transportation Planning 77
Dow
nloa
ded
by [
Okl
ahom
a St
ate
Uni
vers
ity]
at 2
3:56
20
Dec
embe
r 20
14
Federal Highway Administration (FHWA) TRANSIMS (Washington, D. C.: U. S.Department of Transportation, 2005) <http://tmip.fhwa.dot.gov/transims/>.Accessed August 2005.
J. Freedman, J. Castiglione and B. Charlton, “Analysis of a New Starts Project Usingthe San Francisco Tour-Based Model,” paper presented at the TransportationResearch Board Meetings (Washington, D. C.: January 22–26, 2006).
C. Gloor, L. Mauron, and K. Nagel, “A Pedestrian Simulation for Hiking in theAlps,” Proceedings of the Third Swiss Transport Research Conference (MonteVerita, Ascona: March 19–21, 2003).
C. Gloor, P. Stucki, and K. Nagel, “Hybrid Techniques for Pedestrian Simulations,”Proceedings of the Fourth Swiss Transport Research Conference (Monte Verita,Ascona: March 25–26, 2004).
K. G. Goulias and K. M. Henson, “On Altruists and Egoists in Activity Participationand Travel: Who Are They and Do They Live Together?” paper presented at theTransportation Research Board Meetings (Washington, D.C.: January 22–26, 2006).
J. D. Habbema, S. J. De Vlas, A. P. Plaisier, and G. J. Van Oortmarssen, “The Micro-simulation Approach to Epidemiologic Modeling of Helminthic Infections, withSpecial Reference to Schistosomiasis,” American Journal of Tropical Medicineand Hygiene 55:5 (1996) 165–9.
A. Harding, ed., Microsimulation and Public Policy (New York: Elsevier, 1996).
G. Harvey and E. Deakin, A Manual of Regional Transportation Modeling Practicefor Air Quality Analysis Version 1 (Berkeley, CA: Deakin Harvey Skabardonis,1993) <http://tmip.fhwa.gov/clearinghouse/docs/airquality/mrtm/mrtm.pdf>
K. R. Howard, “Unjamming Traffic with Computers,” Scientific American 277:4(1997) <www.vterrain.org/Cultrue/unjamming.html> Accessed August 2005.
N. Jonnalagadda, J. Freedman, W. A. Davidson, and J. D. Hunt, “Development ofMicrosimulation Activity-Based Model for San Francisco: Destination and ModeChoice Models,” Transportation Research Record 1777 (2001) 25–35.
K. Kim and L. R. Rilett, “Simplex-Based Calibration of Traffic MicrosimulationModels with Intelligent Transportation Systems Data,” Transportation ResearchRecord 1855 (2001) 80–89.
T. R. Lakshmanan and W. P. Anderson, “Transportation in the 21st Century: Tech-nological Innovation,” in T. J. Kim, ed., Transportation Engineering and Planning(New York: UNESCO-EOLOS, 2000).
C. T. Lawson, Household Travel/Activity Decisions, unpublished dissertation(Portland State University, 1998) <http://www.upa.pdx.edu/CUS/publications/specialreports.html>. Accessed June 2005.
78 Journal of Urban Technology/April 2006
Dow
nloa
ded
by [
Okl
ahom
a St
ate
Uni
vers
ity]
at 2
3:56
20
Dec
embe
r 20
14
Los Alamos National Laboratory, TRansportation ANalysis SIMulation System(TRANSIMS): Portland Study Reports (Sacramento: The Regents of the Universityof California, 2002).
Los Alamos National Laboratory, “TRANSIMS Travelogue” LAUR–98-3135 (July1998) <http://transims.tsasa.lanl.gov/travel.shtml> Accessed August 2005.
J. Morrison and V. Loose, TRANSIMS Model Design Criteria as Derived fromFederal Legislation DOT-T-95-21 (Washington, D. C.: U. S. Department of Trans-portation, 1995) <http://ntl.bts.gov/DOCS/462;.html>. Accessed August 2005.
K. Nagel and B. Raney, “Transportation Planning II: Complex Systems Applicationsfor Transportation Planning,” unpublished paper (May 31, 2003).
New York Metropolitan Transportation Council (NYMTC), Best Practices Model,General CD-ROM (2006).
C. O’Donoghue and M. Evans, “Cross-National Microsimulation Modelling:Reforming Social Assistance in Three European Countries,” Brazilian ElectronicJournal of Economics (1999) <www.beje.decon.ufpe.br/number2/evans.htm>.Accessed August 2005.
P. Okunieff and N. Neuerburg, “Transit and Open Source: Is It an Option?” unpub-lished paper (June 2005).
C. Pederson, “Data Requirements, paper presented at the Transportation ResearchBoard Meetings (Washington, D.C.: January 22–26, 2006).
J. P. A. Puvimanasinghe, E. W. Steyerberg, J. J. M. Takkenberg, M. J. C. Eijkemans,L. A van Herwerden, A. J. J. C. Bogers, and J. D. F. Habbema, “Prognosis AfterAortic Valve Replacement With a Bioprosthesis: Predictions Based on Meta-Analysis and Microsimulation,” Circulation 103 (2001) 1535–1541.
B. Raney, N. Cetin, A. Vollmy, M. Vrtic, K. Axhausen, and K. Nagel, “An Agent-Based Microsimulation Model of Swiss Travel: First Results,” Network andSpatial Economics 3:1 (2003) 23–41.
B. Raney, A. Voellmy, N. Cetin, M. Vrtic, and K. Nagel, “Towards a MicroscopicTraffic Simulation of All of Switzerland,” in P. M. A. Sloot, C. J. K. Tan, J. J. Don-garra, and A. G. Hoekstra, eds., Computational Science – ICCS 2002, Part 1 (Hei-delberg and Amsterdam: Springer, 2002).
L. R. Rilett, “Transportation Planning and TRANSIMS Microsimulation Model: Pre-paring for the Transition,” Transportation Research Record (2001) 1777.
L. Rilett, A. Kumar, and S. Doddi, El Paso TRANSIMS Case Study, FHWA/TX-03/0-2107-1 (Springfield, VA: National Technical Information Service, 2003).
Microsimulation for Urban Transportation Planning 79
Dow
nloa
ded
by [
Okl
ahom
a St
ate
Uni
vers
ity]
at 2
3:56
20
Dec
embe
r 20
14

Safe, Accountable, Flexible, Efficient Transportation Equity Act: A Legacy for Users(SAFETEA-LU) (2005) <http://www.fhwa.dot.gov/safetealu/legis.htm>. AccessedJanuary 2006.
J. R. Stone, N. M. Rouphail, B. L. Nevers, D. Dengupta, A. F. Karr, and B. K. Park,Assessing the Feasibility of Using TRANSIMS in North Carolina: The FayettevilleFort Bragg Case (Raleigh, NC: North Carolina Department of Transportation,August 2000).
K. G. Troitzsch, U. Mueller, G. N. Gilbert, and J. E. Doran, eds., Social ScienceMicrosimulation (New York: Springer, 1996).
Virginia Polytechnic and State University, “Tracing People’s Mobility: SoftwareWill Now Track Your Very Move to the Second” (2003) <http://www.eng.vt.edu/publications/2003_tracking.php>. Accessed August 2005.
P. Vovsha, “Activity-Based Models in Practice: The Mid-Ohio Regional PlanningCommission (MORPC) Model,” paper presented at the Transportation ResearchBoard Meetings (Washington, D. C.: January 9–14, 2005).
P. Vovsha, a personal communication (2006).
P. Vovsha, E. Petersen, and R. Donnelly, “Microsimulation in Travel Demand Mod-eling,” Transportation Research Record 1805 (2002) 68–77.
Paul Waddell, “Urban Sim: Modeling Urban Development for Land Use, Transpor-tation, and Environmental Planning,” Journal of the American Planning Association68:3 (2002) 297–314.
P. Waddell, H. Sevcikova, D. Socha, E. Miller, and K. Nagel, “OPUS: An Open Plat-form for Urban Simulation,” a paper presented at Computers in Urban Planning andUrban Management Conference (London, June 2005) <http://www.urbansim.org/papers/index.shtml>. Accessed August 2005.
80 Journal of Urban Technology/April 2006
Dow
nloa
ded
by [
Okl
ahom
a St
ate
Uni
vers
ity]
at 2
3:56
20
Dec
embe
r 20
14