microscopic investigations of degradation in lithium-ion
TRANSCRIPT
Microscopic Investigations of Degradation in
Lithium-Ion Batteries
zur Erlangung des akademischen Grades
Doktor der Ingenieurwissenschaften
der Fakultät für Maschinenbau
Karlsruher Institut für Technologie (KIT)
genehmigte
Dissertation
von
Dipl. –Ing. Di Chen
Tag der mündlichen Prüfung: 28. Juni 2012
Hauptreferent: Prof. Dr. rer. nat. Oliver Kraft
Korreferent: Prof. Dr. rer. nat. Michael J. Hoffmann


II
Contents
1 Introduction ...............................................................................................................1
2 Background ...............................................................................................................5
2.1 Working principle of a lithium-ion battery ..........................................................5
2.2 Intercalation materials for positive electrodes .....................................................8
2.2.1 Layered structure ..........................................................................................9
2.2.2 Spinel structure ........................................................................................... 10
2.3 Degradation of intercalation materials in positive electrode .............................. 12
2.3.1 Degradation of spinel materials ................................................................... 12
2.3.2 Solid-liquid interface .................................................................................. 14
2.3.3 Mechanical effects in intercalation materials ............................................... 16
2.4 SnO2 and CuCr2Se4 as conversion materials ..................................................... 22
2.5 Microscopic investigations of electrodes........................................................... 26
2.6 Aims of this work ............................................................................................. 28
3 Experiment .............................................................................................................. 29
3.1 Electrical measurements ................................................................................... 29
3.2 Sample preparation and electron microscopy .................................................... 33
3.3 In situ SEM experiments .................................................................................. 35
3.4 Ex situ SEM experiments.................................................................................. 39
4 Results..................................................................................................................... 43
4.1 Intercalation materials ...................................................................................... 43

III
4.1.1 LiMn1.95Al0.05O4 ......................................................................................... 44
4.1.2 LiCoO2 and LiNi0.4Fe0.1Mn1.5O4 ................................................................. 54
4.2 Conversion materials ........................................................................................ 57
4.2.1 CuCr2Se4 .................................................................................................... 57
4.2.2 SnO2 ........................................................................................................... 59
5 Discussion ............................................................................................................... 69
5.1 Conversion materials ........................................................................................ 69
5.1.1 CuCr2Se4 .................................................................................................... 69
5.1.2 SnO2 ........................................................................................................... 70
5.2 Intercalation materials ...................................................................................... 74
5.2.1 LiMn1.95Al0.05O4 ......................................................................................... 74
5.2.2 LiCoO2 and LiNi0.4Fe0.1Mn1.5O4 ................................................................. 82
6 Summary ................................................................................................................. 85
7 Acknowledgment..................................................................................................... 87
8 References ............................................................................................................... 89
IV
Abstract
Rechargeable batteries based on the lithium ion technology are promising candidates for future
mobile and stationary energy storage. The electrodes of the batteries are the most important
components which critically determine energy and power density as well as reliability. In current
electrodes, sufficient ionic and electronic conductivities can only be achieved by using small
active material particles. These small particles are often in the range of several hundred
nanometer, which complicate detailed investigations. Typical electrochemical characterization
methods can only detect average volume changes of a whole electrode. In this work, microscopic
techniques were used to locally investigate reaction and degradation mechanisms on the
nanometer scale. Besides conventional scanning electron microscopy (SEM), novel experimental
methods were developed to observe electrode materials inside the vacuum chamber of a scanning
electron microscope. An in situ SEM technique allows for monitoring the electrode morphology
in dependence to the state of charge in real time. For long term tests that require a higher number
of cycles, an ex situ technique was established that made it possible to observe the same location
of an electrode before and after a number of cycles at a defined state of charge. Both microscopic
experimental methods are helpful for investigating localized physical and chemical processes
inside the lithium cells. Such knowledge is necessary for improving the reliability and increasing
the energy density of lithium-ion batteries. The SEM investigations were used to reveal details of
the electrochemical reactions in the conversion materials SnO2 and CuCr2Se4. In
LiMn1.95Al0.05O4 a mechanical degradation pathway was identified. After a given number of
cycles cracks appeared in the particles. A strong particle size dependence of this type of damage
could be found where small particles proved to be very resistant against this damage. For very
high cycle numbers, slip was detected on the electrode particles indicating the activity of
dislocations in this theoretically brittle material. The dependence of the damage on the number of
cycles and the particle size is suggestive of a mechanical fatigue process, which may govern
degradation of such materials at high cycle numbers. In contrast to many other degradation
pathways, the mechanical degradation mechanism is inevitable. Therefore it may be of
importance for the reliability of real batteries at high cycle numbers.

V
Kurzzusammenfassung
Lithium-Ionen-Batterien sind schon heute vielfach im Einsatz und gelten als aussichtsreichste
Kandidaten für zukünftige Anwendungen für die mobile und stationäre Energiespeicherung. Die
Elektroden der Batterien sind dabei die wichtigsten Komponenten, und verfügen über einen
entscheidenden Einfluss auf die Energie- und Leistungsdichte sowie die Zuverlässigkeit.
Ausreichende ionische und elektronische Leitfähigkeiten der Elektroden können nur mit kleinen
Partikeln erreicht werden, die oft Größen im Bereich von wenigen hundert Nanometern besitzen,
weshalb neue Methoden zur Untersuchung von Materialveränderungen im Einsatz entwickelt
werden müssen. Mit den typischen elektrochemischen Charakterisierungsmethoden können zum
Beispiel nur die durchschnittlichen Volumenveränderungen einer ganzen Elektrode ermittelt
werden. In dieser Arbeit wurde Elektronenmikroskopie verwendet, um die Reaktion- und
Degradationsmechanismen im Nanometerbereich zu untersuchen. Um Elektrodenmaterialien in
der Vakuumkammer eines Rasterelektronenmikroskops (REM) zu beobachten, wurde eine in situ
REM-Technik entwickelt, die die Echtzeituntersuchung der Elektrodenmorphologie in
Abhängigkeit vom Ladezustand ermöglicht. Für Langzeituntersuchungen, die eine hohe
Zyklenzahl erfordert, wurde eine ex situ REM-Technik etabliert. Mit dieser Technik, ist es
möglich, die Morphologie an derselben Stelle einer Elektrode vor und nach einer bestimmten
Anzahl von Zyklen bei definierten Ladezuständen zu beobachten. Beide Methoden ermöglichen
die lokale Untersuchung der physikalischen und chemischen Prozesse in Lithium-Zellen. Die
damit gewonnenen Kenntnisse sind notwendig um die Zuverlässigkeit zu verbessern und die
Energiedichte zu erhöhen. Beispielhaft wurden Details der elektrochemischen Reaktionen in den
Konversionsmaterialien SnO2 und CuCr2Se4 im in situ REM-Experiment untersucht. Im ex situ
REM-Experiment, wurde eine mechanische Degradation des Interkalationsmaterials
LiMn1.95Al0.05O4 (LMAO) festgestellt. Nach der zyklischen Belastung wurden mechanische
Beschädigungen in der Form von Rissen in den Partikeln nachgewiesen. Es stellte sich heraus,
dass kleine Partikel im Gegensatz zu großen, sehr resistent gegenüber mechanischen
Beschädigungen sind, sodass ein Größeneffekt festgestellt werden konnte. Bei hoher Zyklenzahl,
weist das Auftreten von Gleitbändern an der Partikeloberfläche der Elektrode auf plastische
Verformung in diesem an sich spröden Material. Die Abhängigkeit der mechanischen

VI
Beschädigung von der Zyklenzahl und der Teilchengröße deutet auf einen mechanischen
Ermüdungsprozess hin. Damit kann auf der Basis dieser Arbeit der Schluss gezogen werden,
dass mechanische Ermüdung eine wesentliche Rolle für die Degradation der
Elektrodenmaterialien spielt und daher maßgeblich für die Zuverlässigkeit der Batterien unter
hoher zyklischer Belastung ist.
VII
Appendix
HEV hybrid electrical vehicles
EV electrical vehicles
OCV open circuit voltage
SOC state of charge
LCO LiCoO2
LMO LiMn2O4
LFP LiFePO4
LNO LiNiO2
LMNCO LiMn1/3Ni1/3Co1/3O2
LNCAO LiNi0.8Co0.15Al0.05O2
SOH state of health
LMAO LiMn1.95Al0.05O4
LMNO LiMn1.5Ni0.5O4
LMNFO LiMn1.5Ni0.4Fe0.1O4
KC fracture toughness
CCS CuCr2Se4
EIS electrochemical impedance spectroscopy
XRD X-ray diffraction
SEM scanning electron microscopy
ESEM environmental scanning electron microscope
GCPL galvanostatic cycling with potential limitation
IC incremental capacities
FIB focused ion beam
PVDF polyvinylidene fluoride
NMP N-methyl-2-pyrrolidone
TFSI bis(trifluoromethanesulfonyl)imide
BMPyrr buthylmethylpyrrolidinium
IL ionic liquid
EC ethylene carbonate
DMC dimethyl carbonate
PE polyethylene
ICA incremental capacity analysis

1
1 Introduction
In the periodic table of elements, lithium is placed under hydrogen at the upper left corner.
This position indicates that the lithium atom weighs only slightly more than hydrogen and
helium atoms and that lithium is highly electropositive. Its atomic and ionic radii are relatively
small and lithium can therefore be used to make high voltage electrochemical batteries with high
specific capacity.1 In fact, rechargeable lithium-ion batteries are advantageous compared to other
battery systems due to their high specific energy, power, reversibility and low self-discharge.
Figure 1 illustrates the specific energy density and volumetric energy density of several battery
technologies at the cell level.2 Both energy density values of lithium-ion batteries are almost
twice as high as those of Ni-MH batteries. Due to these advantages, lithium-ion batteries have
been widely used in the last two decades for example for small portable devices such as cell
phones, laptops and cameras.
Figure 1: Comparison of the different battery technologies in terms of specific and volumetric
energy density.2
The use of lithium-ion batteries in applications where long term reliability is required
such as hybrid electrical vehicles (HEV), electrical vehicles (EV), stationary energy storage

2
systems for renewable energy sources and industry machines demands higher energy densities
and increased lifetimes than what is currently available. New materials with high capacities for
lithium storage are the key to meet the ever-increasing demand for energy density. Several
conversion materials such as tin, sulphur and silicon, demonstrate a great potential for storing
more lithium than the commercial intercalation material graphite. Unfortunately, their capacities
often decrease rapidly after only a few cycles. This insufficient stability has become the major
factor limiting their applicability. Lithium-ion batteries are complex systems and details of
chemical reaction and side reactions of these novel materials in lithium cells are often not or only
partly understood. The same is true for their degradation mechanisms. Various processes occur
and interact during charge and discharge, which makes the independent investigation of
individual processes particularly difficult.3 Degradation processes can be of chemical but also of
mechanical nature. Many chemical side reactions have been intensively researched in the last
few years.4-8
A significant amount of research has been spent on simulation of various
mechanical effects in electrodes using different modelling tools.9-13
However, only few
experimental results of the mechanical behaviour of the electrode and its active material have
been reported so far.14,15
Further experimental research is needed to both prove and advance the
simulation work and is helpful for understanding the interaction between the mechanical
behaviour and chemical reactions in lithium-ion batteries.
This thesis focuses on the microscopic investigation of mechanical effects in intercalation
materials and the local morphological changes that occur during electrical cycling of selected
conversion materials. Two new methods for in situ and ex situ microscopic investigations will be
introduced in Chapter 3. The main observations acquired using these methods on different
electrode materials are then reported in Chapter 4. Besides detailed observations on conversion
materials, these results include mechanical damage that occurs in LiMn1.95Al0.05O4(LMAO)
electrodes during cycling. The relationship of these effects to the underlying chemical reactions
is discussed in Chapter 5 which also addresses the influence of cycle number and particle size on
the mechanical damage. The damage that forms consists of cracks that partly form by brittle
failure but also effects that can be described by mechanical fatigue were identified. The results of
this thesis help to better understand local reaction in conversion materials and address the
intercalation material LMAO which is of technological importance. For this material a detailed

3
picture of the mechanical response to electrical cycling emerged throughout this thesis. The
results and interpretations presented in this thesis are of direct relevance for real batteries and
may contribute to development of batteries with better long-term reliability in the future.

4

5
2 Background
Remarkable progress in lithium-ion battery technology promoted many new applications
within the last few years. In this chapter, the theoretical background of the materials under
investigation is reviewed. First, the working principle of lithium-ion batteries is introduced in
section 2.1, and then the major properties and the degradation mechanisms of two typical
intercalation materials for positive electrodes are presented in section 2.2 and 2.3. In section 2.4
the main chemical reaction and behaviour of two conversion materials for negative electrodes are
introduced. Section 2.5 gives an overview of microscopic investigations of electrode materials
that have been performed so far.
2.1 Working principle of a lithium-ion battery
Lithium-ion secondary cells have two electrodes with different chemical potentials. This
potential difference determines the open circuit voltage (OCV) of the cell. A separator prevents
the two electrodes from contacting each other. The electrolyte provides ionic conduction
between the electrodes but isolates them electronically. When the electrodes are electronically
connected by an external circuit, electrons flow from the negative electrode to the positive
electrode in order to balance the potential difference. Meanwhile, positive lithium ions run in the
same direction through the electrolyte. The stored chemical energy converts to electrical energy
in the external circuit. In secondary lithium-ion cells this process is reversible meaning that they
can be recharged by converting electrical energy to chemical energy. An external potential keeps
the electrochemical reaction running in the opposite direction. Electrons flow from the positive
electrode to the negative electrode with increasing potential difference, while lithium ions with
opposite charge go through the electrolyte. In this process, the electrical energy is restored within
the electrochemical cell (Figure 2). The reversibility of this charge and discharge process is of
importance for the lifetime of a battery.

6
Figure 2: Schematic of the working principle of lithium-ion batteries.
The stored energy can be calculated by integrating the potential difference over the
transported charge. The capacities of most battery systems decrease after several cycles. The
corresponding cell voltage depends not only on the potential difference between the electrodes,
but also on the kinetics of the reaction and impedance of the cell. Impedance increase leads to
raised voltage plateaus during charge and lowered voltage plateaus during discharge, which
causes power fading and the reduction of energy conversion efficiency. Hence the battery
lifetime is often determined by both, capacity fading and impedance increase.
The mechanisms of capacity fading and impedance increase can be quite complicated.
Most research focuses on side reactions between various components and impurities in the cells.
The electrolyte could be oxidized by the delithiated positive electrode in high potential range and
reduced by the lithiated negative electrode in low potential range. Impurities in the electrolyte
can work as catalyst in these side reactions.4-8
The kinetics of many side reactions depend
strongly on cell voltage and temperature. For example at elevated temperature the degradation of
many materials is accelerated. These side reactions cause a number of changes on electrode
materials. The red-ox reaction between the electrolyte and the electrode leads to the formation of
an interface layer, which results in capacity fading and impedance increase in different locations

7
in electrochemical cells. These effects occur often not separately. They could be influenced by
different cycling behaviour, certain storage conditions or products of side reactions.
Side reactions are not the only reason for degradation. Lithium insertion/extraction also
causes volume expansion/shrinkage. It is often the case that this process occurs inhomogenously.
Consequently, stress is induced in the active material particles and even in the whole electrode.9-
13 In case of tensile stress, materials may crack.
9,16-22 These effects could disconnect the active
material from the electronic conductive matrix and lead to loss of active material. More details of
degradation mechanisms are described in section 2.3.
8
2.2 Intercalation materials for positive electrodes
Over the last two decades, intercalation materials have been commonly used as active
materials for positive and negative electrodes in rechargeable lithium-ion batteries. These
materials have relatively stable crystal lattice structures. Small lithium ions can be
intercalated/de-intercalated in interstitial sites without significantly changing the main crystal
structure. These systems are called “rocking chair” batteries,1 where lithium ions rock between
the two electrodes during charge and discharge. The cell voltage corresponds to given lithium
content in the electrodes. The intercalation materials used in the lithium-ion batteries are
chemically and mechanically quite stable. Many of them have relatively high potential versus
lithium metal. However the specific capacities of the intercalation materials are limited to values
below 200 mAh/g, which is a main problem for improving the specific energy density of such
battery systems.
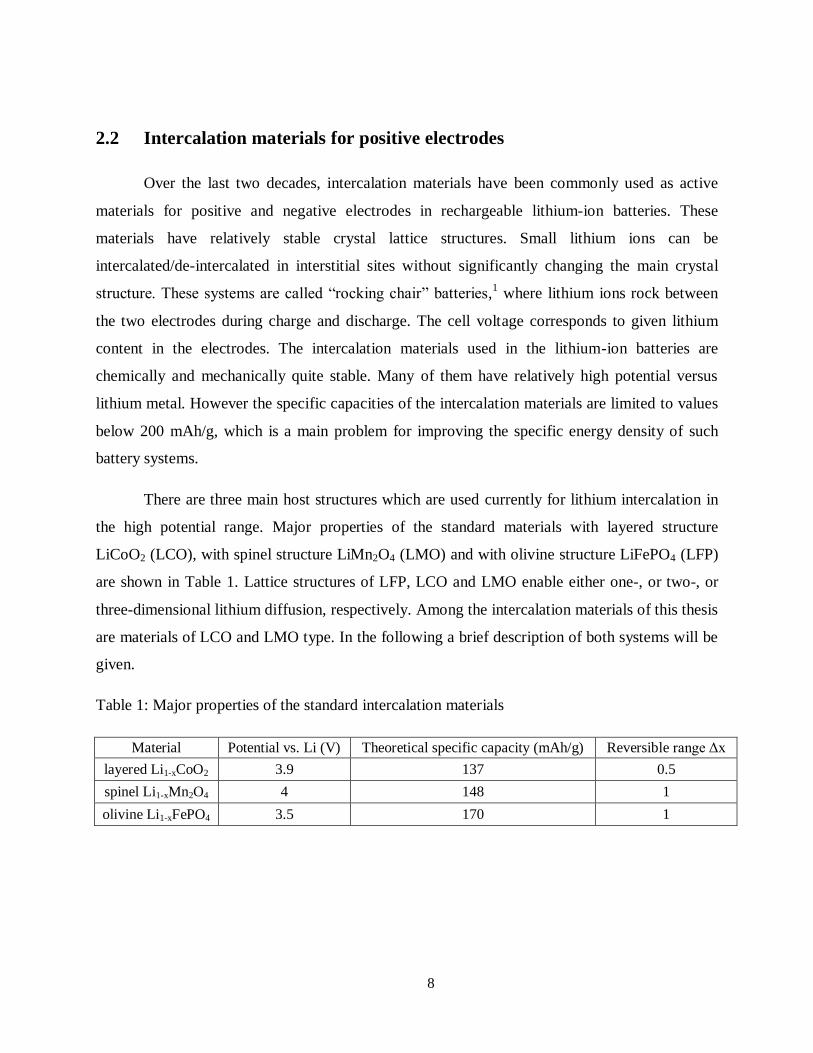
There are three main host structures which are used currently for lithium intercalation in
the high potential range. Major properties of the standard materials with layered structure
LiCoO2 (LCO), with spinel structure LiMn2O4 (LMO) and with olivine structure LiFePO4 (LFP)
are shown in Table 1. Lattice structures of LFP, LCO and LMO enable either one-, or two-, or
three-dimensional lithium diffusion, respectively. Among the intercalation materials of this thesis
are materials of LCO and LMO type. In the following a brief description of both systems will be
given.
Table 1: Major properties of the standard intercalation materials
Material Potential vs. Li (V) Theoretical specific capacity (mAh/g) Reversible range Δx
layered Li1-xCoO2 3.9 137 0.5
spinel Li1-xMn2O4 4 148 1
olivine Li1-xFePO4 3.5 170 1

9
2.2.1 Layered structure
LCO is the standard active material which has been widely used for positive electrodes
over the last decade for many mobile applications. LCO represents the layered-type structure that
has a distorted rock-salt crystal with the symmetry of space group R m.23-25
Lithium and the
transition metal cobalt occupy alternatively the octahedral sites, namely on the (111) planes of a
close-packed lattice of oxygen. The alternative (111) ordering of lithium and cobalt leads to a
distortion of the cubic lattice to hexagonal symmetry. Oxygen and the transition metal cobalt
constitute stable layered structures, in which the lithium ions could be stored (Figure 3). Many
commercial positive electrode materials, e.g. LiNiO2 (LNO), LiMnO2, LiMn1/3Ni1/3Co1/3O2
(LMNCO) and LiNi0.8Co0.15Al0.05O2 (LNCAO) are members of this material group with layered
rock-salt structure. LCO-lithium cells exhibit smooth charge/discharge plateaus around 3.9 V
and operate between 3 V and 4.3 V, which corresponds to a variation of the lithium content in
the range of 0 < x < 0.5. 23-25
LiCoO2 Li1-xCoO2 + xLi+ + xe
- (0 < x < 0.5)
The first order phase transition of two co-existing phases with space group R m occurs in
this range. Further lithium intercalation induces a distortion from hexagonal to monoclinic
symmetry. This monoclinic phase can be detected around x = 0.5. The transformation to the
monoclinic phase and the rearrangement in the stacking of the oxygen layer in the range of x <
0.25 leads to poor cyclability for charging the material to voltage higher than 4.3V.26
This means
that only half of the capacity can be reversibly used. The reversible phase transition of the
lithium content range 0 < x < 0.5 induces changes of the parameters of the hexagonal lattice. The
delithiation leads to an increase of the layer distance of ~ 2% and a decrease of the Co-Co
distances inside the Co layer.27-29
The dimensional mismatch between the two phases induces
stress near the phase boundaries.
Lithium ions can be transported within the layered structure and this material can
therefore be characterized as a 2 dimensional conductor. The diffusion coefficient of lithium in
LCO is measured and data fall into the range between 10-11
m2/s and 10
-12 m
2/s at room
temperature. Lithium diffusivity in LCO is higher than that of many other materials for example

10
with spinel and olivine crystal structures. Besides the high mobility of lithium ions, LCO also
exhibits excellent electronic conductivity. A transformation from semi conductivity to metallic
conductivity was experimentally measured during the first order phase transition in the lithium
content range 0 < x < 0.5, which is a result of the overlap of the conduction bands of the solid
phase.30,31
Key advantages of LCO based materials compared to other materials are often the
high electronic and lithium ionic conductivities.
Figure 3: Schematic of layered structure of LiMO2 with stacking of O-Li-O-M. 23
2.2.2 Spinel structure
Mn is an abundant material and compared to LCO, manganese spinel LMO is
inexpensive, non toxic, and is environmentally friendly. Additionally, the improved safety at the
cell level is another major benefit for using manganese spinel as positive electrode material. The
theoretical capacity and the electrochemical potential of LMO are similar to LCO. LMO reacts
according to the following equation where several phase transformations occur within the full
intercalation range.
LiMn2O4 Li1-xMn2O4 + xLi+ + xe
- (0 < x < 1)
Li
M
O

11
LMO spinel has a space group of Fd3m where oxygen forms a cubic close packed lattice
on the 32e sites, lithium occupies 1/8 of the tetrahedral 8a sites and the transition metal Mn
occupies 1/2 of the octahedral 16d sites. The empty tetrahedral 8a sites and the surrounding
octahedral 16c sites build up a network, where lithium ions can move in three dimensions within
the lattice.32
The lithium diffusion coefficient in the spinel structure Li1-xMn2O4 (0 < x < 1) was
found to lie between 10-12
m2/s and 10
-14 m
2/s at room temperature, which is significantly lower
than that of LCO.33-35
Figure 4: The three dimensional framework of the spinel LiMn2O4 lattice. 36
The charge/discharge curve of a LMO-lithium cell has one S type plateau at ~4 V and
one flat plateau around 4.15 V in the range of 0<x<1. Within this voltage range several phases
exist. Depending on the literature source, different phases were reported to form and coexist in
the normal operating range between 3.5V and 4.5V. The actual phases that form and coexist
during extraction and insertion of lithium seem to depend on the synthesis condition and doping
elements in the material. In all cases, the lattice shrinks/expands when lithium is
removed/inserted, which leads to a reversible volume change of the undoped material of ~ 2.3%
during charge and discharge. The change in lattice constant is not a linear function of the lithium
concentration and depends on the individual phases and phase transformations. 37-40

12
2.3 Degradation of intercalation materials in positive electrode
Degradation of lithium-ion cells, such as capacity fading, power loss and impedance rise
can be detected after battery operation under different conditions. Degradation processes in
electrodes are of great technological importance and have been intensively studied. Major
degradation effects have been attributed to some of the following mechanisms: 4-8
Binder decomposition
Current collector corrosion
Structural disorder of the active material
Dissolution of electrode material in the electrolyte
Mechanical damage of electrode materials
Decomposition of the electrolyte
Surface layer formation on the electrode materials
Loss of contact between active material particles and electronic conductive matrix
All of these processes are either induced by chemical/physical reactions or combinations
thereof and take place under different operation conditions and occur at various voltages. Of
particular interest for this thesis are the subsets of physical reactions that are due to mechanical
effects.
2.3.1 Degradation of spinel materials
The major degradation process of LMO as positive electrode material in lithium-ion cells
is caused by the Jahn-Teller distortion in deeply discharged state and manganese dissolution in
the electrolyte solvent. Deeply discharging of LMO to 3V versus lithium results in Mn3+
ion
formation in the lattice, where lithium ions may migrate from tetrahedral 8a sites into the
octahedral 16c sites. This results in an asymmetric unit cell distortion.38
Due to Jahn-Teller effect,

13
the lattice symmetry changes from cubic to tetragonal.32,41,42
This has severe consequences in the
electrochemical behaviour in the 3V range where the reversibility of this material is rather poor.
At these potentials, a disproportion of trivalent manganese (Mn3+
) into tetravalent Mn4+
and
divalent Mn2+
takes place. The Mn2+
ions produced in the reaction dissolve in the electrolyte and
are deposited onto the graphite negative electrode where they can enhance electrolyte
decomposition. Consequences of the Jahn-Teller distortion are the degradation of both positive
and negative electrodes.43,44
Moreover, products of further side reactions, for instance MnF2,
MnCO3 and oxides may build electronic isolating films on the active material particle surface.
This process is a typical example that shows how complex and interlinked degradation processes
can be and that several materials (both electrodes and electrolyte) can play together in the
degradation of a lithium-ion battery.
Partial substitution of manganese in the 16d site with lower valent atoms (Li, Mg, Al,
Ni(III), Fe(III), Co(III)) increases the average oxidation state of Mn ions above +3.5. In this way,
the disproportion reaction and the Jahn-Teller distortion can be suppressed, which benefits the
long-term stability of the electrodes and consequently the cycle life of the cell. For example
Spinel LiMn2-xAlxO4 compounds with partial substitution of Mn(16d) by Al(16d) exhibit
strongly improved cyclability and rate capability at room and elevated temperatures compared to
LMO. The two red-ox reactions at 4 V and 4.15 V indicate inactivity of Al substitution in the
electrochemical process. The XRD diffraction suggests a cubic spinel structure with Fd m
symmetry for LiMn2-xAlxO4 where the lattice parameter of LiMn2-xAlxO4 decreases linearly with
increasing Al substitution.45
For x=0.05, LiMn1.95Al0.05O4 has a lattice parameter that is 0.02 Å
smaller than that of LMO. The variation in lattice parameter caused by lithium insertion and
extraction becomes smaller with increasing Al content 46
which was explained by the stronger
bond between Al-O in comparison to the Mn-O bond. A test cell with LiMn2-xAlxO4 (x=0.3)
exhibited a low capacity loss of 2% at 25°C after 50 cycles, which was much smaller than the
capacity loss of 14.2% observed under the same conditions for LiMn2O4.46
Also small amounts
of Al such as x=0.05 are beneficial for improving the reliability.
The spinel LiMn1.5Ni0.5O4(LMNO) is formed by replacing 0.5 Mn in LiMn2O4 by Ni.
This material shows a higher potential versus lithium than LMO. Lithium-LMNO cells exhibit
14
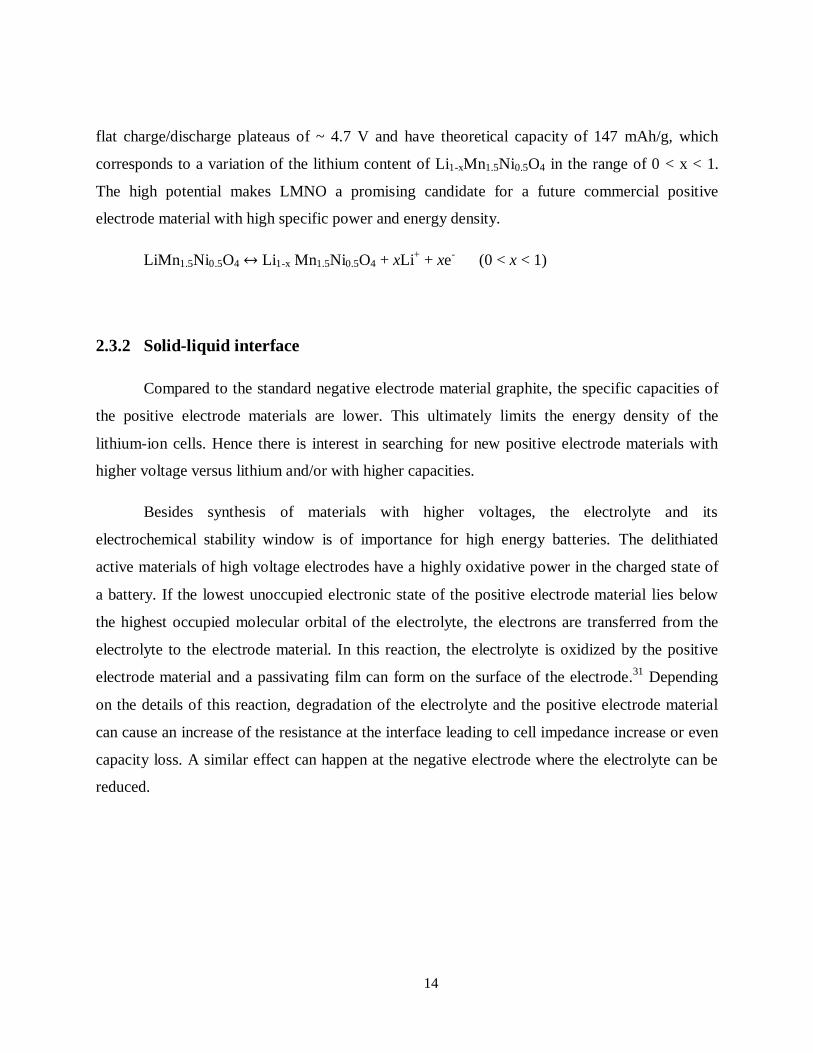
flat charge/discharge plateaus of ~ 4.7 V and have theoretical capacity of 147 mAh/g, which
corresponds to a variation of the lithium content of Li1-xMn1.5Ni0.5O4 in the range of 0 < x < 1.
The high potential makes LMNO a promising candidate for a future commercial positive
electrode material with high specific power and energy density.
LiMn1.5Ni0.5O4 Li1-x Mn1.5Ni0.5O4 + xLi+ + xe
- (0 < x < 1)
2.3.2 Solid-liquid interface
Compared to the standard negative electrode material graphite, the specific capacities of
the positive electrode materials are lower. This ultimately limits the energy density of the
lithium-ion cells. Hence there is interest in searching for new positive electrode materials with
higher voltage versus lithium and/or with higher capacities.
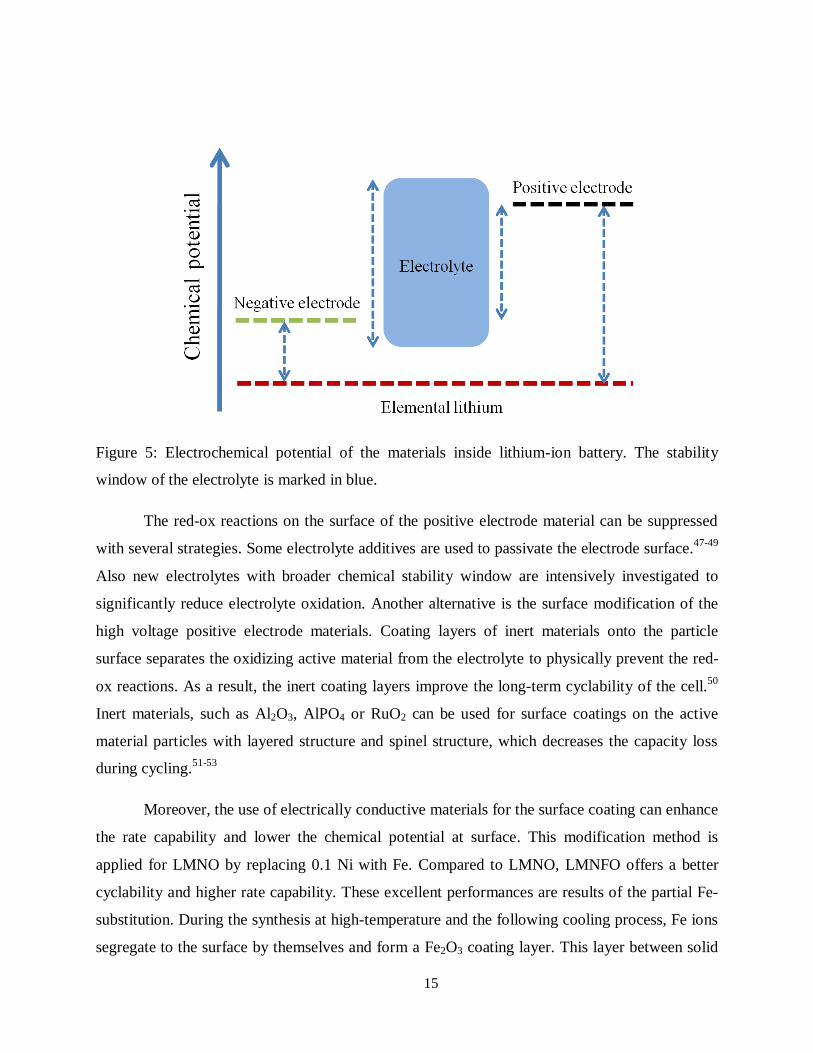
Besides synthesis of materials with higher voltages, the electrolyte and its
electrochemical stability window is of importance for high energy batteries. The delithiated
active materials of high voltage electrodes have a highly oxidative power in the charged state of
a battery. If the lowest unoccupied electronic state of the positive electrode material lies below
the highest occupied molecular orbital of the electrolyte, the electrons are transferred from the
electrolyte to the electrode material. In this reaction, the electrolyte is oxidized by the positive
electrode material and a passivating film can form on the surface of the electrode.31
Depending
on the details of this reaction, degradation of the electrolyte and the positive electrode material
can cause an increase of the resistance at the interface leading to cell impedance increase or even
capacity loss. A similar effect can happen at the negative electrode where the electrolyte can be
reduced.
15
Figure 5: Electrochemical potential of the materials inside lithium-ion battery. The stability
window of the electrolyte is marked in blue.
The red-ox reactions on the surface of the positive electrode material can be suppressed
with several strategies. Some electrolyte additives are used to passivate the electrode surface.47-49
Also new electrolytes with broader chemical stability window are intensively investigated to
significantly reduce electrolyte oxidation. Another alternative is the surface modification of the
high voltage positive electrode materials. Coating layers of inert materials onto the particle
surface separates the oxidizing active material from the electrolyte to physically prevent the red-
ox reactions. As a result, the inert coating layers improve the long-term cyclability of the cell.50
Inert materials, such as Al2O3, AlPO4 or RuO2 can be used for surface coatings on the active
material particles with layered structure and spinel structure, which decreases the capacity loss
during cycling.51-53
Moreover, the use of electrically conductive materials for the surface coating can enhance
the rate capability and lower the chemical potential at surface. This modification method is
applied for LMNO by replacing 0.1 Ni with Fe. Compared to LMNO, LMNFO offers a better
cyclability and higher rate capability. These excellent performances are results of the partial Fe-
substitution. During the synthesis at high-temperature and the following cooling process, Fe ions
segregate to the surface by themselves and form a Fe2O3 coating layer. This layer between solid

16
particles and the electrolyte could avert electrolyte decomposition and prevent formation of a
thick isolating surface layer and therefore reduces the surface resistance. This morphology and
its influence on the electrochemical performance have been proven experimentally.54
The self-
surface segregation offers a new alternative for improving the surface chemical stability with low
processing cost. A high lithium ion diffusion coefficient in the order of 10-9
m2/s was measured
in the LMNFO bulk. This high diffusion coefficient might be due to stabilization of the
disordered structure which improves the lithium intercalation and stronger Fe-O bonding which
weakens the Li-O bonding, thereby easing lithium ion insertion in the host lattice.55
Most of the positive electrode compounds have low intrinsic ionic lithium conductivities
and electronic conductivities, which can limit the reaction kinetics of the whole cells. Synthesis
of small particles with dimensions on the nanometer scale is a common strategy to overcome this
material problem. A high surface area/volume ratio reduces the diffusion/conduction length and
increases the interface area between the active material and the electrolyte which together leads
to an increase in the rate capability. However, more solid/electrolyte interface area do not only
improves the lithium intercalation but also affects the side red-ox reactions, the solid-electrolyte-
interface (SEI) formation and therefore can lead to irreversible capacity loss. A linear
dependence of the electrolyte oxidation on the particle surface area has been experimentally
measured.56
Moreover, nano-structured electrodes with high surface areas may also induce some
safety problems due to their enhanced reactivity. The particle size is therefore not only
determining the electrochemical performance but also affecting safety and aging of a battery. It
is therefore often necessary to compromise between these aspects and synthesize particles of
optimum size for a given application. As will be shown in Chapters 4 and 5, there is also a strong
effect of particle size on mechanical degradation and the long term reliability of certain electrode
materials.
2.3.3 Mechanical effects in intercalation materials
All intercalation materials mentioned above exhibit lattice constant changes by lithium
ion insertion and extraction due to valence change of the transition metals.36
The change in the

17
lattice parameter is not necessarily a homogenous process. During the electrochemical reaction,
lithium ions are first inserted in the particle surface and, then they diffuse into the bulk material.
This leads to a lithium concentration gradient inside the particles. As a result, the related lattice
misfit induces stresses in the particles.
Recently, intercalation induced stresses in the particles and their impact on the battery
life-time has attracted much interest. Different mathematical models have been developed to
understand the evolution of lithium concentration and the related stresses, which may cause
fracture of the active materials. Cheng and Verbrugge have developed analytic solutions for the
stresses distribution and their evolution within a spherical element during lithium de-
/intercalation in single phase.9,10
A dimensionless electrochemical Biot number in heat-transfer
problems was used to describe the reaction kinetics and the diffusion conditions at the particle
surface and inside the particles, which corresponds to the interfacial resistance and the diffusion
resistance. Large Biot numbers represent small interfacial resistance and large lithium gradient in
the solid. They found that tensile stresses and shear stresses were induced in the particles during
both charge and discharge. The maximum tensile stresses are induced in the centre of particles in
both radial and tangential directions during lithium intercalation. During lithium extraction, the
maximum tensile stresses are formed at the particle surface in the tangential direction. The
dimensionless electrochemical Biot number strongly affects the lithium concentration
distribution and thereby the intercalation induced stresses (Figure 6), which means that the
interfacial kinetics and the ionic diffusion in the particles play a critical role in the mechanical
behaviour of the electrode.

18
Figure 6: Maximum radial (tensile (+), in blue) and tangential (compressive (-), in red) stresses
in the particles within a range of the electrochemical Biot number values during lithium insertion.
The stresses σr(R) and σθ(0) are nondimensionalized through dividing by EΩc(ΘR-Θ0)/3/(1-ν),
where E is Young’s modulus, Ω is the partial molar volume of the solute, c is the concentration
of sites available for lithium insertion, Θ is the concentration of the filled host site, and ν is
Poisson’s ratio. For more details of the analytic solutions see 9.
Another source of stresses is independent of the insertion and extraction kinetics. Besides
changes in lattice parameters, lithium insertion/extraction into/out of host materials often causes
phase transformations. Here stresses are due to the coexistence of two phases and appear when
two phases with different lattice parameters or crystal symmetries are in contact. This is a
phenomenon common to most materials and happens in many layered structures, spinels, and
olivines. Deshpande et al. analytically described the stresses evolution at the phase boundaries
during the phase transformation and its dependence to the material parameters.11
They used a
core-shell structure to simulate the moving interface between a lithium rich phase and a lithium

19
poor phase during lithium extraction (Figure 7, Figure 8). In their model the lithium rich core is
under compressive stress due to the shrinkage of the shell. In the lithium poor phase, the
calculated stress is compressive in the radial direction and tensile in the tangential direction
(Figure 9). The maximum tensile stress is found at the particle surface. At the phase boundary, a
stress discontinuity is found in the tangential direction, where the compressive stress in the
lithium rich phase changes to tensile stress in the lithium poor phase (Figure 10). This stress
discontinuity depends strongly on the ratio of Young’s modulus and the volume ratio of the two
coexisting phases.
Figure 7: Core-shell model simulating a moving interface between a lithium rich phase β and a
lithium poor phase α during lithium extraction.11
Figure 8: Concentration profile during phase transformation induced by lithium extraction.11

20
Figure 9: Stresses components along the radial direction induced by a phase transformation
happening during lithium extraction. The radial stress σr is nondimensionalized through dividing
by ΩαCαEα/3/(1-ν), where Ω is the partical molar volume of the solute, C is the molar
concentration, E is Young’s modulus and ν is Poisson’s ratio.11
21
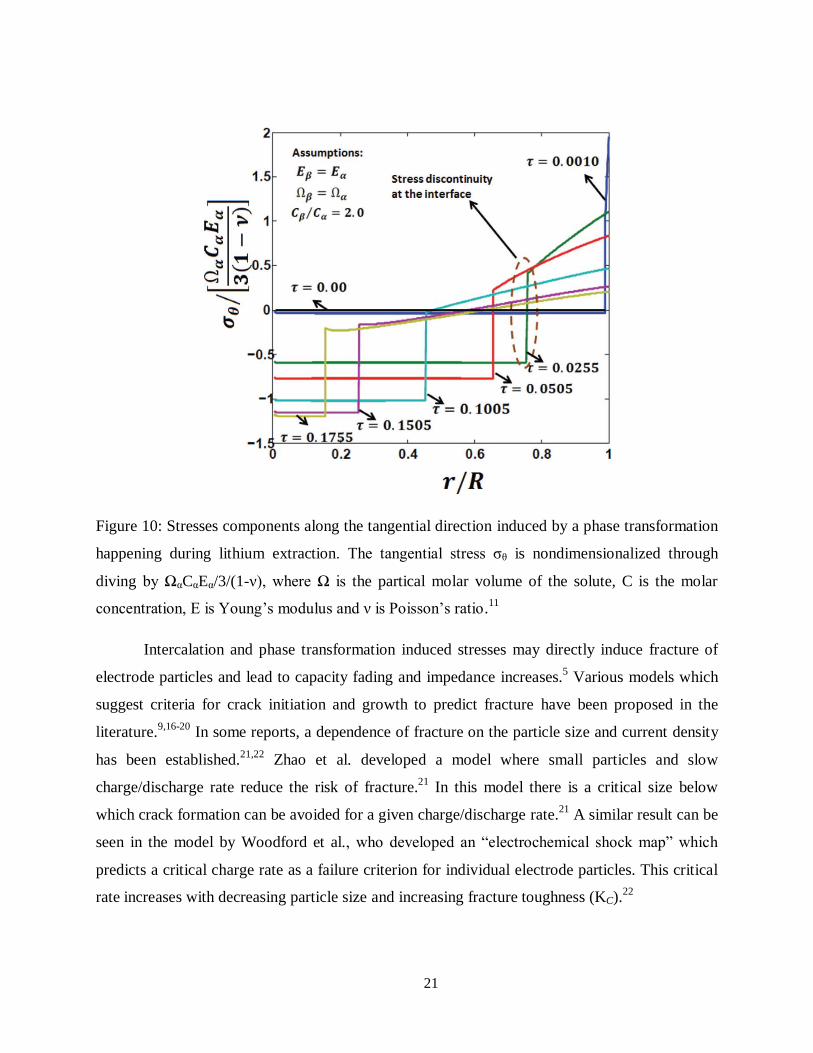
Figure 10: Stresses components along the tangential direction induced by a phase transformation
happening during lithium extraction. The tangential stress σθ is nondimensionalized through
diving by ΩαCαEα/3/(1-ν), where Ω is the partical molar volume of the solute, C is the molar
concentration, E is Young’s modulus and ν is Poisson’s ratio.11
Intercalation and phase transformation induced stresses may directly induce fracture of
electrode particles and lead to capacity fading and impedance increases.5 Various models which
suggest criteria for crack initiation and growth to predict fracture have been proposed in the
literature.9,16-20
In some reports, a dependence of fracture on the particle size and current density
has been established.21,22
Zhao et al. developed a model where small particles and slow
charge/discharge rate reduce the risk of fracture.21
In this model there is a critical size below
which crack formation can be avoided for a given charge/discharge rate.21
A similar result can be
seen in the model by Woodford et al., who developed an “electrochemical shock map” which
predicts a critical charge rate as a failure criterion for individual electrode particles. This critical
rate increases with decreasing particle size and increasing fracture toughness (KC).22

22
2.4 SnO2 and CuCr2Se4 as conversion materials
Compared to intercalation materials, many conversion materials have considerably larger
theoretical capacities for storing lithium. In conversion materials, chemical reactions with
lithium happen locally and in comparison to intercalation materials, drastic changes in chemistry,
morphology and structure occur. One example of a conversion reaction is the reduction of an
oxide and the formation of a metal. In this reaction the active material MbX can be reduced to
form LiaX and metal M. In some cases these reactions show some reversibility (Reaction 1). In
some cases the metal M can further alloy/de-alloy with lithium (Reaction 2).57,58
MbX + aLi ↔ LiaX + bM (Reaction 1)
M + cLi ↔ LicM (Reaction 2)
The oxidation state of M in the MbX compound determines the specific capacity for the
storage of lithium. Compared to the metallic elements in the intercalation materials, many
metallic elements in the conversion material can be reduced or oxidized further during lithium
insertion and extraction. Hence the theoretical capacities of these compounds are also larger.57
Despite their high capacities, there are several problems associated with such conversion
materials. When the material is used as negative electrode, due to metallic alloying, the
electrochemical potential of the alloy increases compared to pure lithium, which results in a
reduction of the cell voltage. Lithium insertion/extraction into/from many conversion materials
causes large volume expansions/shrinkages, which are larger than that of intercalation materials.
These volume changes may induce large stresses and can destroy the electrode structure. As a
result, the conductivity of the electrode decreases and the internal resistance increases.
Furthermore, new phases are formed during the reaction with lithium. In the case where the new
phases are no longer in contact with the matrix, the reaction can become irreversible. For these
reasons, many conversion materials only show a small fraction of their theoretical capacity in
real cells. The measured capacities of many conversion materials are known to decrease rapidly
after only a couple of cycles.

23
The conversion materials tin oxide (SnO2) and chromium copper selenide (CuCr2Se4) are
investigated in this work. Both are materials can be used for negative electrodes. CuCr2Se4(CCS)
is an interesting model system which shows a novel reaction mechanism. It has a spinel-type
crystal structure (space group Fd m). In this structure, selenium atoms build up a cubic close
packed lattice, in which the copper and chromium atoms are coordinated in the tetrahedral and
octahedral sites. CCS shows metallic electronic conductivity. The ionic configuration is
approximately Cu+Cr2
3.5+Se4
2-.59
Bodenez et al. found a combined displacement and intercalation
mechanism in this spinel type during an electrochemical reaction with lithium.60,61
Details of the
reaction pathway and the reversibility are not known yet. Lithium insertion reaction in this spinel
system is interesting because of the effects of anion and cation substitution on the reaction
mechanisms.62
Tin (Sn) reacts with lithium and forms a LixSn alloy (0 ≤ x ≤ 4.4) at room temperature
(Reaction 4, Figure 11). This reaction is reversible and Sn can be used as an electrode material
for reversible lithium storage. LixSn alloy has a relatively low voltage versus pure lithium and
shows a large theoretical capacity of 991 mAh/g (Figure 13).63
This capacity is almost three
times that of graphite which is today’s standard negative electrode material. Unfortunately, Sn
shows a rather poor reliability as electrode material. This may be due to the 3.6 fold volume
expansion that occurs during lithium insertion.64
Such large volume expansions may induce
mechanical stresses and crack initiation in the electrode. Consequently, the conductivity of the
electrode is reduced, the capacity decreases and the internal resistance increases, resulting in a
poor cycling stability (Figure 13).63

24
Figure 11: Phase diagram of Li-Sn.
4Li + SnO2 → 2Li2O + Sn (Reaction 3)
xLi + Sn ↔ LixSn (0 ≤ x ≤ 4.4) (Reaction 4)
One concept to increase the cycle life of tin-based electrodes is to use SnO2 as the starting
material. In an initial reaction the oxygen from the SnO2 reacts with lithium to form an
amorphous Li2O matrix and elementary Sn (Reaction 3). It is speculated that the reduced Sn is
dispersed in the form of very small particles inside the Li2O matrix. This matrix may help to
distribute stresses that occur in the Sn particles during alloying with lithium. The Li2O matrix

25
improves the cycling stability of the electrode by preventing the Sn metal particles from
agglomerating. Once significantly large Sn entities are formed, the large volume changes induce
sufficient stresses to damage the matrix (Figure 12).63
The theoretical capacity of SnO2 of the
first discharge based on formation of Li2O and lithium alloying with Sn is 1491 mAh/g.63
The
theoretical capacity of the second discharge based on Li4.4Sn alloying is 781 mAh/g. The
capacity of the second discharge is assumed to be reversible. The observed capacity is commonly
smaller than the theoretical value and decreases during electrical cycling (Figure 13).
Figure 12: Mechanism for lithium storage in SnO2 particles.
Figure 13: Voltage profile of Sn and SnO2 versus lithium in the first three cycles.63

26
2.5 Microscopic investigations of electrodes
Typically new battery materials are tested using galvanostatic charge/discharge or cyclic
voltammetry which can only give spatial averages of the battery behavior and does not account
for the local aspects that occur inside a battery. Also other testing methods commonly employed
such as electrochemical impedance spectroscopy (EIS) or in situ X-ray diffraction (XRD) can
only be used to monitor spatial averages of an electrode. Since electrode materials are inherently
nano-scale materials, local observations of these materials at high resolutions can be helpful to
understand the microscopic processes that occur inside nano-particles and at their interfaces with
the electrolyte. In situ optical microscopy of the electrode materials has been carried out by
several research groups.65-67
However, the resolution of optical microscopy is rather limited and
is often too low for most of the nano-scale materials.
Scanning electron microscopy (SEM) and transmission electron microscopy (TEM)
offers a much higher resolution but is difficult to perform on a working battery due to the high
level vacuum that is needed and the presence of high energy electrons which can interfere with
the battery operation. In previous SEM investigations of lithium batteries,68,69
the cells had to be
dismantled and the electrolyte had to be removed before they were observed. Risk of damage and
contamination are significant in this case and extreme care needs to be taken to keep the battery
materials away from atmosphere or moisture where they could be altered by the reactions with
oxygen, nitrogen or water.70
Previous attempts of in situ SEM battery experiments have been pursued by several
groups.71-73
The different concepts for SEM observations are briefly summarized as follows:
Baudry et al. 71
used a polymeric electrolyte. Because of the low ionic conductivity, the batteries
had to be heated to achieve reasonable rates. The influence of the heating on the battery could
not be investigated. During the transfer process to the vacuum chamber of the SEM, the battery
was in contact with the atmosphere for about 30 seconds. Orsini et al. 72
used an electrolyte that
is commonly used in commercial batteries consisting of ethylene carbonate/dimethyl carbonate
solution with 1 M LiPF6 salt. After a given number of cycles the batteries were cooled to -20 °C
to freeze the electrolyte and then transferred into the SEM under protective atmosphere.

27
Contamination could be prevented in this way but the batteries could not be electrically cycled
inside the SEM. Another approach was taken by Raimann et al. 73
, who used carbonate solvents
(ethylene carbonate and propylene carbonate) with high boiling point as an electrolyte in an in
situ environmental scanning electron microscope (ESEM). ESEMs allow the imaging of samples
with higher vapor pressures. In certain cases even wet samples can be imaged. Unfortunately, the
resolution of such SEMs is typically reduced due to scattering of electrons in the gas atmosphere
that is present inside the SEM chamber. Since the electrolyte evaporated, experiments had to be
carried out quickly. Recently, Huang et al. 74
constructed a electrochemical cell inside a high-
resolution transmission electron microscope (HRTEM), consisting of SnO2 nanowires as the
anode, an ionic liquid based electrolyte, and LCO as the cathode material. By using this setup,
they successfully observed the lithiation process of the SnO2 nanowires in situ. The experiment
was controlled by a potentiostat during electrochemical charging and important details of
material evolution that comprise the lifetime of the cell was found.74
In this work an alternative attempt was used. In situ SEM experiments were performed in
high vacuum using an ionic liquid based electrolyte. This experimental concept combines high
resolution imaging with real-time observation during galvanostatic charging and discharging of
the electrochemical test cell. Experimental details can found in section 3.3 and results from this
method are presented in section 4.1.

28
2.6 Aims of this work
Although many calculations and simulations of stress distributions 9-13
and mechanical
failure processes 21,22
in electrodes for lithium batteries have been performed, so far there are
only a limited number of experimental observations of the mechanical behaviour of electrode
materials in batteries.14,15
Experiments focusing on the detailed microscopic and mechanical
response of electrode materials are useful to assess the importance of mechanical effects for the
cycle life of real batteries. This work focuses on the microscopic and mechanical behaviour of
different electrodes for lithium-ion batteries. SEM observations were used to investigate
electrode materials. In order to perform these experiments experimental techniques have been
developed and applied to a set of materials.
Battery experiments on electrodes made from conversion materials SnO2 and CCS have
been performed in situ inside the SEM. Aims of these experiments are the exploration of reaction
pathways and to investigate reversibility and associated processes during battery operation. Of
interest were the observations of effects on the particle surfaces and the observation of volume
expansions and associated morphological changes and how these effects influence the
reversibility of the electrochemical reactions in the cell.
Besides conversion materials, electrodes containing commercial intercalation materials
LMAO, LCO and LNMFO have been tested in electrochemical cells and investigated ex situ by
SEM. In these experiments it was possible to test electrodes up to several hundreds of cycles and
interrupt cell operation at any time to monitor changes in the electrodes. This work concentrated
on the mechanical processes occurring in real batteries. The results show that mechanical effects
and damage are prevalent even in conventional batteries. The acquired lifetime data and the
detailed observations and descriptions of the mechanisms help to obtain a clearer picture of the
mechanisms governing battery operation and may be used in the future to prove and advance
simulation efforts.

29
3 Experiment
The chemical reactions and physical processes occurring inside lithium-cells determine
both battery performance and life time. Common batteries and electrochemical processes are
characterized by various experimental methods such as electrical measurements, diffraction or
spectroscopy techniques like XRD, NMR or EIS and other volume averaging techniques as
mentioned in the last chapter. Besides these tools that average over relative large volumes, local
investigations are useful to identify and explore mechanisms in batteries. Local investigations
with high spatial resolution are motivated by two reasons. First, the use of powders with small
particle sizes which are often only a few tens of nanometers has become a common strategy for
using new materials and enhancing the performance of batteries. Second, many reactions occur
inhomogenously in the electrodes and a high spatial resolution is needed. For these reasons, in
this thesis methods have been developed that allow for the investigation of electrode materials in
high resolution inside an SEM. Section 3.3 introduces a special in situ technique and section 3.4
describes a technique that has been developed to enable investigation of electrodes after a large
number of cycles. This method is also non-destructive and the same region of an electrode can be
compared after different numbers of cycles.
3.1 Electrical measurements
Electrical measurements help to characterize reactions occurring in electrochemical
lithium cells. In lithium-ion batteries, one electron moving in the external cuicirt always
corresponds to a lithium positive ion running through the electrolyte. Therefore, the lithium
content in the active material measures the state of charge (SOC) of a secondary lithium ion cell.
SOC can not be directly determined and is typically identified by measuring OCV or transferred
electrical charge Q.
OCV corresponds to the chemical potential difference between the two electrodes and
can be usually estiamted from the cell voltage V by using a correction term that depends on the
cell impedance, the used current and the cell temperature. Due to small voltage changes in the

30
charge/discharge plateaus and complicated measurements, this methode is difficult to apply for
lithium-ion batteries.
Alternatively, SOC can be calculated by integrating current in time. A cell voltage is
defined as SOC = 0. Changes of SOC can be then easily estimated by the transferred electrical
charge. This methode is used in this work for calculating SOC, lithium content in the active
materials, and active cell capacity. Furthermore, the relationship of OCV and cell voltage during
charge and discharge can be used to determine the cell resistance changes. In this work, the
capacity and resistance changes are values used to characterize the cell degradation, which is
caused by the micro-structural evolution of electrode materials upon lithium insertion/extraction.
Electrochemical cells are commonly tested in two basic modes, either under current or
voltage control. The current-controlled galvanostatic mode is often used for measuring long term
behaviour of a cell, while the potential controlled voltammetry mode is more suitable for
measuring reaction kinetics. For determining the degradation behaviour in long term cycling, a
potentiostat/galvanostat (VMP3, Bio-logic SAS, Claix, France) with the current controlled mode
“galvanostatic cycling with potential limitation (GCPL)” was used for all ex situ Swagelok-cells
in this work. The lithium cells for in situ SEM observation were also cycled galvanostatically
with potential limitation using a Keithley 2400 series source-meter controlled by a home-built
LabviewTM
program.
During the galvanostatic tests, the cells were cycled by applying a constant
charge/discharge rate. The charge/discharge rates are commonly expressed as C/h, where h is the
time needed, in hours, for charging/discharging the battery with the nominal charge. Typical
rates in the experiments ranged from C/20 to 5C. During the tests, cells were always cycled
within a given voltage range for preventing cells from overcharge or deep-discharge. Due to the
potential limitation of the galvanostats, the current was always reversed when one of the voltage
limits was reached, so that the cell was cycled within the voltage window. By using a constant
charge/discharge current, the transferred electrical charge can be easily calculated by multiplying
current by time. In other words, the measured charge changes linearly with the test time.

31
Incremental capacity analysis
During galvanostatic charge and discharge, the electrochemical reactions take place at a
constant rate. The rate of voltage change is extremely low during charge/discharge plateaus. In
other words, the incremental capacity (IC) is relatively high at these voltages. IC Peaks can be
found in a diagram, where dQ/dV (Q: transferred electrical charge, V: cell voltage) is plotted
versus the cell voltage. Such a diagram bears resemblance to cyclic voltammetry and can be used
for quantifying the electrochemical process in the cells.75
Due to ageing effects, the measured parameters such as the IC peak value and the related
voltage often change with the number of cycles. Typical changes are shown in Figure 14 and
Figure 15 by comparing the curve in solid (begin of life) and the curve in dash (end of life).
When the IC decreases, the cell loses charge/discharge capacity, which can be recognized in
Figure 14 by comparing the curves. Figure 15 shows a peak shift to higher voltage values during
charge and to lower voltage values during discharge, while the shape of the peak keeps
unchanged. This observation indicates increasing ohmic resistance of the cell. The measured IC
curve in the practice normally contains a combination of different mechanisms. Incremental
capacity analysis (ICA) allows a continuous detecting of the cell degradation in the form of
resistance increase or capacity loss. However, the absolute value of impedance cannot be
measured in a galvanostatic test.

32
Figure 14: Decreasing IC value indicates capacity fading by comparing the curves of begin of
life and end of life.
Figure 15: Voltage shift suggests ohmic resistance change by comparing the curves of begin of
life and end of life.

33
3.2 Sample preparation and electron microscopy
Before the details about the electron microscopic methods are introduced, a brief
description of the microscope will be given. For all of the experiments, a dual beam SEM/FIB
(FEI Nova Nanolab 200) was used. It was used for imaging and in a few cases for cross
sectioning active material particles in the working electrodes by using the ion beam. In this
microscope, an electron column is placed above the sample stage which emits an electron beam
for sample imaging at high resolutions down to ~ 1 nm. The gallium-ion source is mounted at an
angle of 52° relative to the electron column (Figure 16). The gallium-ion beam generated from
the ion source can be used for both imaging and machining particles with a maximum resolution
of ~ 7 nm. The sample can be simultaneously imaged by the electron beam and machined by ion
beam at the eucentric height, where the two beams intersect on the sample surface. Besides
rotation, the stage can be tilted from -10° to +52°, so that the particles can be machined and
imaged at different angles.
The SEM images of the working electrodes, which were electrically cycled in the
Swagelok-cells, were taken at 10 kV acceleration voltage at a beam current of 0.54 nA. Some
particles were machined by gallium-ion beams with 30 keV energy. The cross sections of these
particles were then imaged using the electron beam.

34
Figure 16: Schematic of dual beam microscopy system SEM/FIB.

35
3.3 In situ SEM experiments
The in situ lithium cell consisted of two electrodes and was designed in a way that allows
for the observation inside the SEM. Therefore it had to be vacuum compatible and needed to be
electrically connected through the microscope. The lower electrode consisted of pure lithium
(99.9% purity, 0.12 mm thick, Goodfellow). The working electrode, which contained the
material under investigation, was placed on the top of the cell stack (Figure 17).
Figure 17: Setup of the lithium cell for the in situ SEM observation.
The working electrode had to be permeable for the electrolyte and therefore a stainless
steel mesh (DIN 1.4401/AISI 316) was used as current collector. As in normal batteries, the
electrode coating on this mesh was composed of the active material, polyvinylidene fluoride
(PVDF) as a binder and carbon black for enhancing electronic conductivity. These materials
were milled and mixed using mortar and pestle, and then several drops of N-methyl-2-
pyrrolidone (NMP) were added to dissolve the PVDF binder. The slurry was then coated onto the
stainless steel mesh and dried in air at room temperature for 24 hours. Additional drying
occurred in a furnace at 90 °C for another 24 hours in order to remove the remaining NMP and

36
minimize water content. For the electrolyte, an 0.5 M solution of
lithium-bis(trifluoromethanesulfonyl)imide (Li-TFSI lithium conductive salt) in
buthylmethylpyrrolidinium-TFSI (BMPyrr-TFSI, ionic liquid, provided by Ionic Liquid
Technologies GmbH, Heilbronn, Germany) was used. The water content of the ionic liquid (IL)
was investigated using coulometric Karl-Fischer titration and values below 120 ppm in the as
received state and below 30 ppm in the additionally dried state were determined. Due to its very
low vapour pressure, the ionic liquid solvent could be easily used inside the vacuum of the SEM
chamber. Preliminary tests showed that this electrolyte was even compatible with ultra high
vacuum (pressures below 10-8
mbar). As a separator, a laboratory filter paper (100% borosilicate
glass microfibre GF/B from Whatman) was used.
Several steps were needed to assemble the test cell. First, the lower part was assembled
inside a glove box under protective argon atmosphere and the upper part containing the working
electrode was placed on top of separator inside the SEM. Next, for the lower part, a standard
SEM stub made from aluminium was covered by a thin copper foil (99.9% purity, Goodfellow).
After that, a small piece of lithium was mounted onto this copper foil and the separator was
placed on top of it and soaked with a few drops of the IL-based electrolyte. Once completed, the
lower part of the cell was ready for transfer to the SEM. Since it contained the electrolyte and
elementary lithium, it had to be protected from the atmosphere during transfer. For this purpose,
a home-built transfer system was used. It consisted of a small container that hermetically
enclosed the lower part of the test cell and was mounted into the SEM chamber (Figure 18).
After the chamber of the SEM was pumped to ~10-5
mbar, the container was opened. The
transfer system could be opened and closed using the motion and rotation of the SEM stage.

37
Figure 18: Setup of the transfer container used inside the SEM chamber.
For further assembly of the battery inside the SEM, the working electrode had to be
placed on top of the separator. This was done using a micromanipulator (Kleindiek MM3A-EM,
Kleindiek GmbH, Reutlingen, Germany). Prior to closing the chamber, a steel mesh was
clamped to the manipulator and therefore the manipulator also provided the electrical contact to
the working electrode. The other electrical contact to the counter electrode was established
through the SEM chamber and the conventional electrical grounding of the SEM (Figure 17).
Assembling the cell in this two stage process proved to be very useful because it was
possible to monitor and control the electrolyte wetting of the working electrode by carefully
pushing it towards the separator using the manipulator. Depending on the materials investigated
and size of the electrodes, electrical currents were between 100 nA and several µA.
Experiments with this method were performed on SnO2 and CCS. The size distribution of
the SnO2 particles (99.9 % purity, −325 mesh, Sigma-Aldrich) in the electrodes was very broad
with diameters ranging from tens of nanometres to several microns. The electrodes contained 10
wt. % carbon black and 10 wt. % PVDF and 80 wt. % of the electrochemically active material.
The in situ observation of lithium cells inside the SEM was complicated by artefacts
related to the direct probing by the electron beam. During scanning, the beam hits a very small
area of a few nm2 and can lead to significant charging of the imaged region. In the open cell,

38
such effects can strongly interfere with battery operation and therefore have to be prevented.
Most problematic in this respect is the electrolyte which is a poor electron conductor. When
imaged in the SEM, it can strongly build up charge leading to unwanted effects like local lithium
deposition. For imaging, it is therefore important to select regions of the battery that have both
good electrical connection to the current collector and are also not covered by large amounts of
electrolyte. Typically, regions close to the stainless steel mesh (Figure 19) were selected and
beam currents and imaging times were minimized to avoid charging effects.
Figure 19: Using the manipulator, the working electrode can be carefully pushed towards the
separator. By doing this, it is soaked by the electrolyte leading to the large dark region in image
(a). Once fully soaked, regions close to the stainless steel mesh were selected for imaging in
order to ensure proper grounding and to avoid electric charging effects (b).

39
3.4 Ex situ SEM experiments
Intercalation materials are currently used as active materials in the lithium-ion secondary
batteries. Compared to conversion materials, they have excellent reversibility during charge and
discharge, which results in a much longer cyclic life. Such systems are not applicable to in situ
testing where the time on the microscope is limited. For this reason, a different strategy was used
for investigating these materials. Electrodes with intercalation materials were electrically cycled
in Swagelok-cells and ex situ observed at given times by SEM.
The particles of the active material under investigation were mechanically mixed with
PVDF and carbon black with a ratio of 8:1:1 in weight, respectively. PVDF binder and carbon
black were used to build an electron conductive matrix for embedding the active material. NMP
was applied to dissolve the PVDF and make a slurry. The slurry was then coated on the
aluminum substrate (99.9 % purity, 0.5 mm thick) using a film casting machine to achieve a wet
film with a thickness of 120 µm. The electrode with active material, binder, carbon black and the
aluminum substrate as current collector was then dried at room temperature for 24 hours and
afterwards heated to 90 °C for at least 24 hours in atmosphere. After this step, this electrode was
ready for using as a working electrode in a test cell.
1M Lithiumhexafluorophosphate (LiPF6 salt) dissolved in ethylene carbonate (EC)/
dimethyl carbonate (DMC) solution (1:1 in weight, Merck battery electrolyte LP 30, water
content < 20 ppm, HF (as free acid) < 50 ppm) was selected as electrolyte. The same laboratory
filter paper as used in the in situ experiment was also used in this experiment as separator. It has
a low ionic resistance and effectively prevents short circuits after thousands of cycles.
Pure lithium was used as counter electrode, so that the potential on the negative electrode
was kept constant during charge and discharge. Moreover, excess lithium provided unlimited
anode capacity during the experiment, so that the loss of lithium does not affect cell performance.
For the current collector of the negative electrode, nickel plates (99.5 % purity, 0.25 mm thick,
Alfa aesar) were used.

40
The cell components were assembled in a Swagelok connector with Teflon® sealing,
stainless steel springs and rods to make a Swagelok-cell (Figure 20). When the Swagelok
connector made from metal was used, a piece of polyethylene (PE) foil is applied to separate the
battery components from the metal housing. The stainless steel spring pushed the battery
components together and improved the electrical contacts. Both electrodes could be electrically
connected to the battery galvanostat through the stainless steel rods. Cells of this type are
common in batteries and could be easily disassembled and opened inside a glove box.
Figure 20: Setup of a Swagelok-cell for building batteries for ex situ SEM observation.
Several active materials: LMAO (Süd Chemie AG, Munich, Germany), LNMFO
synthesized by S. Glatthaar from Institute for Applied Materials of Karlsruhe Institute of
Technology, LCO (99.5 % purity, 5 micron APS Powder, Metals basis, Alfa aesar) were
investigated in the ex situ SEM experiments. The LMAO particles investigated in this work had
diameters between hundreds of nanometers and several microns with a mean particle size of
1.019 microns nm and median particle size of 0.919 micron. The size distribution of three
LMAO samples was characterized by SEM and is shown in Figure 21.

41
0.2-0.6 0.6-1.0 1.0-1.4 1.4-1.8 1.8-2.2 >2.20
100
200
300
400
Par
ticl
e n
um
ber
Radius (m)
Sample 1
Sample 2
Sample 3
Total
Figure 21: Size distribution of particles that were investigated in the ex situ experiments.
The fabricated working electrodes were imaged by SEM before the electrochemical
experiments. After this step, a Swagelok-cell was assembled and tested. After a given number of
cycles, the test was interrupted and the cell was disassembled in the glove-box. In order to
remove residue from the electrolyte, namely LiPF6 salt and EC, the electrode was washed by
DMC. After drying, the working electrode was moved into the transfer container and transferred
into the SEM chamber which prevented contamination by oxygen and moisture (Figure 18).
After pumping to high vacuum (~ 10-6
mbar), the pump was turned off and the transfer container
was opened by rotating the sample stage. The working electrode was imaged and attention was
paid to investigating the same particles which were imaged before electrical cycling. In some
cases after the inspection of the sample, the transfer container was closed again under high
vacuum and the electrode under investigation was brought back to the glove-box, where the
battery was reassembled for further testing. With this procedure, the working electrode and the

42
active material particles could be microscopically investigated at defined intervals during battery
operation.

43
4 Results
Using the ex situ SEM experimental method presented in section 3.4, commercial
intercalation materials for the positive electrode LMAO, LCO and LNMFO were investigated.
The major finding was made in LMAO electrodes. Defects in the form of cracks were frequently
observed in the active material particles after electrical cycling and the number of particles with
cracks increased with rising cycle number. Further, a particle size dependence of the crack
formation could be found. Details of these observations are given in section 4.1.1. Significant
structural changes are expected to occur in many conversion materials during the first reaction
with lithium ions. The conversion materials SnO2 and CCS were investigated by the in situ SEM
technique mentioned in section 3.3. Such effects will be shown in section 4.2 where the
morphological evolution related to lithium insertion/extraction of the two conversion materials is
addressed.
4.1 Intercalation materials
Positive electrodes with intercalation materials LMAO, LCO and LNMFO were
electrically cycled in Swagelok-cells and ex situ investigated by SEM to detect material changes
induced by cycling. Degradation could be generally measured in test cells by analyzing the
voltage and capacity changes (section 4.1.1). High resolution secondary electron images of
individual particles in the fabricated electrodes before and after electrical cycling show the
consequences of the cyclic loads. By investigating large regions of the electrodes a relationship
of damage and cycle number as well as particle size could be observed (section 4.1.1).

44
4.1.1 LiMn1.95Al0.05O4
Electrical degradation
Several test cells with LMAO as the active material in the positive electrode were
galvanostatically cycled. One sample was cycled at a rate of 1C for 800 cycles. Continuous
capacity fading was measured during electrical charge and discharge (22, Table 2). The rate of
capacity derease stayed almost constant. As a result, an almost linearly capacity fading was
observed in the range of 100% to 75% of the initial capacity. The charge capacity decreased by
21 % and the discharge capacity decreased by 23 %. Details of this decrease can be found in
Table 3. The capacity fading is also visible in the voltage curve in Figure 23, where the voltage
changes were plotted versus lithium content x in the spinel host material. Both, during charge
and discharge, decreasing amounts of lithium could be inserted and released from the host
material with increasing cycle number. A voltage profile shift can be seen by comparing the 20th,
100th, 300
th, 600
th and 800
th cycle when considering the two plateaus. During charge they shifted
to higher voltages and during discharge to lower voltages. In other words, with increasing cycle
number more energy was needed for charging the cell, and less energy was released during
discharge. Consequently the specific energy of the cell also decreased with increasing cycle
number.
Table 2: Degradation of the LMAO-lithium cell with a rate of 1C after 800 cycles
Pristine After 800 cycles
Charge capacity (mAhg-1
) 111 88.1
Discharge capacity (mAhg-1
) 110.4 85
Coulumbic efficiency (%) 99.5 99.5

45
Table 3: Capacity decrease and their decreasing rates
Capacity (%)
Decrease of charge -20.6
Decreasing rate of charge per cycle -0.029
Decrease of discharge -23
Decreasing rate of discharge per cycle -0.033
Decrease of efficiency -3.5
Decreasing rate of efficiency per cycle -0.0045
0 100 200 300 400 500 600 700 800
85
90
95
100
105
110 Discharge
Charge
Cycle number
Ch
arg
e ca
pac
ity
(m
Ah
g-1
)
85
90
95
100
105
110
Disch
arge cap
acity (m
Ah
g-1)
Figure 22: Capacity degradation of the LMAO-lithium cell cycled with a rate of 1C.

46
1.0 0.9 0.8 0.7 0.6 0.5 0.4 0.3 0.2
3.6
3.8
4.0
4.2
4.4
4.6
4.8
Vo
ltag
e [
V]
x in LixMn
1.95Al
0.05O
4
20th cycle
100th cycle
300th cycle
600th cycle
800th cycle
Figure 23: Voltage profile of the LMAO-lithium cell with increasing cycle number.
Microscopic observation
After electrical operation, the Swagelok-cells were disassembled and their working
electrodes were transferred to the SEM chamber for observation. Several locations in the
working electrode were imaged by SEM. These images after a given number of cycles were then
compared with those images made before electrochemical intercalation for detecting
morphological changes.
Figure 24 shows LMAO particles embedded in the electron conductive matrix consisting
of binder and carbon black. This sample was cycled at a rate of 5C for 1015 cycles. The
observation shown in Figure 24 is characteristic for the electrodes tested here. After a few
hundreds of cycles, the binder had moved and gaps between the active particles and the PVDF
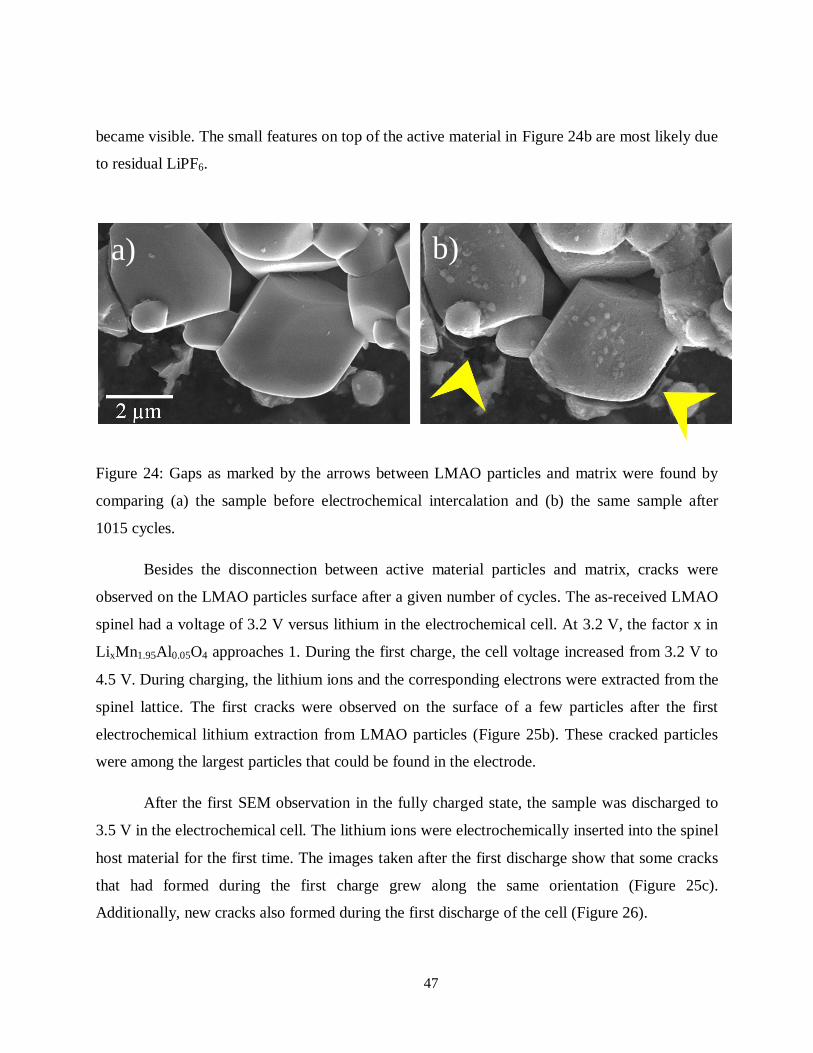
47
became visible. The small features on top of the active material in Figure 24b are most likely due
to residual LiPF6.
Figure 24: Gaps as marked by the arrows between LMAO particles and matrix were found by
comparing (a) the sample before electrochemical intercalation and (b) the same sample after
1015 cycles.
Besides the disconnection between active material particles and matrix, cracks were
observed on the LMAO particles surface after a given number of cycles. The as-received LMAO
spinel had a voltage of 3.2 V versus lithium in the electrochemical cell. At 3.2 V, the factor x in
LixMn1.95Al0.05O4 approaches 1. During the first charge, the cell voltage increased from 3.2 V to
4.5 V. During charging, the lithium ions and the corresponding electrons were extracted from the
spinel lattice. The first cracks were observed on the surface of a few particles after the first
electrochemical lithium extraction from LMAO particles (Figure 25b). These cracked particles
were among the largest particles that could be found in the electrode.
After the first SEM observation in the fully charged state, the sample was discharged to
3.5 V in the electrochemical cell. The lithium ions were electrochemically inserted into the spinel
host material for the first time. The images taken after the first discharge show that some cracks
that had formed during the first charge grew along the same orientation (Figure 25c).
Additionally, new cracks also formed during the first discharge of the cell (Figure 26).
a) b)

48
Figure 25: LMAO spinel particle (a) in pristine, (b) after the first charge (lithium extraction) and
(c) after the first discharge (lithium insertion). Micro-cracks formed during the first
electrochemical lithium extraction and some of these cracks grew along the same orientation
during the subsequent first lithium insertion.
Figure 26: LMAO spinel particle (a) after the first charge (lithium extraction) and (b) after the
first discharge (lithium insertion). A crack nucleated and grew during lithium insertion.
Crack formation and mechanical damage became more extensive with increasing number
of cycles. Figure 27 shows damage on a LMAO particle after 800 cycles at 1C rate. As shown in
this image, for some instances, a small part of the active material broke off from the particle
(Figure 27b). The mechanical damage includes not only brittle cracking, but also material
deformation. Figure 27b shows a trace of deformation in the form of band structure on the
surface of the LMAO particle. Band structures with a width of ~ 300 nm formed on the particle
surface are distinct in the magnified image (Figure 27c). Fine cracks can be repeatedly found
along the edges of the band structures. Figure 27d shows the same location as Figure 27a
a) b) c)
a) b)
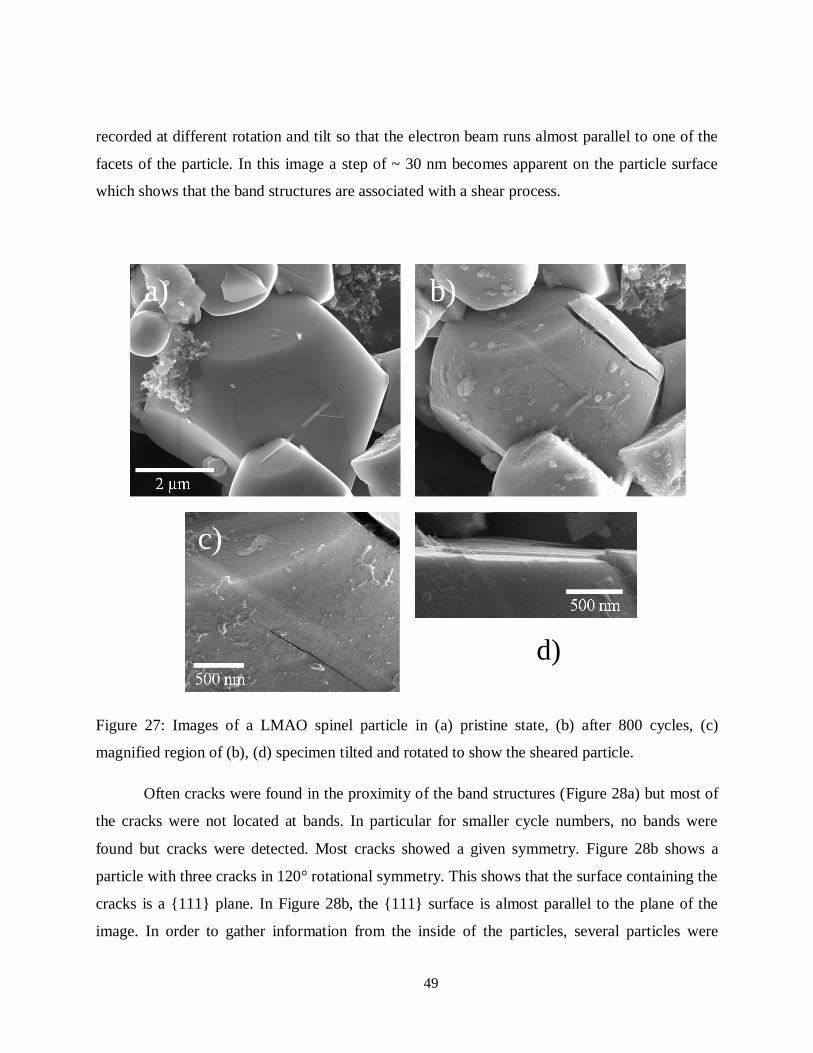
49
recorded at different rotation and tilt so that the electron beam runs almost parallel to one of the
facets of the particle. In this image a step of ~ 30 nm becomes apparent on the particle surface
which shows that the band structures are associated with a shear process.
Figure 27: Images of a LMAO spinel particle in (a) pristine state, (b) after 800 cycles, (c)
magnified region of (b), (d) specimen tilted and rotated to show the sheared particle.
Often cracks were found in the proximity of the band structures (Figure 28a) but most of
the cracks were not located at bands. In particular for smaller cycle numbers, no bands were
found but cracks were detected. Most cracks showed a given symmetry. Figure 28b shows a
particle with three cracks in 120° rotational symmetry. This shows that the surface containing the
cracks is a 111 plane. In Figure 28b, the 111 surface is almost parallel to the plane of the
image. In order to gather information from the inside of the particles, several particles were
a) b)
c)
d)

50
sectioned layer by layer in a focused ion beam microscope (FIB). It was found that cracks were
also present inside the particles and that not all cracks had reached the particle surface (Figure
28c). Cracks inside the particles became visible by imaging the cross-section of these particles.
In the layer by layer sectioning it was observed that many crack surfaces are not perpendicular to
the sample surface but instead are inclined at an angle so that the surfaces of the cracks are
parallel to the sidewalls of the particle. This indicates that many of the observed cracks run along
111 planes (Figure 29).
Figure 28: (a) Cracks next to deformation bands. (b) Threefold symmetry of cracks. (c) Cracks
inside a particle. Image (c) was taken at 52° tilt angle relative to the cross sectioned surface
(image was stretched to correct for tilt).
a) b) c)

51
Figure 29: By means of FIB, some particles were sectioned layer by layer, (a) initial and (b) after
one section. The two dimensional orientation of one crack can be determined from the lines of
intersection between the crack, the cross-section and the surface. It seems that the cracks prefer
the 111 direction parallel to the surface plane of the cubic crystal.
In order to obtain statistical data on these phenomena, randomly selected areas on the
working electrode were imaged in high resolution. Several hundred of LMAO particles were
included within an image area of 0.01 mm2. Using pixel counting in the images, the two-
dimensional projected area of every particle was calculated. The one- dimensional radius of the
particles was estimated from the projected areas under the assumption that the particles were
spherical. The particles with cracks on their surfaces were marked. A crack ratio could then be
calculated from the number of cracked particles and the number of all analyzed particles. Three
samples were analyzed by this method. The first sample was cycled at 3C rate for 200 cycles.
The second one and the third one were cycled at 1C rate for 200 cycles and 800 cycles,
respectively. The ratios of cracked particles were different in all three samples as shown in Table
4, Table 5 and Table 6.
b) a)

52
The particles analyzed in these three samples had no uniform size, but radii ranging from
several microns to hundreds of nanometres. They were classified in six ranges: namely larger
than 2.2 microns, from 1.8 to 2.2 microns, 1.4 to 1.8 microns, 1.0 to 1.4 microns, 0.6 to 1.0
microns and 0.2 to 0.6 microns. Particles with different sizes had also different individual crack
ratios in all three samples. The dependence of crack ratio to the particle size is shown in Table 4,
Table 5 and Table 6. The average crack ratio of the three samples independent to the size
distribution was 0.351 (Sample Nr.1), 0.337 (Sample Nr.2) and 0.468 (Sample Nr.3),
respectively. To better understand this size effect, the individual crack ratio is plotted versus the
particle radius in Figure 30.
In every sample, smaller particles had a lower crack ratio and this effect was almost
linearly related to the calculated one-dimensional particle radius. The particles with radii larger
than 2.2 microns had a high crack ratio of 0.875 in the first sample and 0.857 in the second
sample. In the third sample the calculated crack ratio reached even 1, which means every particle
in this range had cracks on its surface. In contrast, the particles with radii smaller than 0.6 micron
had a fairly low crack ratio of 0.038 in the third sample and 0 in the first and the second sample.
Table 4: Statistics of crack formation in Sample Nr.1 cycled at 3C for 200 cycles
Radius range
(µm)
Number of
particles
Number of particles with
cracks Ratio
0.2-0.6 35 0 0
0.6-1.0 138 6 0.043
1.0-1.4 81 14 0.173
1.4-1.8 40 14 0.350
1.8-2.2 12 8 0.667
>2.2 8 7 0.875
Total 314 49 0.156

53
Table 5: Statistics of crack formation in Sample Nr.2 cycled at 1C for 200 cycles
Radius range
(µm)
Number of
particles
Number of particles with
cracks Ratio
0.2-0.6 30 0 0
0.6-1.0 118 8 0.068
1.0-1.4 72 12 0.167
1.4-1.8 35 12 0.343
1.8-2.2 17 10 0.588
>2.2 7 6 0.857
Total 279 48 0.172
Table 6: Statistics of crack formation in Sample Nr.3 cycled at 1C for 800 cycles
Radius range
(µm)
Number of
particles
Number of particles with
cracks Ratio
0.2-0.6 80 3 0.038
0.6-1.0 190 23 0.121
1.0-1.4 92 36 0.391
1.4-1.8 45 25 0.556
1.8-2.2 10 7 0.700
>2.2 6 6 1
Total 423 100 0.236

54
0.2-0.6 0.6-1.0 1.0-1.4 1.4-1.8 1.8-2.2 >2.2
0.0
0.2
0.4
0.6
0.8
1.0
3C after 200 cycles
1C after 200 cycles
1C after 800 cycles
Rati
o o
f p
art
icle
s w
ith
cra
ck
s
Radius [m]
Figure 30: The crack ratio of LMAO particles for different rate, cycle number and particle size.
In a long-term experiment, one working electrode with the same LMAO was charged to
4.5 V in a Swagelok cell and stored under the same conditions for 2 months. Thereafter, no
cracks were found on the LMAO particle surface by means of SEM.
4.1.2 LiCoO2 and LiNi0.4Fe0.1Mn1.5O4
The active materials LCO and LNMFO were also investigated in the ex situ SEM battery
experiments. One sample with an LCO electrode was galvanostatically charged and discharged
in a Swagelok-cell between 3.5 V and 4.2 V at a rate of 2C for 220 cycles. Another sample with
LNMFO electrode was galvanostatically cycled between 3.5 V and 5 V at a rate of 2C for 986
cycles. Both Swagelok-cells demonstrated continuous capacity fading and voltage plateaus shift
as shown in Figure 31 and Figure 32. With increasing cycle number, the charge plateaus were

55
shifted to the higher voltage range, while the discharge plateaus moved to the lower voltage
ranges.
1.0 0.9 0.8 0.7 0.6 0.5 0.4 0.3 0.2
3.5
3.6
3.7
3.8
3.9
4.0
4.1
4.2
4.3
4.4
Vo
ltag
e (
V)
x in LixCoO
2
50th cycle
100th cycle
150th cycle
220th cycle
Figure 31: Voltage profile of the LCO-lithium cell with increasing cycle number.

56
1.0 0.9 0.8 0.7 0.6 0.5 0.4
3.6
3.8
4.0
4.2
4.4
4.6
4.8
5.0
5.2
Vo
ltag
e (
V)
x in LixNi
0.45Mn
1.5Fe
0.05O
4
100th cycle
200th cycle
300th cycle
400th cycle
500th cycle
600th cycle
700th cycle
800th cycle
900th cycle
Figure 32: Voltage profile of the LMNFO-lithium cell with increasing cycle number.
More than 20 active material particles in the fabricated LCO and LNMFO electrodes
were imaged with SEM before electrochemical lithium insertion/extraction. After the cycling,
the Swagelok-cells were disassembled. The working electrodes and the same particles were
observed again. No cracks or other significant morphological changes could be detected in the
two materials.
57
4.2 Conversion materials
The conversion materials SnO2 and CCS showed large capacities for lithium storage in
the test cells, which decreased rapidly after the first few cycles. In situ SEM observation during
electrochemical lithium insertion and extraction showed local changes such as volume expansion,
crack formation, extrusions. SnO2 was also investigated by ex situ SEM for proving the results of
the in situ SEM observation (section 4.2.2). The observations help to better understand the
reaction pathways of both materials and the rapid degradation of SnO2 and CCS.
4.2.1 CuCr2Se4
The CCS powder used for the experiments was synthesized by W. Bensch et al.. Details
about this material can be found in 62
. For the in situ SEM experiment, the powder was mixed
with binder and carbon black to produce a working electrode. The method is described in more
detail in Chapter 3. The CCS-lithium cell inside the SEM chamber had a voltage of ~3.0 V after
assembling. This cell was galvanostatically discharged to 0.4 V. During the discharge, lithium
was inserted for the first time. The voltage profile with constant discharge current is shown in
Figure 33. Three discharge plateaus were observed at 1.6 V, 1 V and 0.6 V versus lithium.

58
15 20 25 30 350.0
0.5
1.0
1.5
2.0
2.5
3.0
3.5
Vo
ltag
e [V
]
Time [h]
Figure 33: Voltage profile of the in situ cell inside SEM with CCS as working electrode and
lithium as counter electrode.
Significant morphological changes could be determined by comparing the SEM images
of CCS particles at different SOC. During the real-time observation, it was found that cracks and
wires like extrusions formed during lithium insertion. Several CCS particles were selected to be
continuously monitored during the discharge process (Figure 34). In this way, the relationship
between the observations and the SOC was assured. Starting at 3 V and decreasing, a first change
was found at 1.458 V. Here the first extrusion was observed on the particles. The extruding
process continued only until 1.306 V. At 1.094 V, the first crack was observed on the surface of
a particle. More cracks formed until 0.944 V. After that no significant change was detected
anymore. After the first discharge, the cell was charged with the same current and subsequently
cycled between 2.9 V and 0.4 V. Compared to the first discharge, the capacities of the following
charges and discharges were significantly smaller and no further morphological change was
detected.
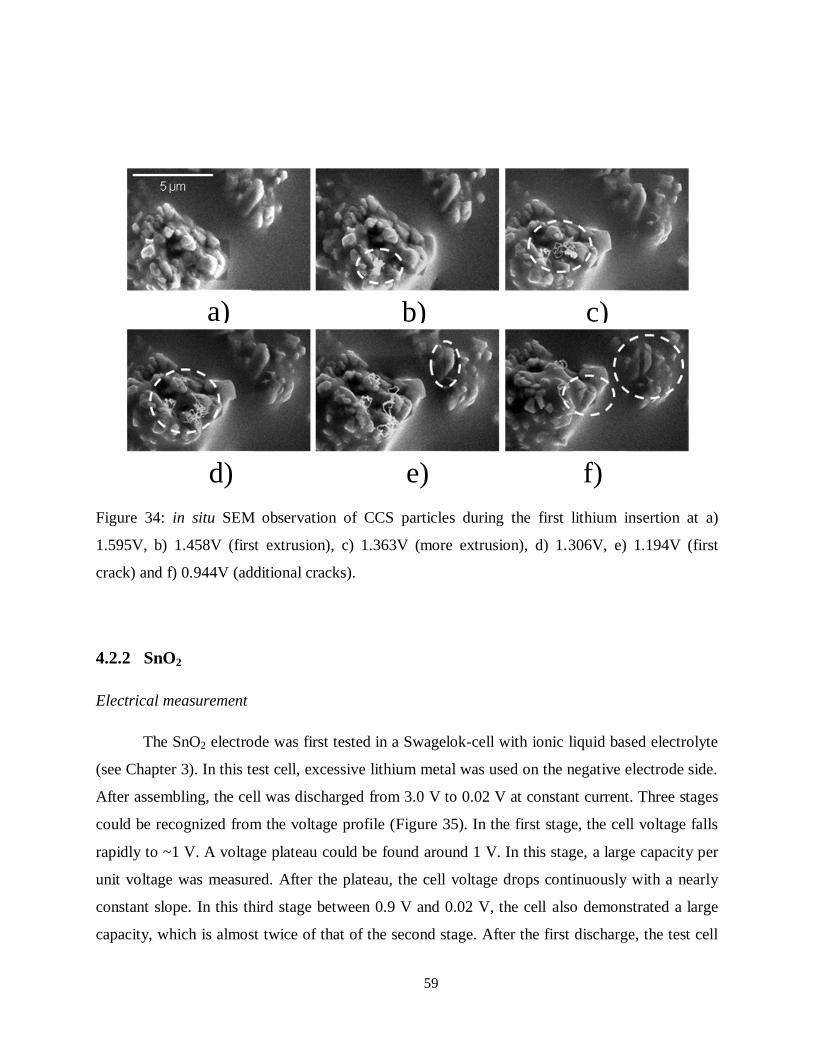
59
Figure 34: in situ SEM observation of CCS particles during the first lithium insertion at a)
1.595V, b) 1.458V (first extrusion), c) 1.363V (more extrusion), d) 1.306V, e) 1.194V (first
crack) and f) 0.944V (additional cracks).
4.2.2 SnO2
Electrical measurement
The SnO2 electrode was first tested in a Swagelok-cell with ionic liquid based electrolyte
(see Chapter 3). In this test cell, excessive lithium metal was used on the negative electrode side.
After assembling, the cell was discharged from 3.0 V to 0.02 V at constant current. Three stages
could be recognized from the voltage profile (Figure 35). In the first stage, the cell voltage falls
rapidly to ~1 V. A voltage plateau could be found around 1 V. In this stage, a large capacity per
unit voltage was measured. After the plateau, the cell voltage drops continuously with a nearly
constant slope. In this third stage between 0.9 V and 0.02 V, the cell also demonstrated a large
capacity, which is almost twice of that of the second stage. After the first discharge, the test cell
a) b) c)
d) e) f)
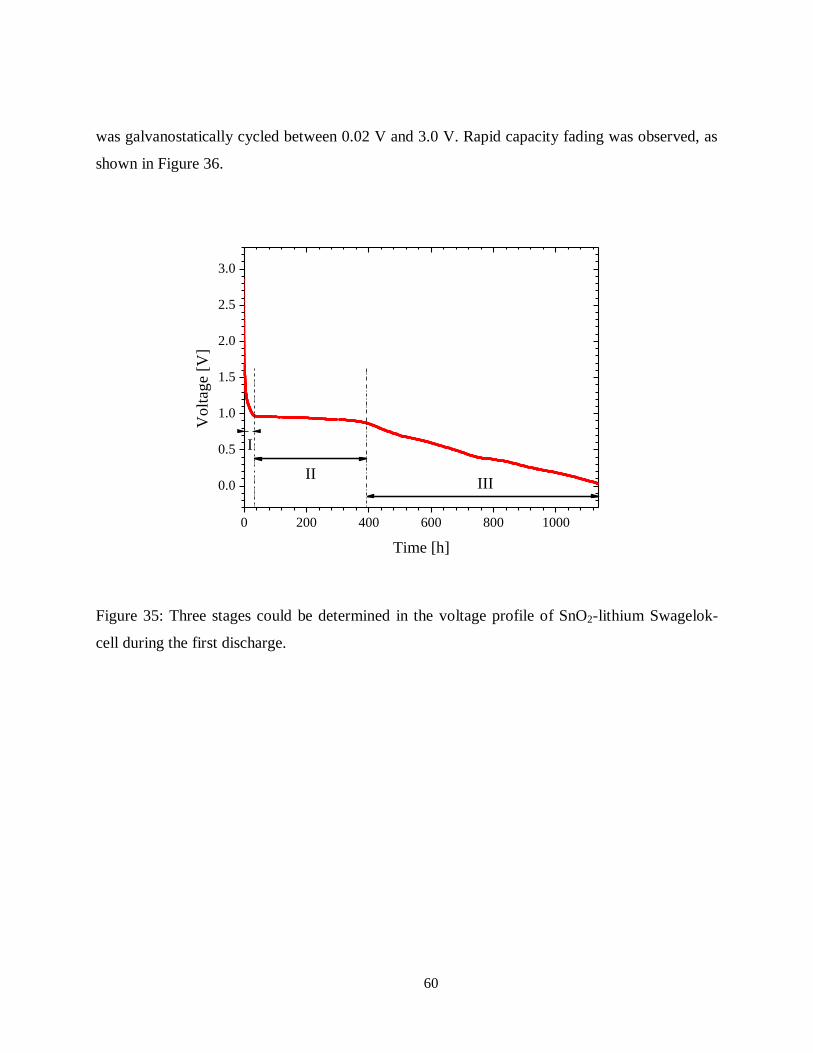
60
was galvanostatically cycled between 0.02 V and 3.0 V. Rapid capacity fading was observed, as
shown in Figure 36.
0 200 400 600 800 1000
0.0
0.5
1.0
1.5
2.0
2.5
3.0
III
Vo
ltag
e [V
]
Time [h]
II
I
Figure 35: Three stages could be determined in the voltage profile of SnO2-lithium Swagelok-
cell during the first discharge.

61
0 5 10 15 20 250.0
0.1
0.2
0.3
0.4
0.5
0.6
0.7
0.8
0.9
1.05.6
5.7
charge capacity
discharge capacity
Cycle number
Ch
arg
e c
ap
acit
y [
mA
h]
0.0
0.1
0.2
0.3
0.4
0.5
0.6
0.7
0.8
0.9
1.05.6
5.7
Disc
harg
e c
ap
acity
[mA
h]
Figure 36: Rapid capacity fading of the SnO2-lithium Swagelok-cell was measured by cycling
between 0.02 V to 3 V with constant current.
The SnO2 particles from the same batch were used in the in situ SEM battery experiments.
The in situ cell was cycled under constant current between 0.02 V and 3 V. The voltage profile is
shown in Figure 37. Several effects could be identified by monitoring different locations in the
electrode as shown in the next section. The effects that are presented here have been repeatedly
observed so that it can be assumed that these observations are representative for what is
occurring inside the electrode.

62
0 10 20 30 40 50 60
0
1
2
3
4
Vo
ltag
e [V
]
Time [h]
Figure 37: Voltage profile of the in situ SnO2-lithium cell inside the SEM under constant current.
In situ SEM observation
A region of the electrode containing small particles with dimensions below 100 nm is
shown in Figure 38. Upon the first insertion of lithium into the SnO2 particles, the volume of the
particles increased dramatically. It may be assumed that the changes in volume are more or less
isotropic so that the three-dimensional volume changes can be estimated from the two-
dimensional area changes. The smallest particles showed volume expansions of more than one
order of magnitude. The increase in particle size occurred within the first few cycles with the
change that happened within the first cycle being the largest one. At times when lithium was
removed, no growth or shrinkage could be seen. Depending on imaging conditions, brighter and
darker regions could be identified on the particles. During the first few cycles, the darker shell
increased in thickness and then stabilized. The brighter part in the centre of the particles slightly
decreased in size over the course of several cycles.

63
Figure 38: A section of the SnO2 in the fabricated electrode (a) before lithium insertion, (b) after
the first lithium insertion, (c) after the second lithium insertion. The micrographs have the same
magnification.
On the larger particles, different effects were observed. These particles also showed a
strong increase in size as can be seen from Figure 39. This increase was accompanied by a
blurring of the edges and a rounding of the corners. Shells as observed on the smaller particles
did not seem to form. Although the volume increase was significant, the relative volume increase
was smaller than that of the small particles as can be seen by comparing Figure 38 with Figure
39. This volume increase was observed to be irreversible. In the larger particles, cracks and
extrusions were observed quite frequently (Figure 39 and Figure 40) whereas no crack and
extrusion were seen in the smaller particles. In the SEM, the extrusions appeared to be brighter
than the particles themselves. Formation of extrusions was only observed when lithium was
inserted. During lithium extraction, these extrusions kept unchanged. Almost all of the extrusions
formed during the first discharge where lithium was inserted for the first time and only few of
them formed during later cycles. A few of them kept growing. One extrusion after the first
lithium insertion and after the 16 more cycles is compared in Figure 41. The extrusion did not
grow in length; however the diameter of the extrusion became larger at its base.
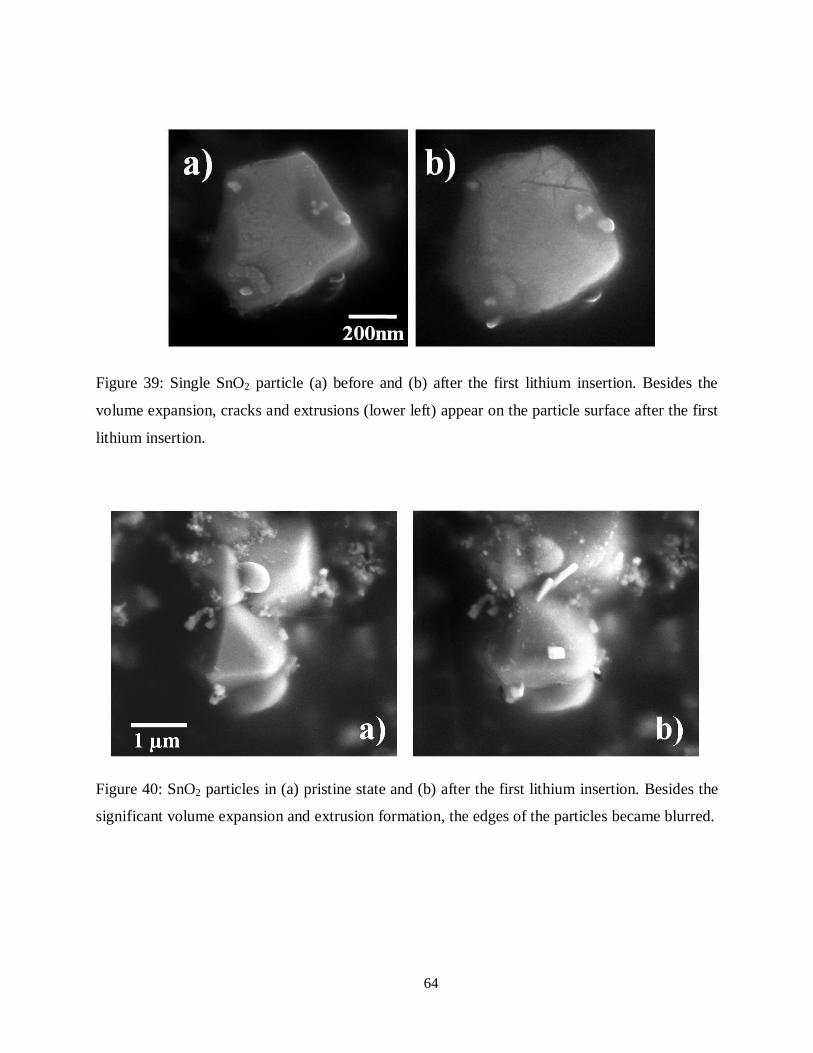
64
Figure 39: Single SnO2 particle (a) before and (b) after the first lithium insertion. Besides the
volume expansion, cracks and extrusions (lower left) appear on the particle surface after the first
lithium insertion.
Figure 40: SnO2 particles in (a) pristine state and (b) after the first lithium insertion. Besides the
significant volume expansion and extrusion formation, the edges of the particles became blurred.

65
Figure 41: One extrusion appeared (a) after the first lithium insertion and (b) became larger at its
base after 16 more cycles.
Although the observations that are presented here were made at the top of the electrode at
regions that were not fully covered by the electrolyte, the same or similar processes also occur
underneath the electrolyte level (Figure 42). Thin layers of the electrolyte are electron
transparent at high accelerating voltages. It was confirmed that the described processes also take
place underneath the electrolyte level.
Figure 42: Extrusion grew from particles underneath the electrolyte level.
In a preliminary experiment, the growth of extrusions was monitored in real time. During
lithium insertion a platelet was observed to form on a large particle. Upon lithium insertion
which occurred in the course of 4 hours, the thickness of this platelet was observed to increase by
a) b)

66
~ 50 nm within 30 min (Figure 43). This observation was made while the voltage of the electrode
was between 1.1 V and 1.0 V.
Figure 43: An extrusion was observed to grow in thickness in real time during lithium insertion.
Ex situ SEM observation
SnO2 electrodes were also investigated within ex situ SEM experiments. Several SnO2
particles in a fabricated electrode were imaged by SEM prior to electrochemical lithium insertion
(Figure 44a). A Swagelok-cell with this working electrode was discharged from 3.0 V to 0.3 V at
a rate of C/100 during the initial discharge. A similar voltage profile as shown in Figure 35 was
detected. At 0.75 V the discharge was interrupted and the test cell was disassembled in the glove-
box. The same SnO2 particles as identified earlier in the working electrode were imaged by SEM
for the second time (Figure 44b). After that, the working electrode was discharged to 0.3 V in the
Swagelok-cell with moderate voltage drop. Figure 44c shows the morphology of the same
particles discharged to 0.3 V. By comparing these images, similar effects observed in the in situ
battery experiments were confirmed by the ex situ SEM observation. The estimated volume of
the SnO2 particle increased significantly during the first lithium insertion. The large particle
shown in centre of Figure 44 expanded by a factor of 1.9 at 0.75 V and a factor of 2.8 at 0.3 V.
Material extruding from the particles could already be observed after the first interrupt at 0.75 V.

67
However extrusions were only observed on particles that had sizes larger than several hundred
nanometres.
Figure 44: SnO2 particles (a) before lithium insertion, (b) after the first lithium insertion to 0.75
V versus lithium and (c) after the first lithium insertion to 0.3 V versus lithium.
a) b) c)

68

69
5 Discussion
Reversible lithium insertion/extraction causes cyclic mechanical stresses in the host
material. Crack formation in the LMAO particles as observed in the ex situ SEM experiments is
presented in the last chapter and is a result of such stresses. This cycling dependent material
damage leads to cell degradation in capacity and in resistance. Additionally, the nature of the
investigated LMAO particles and the inhomogeneous lithium insertion process leads to a size
effect of the crack formation. Mechanism of the cycle number and particle size dependent
mechanical damage is discussed in detail in section 5.2. The damages of conversion materials
SnO2 and CCS that are investigated in this work are different compared to that of LMAO. It is
explained by the substitution reactions between the conversion materials and lithium (section
5.1). A better understanding of the damage mechanisms helps to design electrodes with better
reliability.
5.1 Conversion materials
5.1.1 CuCr2Se4
Successful lithium insertion in CCS demonstrates that this compound can be used as
electrode material in lithium cells. The in situ microscopic study on CCS–lithium cells has
shown several reaction details of lithium insertion in this spinel material. During galvanostatic
charge and discharge, the capacity shown in the first discharge was much larger than those of the
following charges. This means that most of the lithium reacts irreversibly with CCS during the
first insertion and only a small fraction of lithium (about 20%) could be removed reversibly. The
capacities shown in the sequent cycles were almost constant. Three regions with reduced slopes
were observed in the voltage profile during the first lithium insertion. They indicate that different
reactions or phase changes occurred during the first discharge.
In the SEM observations, different morphological changes were found in three steps
during the first lithium insertion. Material extrusion could only be observed during the first step

70
(1.6V ~ 1.3V). The formation of cracks occurred between the first step and the third step. After
that, no remarkable change was found in the third step and in the subsequent cycles.
In in situ XRD measurements that were performed parallel to this work, it was found that
after the first intercalation reaction, elemental Cu was formed in CCS electrode in the early stage
of lithium insertion62
. Material extrusion was observed in the same voltage range in the in situ
SEM battery experiment. These results indicate that Cu(+) was probably substituted by Li(+) to
form LixCu(1-x)Cr2Se4 and metallic Cu, which was extruded from the particles. According to the
in situ SEM observations, the Cu extrusion did not decompose in the following cycles.
Cracking of the particles indicates the presence of tensile stresses in the particles. For the
growth of the observed extrusion, several mechanisms may be possible. If stresses are the
responsible driving force, then compressive stresses in the particle could account for the
extruding material. Based on the results that extrusion and crack were formed at different cell
voltages, the SEM observations indicate that Cu substitution by lithium and the further lithium
insertion induces different stress fields in the host material. Cu(+) is first reduced to Cu(0) during
the early stage of discharge. A volume expansion is expected due to the lithium insertion and the
simultaneous presence of Cu. If this volume change is limited by the host structure, compressive
stresses could be induced in the particle, which extrude deformable materials such as Cu
deposition from the host structure. Further lithium insertion would cause the reduction of
Cr(+3.5) and Se(-2), which could result in a straining of the lattice or the formation of a lithium
rich phase.
5.1.2 SnO2
Sn metal has a large capacity for storing lithium by the formation of Li-Sn alloy.63
However the associated large volume changes during alloying and dealloying lead to rapid
capacity fading. For this reason, SnO2 is used instead as the starting material in the electrode of
the lithium-SnO2 cell. During the first lithium insertion, Li2O and Sn are formed.63
If this
reaction occurs homogenously, small Sn sub-particles distribute finely in the amorphous Li2O
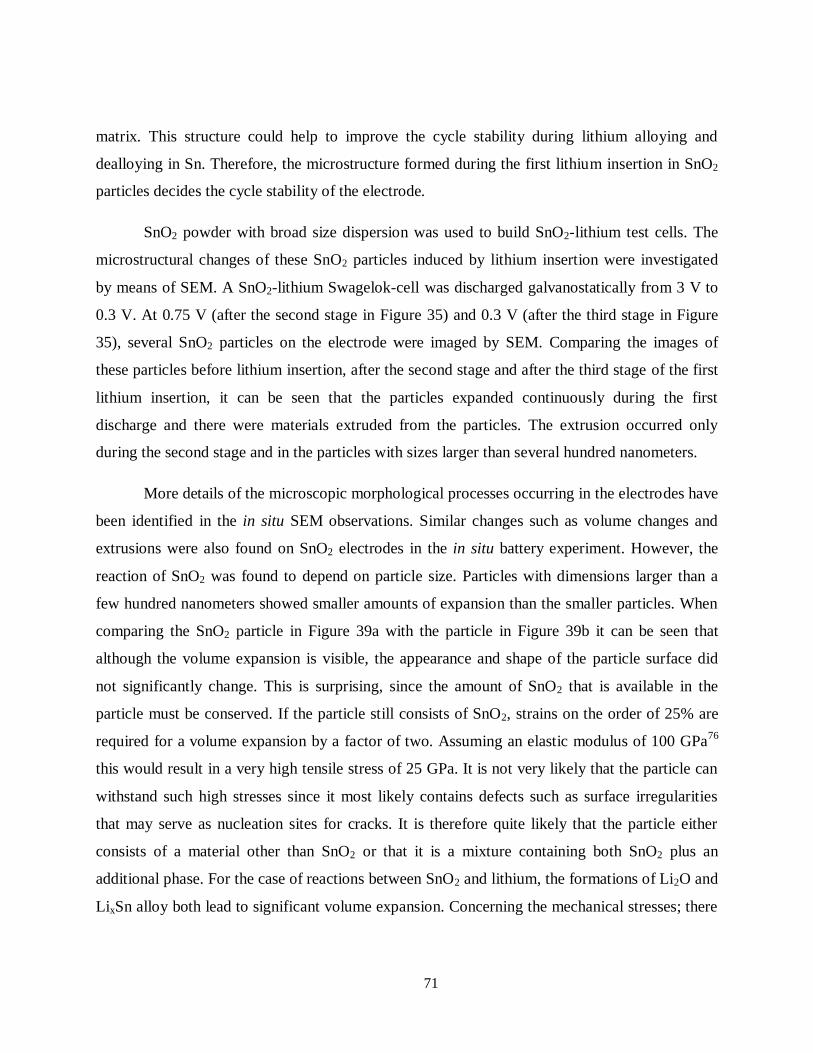
71
matrix. This structure could help to improve the cycle stability during lithium alloying and
dealloying in Sn. Therefore, the microstructure formed during the first lithium insertion in SnO2
particles decides the cycle stability of the electrode.
SnO2 powder with broad size dispersion was used to build SnO2-lithium test cells. The
microstructural changes of these SnO2 particles induced by lithium insertion were investigated
by means of SEM. A SnO2-lithium Swagelok-cell was discharged galvanostatically from 3 V to
0.3 V. At 0.75 V (after the second stage in Figure 35) and 0.3 V (after the third stage in Figure
35), several SnO2 particles on the electrode were imaged by SEM. Comparing the images of
these particles before lithium insertion, after the second stage and after the third stage of the first
lithium insertion, it can be seen that the particles expanded continuously during the first
discharge and there were materials extruded from the particles. The extrusion occurred only
during the second stage and in the particles with sizes larger than several hundred nanometers.
More details of the microscopic morphological processes occurring in the electrodes have
been identified in the in situ SEM observations. Similar changes such as volume changes and
extrusions were also found on SnO2 electrodes in the in situ battery experiment. However, the
reaction of SnO2 was found to depend on particle size. Particles with dimensions larger than a
few hundred nanometers showed smaller amounts of expansion than the smaller particles. When
comparing the SnO2 particle in Figure 39a with the particle in Figure 39b it can be seen that
although the volume expansion is visible, the appearance and shape of the particle surface did
not significantly change. This is surprising, since the amount of SnO2 that is available in the
particle must be conserved. If the particle still consists of SnO2, strains on the order of 25% are
required for a volume expansion by a factor of two. Assuming an elastic modulus of 100 GPa76
this would result in a very high tensile stress of 25 GPa. It is not very likely that the particle can
withstand such high stresses since it most likely contains defects such as surface irregularities
that may serve as nucleation sites for cracks. It is therefore quite likely that the particle either
consists of a material other than SnO2 or that it is a mixture containing both SnO2 plus an
additional phase. For the case of reactions between SnO2 and lithium, the formations of Li2O and
LixSn alloy both lead to significant volume expansion. Concerning the mechanical stresses; there

72
are clear indications that there are high tensile stresses in the large particles since cracks were
commonly found.
Also extrusions were frequently observed to form on the large particles in the second
stage of discharge. The mechanism responsible for the growth of extrusions can be complex but
in many systems compressive stresses are responsible for extruding material. Figure 40 shows an
example where extrusions grew on a particle. In the SEM images the extrusions appear to be
brighter than the particles themselves. The images were taken at beam energies of 10keV and
contain not only secondary but also backscattered electrons. The number of backscattered
electrons that are generated during imaging depends on the average atomic number of the
material under investigation and therefore brighter regions correspond to elements with larger
atomic number. Therefore these extrusions could be composed of Sn or Sn-Li alloy that is
expected to form during the second stage of discharge where Sn(4+) is reduced by lithium. The
number of extrusions increased with the number of cycles when the lithium was inserted into the
SnO2. Some of the extrusions grew in size with the number of cycles, others remained
unchanged and new extrusions were observed to form in every cycle. The fact that extrusions
form only on the larger particles suggests that the chemical reactions there are inhomogeneous
and occur internally.
Characteristic differences between small and large particles were also observed for layer
formation on the surface. Particles with dimensions smaller than a few hundred nanometers
behave differently from the larger particles. As can be seen from Figure 38, the small particles
form layers on their surface. Since the shells in the image appear darker than the particles
themselves, it is very likely that these shells consist of Li2O which has been proposed to form
during the first lithium insertion. The observations that were made here show that this process is
not reversible, i.e. the shells do not shrink upon lithium extraction. The growth of the shells is
not completed after the first cycle. It was observed that the shell increased in thickness over
several cycles when lithium was inserted. Inside the shells, brighter regions remain. These
regions have shapes that are very similar to the initial particles. Over the course of three cycles,
the thickness of the shells significantly increased and the brighter regions slightly decreased in
size. This is consistent with the Li2O formation where the loss in oxygen from the SnO2 causes a

73
small volume change in the Sn+SnO2 particle and a large volume change in the Li2O which is an
amorphous low density material. The results indicate that the small SnO2 particles with
dimensions on the order of 100nm form a layer of Li2O that completely encapsulates the particle
as a whole. The volume expansion in this system is solely caused by the formation of the shells
and only little volume change in the form of particle shinkage occurs in the core of this
composite system. No defects in the form of cracks or extrusions were found on the small
particles. It seems that the core-shell composite that forms is effective in reducing the
mechanical damage of the particles.
The difference in behavior between small and large particles could be caused by the
different reaction kinetics. For a given rate of cycling, there could be a critical particle size where
lithium would not reach the SnO2 inside the particle anymore. As a result, a different behavior is
observed.
The fact that the large particles often contain defects in the form of cracks and extrusions
suggests that electrodes made from coarse particles are less reliable than electrodes containing
only small particles with sizes of 100 nm or below. This conclusion agrees well with
electrochemical measurements in the literature.64,77

74
5.2 Intercalation materials
5.2.1 LiMn1.95Al0.05O4
Electrical measurements
The incremental capacity analysis (ICA) helps to understand results of the electrical
measurements. A plot of IC versus the corresponding voltage reveals the charge that is needed
for changing voltage (dQ/dV) of an electrochemical cell. In this work, each test cell was
electrically cycled at a constant rate of 1C (Figure 23). As a result, the electrochemical reaction
took place with a constant rate. The ICA of the test cell shown in Figure 23 is illustrated in
Figure 45, where two peaks could be identified in every charge or discharge of the lithium-
LMAO cell. They correspond to the lithium intercalation at 4 V and the phase transformation at
4.1 V. According to the nature of these two reactions, the low voltage peak is broad and the high
voltage peak is quite narrow. Due to the reaction kinetics and the impedance of the test cell, the
peak value and the width of the peak depend on the cycling conditions. The peaks were observed
at voltages higher than the OCV plateau during charge and at voltages lower than the OCV
plateau during discharge. The capacities of the positive electrode can be calculated by integrating
the IC curves.
During galvanostatical cycling, the IC curve varied continuously with the cycle number
(Figure 45). Several changes could be determined by comparing the IC curves of the 20th
cycle
and those of the 100th, 300
th, 600
th and 800
th cycle. First of all, both IC peaks move to higher
voltage ranges during charge and are shifted to the lower voltage range during discharge. The
peak shifts reveal rising ohmic resistance of the test cell and lower the energy conversion
efficiency, since more energy is needed for charging the cell, while less energy is released during
discharging. The differences of the voltage values between the two peaks are almost unchanged
during charge or discharge. Additionally, IC values of each peak decrease with increasing cycle
number. The IC value of the high voltage peak during discharge drops more deeply than the
others. The integrals of the IC curve over the whole voltage range during charge and discharge
are reduced with increasing cycle number. Based on these analyses, a continuous capacity fade

75
could be identified. These interpretations indicate a degradation of the lithium-LMAO cell in
form of increasing resistance and decreasing capacity, which are consequences of different
chemical and physical processes occurring on materials inside the cell. The microscopic
observation on working electrodes reveals local material changes induced during these processes.
3.6 3.8 4.0 4.2 4.4
-6
-3
0
3
6
20th Cycle
100th Cycle
300th Cycle
600th Cycle
800th Cycle
dQ
/dV
[C
V-1
]
Voltage [V]
Figure 45: ICA of the LMAO-lithium cell shows electrical degradation with increasing cycle
number.

76
Microscopic observation
Reversible electrochemical lithium ion insertion/extraction into/from host lattices enables
lithium storage in the intercalation materials. This process leads to valence changes of transition
metals during either lithium intercalation into a single phase with changing lattice parameters or
a phase transformation between a lithium rich phase and a lithium poor phase. In both cases,
strains are expected inside the particle.
Although the detailed structural response of LMAO to lithium insertion and extraction is
not known yet, from data obtained on LMO it can be assumed that there are regions where two
phases coexist and that there is a region where insertion/extraction into/from a single phase
occurs. Most likely the strains during lithium insertion/extraction lead to the observed
degradation of the particle binder interface (Figure 24). One possibility is that the particles
"breathe" during battery operation and that the binder has sufficient viscosity to move away from
the particles. This effect is a potential degradation path since it lowers the electronic conductivity
between active material and current collector.
Also the cracks found inside the LMAO are caused by these strains. In order to form
cracks, tensile stress components are needed. Irrespective to the details of the insertion process,
stresses will be induced in LMAO particle due to mismatch strain as a result of inhomogeneous
lithium intercalation. These stresses are expected since lithium concentration gradients or
coexistence of two phases are always associated with gradients of the externally stress free
particle which lead to tensile and compressive regions inside the particle. The concentration
gradients and the stress distribution are expected to be different during charge and during
discharge. Under the assumption that lithium insertion leads to a volume expansion which is the
case for most electrode materials, tensile stresses will form in the centre of the particles of the
positive electrode during discharge and on the perimeter of the particle during charge.9-11
The
observation in Figure 25 shows crack nucleation and growth during charge as well as during
discharge. In the particles, cracks appear on the surface and in the centre as can be seen in Figure
28c.

77
When larger areas were inspected, it was found that large particles have a much larger
probability for developing a crack (Figure 30). Several mechanisms may explain this
phenomenon. One argument that could explain particle size dependence is the mechanics of
fracture itself. During crack growth, stored elastic energy is transferred into surface energy. This
energy balance is different for particles of different size: The elastic energy scales with the three
dimensional volume (~r3) of a particle whereas the surface energy of the crack surface scales
with the two dimensional cross sectional area (~r2) of the particle. For a given stress, only
particles above a certain size contain enough energy for creating the surface that a crack requires.
This energy balance only sets a lower limit for particle size for which crack growth becomes
possible. Typically much higher energies are needed to nucleate and advance a crack. Fracture is
a process that is affected by defects. At these defects the energetic barrier for generating a crack
can be lowered. From brittle bulk materials it is known that the number and size of pre-existing
cracks determines the mechanical strength. Applying this concept to small particles leads to the
conclusion that for a given defect density, smaller particles are stronger since on average they
would contain fewer and smaller defects.
Besides arguments that are concerned with the crack nucleation and growth, the
mechanical loading on particles of different size may be considered. During lithium insertion and
extraction, concentration profiles will form in the particles. If lithium diffusion through the bulk
is the rate limiting step, small particles will have more uniform lithium concentrations than large
particles, leading to larger stresses in the larger particles. Okumara et al. determined the
diffusivity of lithium in LMO by TOF-SIMS measurements to be 1.23x10⁻¹⁵
m2/s at room
temperature.23,78
With this value a diffusion length of 4.2 µm is obtained after one hour.
Although this diffusion length is determined by solving Fick's laws for an infinitely long rod it
may be used as an estimate for the characteristic length of the diffusion profile inside the LMAO
particles. Particles with lengths smaller than the diffusion length will have smaller lithium
concentration gradients and also smaller stresses than larger particles. The maximum stresses
inside particles are expected to occur in particles that are equal or larger than the diffusion length.
This consideration delivers values of the right order of magnitude and is in agreement with the
observation that the probability of finding cracks decreases for particles smaller than roughly 2
µm.

78
For higher rates, a different particle size distribution should result. In order to investigate
these experiments were performed at 3C rate which should shift the particle size distribution
by . In this experiment a similar size distribution was obtained as in the experiment run at 1C.
The slightly higher values at 2µm particle size are statistically not significant.
Altogether there are several reasons that can lead to particle size dependence. Besides
different levels of stress due to different lithium concentration distributions, the strength of
particles and the energetics of fracture for particles of different size may play a role. For the data
presented in Figure 30, it is not unlikely that a superposition of these effects leads to the
observed size dependence.
In a brittle material, the atomistic process of forming and growing a crack is deterministic.
When stresses and strains oscillate at constant amplitude, cracks should either form during the
first cycle or should not appear at all. This is not what was observed here where the number of
fractured particles increased with increasing cycle number (Figure 30). This behaviour bears
resemblance to what is called fatigue and is different from aging where no cyclic loading occurs.
The reason for the nucleation and growth of the cracks must be due to the cyclic electrochemical
or mechanical load. In metals, fatigue occurs after a given number of cycles at a given load.
Higher loads lead to shorter lifetimes and the relationship between stress/strain amplitude and
number of cycles to failure is characterized by the so called SN curve. In highly brittle solids
with strong covalent or ionic bonds, fatigue normally does not occur. In brittle solids where
dislocations exist, fatigue can occur.79
In this case, just as in metals, the damage is mediated by
the motion of dislocations which pile up at obstacles. If the stored energy in the pile-up is high
enough, the energy is released by the nucleation of a crack. The arguments that were discussed
before for the particle size dependence of the probability of fracture may also be applied for this
fatigue problem. In particular the different stresses that may occur in particles of different size
due to different concentration profiles can explain the different stress amplitudes that are active
on particles of different size. For some metals, fatigue limits are known to exist, this means that
below certain loads no damage is found. A similar effect may exist here, where no damage forms
in the smallest particles. There could be an optimum size for preventing particle damage induced
by the mechanical stresses and to slow down the chemical side reactions by limiting the solid

79
electrolyte interface area. The capacity fading of the nano-particles due to the surface layer
formation can be minimized in this way too. For these reasons, modification of particle size and
their distribution is important to enhance the long-term stability.
A necessary condition for intrinsic fatigue is the existence of dislocations. The bands that
can be seen in Figure 27(b, c, and d) and Figure 28a are quite likely slip steps that formed by
dislocation gliding to the surface. The result is a sheared crystal as can be seen in Figure 27d.
The bands on the front and the top of the particle in Figure 27b may be used to visualize the
active glide plane. The location of this plane seems to be parallel to one of the facets of the
particle which is suggestive for 111 as being the active glide plane. The fact that dislocation
pile-ups are leading to cracks is supported by the fact that many cracks are located in the
proximity (Figure 27c) or at the intersection of slip bands (Figure 28a). In disaccord with this
description is the fact that before 200 cycles no shear bands were detected in the particles. One
possibility is that the dislocations have not reached the particle surface but still pile-ups had
occurred inside the particle. Another possibility is that a different fatigue or damage mechanism
was active.
The aforementioned arguments are of purely mechanical nature. In this work, damage
was observed to form with increasing numbers of cycles. Such fatigue phenomena cannot be
easily explained in brittle, ceramic materials. Two arguments are suggested considering the
electrochemical conditions in the lithium-ion battery. Once defects, such as dislocations and
cracks exist, the local stoichiometry is modified and a locally different electrochemical response
can be expected. Most likely, the changes in stoichiometry have a negative effect on the capacity
of an electrode material. At a dislocation or at a crack tip less lithium can be inserted/extracted
than in the defect free regions. Consequences of this effect are modified stress profiles around a
defect that depend on the state of charge and that may lead to the motion or growth of a defect
during cycling. Another argument that may be considered is the extreme electrochemical
conditions that are active. At the defects effects as observed in stress corrosion cracking could be
active. The local stress (σ) at the crack tip and the fracture toughness (Kc) at the corrosion region
could be changed due to the two mechanisms mentioned above. In case of increased local stress
or lowered fracture toughness, crack growth may be activated at the crack tip without significant

80
dislocation motion. The rate of such kind of crack growth is limited due to the time limiting step,
in this case, the corrosion process or the lithium diffusion in the solid material. As a result, a
brittle frature would not take place until the critical crack length (ac) is reached, in which the
released energy by cracking is larger than the surface energy. This subcritical crack growth
mechanism may explain the fatigue of the single crystaline brittle particles under cyclic load and
electrochemical conditions in the lithium-ion battery.
For many brittle materials, a sigmoidal variation is typically observed by double
logarithmic plotting of the rate of fatigue crack growth (da/dN) against stress intensity factor
range (ΔK) (Figure 46). An increase of the subcritical crack growth rate can be observed in
region I, which is mathematically expressed by formula 1 (Paris law). The stress intensity factor
range is given by the stress amplitude and the crack length (a) as shown in formula 2. In the
studied case in this work, particles with the same size were cycled under contant load Δσ, ΔK
increases with increasing crack length a, which accelerates the crack growth. After reaching the
critical crack length in region II, fracture occurs in the brittle particles. In the same electrode, the
periodic load Δσ in the large particles were larger than that in the small particles. As a result, the
Paris exponent n (formula 1) for the large particles is higher than the one for the small particles.
According to the formula 2, the critical crack lengths for the large particles are smaller. This
fatigue mechanism agrees to the relationship between the fracture rate and the particles size
observed in the experiment (Figure 30).
da/dN = A(ΔK)n (Formula 1)
ΔK ~ a-1/2
Δσ (Formula 2)

81
Figure 46: A typical devolution of the rate of fatigue crack growth over the stress intensity factor
range (ΔK) of brittle material under cyclical load. Region I: subcritical crack growth, region II:
critical crack growth and fracture.
The effect of cracks on the capacity of an electrode is often debated. Advantageous for
the battery performance is that cracks enhance the surface to volume ratio of the active material.
For LMAO, the additional surfaces are quite likely 111 planes and their behavior should be
similar to other 111 surfaces on the particles. Disadvantageous is the fact that mechanical
damage such as dislocations and cracks can lead to a loss of electronic and ionic conductivity.
This is particularly the case when multiple cracks run inside one particle as can be seen in Figure
28c and regions of the particle are electronically disconnected from their surroundings. As a
result, capacity fading and resistance increase were detected in the electrical measurement by
analyzing the incremental capacity.
How much capacity fading is due to cracks is very hard to assess. A rather crude attempt
can be made using the data from Table 4, Table 5 and Table 6. After 800 cycles the total volume
of particles detected by SEM is 590 µm 3 and the total volume of the particles with cracks is 297
µm3. If a cracked particle loses all of its capacity this would cause a loss of 50% in capacity. In
order to obtain the measured 23% capacity loss, 46% of the volume of the cracked particles is
inactive and 54% is still active. This consideration is only valid if the full capacity loss is due to
82
mechanical damage. For the case that additional degradation mechanisms are simultaneously
active, more than 54% of the capacity is retained in the fractured particles. When looking at
Figure 28c it seems that in some cases a significant volume fraction of the particles can be lost.
This indicates that a considerable part of the measured capacity loss may be due to mechanical
damage.
When the symmetry of the cracks was observed (Figure 28b), it was found that many
particle surfaces are 111 planes. This information has been observed before on larger LMO
single crystals 80
and may be helpful in obtaining a better understanding of the insertion process
where knowledge of the surface orientation is critical. The fact that the particles have 111
surfaces is surprising because according to density functional theory (DFT) calculations these
orientations, independent of their detailed atomic termination, have relatively high surface and
cohesive energies as compared to 100 and 110 orientations.81
Depending on the synthesis
route, thermodynamics may not be the factor that determines the surface orientation, it could also
be the case that diffusion anisotropy or nucleation limitations lead to the selection of the 111
surface as the growth direction for the particles. In terms of the energies determined by DFT it is
also surprising that most of the observed cracks run on 111 planes. This is an effect that may
be associated with the orientation dependence of dislocations in this cubic crystal.
5.2.2 LiCoO2 and LiNi0.4Fe0.1Mn1.5O4
LCO was cycled at 1C rate for 220 cycles between 3.5V and 4.2V. No mechanical
damage was observed on the particle surface after that. Due to the high coefficient for lithium,
the lithium concentration gradient in the LCO solid phase is expected to be smaller than that in
the manganese spinel. Moreover the smaller volume change during charge/discharge of LCO
reduces further the mismatch in the particles. As a result, the stresses induced in the LCO are
expected to be smaller than that of the manganese spinel and LMAO spinel particles. The
observation of LCO indicates the critical role of the amplitude of cyclic mechanical loads in
initiating cracks.

83
LMNFO spinel was also investigated in this study. An ex situ cell with LMNFO electrode
was cycled with 2C rate for 986 cycles between 3.5 V and 5 V. No crack or other morphological
change was observed on the particles. Similar to LCO, the fast lithium and electron transport in
the LMNFO reduce the stresses formed during lithium de-/intercalation. Additionally, the Fe
enrichment at the surface helps to form protective layers between solid particles and liquid
electrolyte, which slow down the interface corrosion and therefore inhibits the crack initiation.
Both effects protect LMNFO from mechanical damage even with very high cycle numbers as
shown in this work. The robustness enables a wide usage of this material in applications which
require a high cyclic stability, and especially at low temperatures, where the lithium diffusivity is
greatly reduced.

84

85
6 Summary
In this work, electrode materials for lithium-ion batteries have been investigated in an
SEM. A technique for in situ SEM observation was developed and used for the first time and
additional experiments were performed using an ex situ SEM method that allows for the
comparison of the same location before, during and after electrochemical tests. This technique is
particularly useful for experiments at higher cycle numbers. Both methods exhibit a spatial
resolution of ~1nm which is unprecedented in the research of secondary batteries, where volume
averaging techniques are typically employed. In this thesis, both experimental methods were
applied to electrode materials for the first time. Irrespective of the individual material, it became
evident that in electrode materials for lithium-ion batteries mechanical effects are very
pronounced. This is of particular importance for current and future conversion materials where
large amounts of lithium are inserted and extracted and large volume expansions are expected.
Also conventional intercalation/insertion materials have been observed to be affected by stresses
and suffer from mechanical degradation.
Reaction pathways were investigated in conversion materials. For CuCr2Se4 a combined
mechanism of a conversion and insertion reaction was observed. This happened together with in
situ synchrotron x-ray measurements. Here the SEM observations proved useful for revealing the
formation of Cu extrusions at early stages of lithium insertion. In the SEM measurement the
enormous volume expansions and the formation and growth of cracks in this system became
apparent, suggesting a poor reversibility of the processes in this material. In SnO2, a two stage
process that was proposed in the literature was confirmed. First Li2O is formed and during
further reaction with lithium, an alloy between lithium and tin forms. It could be shown, that the
first step is irreversible and that for the second step a particle size dependence occurs, where
small particles are encapsulated by a layer presumably consisting of Li2O. Large particles do not
seem to show this layer but their volume expansion is suggestive of a formation of Li2O inside
the particles. Since Li2O prevents particles from tin agglomeration and may help to reduce the
volume expansion, a better reliability of SnO2 with small particle sizes is expected.

86
Investigations in intercalation materials were performed up to 800 cycles. The main focus
of this thesis was on LMAO, a material that is already used in large scale applications. It was
found that for this material, mechanical effects are of crucial importance. It was found that
particles can crack due to repeated reaction with lithium. This process of crack formation and
growth seems to have two components. One is due to brittle failure and another one is caused by
mechanical fatigue. Again a dependence of particle size was found, where small particles were
significantly more resistant against damage. Different underlying mechanisms may be causing
these mechanical effects and have been discussed. A possible candidate is the mechanical
stresses that are due to the lithium insertion kinetics. Lithium transport inside particles takes time
and when lithium is inserted or extracted, lithium concentration gradients will form, leading to
stress gradients in the particles. According to this, at a given rate, large particles have larger
gradients and therefore are more susceptible to damage. For the rate of 1C which was used here
no significant damage was found in particles with sizes below 200nm. This description is in
agreement with the fact that no mechanical damage was found on LCO and LMNFO, where the
lithium diffusivity is at least one order of magnitude higher. Although cracks create additional
surface area in an electrode and are sometimes even discussed to be beneficial for a battery, it
could be shown in this thesis, that large particles can be disconnected and that this could easily
lead to a capacity loss as the one observed here which was ~25% after 800 cycles.
Mechanical effects need to be considered in high capacity conversion materials where
large volume expansions have to be expected. As can be seen in this thesis mechanical stresses
also need to be critically assessed in insertion or intercalation materials. There processes such as
mechanical fatigue can occur. In particular the data acquired on LMAO is of technological
importance and needs to be considered for systems where long term reliability is of importance.
Altogether, the observations and interpretation presented in this work fortify the importance of
mechanical effects for lithium-ion batteries and may prove to be helpful for designing batteries
with better reliability in the future.

87
7 Acknowledgment
Die vorliegende Doktorarbeit wurde in der Zeit zwischen 2008 und 2011 am Institut für
Angewandte Materialien vom Karlsruher Institut für Technologie angefertigt.
Herrn Prof. Dr. O. Kraft danke ich für die Stellung dieser Promotion in seinem Institut sowie
sein stets Interesse an der Arbeit und viele hilfreiche Anregungen, die zum Gelingen der Arbeit
ermöglicht haben. Desweiteren danke ich Herrn Prof. Dr. M. Karmlah, der mir eine gute
Zusammenarbeit mit anderen Doktoranden in der Abteilung ermöglicht hat. Herrn Prof. Dr. M.
Hoffmann danke ich für die freundliche Übernahme des Mitberichts.
Mein besonderer Dank gilt meinem Betreuer Dr. R. Mönig, der mich den Zugang in das
Fachgebiet ermöglichte und stets bereit war, vor Probleme mitzuhelfen. Dr. S. Indris verdanke
ich für die freundliche Zusammenarbeit und den tiefen Einblick in die Batteriethematik. Für die
Hilfen, Anregungen und Diskussionen aller Arten bin ich die Freunden und Kollegen in der
Arbeitsgruppe S. Schendel, A. Sedlmayr, Dr. Z. Choi, Dr. S. Boles, Dr. D. Gianola und mein
Bürokollege T. Neidthardt herzlich dankbar. Natürlich gilt auch mein Dank allen Kollegen im
Umfeld des IAMs und INTs, die mich während meiner Arbeit unterstützt haben und für die
angenehme Arbeitsatmosphäre besorgt haben.

88

89
8 References
1. Tarascon, J.M. & Guyomard, D. The Li1+XMn2O4/C Rocking-Chair System - a Review.
Electrochimica Acta 38, 1221-1231 (1993).
2. Tarascon, J.M. & Armand, M. Issues and challenges facing rechargeable lithium batteries.
Nature 414, 359-367 (2001).
3. Vetter, J., Novak, P., Wagner, M.R., Veit, C., Moller, K.C., Besenhard, J.O., Winter, M.,
Wohlfahrt-Mehrens, M., Vogler, C. & Hammouche, A. Ageing mechanisms in lithium-
ion batteries. Journal of Power Sources 147, 269-281 (2005).
4. Spotnitz, R. Simulation of capacity fade in lithium-ion batteries. Journal of Power
Sources 113, 72-80 (2003).
5. Arora, P., White, R.E. & Doyle, M. Capacity fade mechanisms and side reactions in
lithium-ion batteries. Journal of the Electrochemical Society 145, 3647-3667 (1998).
6. Broussely, M., Biensan, P., Bonhomme, F., Blanchard, P., Herreyre, S., Nechev, K. &
Staniewicz, R.J. Main aging mechanisms in Li ion batteries. Journal of Power Sources
146, 90-96 (2005).
7. Markovsky, B., Rodkin, A., Cohen, Y.S., Palchik, O., Levi, E., Aurbach, D., Kim, H.J. &
Schmidt, M. The study of capacity fading processes of Li-ion batteries: major factors that
play a role. Journal of Power Sources 119, 504-510 (2003).
8. Aurbach, D., Markovsky, B., Rodkin, A., Levi, E., Cohen, Y.S., Kim, H.J. & Schmidt, M.
On the capacity fading of LiCoO2 intercalation electrodes: the effect of cycling, storage,
temperature, and surface film forming additives. Electrochimica Acta 47, 4291-4306
(2002).
9. Cheng, Y.T. & Verbrugge, M.W. Diffusion-Induced Stress, Interfacial Charge Transfer,
and Criteria for Avoiding Crack Initiation of Electrode Particles. Journal of the
Electrochemical Society 157, A508-A516 (2010).
10. Cheng, Y.T. & Verbrugge, M.W. Application of Hasselman's Crack Propagation Model
to Insertion Electrodes. Electrochemical and Solid State Letters 13, A128-A131 (2010).

90
11. Deshpande, R., Cheng, Y.T., Verbrugge, M.W. & Timmons, A. Diffusion Induced
Stresses and Strain Energy in a Phase-Transforming Spherical Electrode Particle. Journal
of the Electrochemical Society 158, A718-A724 (2011).
12. Garcia, R.E., Chiang, Y.M., Carter, W.C., Limthongkul, P. & Bishop, C.M.
Microstructural modeling and design of rechargeable lithium-ion batteries. Journal of the
Electrochemical Society 152, A255-A263 (2005).
13. Renganathan, S., Sikha, G., Santhanagopalan, S. & White, R.E. Theoretical Analysis of
Stresses in a Lithium Ion Cell. Journal of the Electrochemical Society 157, A155-A163
(2010).
14. Wang, H.F., Jang, Y.I., Huang, B.Y., Sadoway, D.R. & Chiang, Y.M. Electron
microscopic characterization of electrochemically cycled LiCoO2 and Li(Al,Co)O2
battery cathodes. Journal of Power Sources 81, 594-598 (1999).
15. Gabrisch, H., Yazami, R. & Fultz, B. The character of dislocations in LiCoO2.
Electrochemical and Solid State Letters 5, A111-A114 (2002).
16. Christensen, J. & Newman, J. Stress generation and fracture in lithium insertion materials.
Journal of Solid State Electrochemistry 10, 293-319 (2006).
17. Christensen, J. & Newman, J. A mathematical model of stress generation and fracture in
lithium manganese oxide. Journal of the Electrochemical Society 153, A1019-A1030
(2006).
18. Christensen, J. Modeling Diffusion-Induced Stress in Li-Ion Cells with Porous Electrodes.
Journal of the Electrochemical Society 157, A366-A380 (2010).
19. Zhang, X., Shyy, W. & Sastry, A.M. Numerical simulation of intercalation-induced stress
in Li-ion battery electrode particles (vol 154, pg A910, 2007). Journal of the
Electrochemical Society 154, S21-S21 (2007).
20. Zhang, X.C., Sastry, A.M. & Shyy, W. Intercalation-induced stress and heat generation
within single lithium-ion battery cathode particles. Journal of the Electrochemical
Society 155, A542-A552 (2008).
21. Zhao, K.J., Pharr, M., Vlassak, J.J. & Suo, Z.G. Fracture of electrodes in lithium-ion
batteries caused by fast charging. Journal of Applied Physics 108(2010).

91
22. Woodford, W.H., Chiang, Y.M. & Carter, W.C. "Electrochemical Shock" of Intercalation
Electrodes: A Fracture Mechanics Analysis. Journal of the Electrochemical Society 157,
A1052-A1059 (2010).
23. Reimers, J.N. & Dahn, J.R. Electrochemical and Insitu X-Ray-Diffraction Studies of
Lithium Intercalation in LixCoO2. Journal of the Electrochemical Society 139, 2091-
2097 (1992).
24. Ohzuku, T. & Ueda, A. Solid-State Redox Reactions of LiCoO2 (R(3)over-Bar-M) for 4
Volt Secondary Lithium Cells. Journal of the Electrochemical Society 141, 2972-2977
(1994).
25. Amatucci, G.G., Tarascon, J.M. & Klein, L.C. CoO2, the end member of the LixCoO2
solid solution. Journal of the Electrochemical Society 143, 1114-1123 (1996).
26. Van der Ven, A., Aydinol, M.K. & Ceder, G. First-principles evidence for stage ordering
in LixCoO2. Journal of the Electrochemical Society 145, 2149-2155 (1998).
27. Mizushima, K., Jones, P.C., Wiseman, P.J. & Goodenough, J.B. LixCoO2 "(Oless-
Thanxless-Than-or-Equal-To1) - a New Cathode Material for Batteries of High-Energy
Density. Materials Research Bulletin 15, 783-789 (1980).
28. Goodenough, J.B., Mizushima, K. & Takeda, T. Solid-Solution Oxides for Storage-
Battery Electrodes. Japanese Journal of Applied Physics 19, 305-313 (1980).
29. Mendiboure, A., Delmas, C. & Hagenmuller, P. New Layered Structure Obtained by
Electrochemical Deintercalation of the Metastable LiCoO2 (02) Variety. Materials
Research Bulletin 19, 1383-1392 (1984).
30. Mizushima, K., Jones, P.C., Wiseman, P.J. & Goodenough, J.B. LixCoO2 (O Less-Than
X Less-Than-or-Equal-to 1) - a New Cathode Material for Batteries of High-Energy
Density. Solid State Ionics 3-4, 171-174 (1981).
31. Thomas, M.G.S.R., Bruce, P.G. & Goodenough, J.B. Ac Impedance of the Li(1-X)CoO2
Electrode. Solid State Ionics 18-9, 794-798 (1986).
32. Thackeray, M.M., David, W.I.F., Bruce, P.G. & Goodenough, J.B. Lithium Insertion into
Manganese Spinels. Materials Research Bulletin 18, 461-472 (1983).
33. Chen, L.Q. & Schoonman, J. Polycrystalline, Glassy, and Thin-Films of LiMn2O4. Solid
State Ionics 67, 17-23 (1993).

92
34. Chen, L.Q., Huang, X.J., Kelder, E. & Schoonman, J. Diffusion Enhancement in
LixMn2O4. Solid State Ionics 76, 91-96 (1995).
35. Barker, J., Pynenburg, R. & Koksbang, R. Determination of Thermodynamic, Kinetic and
Interfacial Properties for the Li//LixMn2O4 System by Electrochemical Techniques.
Journal of Power Sources 52, 185-192 (1994).
36. Winter, M., Besenhard, J.O., Spahr, M.E. & Novak, P. Insertion electrode materials for
rechargeable lithium batteries. Advanced Materials 10, 725-763 (1998).
37. Eriksson, T., Hjelm, A.K., Lindbergh, G. & Gustafsson, T. Kinetic study of LiMn2O4
cathodes by in situ XRD with constant-current cycling and potential stepping. Journal of
the Electrochemical Society 149, A1164-A1170 (2002).
38. Ohzuku, T., Kitagawa, M. & Hirai, T. Electrochemistry of Manganese-Dioxide in
Lithium Nonaqueous Cell .3. X-Ray Diffractional Study on the Reduction of Spinel-
Related Manganese-Dioxide. Journal of the Electrochemical Society 137, 769-775 (1990).
39. Chung, K.Y., Lee, H.S., Yoon, W.S., McBreen, J. & Yang, X.Q. Studies of LiMn2O4
capacity fading at elevated temperature using in situ synchrotron X-ray diffraction.
Journal of the Electrochemical Society 153, A774-A780 (2006).
40. Yang, X.Q., Sun, X., Lee, S.J., McBreen, J., Mukerjee, S., Daroux, M.L. & Xing, X.K. In
situ synchrotron X-ray diffraction studies of the phase transitions in LixMn2O4 cathode
materials. Electrochemical and Solid State Letters 2, 157-160 (1999).
41. Goodenough, J.B., Thackeray, M.M., David, W.I.F. & Bruce, P.G. Lithium Insertion
Extraction Reactions with Manganese Oxides. Revue De Chimie Minerale 21, 435-455
(1984).
42. Thackeray, M.M., Depicciotto, L.A., Dekock, A., Johnson, P.J., Nicholas, V.A. &
Adendorff, K.T. Spinel Electrodes for Lithium Batteries - a Review. Journal of Power
Sources 21, 1-8 (1987).
43. Momchilov, A., Manev, V., Nassalevska, A. & Kozawa, A. Rechargeable Lithium
Battery with Spinel-Related MnO2 .2. Optimization of the LiMn2O4 Synthesis Conditions.
Journal of Power Sources 41, 305-314 (1993).

93
44. Gummow, R.J., Dekock, A. & Thackeray, M.M. Improved Capacity Retention in
Rechargeable 4V Lithium Lithium Manganese Oxide (Spinel) Cells. Solid State Ionics 69,
59-67 (1994).
45. Komaba, S., Oikawa, K., Myung, S.T., Kumagai, N. & Kamiyama, T. Neutron powder
diffraction studies of LiMn2-yAlyO4 synthesized by the emission drying method. Solid
State Ionics 149, 47-52 (2002).
46. Myung, S.T., Komaba, S. & Kumagai, N. Enhanced structural stability and cyclability of
Al-doped LiMn2O4 spinel synthesized by the emulsion drying method. Journal of the
Electrochemical Society 148, A482-A489 (2001).
47. Dunger, H.J., Hambitzer, G. & Lutter, W. Lithium-Cycling Efficiency in Inorganic
Electrolyte Solution. Journal of Power Sources 44, 405-408 (1993).
48. Dreher, J., Haas, B. & Hambitzer, G. Rechargeable LiCoO2 in Inorganic Electrolyte
Solution. Journal of Power Sources 44, 583-587 (1993).
49. Hambitzer, G., Joos, M. & Schriever, U. Volatile Products of Electrode-Reactions in
Inorganic Electrolyte. Journal of Power Sources 44, 727-732 (1993).
50. Liu, J. & Manthiram, A. Kinetics Study of the 5 V Spinel Cathode LiMn(1.5)Ni(0.5)O(4)
Before and After Surface Modifications. Journal of the Electrochemical Society 156,
A833-A838 (2009).
51. Manthiram, A. & Liu, J. Functional surface modifications of a high capacity layered
Li[Li(0.2)Mn(0.54)Ni(0.13)Co(0.13)]O(2) cathode. Journal of Materials Chemistry 20, 3961-
3967 (2010).
52. Wu, Y. & Manthiram, A. High capacity, surface-modified layered Li[Li(1-x)/3Mn(2-
x)/3Nix/3Cox/3]O2 cathodes with low irreversible capacity loss. Electrochemical and Solid
State Letters 9, A221-A224 (2006).
53. Wu, Y., Murugan, A.V. & Manthiram, A. Surface modification of high capacity layered
Li[Li0.2Mn0.54Ni0.13Co0.13]O2 cathodes by AlPO4. Journal of the Electrochemical Society
155, A635-A641 (2008).
54. Manthiram, A. & Liu, J. Understanding the Improved Electrochemical Performances of
Fe-Substituted 5 V Spinel Cathode LiMn(1.5)Ni(0.5)O(4). Journal of Physical Chemistry C
113, 15073-15079 (2009).

94
55. Liu, J. & Manthiram, A. Understanding the Improved Electrochemical Performances of
Fe-Substituted 5 V Spinel Cathode LiMn1.5Ni0.5O4. Journal of Physical Chemistry C 113,
15073-15079 (2009).
56. Guyomard, D. & Tarascon, J.M. High-Voltage Stable Liquid Electrolytes for
Li1+XMn2O4/Carbon Rocking-Chair Lithium Batteries. Journal of Power Sources 54, 92-
98 (1995).
57. Malini, R., Uma, U., Sheela, T., Ganesan, M. & Renganathan, N.G. Conversion reactions:
a new pathway to realise energy in lithium-ion battery-review. Ionics 15, 301-307 (2009).
58. Cabana, J., Monconduit, L., Larcher, D. & Palacin, M.R. Beyond Intercalation-Based Li-
Ion Batteries: The State of the Art and Challenges of Electrode Materials Reacting
Through Conversion Reactions. Advanced Materials 22, E170-E192 (2010).
59. Yamaguchi, Y., Ohishi, Y., Ohashi, M., Yamashita, O. & Watanabe, H. Electric-
Conductivity and 3d-Electron Distribution in CuCr2Se4-XBrx. Japanese Journal of
Applied Physics 19, 291-293 (1980).
60. Bodenez, V., Dupont, L., Morcrette, M., Surcin, C., Murphy, D.W. & Tarascon, J.M.
Copper extrusion/reinjection in Cu-based thiospinels by electrochemical and chemical
routes. Chemistry of Materials, 4278-4287 (2006).
61. Bodenez, V., Dupont, L., Laffont, L., Armstrong, A.R., Shaju, K.M., Bruce, P.G. &
Tarascon, J.M. The reaction of lithium with CuCr2S4 - lithium intercalation and copper
displacement/extrusion. Journal of Materials Chemistry, 3238-3247 (2007).
62. Bensch, W., Ophey, J., Hain, H., Gesswein, H., Chen, D., Mönig, R., Gruber, P.A. &
Indris, S. Chemical and electrochemical insertion of Li into spinel structure of CuCr2Se4:
ex situ and in situ obervation by X-ray diffraction and scanning electron microscopy.
Physical Chemistry Chemical Physics, 7509 (2012).
63. Courtney, I.A. & Dahn, J.R. Electrochemical and in situ x-ray diffraction studies of the
reaction of lithium with tin oxide composites. Journal of the Electrochemical Society 144,
2045-2052 (1997).
64. Yang, J., Winter, M. & Besenhard, J.O. Small particle size multiphase Li-alloy anodes
for lithium-ion-batteries. Solid State Ionics 90, 281-287 (1996).

95
65. Arakawa, M., Tobishima, S., Nemoto, Y., Ichimura, M. & Yamaki, J. Lithium Electrode
Cycleability and Morphology Dependence on Current-Density. Journal of Power Sources
43, 27-35 (1993).
66. Osaka, T., Homma, T., Momma, T. & Yarimizu, H. In situ observation of lithium
deposition processes in solid polymer and gel electrolytes. Journal of Electroanalytical
Chemistry 421, 153-156 (1997).
67. Takehara, Z., Ogumi, Z., Uchimoto, Y., Yasuda, K. & Yoshida, H. Modification of
Lithium Electrolyte Interface by Plasma Polymerization of 1,1-Difluoroethene. Journal
of Power Sources 44, 377-383 (1993).
68. Aurbach, D., Gofer, Y. & Langzam, J. The Correlation between Surface-Chemistry,
Surface-Morphology, and Cycling Efficiency of Lithium Electrodes in a Few Polar
Aprotic Systems. Journal of the Electrochemical Society 136, 3198-3205 (1989).
69. Osaka, T., Momma, T., Matsumoto, Y. & Uchida, Y. Surface characterization of
electrodeposited lithium anode with enhanced cycleability obtained by CO2 addition.
Journal of the Electrochemical Society 144, 1709-1713 (1997).
70. Langenhuizen, N.P.W. The effect of mass transport on Li deposition and dissolution.
Journal of the Electrochemical Society 145, 3094-3099 (1998).
71. Baudry, P. & Armand, M. In situ Observation by SEM of positive Composite Electrodes
druing Discharge of Polymer Lithium Batteries. Solid State Ionics 28-30, 1567-1571
(1988).
72. Orsini, F., Du Pasquier, A., Beaudoin, B., Tarascon, J.M., Trentin, M., Langenhuizen, N.,
De Beer, E. & Notten, P. In situ Scanning Electron Microscopy (SEM) observation of
interfaces within plastic lithium batteries. Journal of Power Sources 76, 19-29 (1998).
73. Raimann, P.R., Hochgatterer, N.S., Korepp, C., Moller, K.C., Winter, M., Schrottner, H.,
Hofer, F. & Besenhard, J.O. Monitoring dynamics of electrode reactions in Li-ion
batteries by in situ ESEM. Ionics 12, 253-255 (2006).
74. Huang, J.Y., Zhong, L., Wang, C.M., Sullivan, J.P., Xu, W., Zhang, L.Q., Mao, S.X.,
Hudak, N.S., Liu, X.H., Subramanian, A., Fan, H.Y., Qi, L., Kushima, A. & Li, J. In situ
Observation of the Electrochemical Lithiation of a Single SnO2 Nanowire Electrode.
Science 330(2010).

96
75. Dubarry, M., Svoboda, V., Hwu, R. & Liaw, B.Y. Incremental capacity analysis and
close-to-equilibrium OCV measurements to quantify capacity fade in commercial
rechargeable lithium batteries. Electrochemical and Solid State Letters 9, A454-A457
(2006).
76. Barth, S., Harnagea, C., Mathur, S. & Rosei, F. The elastic moduli of oriented tin oxide
nanowires. Nanotechnology 20, - (2009).
77. Chen, Y.C., Chen, J.M., Huang, Y.H., Lee, Y.R. & Shih, H.C. Size effect of tin oxide
nanoparticles on high capacity lithium battery anode materials. Surface & Coatings
Technology 202, 1313-1318 (2007).
78. Okumura T., F.T., Uchimoto Y., Sakai N., Yamaji K., Yokokawa H. Determination of
lithium ion diffusion in lithium-manganese-oxide-spinel thin films by secondary-ion
mass spectrometry. Journal of Power Sources 189, 643-645 (2009).
79. Forsyth, P.J.E. Slip band damage and extrusion. Proceedings of the Royal Society A242,
198-202 (1957).
80. Akimoto J., T.Y., Gotoh Y., Mizuta S. Single crystal growth of the spinel-type LiMn2O4.
Journal of Crystal Growth 229, 405-408 (2001).
81. Benedek, R. & Thackeray, M.M. Simulation of the surface structure of lithium
manganese oxide spinel. Physical Review B 83(2011).