microsatellite dna analysis of rainbow trout (oncorhynchus
TRANSCRIPT
ORIGINAL PAPER
Microsatellite DNA analysis of rainbow trout (Oncorhynchusmykiss) from western Alberta, Canada: native statusand evolutionary distinctiveness of ‘‘Athabasca’’ rainbow trout
Eric B. Taylor Æ P. Tamkee Æ G. Sterling ÆW. Hughson
Received: 10 November 2005 / Accepted: 21 February 2006 / Published online: 5 June 2006
� Springer Science+Business Media B.V. 2006
Abstract Molecular genetic assays can contribute to con-
servation of aquatic taxa by assessing evolutionary and
taxonomic distinctiveness, levels of genetic variation within
and between populations, and the degree of introgression
with introduced taxa. The Athabasca River drainage
of western Alberta, Canada is one of only three (and the
largest) drainages flowing east of the continental divide that
contain native populations of rainbow trout (Salmonidae:
Oncorhynchus mykiss). The ‘‘Athabasca’’ rainbow trout has
been considered a preglacial relict worthy of special con-
servation measures. In addition, the native range of
Athabasca rainbow trout has seen many instances of intro-
ductions of non-native populations since the beginning of the
20th century. We assayed rainbow trout from the Athabasca
River drainage, from hatchery populations, and from repre-
sentative populations in adjacent regions (N = 49 localities)
for variation at 10 microsatelite loci to assess the level of
evolutionary distinctiveness of Athabasca rainbow trout, and
to assess the levels of introgression with non-native hatchery
fish. We found that native Athabasca rainbow trout did not
form a distinctive genetic assemblage and that the greatest
amount of allele frequency variation was attributable to
contemporary drainage systems (29.3%) rather than by a
Athabasca/non-Athabasca distinction (12.6%). We found
that 78% of all fish were confidently assigned to a ‘‘wild’’
rather than a ‘‘hatchery’’ genetic grouping and that most of
the inferred introgression with hatchery fish was restricted to
a few localities (N = 6). Our results suggest that: (i) Ath-
abasca River rainbow trout are likely postglacial immigrants
from adjacent populations of the Fraser River, and (ii) that
there is no evidence of widespread introgression of hatchery
alleles into native Athabasca River drainage rainbow trout.
Keywords Rainbow trout Æ Microsatellites ÆConservation genetics Æ Artificial Propogation ÆIntrogression taxonomy
Introduction
Molecular genetic assays can contribute to conservation of
taxa by assessing their evolutionary and taxonomic dis-
tinctiveness, the levels of genetic variation within and be-
tween populations, and the degree of introgression from
introduced taxa (Frankham et al. 2002). Salmonid fishes
(salmon, trout and char) have been the focus of many
conservation studies because they are so important as food
and recreational fishes and owing to their status in many
areas as cultural icons (Allendorf and Waples 1996; Neil-
sen and Regier 2004). Two of the most important issues in
salmonid conservation are: (i) the definition and identifi-
cation of conservation units below the species level (e.g.
‘‘evolutionarily significant units’’, ESUs) to both safeguard
the evolutionary legacy and potential of taxa, and (ii) the
potential impacts of hatchery supplementation on the per-
sistence of native gene pools (see review by Allendorf and
Waples 1996). The identification of ESUs in salmonid
conservation is problematic in that a single definition of
E. B. Taylor (&) Æ P. Tamkee
Department of Zoology and Native Fishes Research Group,
University of British Columbia, 6270 University Blvd.,
Vancouver, BC, V6T 1Z4, Canada
e-mail: [email protected]
G. Sterling
Fish and Wildlife Division, Alberta Sustainable Resource
Development, Provincial Building, #203, 111-54 St., Edson,
Alberta, T7E 1T2, Canada
W. Hughson
Jasper National Park, Box 10, Jasper, Alberta, T0E 1E0, Canada
Conserv Genet (2007) 8:1–15
DOI 10.1007/s10592-006-9142-9
123
what constitutes an ESU across jurisdictions remains elu-
sive (e.g. reviewed by Crandall et al. 2000). Notwith-
standing this uncertainty, some level of genetic
distinctiveness among groups of populations that reflects
relatively old divergences (i.e., preglacial) is usually de-
sired in such a definition. Hybridization between native and
introduced salmonid taxa has long been recognized as a
major conservation issue, especially for taxa in western
North America (Leary et al. 1995). Although methods to
document and study such hybridization are well established
(e.g. Allendorf et al. 2001; Rubidge and Taylor 2005), how
hybridized taxa are treated in setting conservation priorities
in salmonids is an area of some debate (cf. Allendorf et al.
2005; Campton and Kaeding 2005).
The rainbow trout, Oncorhynchus mykiss, has a native
distribution stretching from Kamchatka in the western
Pacific Ocean, eastward to southern Alaska and coastal and
interior regions of British Columbia, Washington, Oregon
and southern California and Mexico down to the Baja
Pennisula (Behnke 1992). Interior drainages of North
America that contain native populations of rainbow trout
are restricted to drainages flowing west of the continental
divide to the Pacific Ocean with three exceptions. The
Peace and Liard rivers in northern British Columbia flow to
the Arctic drainage via the Mackenzie River and contain
native rainbow trout in their headwaters. In addition, the
Athabasca River in western Alberta also flows to the Arctic
via the Mackenzie River and contains native rainbow trout
(Behnke 1992; Nelson and Paetz 1992).
Behnke (1992) recognized up to five subspecies within
rainbow trout based on a constellation of biogeographic,
allozyme and chromosomal, and morphological data. One of
these, the Columbia River redband trout (O. m. gairdneri) is
thought to be the lineage that colonized the interior drainages
of western Canada, after the most recent glaciation that
ended approximately 12,000 years ago. This relatively re-
cent colonization, principally via the Columbia River, into
the Fraser River and eventually into the upper Laird, Mac-
kenzie, and Athabasca rivers via postglacial headwater ex-
changes is thought to explain the origin of rainbow trout east
of the continental divide, including those in Alberta (McP-
hail and Lindsey 1970; Nelson and Paetz 1992).
By contrast, Carl et al. (1994) reported allozyme and
meristic data from a single population of rainbow trout
(Wampus Creek) from the Athabasca River system that
suggested that trout from this area were highly divergent
from rainbow trout and steelhead trout (anadromous O.
mykiss) sampled from parts of the Fraser River and from
tributaries of the United States’ portion of the middle and
upper Columbia River. Carl et al. (1994) suggested that the
depth of the divergence between Wampus Creek rainbow
trout and adjacent inland rainbow trout indicated a pre-glacial
origin of the Athabasca River rainbow trout. These data are at
variance with mitochondrial DNA data (Wilson et al. 1985;
McCusker et al. 2000) that showed that rainbow trout sam-
pled from three localities in the upper Athabasca River were
characterized by mtDNA haplotypes that were very similar
or identical to those found in O. mykiss throughout the
interior of British Columbia (BC). This latter result is con-
sistent with hypothesized recent origin of Athabasca River
rainbow trout via headwater transfer with the Fraser River.
Regardless of the age and origin of the Athabasca River
rainbow trout these native populations have been subject to
some intensive supplementation of hatchery-raised rainbow
trout from a diversity of sources outside Alberta since the
early 1920’s (G. Sterling, Alberta Sustainable Resource
Development, unpublished data). In addition, rainbow trout
have been introduced and have established naturalized
populations in other stocked Alberta watersheds (e.g.
tributaries of the North and South Saskatchewan rivers).
Over-harvest, habitat loss and degradation, and introgres-
sion with introduced genotypes are all considered factors
that have contributed to the decline of native rainbow trout
in western Alberta (Nelson and Paetz 1992).
In summary, there are two central issues relevant to the
conservation of biodiversity of rainbow trout at the eastern
periphery of its native range. First, the degree of phyloge-
netic distinction of Athabasca River rainbow trout is still
somewhat uncertain. The most recent analysis of McCusker
et al. (2000) raised doubts about its distinction from other
inland rainbow trout, but this was a single locus (mtDNA)
analysis based on relatively few samples. Second, signifi-
cant stocking of non-native rainbow trout into the Athaba-
sca River drainage raises the possibility that these gene
pools have been affected by introgression of non-native
genotypes (e.g. Utter 2000). To address these issues, we
genotyped samples of Athabasca River rainbow trout at 10
microsatellite loci to: (i) provide a robust multilocus
assessment of the level of divergence between these popu-
lations and a number of adjacent populations in the Fraser
River basin, and (ii) test for introgression between native
populations and a series of hatchery populations used in the
Alberta stocking program. The results of our analyses pro-
vide important information concerning the prioritization of
populations for conservation in terms of their degree of
phylogenetic distinctiveness and the extent to which they
represent native gene pools (Nelson and Paetz 1992).
Materials and methods
Sample watersheds
Fin clips or whole fry were collected from various tribu-
taries of the Athabasca River drainage during the summers
of 2000, 2003, and 2004 (Table 1, Fig. 1). The samples
2 Conserv Genet (2007) 8:1–15
123
Table 1 Localities and population status, Number code (NC) for wild-collected populations in Fig. 1, collection dates, and sample sizes for
rainbow trout collected from western Alberta
Locality NC Year collected Years stocked N
Non-stocked populations
Athabasca River
Oldman Creek 1 2000 NA 13
Lynx Creek 2 2000 NA 10
Emerson Creek 3 2000 NA 10
Windfall Creek 4 2000 NA 14
Pine Creek 5 2000 NA 4
Sakawatamau River 6 2000 NA 5
Buffalo Prairie 35 2002 NA 40
McLeod River
Felton Creek 18 2000 NA 10
Deerlick Creek 19 2000 NA 10
Anderson Creek 21 2000 NA 25
Wampus Creek 20 2004 NA 20
Wildhay/Berland River
Hightower Creek 33 2000 NA 10
Barbara Creek 31 2000 NA 10
Moberly Creek 32 2000 NA 10
Cabin Creek 16 2000 NA 4
Cabin Creek 16 2004 NA 20
Jessie Creek 17 2004 NA 20
Hatchery populations
Beity /Beaver Lake fry 2000 NA 30
Mount Lassen alevins 2000 NA 30
Mount Lassen fry 2000 NA 30
Mount Lassen /Bow River adults 2000 NA 30
Mount Lassen adults 2004 NA 20
Stocked populations
Athabasca River
Athabasca Rivera 7 2000 1950–1952 10
Two Creeksb 8 2000 1985 10
Fish Creekc 10 2000 1940 10
Katy Creekc 11 2000 1952 10
Chickadee Creekb 12 2000 1985 13
Sandstone Creekb 13 2000 1985 10
Canyon Creekb 14 2000 1985–1988 4
Wabasso Creekd 36 2003 1925, 1951 41
Lac Beauvertd 38 2003 1950–1952 34
Tekarra Creekd 37 2003 1941–1956 5
Cottonwood Creekd 39 2003 1947 40
McLeod River
Moose Creekc 22 2000 1928–1940 10
Luscar Creekc 23 2000 1934 17
White Creekc 24 2000 1953 10
McKenzie Creekc 25 2000 1935–1936 10
Edson Riverc 26 2000 1926–1953 10
Trout Creekc 27 2000 1926–1947 24
Mitchell Creekc 28 2000 1932–1934 1
Prest Creekc 29 2000 1935–1953 3
Lac des Rochesc 30 2000 ? 36
Wildhay/Berland
Rainbow Lakeb 9 2000 1985–1997 10
Rainbow Lake outletb 15 2000 1985–1997 1
Muskeg River
Muskeg Riverc 34 2004 1970–2004 17
Snaring River
Harvey Laked 40 2003 1962, 1967 36
British Columbia populations
Queen Charlotte Islands
Conserv Genet (2007) 8:1–15 3
123
consisted of indigenous (‘‘non-stocked’’) populations from
the Athabasca River and from the McLeod and Wildhay/
Berland, and Snaring river subdrainages (N=245 samples).
These represent fish for which there are no documented
records of hatchery fish being stocked and represent the
suspected range of indigenous populations (see Nelson and
Paetz 1992). Fish tissue was also obtained from tributaries
of these same three major drainages, but where non-
indigenous hatchery populations of rainbow trout have
been stocked at least once (‘‘stocked samples’’, N = 482
samples, Table 1). Samples were also obtained from major
sources of Alberta hatchery populations (N = 170). The
tissue samples were either stored in 95% ethanol or frozen
at )20�C and genomic DNA was extracted using standard
laboratory protocols.
Microsatellite analysis
We scored individuals using 10 microsatellite loci that had
been isolated from salmonids: Oki3a (coho salmon, On-
corhynchus kisutch, P. Bentzen, Dept.of Biology, Dalhou-
sie University, Halifax, NS, unpublished data), Ssa85, 197,
and 456 (Atlantic salmon, Salmo salar, O’Reilly et al.
1996; Sletten et al. 1995), One8, One14 (sockeye salmon,
O. nerka, Scribner et al. 1996), Ots 3, 100, and 103
(chinook salmon, O. tshawytscha, Banks et al. 1999; Nel-
son and Beacham 1999), and Omy77 (rainbow trout, Morris
et al. 1996). These loci were chosen for their ease of PCR-
based allele scoring (i.e. they gave ‘‘clean signals’’ with
little to no artifact stutter bands) and because they have
been assayed in other rainbow trout populations throughout
BC (P. Tamkee and E.B. Taylor, unpublished data).
Analyses for the 2000 year samples were completed using32/33P end-labeled primers and PCR products were scored
from autoradiographic films after polyacrlyamide electro-
phoresis using 6% Long Ranger gels (see Costello et al.
2003). Allele sizes were obtained by comparison to M13
sequencing ladders. Samples from 2003 and 2004 were
examined using fluorescently labeled primers and assayed
on a Beckman-Coulter CEQ 8000 automated genotyper.
Representative genotypes from the initial isotopic analyses
were re-run on the CEQ system to ensure consistent
scoring of alleles across platforms. All raw allele frequency
summary data can be obtained from an electronic database
(http://www.zoology.ubc.ca/~etaylor/nfrg/rbtr/athabasca/
appendix.html) or from the senior author upon request.
Data analysis
The following tests were performed using GENEPOP ver.
3.1 (Raymond and Rousset 2001) for all collections with
sample sizes of at least 15. Tests for deviations from
Hardy-Weinberg equilibrium were performed for each
locus-population combination using an exact test in which
P-values were estimated using a Markov chain method.
Tests for genotypic linkage disequilibrium for all combi-
nations of locus pairs within a population were also made
Table 1 continued
Locality NC Year collected Years stocked N
Copper Rivere 41 2003 NA 21
Mamin Rivere 41 2003 NA 31
upper Fraser River
Glatheli Lake 42 2000 NA 32
Fenten Lake 42 2000 NA 32
Columbia River
Kootenay Riverf 43 2003 NA 52
Salmo River 43 2003 NA 60
‘‘Non-stocked populations’’ are native populations with no known introductions of hatchery populations. ‘‘Stocked populations’’ are those known
to have one or more introductions of hatchery fish from the sources listed under ‘‘Hatchery populations’’. ‘‘NA’’ for not applicable. Also shown
are localities of six British Columbia populations included for comparative purposes. Localities in bold were used in population-level analysesaMainstem Athabasca River current population likely derived from a number of unknown sourcesbStocked with Mount Lassen, California (CA) captive population derived from crosses between Clearwater River, CA stock and Kamloops (BC)
stock. Beity hatchery strain is a mixture of various populations established in Washington StatecFry and/or fingerlings shipped from rearing facilities at the Calgary Brewing Company, Calgary or the Maligne River Hatchery, Jasper National
Park. It is unknown from where these two facilities acquired eggs. Eggs likely shipped via rail from south/central BC or northern California. Eggs
were also supplied from hatcheries in Idaho and Montana in the 1930’s and from the Banff Park hatchery before this date. From the 1940’s to the
1980’s most rainbow trout were derived from a broodstock program at the Trout Lodge Facility in Washington StatedSource of hatchery fish unknowneAnadromous rainbow trout (steelhead trout)fMainstem, near Castlegar, BC
Date of hatchery stocking unknown
4 Conserv Genet (2007) 8:1–15
123
using a Markov chain method with GENEPOP default
values. Basic descriptive statistics of sample size (N),
number of alleles (Na), observed (Ho) and expected (He)
heterozygosity were compiled using Fstat ver 2.9 (Goudet
2001). FstðhÞ values were calculated in ARLEQUIN ver.
2.0 (Schneider et al. 2000) based on allelic frequency
differences with significance of overall and pairwise
comparisons based on 1000 permutations.
To summarize genetic differentiation among all sam-
ples, a factorial correspondence analysis (FCA) was
conducted on allele frequency data using GENETIX
(Belkhir et al. 2001). Factorial Correspondence Analysis is
a type of factor analysis that seeks to find the best linear
combination of variables (in this case allele frequencies at
different loci) that best describe variation between indi-
vidual observations (fish). In general terms, FCA is best
suited for categorical data, such as allele frequency counts,
and determines the first K axes of an orthogonal number of
axes that describe the most variance from a ‘‘cloud’’ of
observations
To determine whether or not stocked samples differed
from indigenous samples in a manner that could be
attributed to introgression from hatchery populations, we
used maximum likelihood-based classification procedures.
These analyses make use of multilocus genetic profiles of
individual fish (i.e., stocked fish) to assign them to a priori
groups (i.e., known indigenous fish or known hatchery fish)
that had been characterized at the same loci (e.g. reviewed
by Hansen et al. 2001). The program GENECLASS
(version 2.0, Piry et al. 2004) was used to classify the
stocked fish samples to one of either indigenous or hatch-
ery origin using the Bayesian assignment methodology of
Rannala and Mountain (1997). In these analyses, we used
the known hatchery and indigenous samples as our baseline
1
12
3
4
5
6
1717
33
3132
35
21
18
20 19
16
34
40
3938
3736 35
252330
2428
22
26
27
8 12
159
11
10 7
14 13
40 km
N
British Columbia
53o
54o
118o 116o
Smoky River Basin
Athabasca River Basin
North Saskatchewan RiverBasin
41
42
43
Canada
USA
Alberta
29
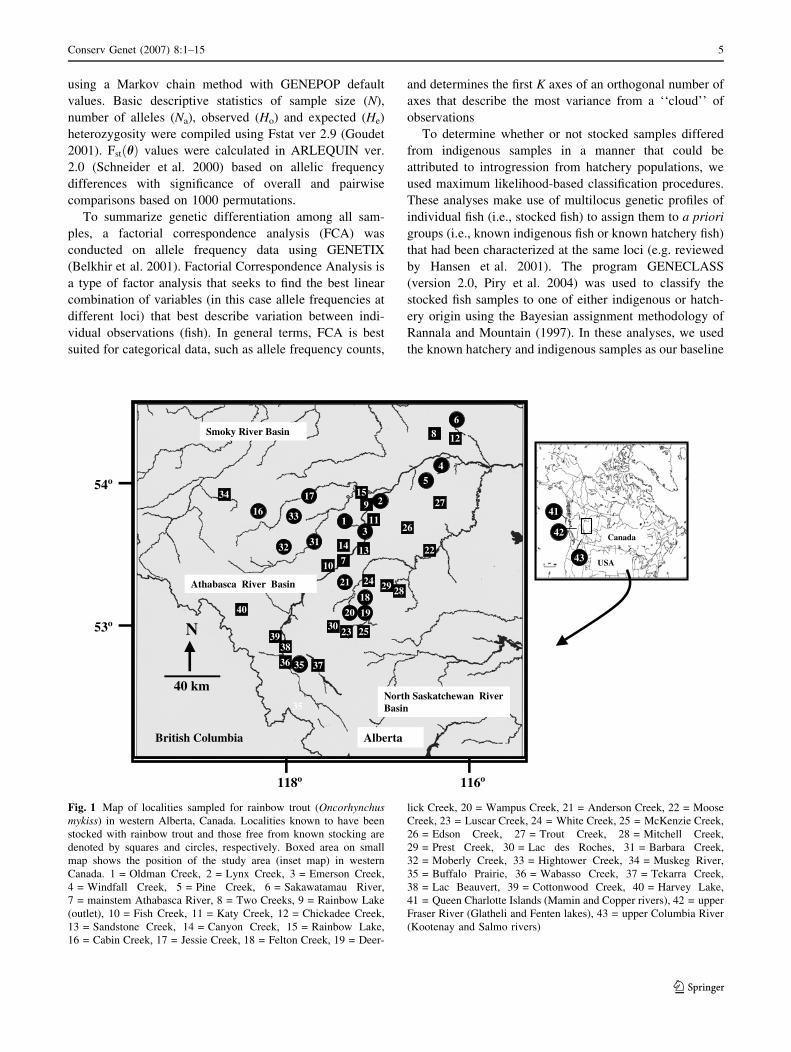
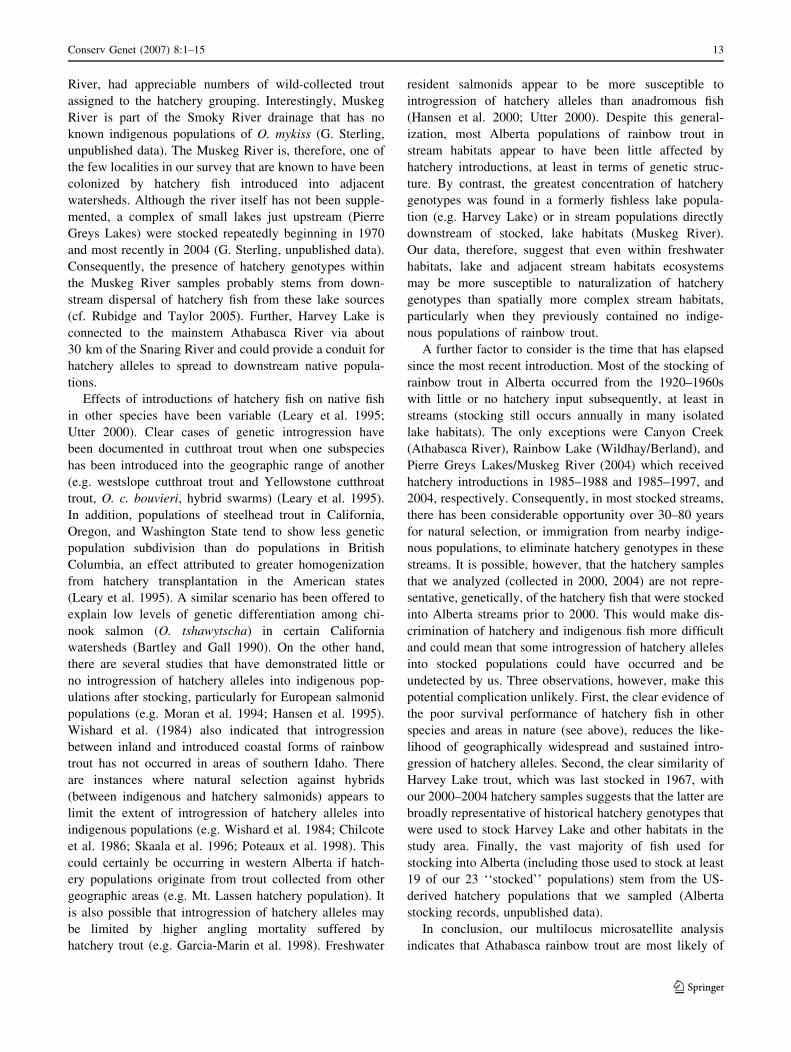
Fig. 1 Map of localities sampled for rainbow trout (Oncorhynchus
mykiss) in western Alberta, Canada. Localities known to have been
stocked with rainbow trout and those free from known stocking are
denoted by squares and circles, respectively. Boxed area on small
map shows the position of the study area (inset map) in western
Canada. 1 = Oldman Creek, 2 = Lynx Creek, 3 = Emerson Creek,
4 = Windfall Creek, 5 = Pine Creek, 6 = Sakawatamau River,
7 = mainstem Athabasca River, 8 = Two Creeks, 9 = Rainbow Lake
(outlet), 10 = Fish Creek, 11 = Katy Creek, 12 = Chickadee Creek,
13 = Sandstone Creek, 14 = Canyon Creek, 15 = Rainbow Lake,
16 = Cabin Creek, 17 = Jessie Creek, 18 = Felton Creek, 19 = Deer-
lick Creek, 20 = Wampus Creek, 21 = Anderson Creek, 22 = Moose
Creek, 23 = Luscar Creek, 24 = White Creek, 25 = McKenzie Creek,
26 = Edson Creek, 27 = Trout Creek, 28 = Mitchell Creek,
29 = Prest Creek, 30 = Lac des Roches, 31 = Barbara Creek,
32 = Moberly Creek, 33 = Hightower Creek, 34 = Muskeg River,
35 = Buffalo Prairie, 36 = Wabasso Creek, 37 = Tekarra Creek,
38 = Lac Beauvert, 39 = Cottonwood Creek, 40 = Harvey Lake,
41 = Queen Charlotte Islands (Mamin and Copper rivers), 42 = upper
Fraser River (Glatheli and Fenten lakes), 43 = upper Columbia River
(Kootenay and Salmo rivers)
Conserv Genet (2007) 8:1–15 5
123
data with which to assign the populations of unknown
status. We included a more stringent ‘‘exclusion analysis’’
in GENECLASS to statistically assess the probability of
an individual being of indigenous or hatchery origin.
Individuals were excluded from indigenous or hatchery
samples if their observed multilocus genotype was ob-
served in <5% of 10,000 simulated genotypes that were
generated by randomly sampling from the reference pop-
ulations (Cornuet et al. 1999; Piry et al. 2004).
In addition, we used the program STRUCTURE (Prit-
chard et al. 2000) to probalistically estimate the proportion
of an individual fish’s genome that originated from the
indigenous and/or hatchery reference populations. The
method clusters individuals, based on their genotypes, into
K randomly interbreeding groups by minimizing departures
from Hardy–Weinberg and linkage disequilibrium within
groups. We used STRUCTURE to calculate posterior dis-
tributions of the admixture coefficient, q, or the propor-
tional contribution of each reference sample to an
individual’s genotype (Pritchard et al. 2000; Koskinen
et al. 2002). We employed 50,000 replications during the
pre-simulation (‘‘burn-in’’) period and then estimated q
after a subsequent 450,000 replications.
We also applied the analysis of molecular variance
(AMOVA) approach of Excoffier et al. (1992) to partition
microsatellite variation into its various components (among
populations within coastal and interior regions versus be-
tween coastal and interior regions) using ARLEQUIN. We
pooled samples using several hierarchical arrangements: by
major watershed within Alberta, by watersheds across the
entire sample area, and by ‘‘Athabasca’’ and ‘‘non-
Athabasca’’ samples. We based our inferences on allele
frequency variation among populations assuming no
mutation-based differentiation because estimates based on
the former appear to be more appropriate for recently
diverged populations (e.g. Gaggiotti et al. 1999). In addi-
tion, all samples were used in GENECLASS assignment-
based analyses to try and identify hatchery fish or their
recent descendents sampled from streams. Population level
analyses, however, where conducted using individual col-
lections with sample sizes of at least 15 (Table 1). Where
appropriate, all statistical tests were conducted at tablewide
significance levels of a ¼ 0:05 using the sequential Bon-
ferroni adjustment (Rice 1989).
Results
Microsatellite polymorphism within populations
Thirteen of the wild populations had sufficient sample sizes
(i.e., N of at least 15) for population-level analyses as did
the six hatchery populations (Table 1). In general, micro-
satellite polymorphism in rainbow trout across all loci was
variable across loci and populations (i.e. expected hetero-
zygosities ranged between 0.10 and 0.80, Table 2). The
most variable loci were Oki3a, Ssa85, and Ots100 with 32,
30, and 24 alleles, respectively (allele frequencies are
available at http://www.zoology.ubc.ca/~etaylor/nfrg/rbtr/
athabasca/appendix.html). The hatchery samples were
significantly more variable in terms of expected heterozy-
gosity, than either the wild-collected populations (permu-
tation of observed differences, P=0.002). Virtually all
samples were in Hardy-Weinberg equilibrium with 18 out
of a possible 190 (10 loci · 19 sample populations) tests
showing statistically significant heterozygote deficits
(Table 2, P < 0.0003). Twelve of these deviations oc-
curred in the five hatchery samples with the remainder
being scattered among loci and wild populations (Table 2).
There were two significant departures from linkage dis-
equilibrium between loci within populations; one in the Mt.
Lassen fry sample (Ssa85 and One14) and the other in Lac
Beauvert (Omy77 and Ots100).
Microsatellite polymorphism among populations
There was significant variation in allele frequencies (Ta-
ble 3) among populations (i.e., those samples with N of at
least 15). Fixation indicesðhÞ ranged from 0.104 (Ots103)
to 0.59 (Ssa456). The overall level of subdivision was
highðh ¼ 0:33, 95% CI 0.27–0.40) among all populations
as well as just among the wild-collected samples (h ¼ 0:30,
95% CI 0.26–0.35). Pairwise differences in h were sub-
stantial and most were statistically significant (Table 3).
There were, however, several comparisons that were not
significant and these were largely found in comparisons
between populations within the McLeod River drainage
and between two creeks in the Wildhay/Berland River
system (Table 3).
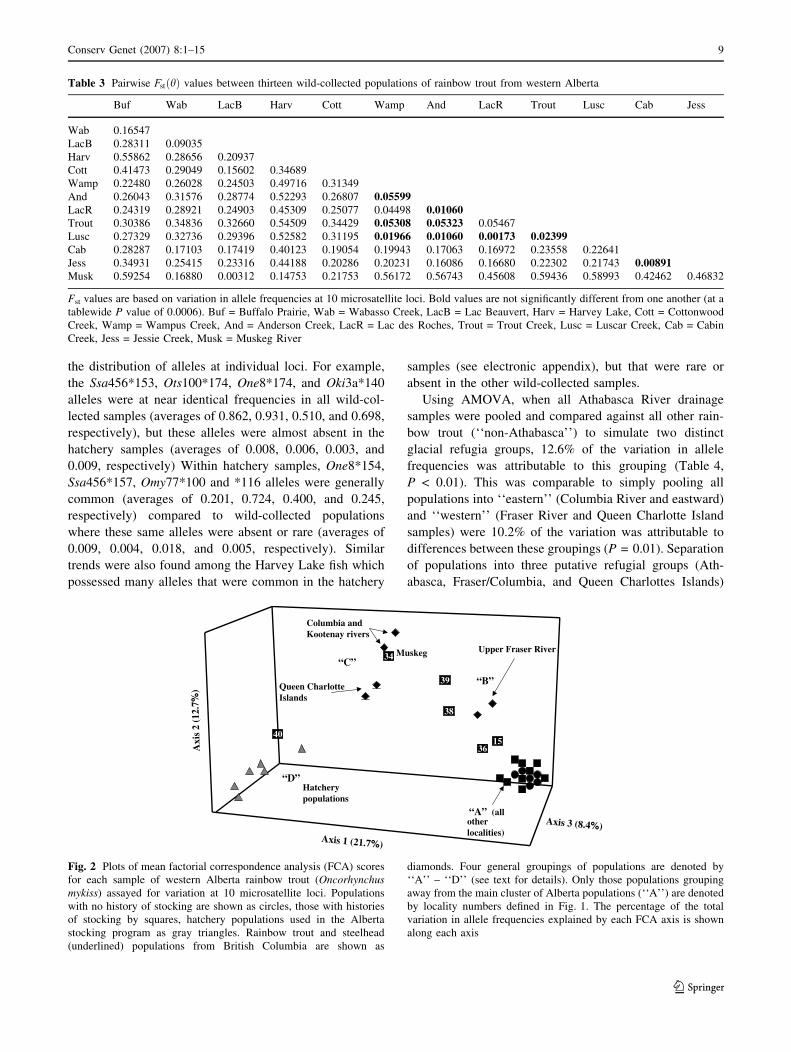
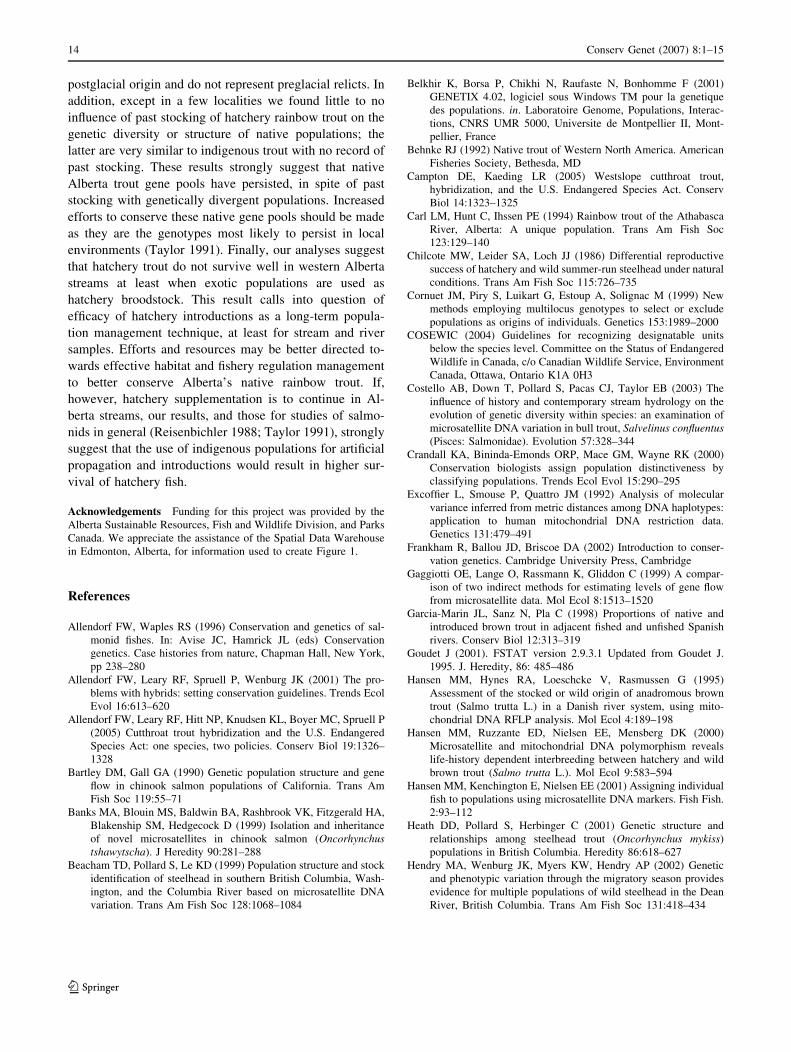
In the FCA, four broad groupings of rainbow trout were
resolved (Fig. 2). One group (‘‘A’’) consisted of a tight
clustering of wild-collected (both non-stocked and stocked
samples) rainbow trout from Alberta. A second group
(‘‘B’’) consisted of four Alberta populations (Lac des
Roches, Wabasso, Cottonwood, and Rainbow creeks) and
the two upper Fraser River populations (Glatheli and
Fenton lakes). A third group (‘‘C’’) consisted of the
Muskeg River (Alberta) population, two steelhead popu-
lations from the Queen Charlotte Islands, and two
Columbia River populations. The final group (‘‘D’’) con-
sisted of all hatchery populations and the Harvey Lake
(Alberta) sample (Fig. 2).
The distinction between hatchery and non-stocked and
stocked wild-collected rainbow trout was also evident in
6 Conserv Genet (2007) 8:1–15
123
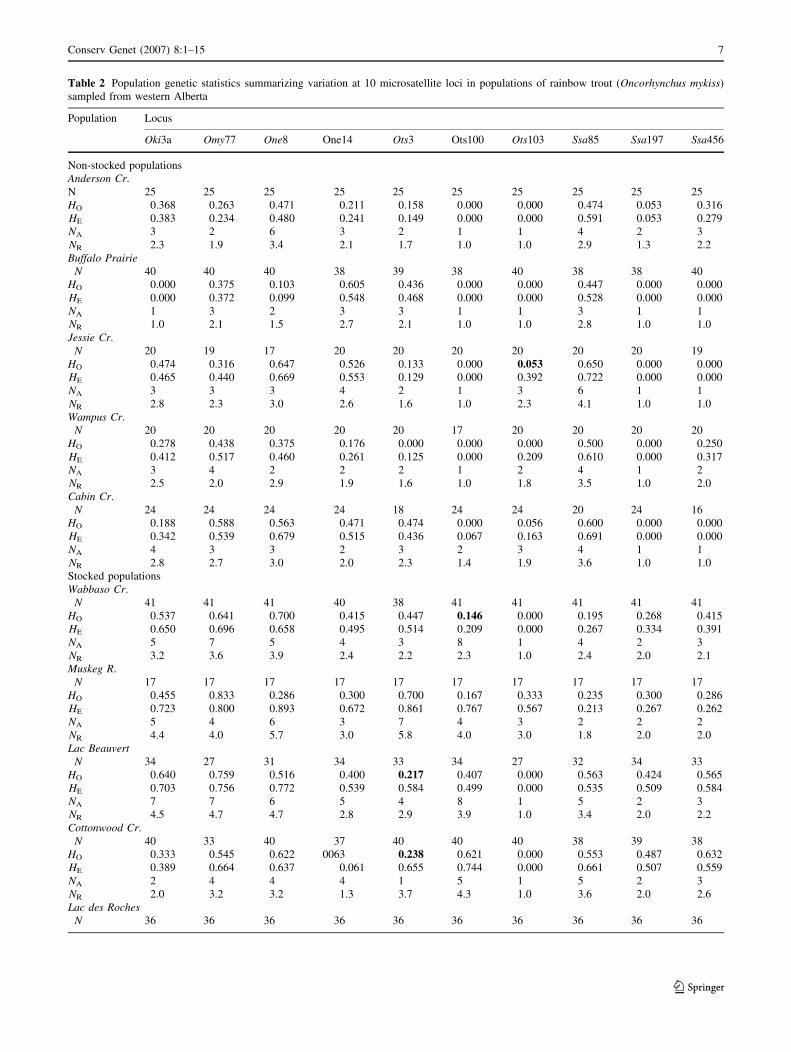
Table 2 Population genetic statistics summarizing variation at 10 microsatellite loci in populations of rainbow trout (Oncorhynchus mykiss)
sampled from western Alberta
Population Locus
Oki3a Omy77 One8 One14 Ots3 Ots100 Ots103 Ssa85 Ssa197 Ssa456
Non-stocked populations
Anderson Cr.
N 25 25 25 25 25 25 25 25 25 25
HO 0.368 0.263 0.471 0.211 0.158 0.000 0.000 0.474 0.053 0.316
HE 0.383 0.234 0.480 0.241 0.149 0.000 0.000 0.591 0.053 0.279
NA 3 2 6 3 2 1 1 4 2 3
NR 2.3 1.9 3.4 2.1 1.7 1.0 1.0 2.9 1.3 2.2
Buffalo Prairie
N 40 40 40 38 39 38 40 38 38 40
HO 0.000 0.375 0.103 0.605 0.436 0.000 0.000 0.447 0.000 0.000
HE 0.000 0.372 0.099 0.548 0.468 0.000 0.000 0.528 0.000 0.000
NA 1 3 2 3 3 1 1 3 1 1
NR 1.0 2.1 1.5 2.7 2.1 1.0 1.0 2.8 1.0 1.0
Jessie Cr.
N 20 19 17 20 20 20 20 20 20 19
HO 0.474 0.316 0.647 0.526 0.133 0.000 0.053 0.650 0.000 0.000
HE 0.465 0.440 0.669 0.553 0.129 0.000 0.392 0.722 0.000 0.000
NA 3 3 3 4 2 1 3 6 1 1
NR 2.8 2.3 3.0 2.6 1.6 1.0 2.3 4.1 1.0 1.0
Wampus Cr.
N 20 20 20 20 20 17 20 20 20 20
HO 0.278 0.438 0.375 0.176 0.000 0.000 0.000 0.500 0.000 0.250
HE 0.412 0.517 0.460 0.261 0.125 0.000 0.209 0.610 0.000 0.317
NA 3 4 2 2 2 1 2 4 1 2
NR 2.5 2.0 2.9 1.9 1.6 1.0 1.8 3.5 1.0 2.0
Cabin Cr.
N 24 24 24 24 18 24 24 20 24 16
HO 0.188 0.588 0.563 0.471 0.474 0.000 0.056 0.600 0.000 0.000
HE 0.342 0.539 0.679 0.515 0.436 0.067 0.163 0.691 0.000 0.000
NA 4 3 3 2 3 2 3 4 1 1
NR 2.8 2.7 3.0 2.0 2.3 1.4 1.9 3.6 1.0 1.0
Stocked populations
Wabbaso Cr.
N 41 41 41 40 38 41 41 41 41 41
HO 0.537 0.641 0.700 0.415 0.447 0.146 0.000 0.195 0.268 0.415
HE 0.650 0.696 0.658 0.495 0.514 0.209 0.000 0.267 0.334 0.391
NA 5 7 5 4 3 8 1 4 2 3
NR 3.2 3.6 3.9 2.4 2.2 2.3 1.0 2.4 2.0 2.1
Muskeg R.
N 17 17 17 17 17 17 17 17 17 17
HO 0.455 0.833 0.286 0.300 0.700 0.167 0.333 0.235 0.300 0.286
HE 0.723 0.800 0.893 0.672 0.861 0.767 0.567 0.213 0.267 0.262
NA 5 4 6 3 7 4 3 2 2 2
NR 4.4 4.0 5.7 3.0 5.8 4.0 3.0 1.8 2.0 2.0
Lac Beauvert
N 34 27 31 34 33 34 27 32 34 33
HO 0.640 0.759 0.516 0.400 0.217 0.407 0.000 0.563 0.424 0.565
HE 0.703 0.756 0.772 0.539 0.584 0.499 0.000 0.535 0.509 0.584
NA 7 7 6 5 4 8 1 5 2 3
NR 4.5 4.7 4.7 2.8 2.9 3.9 1.0 3.4 2.0 2.2
Cottonwood Cr.
N 40 33 40 37 40 40 40 38 39 38
HO 0.333 0.545 0.622 0063 0.238 0.621 0.000 0.553 0.487 0.632
HE 0.389 0.664 0.637 0.061 0.655 0.744 0.000 0.661 0.507 0.559
NA 2 4 4 4 1 5 1 5 2 3
NR 2.0 3.2 3.2 1.3 3.7 4.3 1.0 3.6 2.0 2.6
Lac des Roches
N 36 36 36 36 36 36 36 36 36 36
Conserv Genet (2007) 8:1–15 7
123
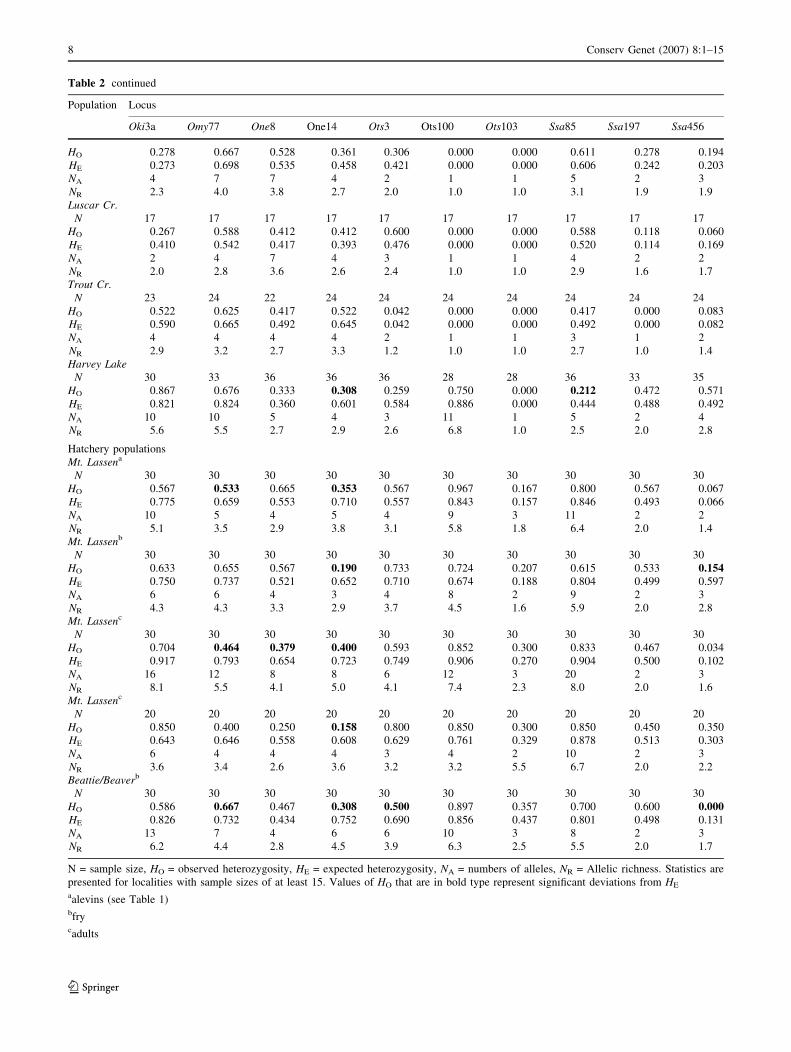
Table 2 continued
Population Locus
Oki3a Omy77 One8 One14 Ots3 Ots100 Ots103 Ssa85 Ssa197 Ssa456
HO 0.278 0.667 0.528 0.361 0.306 0.000 0.000 0.611 0.278 0.194
HE 0.273 0.698 0.535 0.458 0.421 0.000 0.000 0.606 0.242 0.203
NA 4 7 7 4 2 1 1 5 2 3
NR 2.3 4.0 3.8 2.7 2.0 1.0 1.0 3.1 1.9 1.9
Luscar Cr.
N 17 17 17 17 17 17 17 17 17 17
HO 0.267 0.588 0.412 0.412 0.600 0.000 0.000 0.588 0.118 0.060
HE 0.410 0.542 0.417 0.393 0.476 0.000 0.000 0.520 0.114 0.169
NA 2 4 7 4 3 1 1 4 2 2
NR 2.0 2.8 3.6 2.6 2.4 1.0 1.0 2.9 1.6 1.7
Trout Cr.
N 23 24 22 24 24 24 24 24 24 24
HO 0.522 0.625 0.417 0.522 0.042 0.000 0.000 0.417 0.000 0.083
HE 0.590 0.665 0.492 0.645 0.042 0.000 0.000 0.492 0.000 0.082
NA 4 4 4 4 2 1 1 3 1 2
NR 2.9 3.2 2.7 3.3 1.2 1.0 1.0 2.7 1.0 1.4
Harvey Lake
N 30 33 36 36 36 28 28 36 33 35
HO 0.867 0.676 0.333 0.308 0.259 0.750 0.000 0.212 0.472 0.571
HE 0.821 0.824 0.360 0.601 0.584 0.886 0.000 0.444 0.488 0.492
NA 10 10 5 4 3 11 1 5 2 4
NR 5.6 5.5 2.7 2.9 2.6 6.8 1.0 2.5 2.0 2.8
Hatchery populations
Mt. Lassena
N 30 30 30 30 30 30 30 30 30 30
HO 0.567 0.533 0.665 0.353 0.567 0.967 0.167 0.800 0.567 0.067
HE 0.775 0.659 0.553 0.710 0.557 0.843 0.157 0.846 0.493 0.066
NA 10 5 4 5 4 9 3 11 2 2
NR 5.1 3.5 2.9 3.8 3.1 5.8 1.8 6.4 2.0 1.4
Mt. Lassenb
N 30 30 30 30 30 30 30 30 30 30
HO 0.633 0.655 0.567 0.190 0.733 0.724 0.207 0.615 0.533 0.154HE 0.750 0.737 0.521 0.652 0.710 0.674 0.188 0.804 0.499 0.597
NA 6 6 4 3 4 8 2 9 2 3
NR 4.3 4.3 3.3 2.9 3.7 4.5 1.6 5.9 2.0 2.8
Mt. Lassenc
N 30 30 30 30 30 30 30 30 30 30
HO 0.704 0.464 0.379 0.400 0.593 0.852 0.300 0.833 0.467 0.034
HE 0.917 0.793 0.654 0.723 0.749 0.906 0.270 0.904 0.500 0.102
NA 16 12 8 8 6 12 3 20 2 3
NR 8.1 5.5 4.1 5.0 4.1 7.4 2.3 8.0 2.0 1.6
Mt. Lassenc
N 20 20 20 20 20 20 20 20 20 20
HO 0.850 0.400 0.250 0.158 0.800 0.850 0.300 0.850 0.450 0.350
HE 0.643 0.646 0.558 0.608 0.629 0.761 0.329 0.878 0.513 0.303
NA 6 4 4 4 3 4 2 10 2 3
NR 3.6 3.4 2.6 3.6 3.2 3.2 5.5 6.7 2.0 2.2
Beattie/Beaverb
N 30 30 30 30 30 30 30 30 30 30
HO 0.586 0.667 0.467 0.308 0.500 0.897 0.357 0.700 0.600 0.000HE 0.826 0.732 0.434 0.752 0.690 0.856 0.437 0.801 0.498 0.131
NA 13 7 4 6 6 10 3 8 2 3
NR 6.2 4.4 2.8 4.5 3.9 6.3 2.5 5.5 2.0 1.7
N = sample size, HO = observed heterozygosity, HE = expected heterozygosity, NA = numbers of alleles, NR = Allelic richness. Statistics are
presented for localities with sample sizes of at least 15. Values of HO that are in bold type represent significant deviations from HE
aalevins (see Table 1)bfrycadults
8 Conserv Genet (2007) 8:1–15
123
the distribution of alleles at individual loci. For example,
the Ssa456*153, Ots100*174, One8*174, and Oki3a*140
alleles were at near identical frequencies in all wild-col-
lected samples (averages of 0.862, 0.931, 0.510, and 0.698,
respectively), but these alleles were almost absent in the
hatchery samples (averages of 0.008, 0.006, 0.003, and
0.009, respectively) Within hatchery samples, One8*154,
Ssa456*157, Omy77*100 and *116 alleles were generally
common (averages of 0.201, 0.724, 0.400, and 0.245,
respectively) compared to wild-collected populations
where these same alleles were absent or rare (averages of
0.009, 0.004, 0.018, and 0.005, respectively). Similar
trends were also found among the Harvey Lake fish which
possessed many alleles that were common in the hatchery
samples (see electronic appendix), but that were rare or
absent in the other wild-collected samples.
Using AMOVA, when all Athabasca River drainage
samples were pooled and compared against all other rain-
bow trout (‘‘non-Athabasca’’) to simulate two distinct
glacial refugia groups, 12.6% of the variation in allele
frequencies was attributable to this grouping (Table 4,
P < 0.01). This was comparable to simply pooling all
populations into ‘‘eastern’’ (Columbia River and eastward)
and ‘‘western’’ (Fraser River and Queen Charlotte Island
samples) were 10.2% of the variation was attributable to
differences between these groupings (P = 0.01). Separation
of populations into three putative refugial groups (Ath-
abasca, Fraser/Columbia, and Queen Charlottes Islands)
Table 3 Pairwise FstðhÞ values between thirteen wild-collected populations of rainbow trout from western Alberta
Buf Wab LacB Harv Cott Wamp And LacR Trout Lusc Cab Jess
Wab 0.16547
LacB 0.28311 0.09035
Harv 0.55862 0.28656 0.20937
Cott 0.41473 0.29049 0.15602 0.34689
Wamp 0.22480 0.26028 0.24503 0.49716 0.31349
And 0.26043 0.31576 0.28774 0.52293 0.26807 0.05599LacR 0.24319 0.28921 0.24903 0.45309 0.25077 0.04498 0.01060Trout 0.30386 0.34836 0.32660 0.54509 0.34429 0.05308 0.05323 0.05467
Lusc 0.27329 0.32736 0.29396 0.52582 0.31195 0.01966 0.01060 0.00173 0.02399Cab 0.28287 0.17103 0.17419 0.40123 0.19054 0.19943 0.17063 0.16972 0.23558 0.22641
Jess 0.34931 0.25415 0.23316 0.44188 0.20286 0.20231 0.16086 0.16680 0.22302 0.21743 0.00891Musk 0.59254 0.16880 0.00312 0.14753 0.21753 0.56172 0.56743 0.45608 0.59436 0.58993 0.42462 0.46832
Fst values are based on variation in allele frequencies at 10 microsatellite loci. Bold values are not significantly different from one another (at a
tablewide P value of 0.0006). Buf = Buffalo Prairie, Wab = Wabasso Creek, LacB = Lac Beauvert, Harv = Harvey Lake, Cott = Cottonwood
Creek, Wamp = Wampus Creek, And = Anderson Creek, LacR = Lac des Roches, Trout = Trout Creek, Lusc = Luscar Creek, Cab = Cabin
Creek, Jess = Jessie Creek, Musk = Muskeg River
Hatcherypopulations
Muskeg
Axis 1 (21.7%)
Axi
s 2
(12.
7%)
Axis 3 (8.4%)
“A” (allotherlocalities)
“D”
“B”
“C”
Columbia andKootenay rivers
Queen CharlotteIslands
Upper Fraser River
40
34
39
38
3615
Fig. 2 Plots of mean factorial correspondence analysis (FCA) scores
for each sample of western Alberta rainbow trout (Oncorhynchus
mykiss) assayed for variation at 10 microsatellite loci. Populations
with no history of stocking are shown as circles, those with histories
of stocking by squares, hatchery populations used in the Alberta
stocking program as gray triangles. Rainbow trout and steelhead
(underlined) populations from British Columbia are shown as
diamonds. Four general groupings of populations are denoted by
‘‘A’’ – ‘‘D’’ (see text for details). Only those populations grouping
away from the main cluster of Alberta populations (‘‘A’’) are denoted
by locality numbers defined in Fig. 1. The percentage of the total
variation in allele frequencies explained by each FCA axis is shown
along each axis
Conserv Genet (2007) 8:1–15 9
123
increased the among group component of variation slightly
to 13.8% (P < 0.001). By contrast, when ‘‘non-Athabasca’’
samples were further subdivided into their component
contemporary drainages (Columbia River, Fraser River,
Queen Charlotte Islands) and compared to Athabascan
populations a greater percentage of among group variation
was resolved (23.4%, P < 0.001). Finally, within the Al-
berta populations only, 12.6% of the microsatellite varia-
tion was attributable to differences among the Athabasca
River mainstem, McLeod River, and Wildhay/Berland
River systems (Table 4, P < 0.001).
Classification of individual fish
We observed excellent discrimination between wild-col-
lected and hatchery rainbow trout as all but four of the 416
learning sample fish were correctly self-assigned (99.5%).
Three wild-collected, non-stocked rainbow trout were as-
signed to the hatchery sample (two from Wampus Creek
and one from Emerson Creek) and one hatchery fish was
assigned to a wild population (to Cabin Creek). When all of
the wild-collected, stocked and non-stocked rainbow trout
from Alberta were examined (N = 613 fish), all but four
(0.65%) were assigned to their sample population, or an-
other wild-collected population rather than to any of the
hatchery samples. The four fish assigned to a hatchery
population were all collected from lakes; three from Har-
vey Lake (posterior probability of hatchery origin >0.90)
and one from Rainbow Lake (posterior probability of
hatchery origin = 1.0). We also assigned all wild-collected
fish from populations that had experienced some hatchery
supplementation to either ‘‘native’’ (all wild-collected fish
from localities that had experienced no known hatchery
introductions) or ‘‘hatchery’’ groups. In this case, 80 of the
367 (22%) rainbow trout from localities subject to some
supplementation were assigned to the hatchery grouping.
The fish classified as hatchery fish included all those from
Harvey Lake and the one fish from Rainbow Lake. In
addition, two fish from Wabasso Creek (4.8% of all fish
from Wabasso Creek), 13 from Lac Beauvert (41%), 17
from Cottonwood Creek (43%), and 11 fish from the
Muskeg River (65%) were assigned to the hatchery group.
In addition, when we applied the more stringent exclusion
criterion, all 80 of these ‘‘hatchery assigned’’ fish were
excluded as being indigenous (P < 0.05; i.e., we had a 5%
chance of erroneously excluding any individual from the
indigenous group). By contrast, only 73 fish of the wild-
collected fish from hatchery-supplemented localities could
be excluded as hatchery fish or their recent descendants at a
confidence level of 0.05.
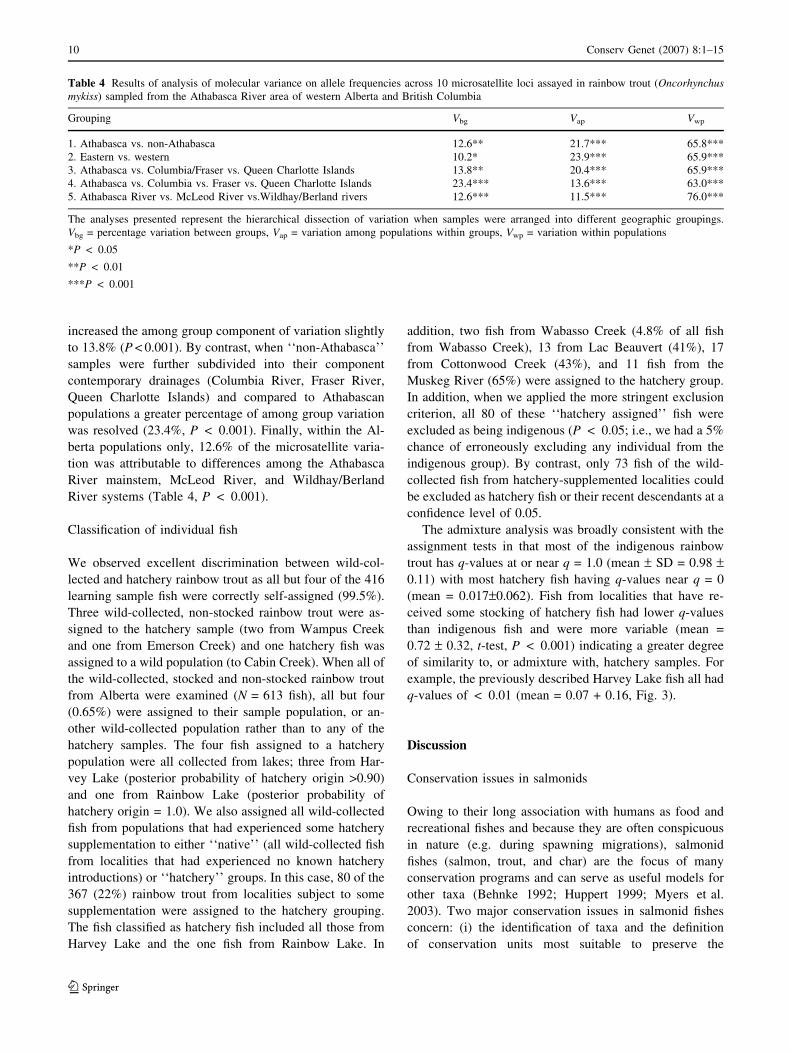
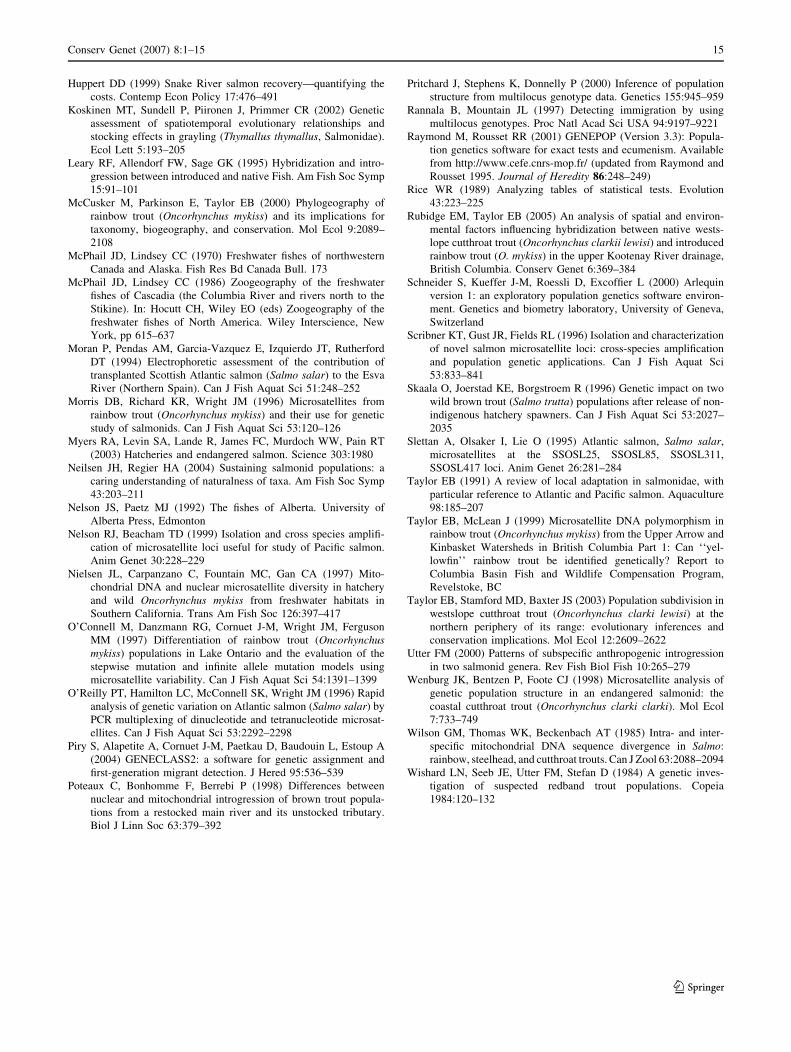
The admixture analysis was broadly consistent with the
assignment tests in that most of the indigenous rainbow
trout has q-values at or near q = 1.0 (mean – SD = 0.98 –0.11) with most hatchery fish having q-values near q = 0
(mean = 0.017–0.062). Fish from localities that have re-
ceived some stocking of hatchery fish had lower q-values
than indigenous fish and were more variable (mean =
0.72 – 0.32, t-test, P < 0.001) indicating a greater degree
of similarity to, or admixture with, hatchery samples. For
example, the previously described Harvey Lake fish all had
q-values of < 0.01 (mean = 0.07 + 0.16, Fig. 3).
Discussion
Conservation issues in salmonids
Owing to their long association with humans as food and
recreational fishes and because they are often conspicuous
in nature (e.g. during spawning migrations), salmonid
fishes (salmon, trout, and char) are the focus of many
conservation programs and can serve as useful models for
other taxa (Behnke 1992; Huppert 1999; Myers et al.
2003). Two major conservation issues in salmonid fishes
concern: (i) the identification of taxa and the definition
of conservation units most suitable to preserve the
Table 4 Results of analysis of molecular variance on allele frequencies across 10 microsatellite loci assayed in rainbow trout (Oncorhynchus
mykiss) sampled from the Athabasca River area of western Alberta and British Columbia
Grouping Vbg Vap Vwp
1. Athabasca vs. non-Athabasca 12.6** 21.7*** 65.8***
2. Eastern vs. western 10.2* 23.9*** 65.9***
3. Athabasca vs. Columbia/Fraser vs. Queen Charlotte Islands 13.8** 20.4*** 65.9***
4. Athabasca vs. Columbia vs. Fraser vs. Queen Charlotte Islands 23.4*** 13.6*** 63.0***
5. Athabasca River vs. McLeod River vs.Wildhay/Berland rivers 12.6*** 11.5*** 76.0***
The analyses presented represent the hierarchical dissection of variation when samples were arranged into different geographic groupings.
Vbg = percentage variation between groups, Vap = variation among populations within groups, Vwp = variation within populations
*P < 0.05
**P < 0.01
***P < 0.001
10 Conserv Genet (2007) 8:1–15
123
evolutionary legacy and potential of the group, and (ii)
the potential impacts of hatchery supplementation on the
persistence of native gene pools (see review by Allendorf
and Waples 1996). Both of these issues have a long
history of study in rainbow trout, Oncorhynchus mykiss
(reviewed in Behnke 1992). Our results are directly rel-
evant both aspects of the diversity of rainbow trout; the
distinctiveness of the ‘‘Athabasca’’ rainbow trout relative
to the other forms of O. mykiss, and the genetic integrity
of native gene pools in the Athabasca River drainage of
western Alberta. Behnke (1992) considered rainbow trout
native to the Athabasca River system to be representatives
of the Columbia River ‘‘redband trout’’ O. m. gairdneri
that had come to colonize the Athabasca River by way of
postglacial dispersal from temporary connections between
upper Columbia, Fraser, and Athabasca rivers (see also
McPhail and Lindsey 1970, 1986; Nelson and Paetz
1992). This view, however, was challenged by Carl et al.
(1994) who presented morphological and allozyme data
that showed that fish sampled from Wampus Creek in
Alberta were highly distinctive from samples of trout
from the upper Columbia River. These authors used these
data to suggest that the extant Athabasca River rainbow
trout were preglacial in origin, stemming from isolation
beginning at least 65,000 years ago in a glacial refuge,
the southwestern Alberta refuge, that was independent
from the Columbia (or Pacific) refuge (Carl et al. 1994).
McCusker et al. (2000), however, provided mtDNA data
and marshaled arguments that supported the view of
Behnke (1992) and Nelson and Paetz (1992); i.e., that
Athabasca River rainbow trout were post-Wisconsinan
colonists. Our current data provide strong substantiation
of the conclusions of Behnke (1992) and McCusker et al.
(2000). Our multilocus microsatellite DNA analysis
showed that multiple populations of Athabasca rainbow
trout were very similar to nearby Fraser River populations
(from which Athabasca River trout are though to have
been derived). In addition, a hierarchical analysis of mi-
crosatellite diversity showed that the greatest amount of
among group variation was accounted for when popula-
tions were arranged in contemporary watershed groupings
rather than in a grouping reflecting a putative separate
southwestern Alberta glacial refuge. Our conclusion that
Athabasca River rainbow trout do not represent preglacial
relict populations is also consistent with the zoogeography
of the species. The putative southwestern Alberta refuge
extended well south into the South Saskatchewan River
basin, yet rainbow trout are not native to this drainage.
This drainage, however, is clearly suitable for salmonids
as evidenced by the presence of westslope cutthroat trout,
O. clarkii lewisi, and bull trout, Salvelinus confluentus
(Nelson and Paetz 1992).
Fish number
Adm
ixtu
re c
oeff
icie
nt, q
Harvey Lake
0
0.1
0.2
0.3
0.4
0.5
0.6
0.7
0.8
0.9
1
1 29 57 85 113 141 169 197 225 253 281 309 337 365 393 421 449 477 505 533 561 589
Fig. 3 Posterior distribution of admixture coefficients, q, for
individual wild-collected rainbow trout (Oncorhynchus mykiss)
assayed with 10 microsatellite loci. Non-stocked fish (left of the
vertical arrow) are those that have no history of hatchery supple-
mentation, stocked samples (right of the arrow) are those subject to
hatchery supplementation. Each fish is represented by a thin, black
vertical line. Each such line represents the proportion of an
individual’s genotype that is derived from indigenous trout (black
portion) or hatchery trout (white portion). A q-value of 1.0 indicates a
pure indigenous rainbow trout genotype and a q-value of 0.0 indicates
a pure hatchery genotype
Conserv Genet (2007) 8:1–15 11
123
The postglacial origin of Athabasca River rainbow
trout does not necessarily reduce their importance to
conservation. For instance, the Athabasca River assem-
blage of populations is one of only three such assem-
blages (the others being those in the headwaters of the
Peace and Liard rivers) that occupy rivers the drain
the east slopes of the Rocky Mountains and flow to the
Arctic watershed (Behnke 1992). In addition, the
Athabasca River populations have by far the more
extensive distributions within these eastward-flowing
drainages (McPhail and Lindsey 1970; Behnke 1992).
Consequently, the Athabasca River rainbow trout are
found in the ‘‘Western Arctic’’ freshwater aquatic eco-
regions in Canada, one of 14 such ecoregions recognized
by the Committee on the Status of Endangered Wildlife
in Canada (COSEWIC 2004). Occupancy in distinctive
biogeographic regions is one of the criteria used to
establish ‘‘designatable units’’ (at or below the species
level) for conservation status review and potential listing
under Canada’s Species at Risk Act (COSEWIC 2004).
By this criterion alone, Athabasca River rainbow trout
warrant separate assessment of conservation status in
Canada.
Average expected heterozygosities of 0.17 to 0.62 in
the wild-collected rainbow trout samples are consistent
with values reported for rainbow trout from other regions
in western Canada (Tamkee and Taylor, unpublished
data). The expected heterozygosities, however, were
generally lower than reported for anadromous steelhead
trout (Beacham et al. 1999; Heath et al. 2001; Hendry
et al. 2002). Of some note is the observation that Alberta
hatchery samples exhibited expected heterozygosities
almost twice that of indigenous and stocked populations.
Hatchery populations of salmonids often carry lower
levels of genetic variation than wild populations (e.g.
Nielsen et al. 1997). The enhanced variation in Alberta
hatchery samples, however, may stem from several donor
populations contributing to hatchery samples (e.g. Mt.
Lassen hatchery) and active cross breeding of different
strains by Alberta hatchery personnel (G. Sterling,
unpublished observations). Large numbers of deviations
from Hardy–Weinburg expectations in the hatchery
samples support the suggestion of mixed origins of
hatchery fish as they would not represent a single, ran-
domly mating population. Alternatively, deviations from
HW expectations in the hatchery samples could result
from selective breeding or differential survival among
families within the hatchery. These diversity data are the
first hint that stocking of fish into Alberta streams has
had little detectable influence on the genetic structure of
trout in the recipient streams; clearly stocked streams
more closely resemble indigenous streams in terms of
variation within samples.
Variation among samples
Microsatellite variation demonstrated considerable diver-
gence among the population samples analyzed. Pooled
across loci, all sample populations were highly divergent
from one another. The level of subdivisionðhÞ across these
populations averaged 0.31. This is considerably higher than
reported for rainbow trout introduced into Lake Ontario,
h ¼ 0:012 (O’Connell et al. 1997) and of 0.09 to 0.12 re-
ported for coastal cutthroat trout (Oncorhynchus clarkii
clarkii) for a similar number of loci and heterozygosity
levels (Wenburg et al. 1998). Interestingly, the h value of
0.21 when hatchery fish from Alberta were removed from
our analysis, is very similar to that reported among popu-
lations of wild rainbow trout collected from Arrow Lakes’
drainage in eastern BC rainbow trout, h ¼ 0:18, (Taylor
and McLean 1999), but somewhat lower than 0.39 for a
broader survey of populations across BC (Tamkee and
Taylor, unpublished data), 0.33 reported for bull trout and
0.32 for westslope cutthroat trout (Costello et al. 2003;
Taylor et al. 2003). The higher h values in these latter
studies probably stem from their wider geographic cover-
age and the fact that many of the populations examined
were isolated above upstream migration barriers (e.g.
Costello et al. 2003; Taylor et al. 2003). The relatively
high level of subdivision of the Alberta ‘‘stocked’’ popu-
lations of rainbow trout, and its similar value to that
reported for other native populations is the second indica-
tion that these western Alberta populations have not been
unduly ‘‘homogenized’’ by past stocking with hatchery
trout (cf. Wishard et al. 1984).
Individual classification and conservation implications
Our results strongly suggest that there has been little
detectable genetic introgression of hatchery rainbow trout
alleles into most of the Alberta populations that have
received introductions of hatchery fish. Allele frequencies
were markedly different between stocked and hatchery
samples, stocked samples more closely resembled indige-
nous trout, and over 99% of the wild-collected trout that
had experienced no known hatchery supplementation were
assigned as ‘‘native’’ trout. By contrast, up to 21% of wild-
collected trout that had experienced some hatchery sup-
plementation were assigned to the ‘‘hatchery’’ group rather
than the ‘‘native’’ grouping. Almost half of these fish (37/
80) came from lake populations, Harvey and Rainbow
lakes, and all of the Harvey Lake fish (36) were assigned to
the hatchery category. Harvey Lake was fishless before it
was stocked between 1962 and 1967 and our data indicate
that a self-sustaining population has become established in
the lake. Only two streams, Cottonwood Creek and Muskeg
12 Conserv Genet (2007) 8:1–15
123
River, had appreciable numbers of wild-collected trout
assigned to the hatchery grouping. Interestingly, Muskeg
River is part of the Smoky River drainage that has no
known indigenous populations of O. mykiss (G. Sterling,
unpublished data). The Muskeg River is, therefore, one of
the few localities in our survey that are known to have been
colonized by hatchery fish introduced into adjacent
watersheds. Although the river itself has not been supple-
mented, a complex of small lakes just upstream (Pierre
Greys Lakes) were stocked repeatedly beginning in 1970
and most recently in 2004 (G. Sterling, unpublished data).
Consequently, the presence of hatchery genotypes within
the Muskeg River samples probably stems from down-
stream dispersal of hatchery fish from these lake sources
(cf. Rubidge and Taylor 2005). Further, Harvey Lake is
connected to the mainstem Athabasca River via about
30 km of the Snaring River and could provide a conduit for
hatchery alleles to spread to downstream native popula-
tions.
Effects of introductions of hatchery fish on native fish
in other species have been variable (Leary et al. 1995;
Utter 2000). Clear cases of genetic introgression have
been documented in cutthroat trout when one subspecies
has been introduced into the geographic range of another
(e.g. westslope cutthroat trout and Yellowstone cutthroat
trout, O. c. bouvieri, hybrid swarms) (Leary et al. 1995).
In addition, populations of steelhead trout in California,
Oregon, and Washington State tend to show less genetic
population subdivision than do populations in British
Columbia, an effect attributed to greater homogenization
from hatchery transplantation in the American states
(Leary et al. 1995). A similar scenario has been offered to
explain low levels of genetic differentiation among chi-
nook salmon (O. tshawytscha) in certain California
watersheds (Bartley and Gall 1990). On the other hand,
there are several studies that have demonstrated little or
no introgression of hatchery alleles into indigenous pop-
ulations after stocking, particularly for European salmonid
populations (e.g. Moran et al. 1994; Hansen et al. 1995).
Wishard et al. (1984) also indicated that introgression
between inland and introduced coastal forms of rainbow
trout has not occurred in areas of southern Idaho. There
are instances where natural selection against hybrids
(between indigenous and hatchery salmonids) appears to
limit the extent of introgression of hatchery alleles into
indigenous populations (e.g. Wishard et al. 1984; Chilcote
et al. 1986; Skaala et al. 1996; Poteaux et al. 1998). This
could certainly be occurring in western Alberta if hatch-
ery populations originate from trout collected from other
geographic areas (e.g. Mt. Lassen hatchery population). It
is also possible that introgression of hatchery alleles may
be limited by higher angling mortality suffered by
hatchery trout (e.g. Garcia-Marin et al. 1998). Freshwater
resident salmonids appear to be more susceptible to
introgression of hatchery alleles than anadromous fish
(Hansen et al. 2000; Utter 2000). Despite this general-
ization, most Alberta populations of rainbow trout in
stream habitats appear to have been little affected by
hatchery introductions, at least in terms of genetic struc-
ture. By contrast, the greatest concentration of hatchery
genotypes was found in a formerly fishless lake popula-
tion (e.g. Harvey Lake) or in stream populations directly
downstream of stocked, lake habitats (Muskeg River).
Our data, therefore, suggest that even within freshwater
habitats, lake and adjacent stream habitats ecosystems
may be more susceptible to naturalization of hatchery
genotypes than spatially more complex stream habitats,
particularly when they previously contained no indige-
nous populations of rainbow trout.
A further factor to consider is the time that has elapsed
since the most recent introduction. Most of the stocking of
rainbow trout in Alberta occurred from the 1920–1960s
with little or no hatchery input subsequently, at least in
streams (stocking still occurs annually in many isolated
lake habitats). The only exceptions were Canyon Creek
(Athabasca River), Rainbow Lake (Wildhay/Berland), and
Pierre Greys Lakes/Muskeg River (2004) which received
hatchery introductions in 1985–1988 and 1985–1997, and
2004, respectively. Consequently, in most stocked streams,
there has been considerable opportunity over 30–80 years
for natural selection, or immigration from nearby indige-
nous populations, to eliminate hatchery genotypes in these
streams. It is possible, however, that the hatchery samples
that we analyzed (collected in 2000, 2004) are not repre-
sentative, genetically, of the hatchery fish that were stocked
into Alberta streams prior to 2000. This would make dis-
crimination of hatchery and indigenous fish more difficult
and could mean that some introgression of hatchery alleles
into stocked populations could have occurred and be
undetected by us. Three observations, however, make this
potential complication unlikely. First, the clear evidence of
the poor survival performance of hatchery fish in other
species and areas in nature (see above), reduces the like-
lihood of geographically widespread and sustained intro-
gression of hatchery alleles. Second, the clear similarity of
Harvey Lake trout, which was last stocked in 1967, with
our 2000–2004 hatchery samples suggests that the latter are
broadly representative of historical hatchery genotypes that
were used to stock Harvey Lake and other habitats in the
study area. Finally, the vast majority of fish used for
stocking into Alberta (including those used to stock at least
19 of our 23 ‘‘stocked’’ populations) stem from the US-
derived hatchery populations that we sampled (Alberta
stocking records, unpublished data).
In conclusion, our multilocus microsatellite analysis
indicates that Athabasca rainbow trout are most likely of
Conserv Genet (2007) 8:1–15 13
123
postglacial origin and do not represent preglacial relicts. In
addition, except in a few localities we found little to no
influence of past stocking of hatchery rainbow trout on the
genetic diversity or structure of native populations; the
latter are very similar to indigenous trout with no record of
past stocking. These results strongly suggest that native
Alberta trout gene pools have persisted, in spite of past
stocking with genetically divergent populations. Increased
efforts to conserve these native gene pools should be made
as they are the genotypes most likely to persist in local
environments (Taylor 1991). Finally, our analyses suggest
that hatchery trout do not survive well in western Alberta
streams at least when exotic populations are used as
hatchery broodstock. This result calls into question of
efficacy of hatchery introductions as a long-term popula-
tion management technique, at least for stream and river
samples. Efforts and resources may be better directed to-
wards effective habitat and fishery regulation management
to better conserve Alberta’s native rainbow trout. If,
however, hatchery supplementation is to continue in Al-
berta streams, our results, and those for studies of salmo-
nids in general (Reisenbichler 1988; Taylor 1991), strongly
suggest that the use of indigenous populations for artificial
propagation and introductions would result in higher sur-
vival of hatchery fish.
Acknowledgements Funding for this project was provided by the
Alberta Sustainable Resources, Fish and Wildlife Division, and Parks
Canada. We appreciate the assistance of the Spatial Data Warehouse
in Edmonton, Alberta, for information used to create Figure 1.
References
Allendorf FW, Waples RS (1996) Conservation and genetics of sal-
monid fishes. In: Avise JC, Hamrick JL (eds) Conservation
genetics. Case histories from nature, Chapman Hall, New York,
pp 238–280
Allendorf FW, Leary RF, Spruell P, Wenburg JK (2001) The pro-
blems with hybrids: setting conservation guidelines. Trends Ecol
Evol 16:613–620
Allendorf FW, Leary RF, Hitt NP, Knudsen KL, Boyer MC, Spruell P
(2005) Cutthroat trout hybridization and the U.S. Endangered
Species Act: one species, two policies. Conserv Biol 19:1326–
1328
Bartley DM, Gall GA (1990) Genetic population structure and gene
flow in chinook salmon populations of California. Trans Am
Fish Soc 119:55–71
Banks MA, Blouin MS, Baldwin BA, Rashbrook VK, Fitzgerald HA,
Blakenship SM, Hedgecock D (1999) Isolation and inheritance
of novel microsatellites in chinook salmon (Oncorhynchus
tshawytscha). J Heredity 90:281–288
Beacham TD, Pollard S, Le KD (1999) Population structure and stock
identification of steelhead in southern British Columbia, Wash-
ington, and the Columbia River based on microsatellite DNA
variation. Trans Am Fish Soc 128:1068–1084
Belkhir K, Borsa P, Chikhi N, Raufaste N, Bonhomme F (2001)
GENETIX 4.02, logiciel sous Windows TM pour la genetique
des populations. in. Laboratoire Genome, Populations, Interac-
tions, CNRS UMR 5000, Universite de Montpellier II, Mont-
pellier, France
Behnke RJ (1992) Native trout of Western North America. American
Fisheries Society, Bethesda, MD
Campton DE, Kaeding LR (2005) Westslope cutthroat trout,
hybridization, and the U.S. Endangered Species Act. Conserv
Biol 14:1323–1325
Carl LM, Hunt C, Ihssen PE (1994) Rainbow trout of the Athabasca
River, Alberta: A unique population. Trans Am Fish Soc
123:129–140
Chilcote MW, Leider SA, Loch JJ (1986) Differential reproductive
success of hatchery and wild summer-run steelhead under natural
conditions. Trans Am Fish Soc 115:726–735
Cornuet JM, Piry S, Luikart G, Estoup A, Solignac M (1999) New
methods employing multilocus genotypes to select or exclude
populations as origins of individuals. Genetics 153:1989–2000
COSEWIC (2004) Guidelines for recognizing designatable units
below the species level. Committee on the Status of Endangered
Wildlife in Canada, c/o Canadian Wildlife Service, Environment
Canada, Ottawa, Ontario K1A 0H3
Costello AB, Down T, Pollard S, Pacas CJ, Taylor EB (2003) The
influence of history and contemporary stream hydrology on the
evolution of genetic diversity within species: an examination of
microsatellite DNA variation in bull trout, Salvelinus confluentus
(Pisces: Salmonidae). Evolution 57:328–344
Crandall KA, Bininda-Emonds ORP, Mace GM, Wayne RK (2000)
Conservation biologists assign population distinctiveness by
classifying populations. Trends Ecol Evol 15:290–295
Excoffier L, Smouse P, Quattro JM (1992) Analysis of molecular
variance inferred from metric distances among DNA haplotypes:
application to human mitochondrial DNA restriction data.
Genetics 131:479–491
Frankham R, Ballou JD, Briscoe DA (2002) Introduction to conser-
vation genetics. Cambridge University Press, Cambridge
Gaggiotti OE, Lange O, Rassmann K, Gliddon C (1999) A compar-
ison of two indirect methods for estimating levels of gene flow
from microsatellite data. Mol Ecol 8:1513–1520
Garcia-Marin JL, Sanz N, Pla C (1998) Proportions of native and
introduced brown trout in adjacent fished and unfished Spanish
rivers. Conserv Biol 12:313–319
Goudet J (2001). FSTAT version 2.9.3.1 Updated from Goudet J.
1995. J. Heredity, 86: 485–486
Hansen MM, Hynes RA, Loeschcke V, Rasmussen G (1995)
Assessment of the stocked or wild origin of anadromous brown
trout (Salmo trutta L.) in a Danish river system, using mito-
chondrial DNA RFLP analysis. Mol Ecol 4:189–198
Hansen MM, Ruzzante ED, Nielsen EE, Mensberg DK (2000)
Microsatellite and mitochondrial DNA polymorphism reveals
life-history dependent interbreeding between hatchery and wild
brown trout (Salmo trutta L.). Mol Ecol 9:583–594
Hansen MM, Kenchington E, Nielsen EE (2001) Assigning individual
fish to populations using microsatellite DNA markers. Fish Fish.
2:93–112
Heath DD, Pollard S, Herbinger C (2001) Genetic structure and
relationships among steelhead trout (Oncorhynchus mykiss)
populations in British Columbia. Heredity 86:618–627
Hendry MA, Wenburg JK, Myers KW, Hendry AP (2002) Genetic
and phenotypic variation through the migratory season provides
evidence for multiple populations of wild steelhead in the Dean
River, British Columbia. Trans Am Fish Soc 131:418–434
14 Conserv Genet (2007) 8:1–15
123
Huppert DD (1999) Snake River salmon recovery—quantifying the
costs. Contemp Econ Policy 17:476–491
Koskinen MT, Sundell P, Piironen J, Primmer CR (2002) Genetic
assessment of spatiotemporal evolutionary relationships and
stocking effects in grayling (Thymallus thymallus, Salmonidae).
Ecol Lett 5:193–205
Leary RF, Allendorf FW, Sage GK (1995) Hybridization and intro-
gression between introduced and native Fish. Am Fish Soc Symp
15:91–101
McCusker M, Parkinson E, Taylor EB (2000) Phylogeography of
rainbow trout (Oncorhynchus mykiss) and its implications for
taxonomy, biogeography, and conservation. Mol Ecol 9:2089–
2108
McPhail JD, Lindsey CC (1970) Freshwater fishes of northwestern
Canada and Alaska. Fish Res Bd Canada Bull. 173
McPhail JD, Lindsey CC (1986) Zoogeography of the freshwater
fishes of Cascadia (the Columbia River and rivers north to the
Stikine). In: Hocutt CH, Wiley EO (eds) Zoogeography of the
freshwater fishes of North America. Wiley Interscience, New
York, pp 615–637
Moran P, Pendas AM, Garcia-Vazquez E, Izquierdo JT, Rutherford
DT (1994) Electrophoretic assessment of the contribution of
transplanted Scottish Atlantic salmon (Salmo salar) to the Esva
River (Northern Spain). Can J Fish Aquat Sci 51:248–252
Morris DB, Richard KR, Wright JM (1996) Microsatellites from
rainbow trout (Oncorhynchus mykiss) and their use for genetic
study of salmonids. Can J Fish Aquat Sci 53:120–126
Myers RA, Levin SA, Lande R, James FC, Murdoch WW, Pain RT
(2003) Hatcheries and endangered salmon. Science 303:1980
Neilsen JH, Regier HA (2004) Sustaining salmonid populations: a
caring understanding of naturalness of taxa. Am Fish Soc Symp
43:203–211
Nelson JS, Paetz MJ (1992) The fishes of Alberta. University of
Alberta Press, Edmonton
Nelson RJ, Beacham TD (1999) Isolation and cross species amplifi-
cation of microsatellite loci useful for study of Pacific salmon.
Anim Genet 30:228–229
Nielsen JL, Carpanzano C, Fountain MC, Gan CA (1997) Mito-
chondrial DNA and nuclear microsatellite diversity in hatchery
and wild Oncorhynchus mykiss from freshwater habitats in
Southern California. Trans Am Fish Soc 126:397–417
O’Connell M, Danzmann RG, Cornuet J-M, Wright JM, Ferguson
MM (1997) Differentiation of rainbow trout (Oncorhynchus
mykiss) populations in Lake Ontario and the evaluation of the
stepwise mutation and infinite allele mutation models using
microsatellite variability. Can J Fish Aquat Sci 54:1391–1399
O’Reilly PT, Hamilton LC, McConnell SK, Wright JM (1996) Rapid
analysis of genetic variation on Atlantic salmon (Salmo salar) by
PCR multiplexing of dinucleotide and tetranucleotide microsat-
ellites. Can J Fish Aquat Sci 53:2292–2298
Piry S, Alapetite A, Cornuet J-M, Paetkau D, Baudouin L, Estoup A
(2004) GENECLASS2: a software for genetic assignment and
first-generation migrant detection. J Hered 95:536–539
Poteaux C, Bonhomme F, Berrebi P (1998) Differences between
nuclear and mitochondrial introgression of brown trout popula-
tions from a restocked main river and its unstocked tributary.
Biol J Linn Soc 63:379–392
Pritchard J, Stephens K, Donnelly P (2000) Inference of population
structure from multilocus genotype data. Genetics 155:945–959
Rannala B, Mountain JL (1997) Detecting immigration by using
multilocus genotypes. Proc Natl Acad Sci USA 94:9197–9221
Raymond M, Rousset RR (2001) GENEPOP (Version 3.3): Popula-
tion genetics software for exact tests and ecumenism. Available
from http://www.cefe.cnrs-mop.fr/ (updated from Raymond and
Rousset 1995. Journal of Heredity 86:248–249)
Rice WR (1989) Analyzing tables of statistical tests. Evolution
43:223–225
Rubidge EM, Taylor EB (2005) An analysis of spatial and environ-
mental factors influencing hybridization between native wests-
lope cutthroat trout (Oncorhynchus clarkii lewisi) and introduced
rainbow trout (O. mykiss) in the upper Kootenay River drainage,
British Columbia. Conserv Genet 6:369–384
Schneider S, Kueffer J-M, Roessli D, Excoffier L (2000) Arlequin
version 1: an exploratory population genetics software environ-
ment. Genetics and biometry laboratory, University of Geneva,
Switzerland
Scribner KT, Gust JR, Fields RL (1996) Isolation and characterization
of novel salmon microsatellite loci: cross-species amplification
and population genetic applications. Can J Fish Aquat Sci
53:833–841
Skaala O, Joerstad KE, Borgstroem R (1996) Genetic impact on two
wild brown trout (Salmo trutta) populations after release of non-
indigenous hatchery spawners. Can J Fish Aquat Sci 53:2027–
2035
Slettan A, Olsaker I, Lie O (1995) Atlantic salmon, Salmo salar,
microsatellites at the SSOSL25, SSOSL85, SSOSL311,
SSOSL417 loci. Anim Genet 26:281–284
Taylor EB (1991) A review of local adaptation in salmonidae, with
particular reference to Atlantic and Pacific salmon. Aquaculture
98:185–207
Taylor EB, McLean J (1999) Microsatellite DNA polymorphism in
rainbow trout (Oncorhynchus mykiss) from the Upper Arrow and
Kinbasket Watersheds in British Columbia Part 1: Can ‘‘yel-
lowfin’’ rainbow trout be identified genetically? Report to
Columbia Basin Fish and Wildlife Compensation Program,
Revelstoke, BC
Taylor EB, Stamford MD, Baxter JS (2003) Population subdivision in
westslope cutthroat trout (Oncorhynchus clarki lewisi) at the
northern periphery of its range: evolutionary inferences and
conservation implications. Mol Ecol 12:2609–2622
Utter FM (2000) Patterns of subspecific anthropogenic introgression
in two salmonid genera. Rev Fish Biol Fish 10:265–279
Wenburg JK, Bentzen P, Foote CJ (1998) Microsatellite analysis of
genetic population structure in an endangered salmonid: the
coastal cutthroat trout (Oncorhynchus clarki clarki). Mol Ecol
7:733–749
Wilson GM, Thomas WK, Beckenbach AT (1985) Intra- and inter-
specific mitochondrial DNA sequence divergence in Salmo:
rainbow, steelhead, and cutthroat trouts. Can J Zool 63:2088–2094
Wishard LN, Seeb JE, Utter FM, Stefan D (1984) A genetic inves-
tigation of suspected redband trout populations. Copeia
1984:120–132
Conserv Genet (2007) 8:1–15 15
123