microgrids for disaster preparedness and recovery - iec.ch · microgrids for disaster preparedness...
TRANSCRIPT

Microgrids for disaster preparedness and recovery With electricity continuity plans and systems
®
White Paper

3
Despite the best efforts of electricity grid planners
and operators, the number of major electrical
blackouts around the world is growing year on
year, whether caused by natural disaster or human
triggered events. These blackouts often come at
incredible cost to businesses and society at large –
the recent Great East Japan Earthquake left up to
8 million people without power for over 10 days, and
a cascading failure in 2012 in India left more than
9 % of the world’s population without electricity.
This White Paper considers preparation for, and
recovering from, major electricity outages, with
a focus on measures at the customer side of the
electricity system. It is the fourth in a series of White
Papers by the IEC MSB (Market Strategy Board),
whose purpose is to ensure the IEC International
Standards and Conformity Assessment services
continue to contribute to solving global issues in
electrotechnology.
Section 2 starts with a historical review of recent
major electrical outages around the world. Out of a
wide range of case studies, a key fi nding is that the
centralized nature of power systems often means
a relatively small amount of damage can cause
extensive power outages. Whilst some electricity
grids contain signifi cant amounts of distributed
generation, from roof-top solar systems to diesel
back-up generators, often such systems were
unable to operate following a major disaster, due
to regulations restricting their operation when the
wider power system had failed, or outside impacts
such as a lack of fuel due to road blockages limiting
re-supply trucks.
Section 3 focuses on planning for disasters, and
the recovery from electrical outages. This section
introduces BCP (business continuity planning), ECP
(electricity continuity planning) and ECS (electricity
continuity system) as some of the solutions for
disaster recovery, while examining how to verify the
effectiveness of planning for electric continuity in
the aftermath of disasters. The aim of this section is
not to provide solutions to the particular challenges
involved – an effort that will necessarily require
the combined input of numerous organizations.
Instead various broad concepts are introduced
indicating how disaster preparedness and post-
disaster recovery may benefi t from standards and
the design of plans for coordinated activity.
Section 4 offers an assessment of recent examples
around facilities in Japan that maintained supply
after major disaster, and refers to this as a “best
practice” case. This ties together the microgrid
section with the earlier planning sections. The
studies include the Sendai microgrid in Japan, data
centres, the Roppongi Hills (Tokyo) microgrid and
an example from a Smart Energy home in Saitama,
Japan. These examples from the Great East Japan
Earthquake, reveal a number of microgrids, from
supplying university campuses to single homes,
were able to maintain supply even though the
surrounding electricity network was inoperable
for many days. Also examined are post evaluative
references to telecommunication systems, medical
facilities and semiconductor production facilities.
Section 5 explains that microgrids are a solution to
many of the issues identifi ed in the disaster review.
A microgrid is a collection of controllable and
physically close generators, managed in careful
collaboration with local loads. By relying on a variety
of generators, a microgrid system avoids many of
the single-point-of-failure issues of the traditional
electricity grid. Similarly, by closely managing local
supply and demand, the microgrid can ensure that
essential services are met, despite constraints that
may exist on electricity supply. Whilst often viewed
Executive summary
4
Acknowledgments
Executive summary
as a means of encouraging the uptake of renewable
energy, or addressing challenges of peak demand,
microgrids can make a signifi cant contribution to
helping with disaster preparedness and recovery.
Section 6 talks about the penetration of microgrids
and the fundamental challenges that need to be
addressed before they become commonplace.
Microgrids are not without their challenges, both
technical and non-technical, and this White Paper
considers a wide range of issues limiting microgrid
uptake, from regulatory barriers to the deployment
of distributed generation, to the technical challenges
of operating a microgrid with a large amount of
renewable energy.
Finally, Section 7 concludes with a number of key
recommendations for industry, regulators, and
standards organizations that should improve the
preparation for, and recovery from, major disasters
or electricity supply interruptions. Key suggestions
are around encouraging the uptake and operation of
microgrids, and, separately, implementing standards
to assist the planning of disaster relief, and the
comparison of these plans across different sites.
This White Paper has been prepared by the
microgrid disaster preparedness and recovery
project team, in the IEC Market Strategy Board.
The project team included representatives from
research institutions (AIST, CEPRI, CSIRO, NEDO),
electronic manufacturers and semiconductor
facilities (Mitsubishi, Panasonic), electrical
equipment manufacturers (ABB, Ansaldo Sistemi
Industriali, Eaton, Haier, NTT Facilities, Siemens),
and standardization agencies (IEC, UL), with a
major contribution from Dr. Glenn Platt, CSIRO,
Australia and Dr. Hirohisa Aki, AIST, Japan.

5
Table of contents
7
9
13
13
13
17
17
23
23
23
23
24
24
26
27
28
29
30
31
33
33
33
33
34
List of abbreviations
Glossary
Section 1 Introduction
1.1 Overview
1.2 Scope of this White Paper
Section 2 Review of disasters connected with electrical facilities
2.1 Analyzing previous disaster experiences
Section 3 Planning for disasters and post-disaster recovery
3.1 Quality of planning
3.2 Continuity planning
3.2.1 Business continuity planning
3.2.2 The effectiveness of business continuity planning following major disasters
3.3 Electricity continuity planning
3.3.1 Electricity continuity systems
3.3.2 Classifi cation of disasters
3.3.3 Classifi cation of facilities
3.3.4 Classifi cation of loads
3.4 Markets for electricity continuity systems
3.5 The consumer market of electricity continuity systems and disaster relief functions
Section 4 Post evaluation review of Japanese electrical facilities and
examples of best practice against disasters
4.1 General
4.2 Telecommunication systems
4.3 Medical facilities
4.4 Semiconductor production facilities

6
34
35
36
38
41
41
42
42
43
44
44
45
51
51
51
53
54
54
55
55
57
57
58
59
60
61
83
4.5 Data centres
4.6 Sendai microgrid
4.7 Roppongi Hills (Tokyo)
4.8 Smart energy system for residential dwellings
Section 5 Microgrids
5.1 General
5.2 Benefi ts of microgrids
5.2.1 To end users
5.2.2 To utilities/distribution companies
5.3 Microgrids for disaster relief
5.4 Microgrid associated technologies
5.5 Microgrids around the world
Section 6 Penetration of microgrids
6.1 Challenges and barriers
6.1.1 Technical challenges
6.1.2 Non-technical barriers
6.2 Future trends
6.2.1 Virtual microgrids
6.2.2 Resource networks
6.2.3 Clustered microgrids
Section 7 Conclusion and recommendations
7.1 Conclusions
7.2 Recommendations for policy-makers and regulators
7.3 Recommendations for utilities, industry and researchers
7.4 Recommendations for the IEC and its committees
Annex A — Case studies
References
Table of contents
7
List of abbreviations
AC
CHP
BCP
DC
DER
ECP
ECS
EMS
HEMS
MDR
MV
PCC
PV
UPS
AIST
CEPRI
CSIRO
IEC
MSB
NEDO
TEPCO
UL
Technical and
scientifi c terms
Organizations,
institutions
and companies
Alternating current
Combined heat and power
Business continuity plan/planning
Direct current
Distributed energy resource
Electricity continuity plan/planning
Electricity continuity system
Energy management system
Home energy management system
Microgrids for disaster preparedness and recovery
Medium voltage
Point of common coupling
Photovoltaic
Uninterruptible power supply
National Institute of Advanced Industrial Science
and Technology (Japan)
China Electric Power Research Institute
CSIRO Commonwealth Scientifi c and Industrial
Research Organisation (Australia)
International Electrotechnical Commission
Market Strategy Board (of the IEC)
New Energy and Industrial Technology Development
Organization (Japan)
Tokyo Electric Power Company (Japan)
Underwriters Laboratories (USA)


9
anti-islanding
functionality in distributed generators preventing
them from supplying electricity during loss of the
wider electricity grid
NOTE A black-start is essentially a hard reset of
generation resources.
cascading failure
chain of successive failures on a power system
NOTE Cascading failures are often associated
with large, widespread system outages caused by
relatively small, obscure failures in one small part of
the network.
combined heat and power
CHP
servicing of both thermal and electrical loads from
a single generation source, thereby increasing the
energy effi ciency of that source
connected microgrid
microgrid that may be connected to the utility grid
NOTE A connected microgrid may operate as
a distinct island, but features a PCC that allows
interaction with the utility grid (most typically to
facilitate import/export of power).
demand management
active and dynamic control of electrical load
through technical means in order to manage issues
such as peak demand
distributed energy resource
DER
small-scale electrical load or generator (<1 MW)
distributed generation
electricity generation, often relatively small, located
close to the particular load to which it supplies
power
distribution
except when the standard dictionary defi nition
applies, transfer of electricity between transmission
supply points (typically substations) and individual
customers
embedded generation
see local generator/load
export
<in the context of this White Paper>, fl ow of
electrical power from the microgrid into the wider
electricity network
fl ywheel
energy storage device based on high-speed
rotating mass
fuel cell
energy conversion device that produces electricity
directly from an input fuel and oxidant, without the
combustion process of traditional reciprocating
engines
high voltage
any voltage between 69 kV and 230 kV or having a
value above a conventionally adopted limit
NOTE An example of high voltage is the set of
upper voltage values used in bulk power systems.
Glossary

10
import
<in the context of this White Paper>, when electrical
power fl ows from the wider electricity grid into the
microgrid
intentional islanding
deliberate separation of a set of generator resources
from the utility grid
intermittent
non-continuous
NOTE An intermittent generation source in and
of itself cannot provide a constant non-zero power
output over the long-term.
inverter
power-electronics device that converts direct-
current electricity to alternating-current electricity
islanding
separation of a set of generator resources from the
utility grid
NOTE The microgrid is islanded if it loses the PCC.
isolated microgrid
microgrid that is not electrically connected to the
utility grid
NOTE An isolated microgrid is a distinct island for
which no PCC exists.
load management
see demand management
load shedding
deliberate deactivation of electrical loads, typically
to prevent electrical network overload and outage
local generator
local load
generator/load installed on the microgrid
medium voltage
MV
any voltage between 2.4 kV and 34.5 kV or any set
of voltage levels lying between low and high voltage
NOTE 1 The boundaries between medium and
high voltage levels overlap and depend on local
circumstances and history or common usage.
Nevertheless the band 30 kV to 100 kV frequently
contains the accepted boundary.
NOTE 2 The term is not used in the UK or Australia
to refer to any voltage between 2.4 kV and 34.5 kV.
microturbine
small (<100 kW) low-emissions electricity generator
based on gas-turbine technology
microgrid
collection of controllable and physically proximate
distributed generator and load resources,
incorporating multiple sources of AC power, at
least one of which is based on a renewable energy
source
outage
period when an electricity generator, transmission
network or related resource is out of service
peak demand
maximum demand presented by an electrical load,
typically infrequently, as opposed to the average
demand of that load
penetration level
percentage contribution of power from a given
source
photovoltaics
PV
technology that converts energy from the sun
directly into electricity
Glossary

11
Glossary
point of common coupling
PCC
connection point between the utility grid and the
microgrid. A microgrid may have at most one point
of common coupling
supercapacitor
energy storage device that can provide large
amounts of power for very short periods of time,
with a longer lifecycle in this application than
traditional batteries
synchronization
match phase/instantaneous voltage across or
within systems
NOTE When returning from an island confi guration,
a microgrid must synchronize (often, resynchronize)
with the utility grid.
system stability
capacity of a system to remain functional despite
variation in operating conditions
NOTE An isolated microgrid displays stability if
variations, for instance in load, do not cause the
microgrid to shut down.
transmission
transfer of high-voltage electricity from where it is
generated to the point at which it is transformed
into a lower voltage for consumer supply
utility grid
wider grid
power network that resides beyond the control of
the microgrid
NOTE A utility grid may be connected to the
microgrid via a PCC or not at all.
virtual microgrid
microgrid where major components such as
generators are geographically distant


13
Section 1 Introduction
1.1 Overview
Whilst recent natural disasters such as the Great East
Japan Earthquake of 2011 caused horrifi c physical
damage and loss of life, they also demonstrated
the fragility of today’s electricity systems. Major
electricity outages around the world are growing
in number and scope, bringing signifi cant costs to
local industry and the community. In the case of
the recent Great East Japan Earthquake, over 8
million people were left without power, and it took
10 days to restore 95 % of the electricity supply to
these customers. Another example of a signifi cant
outage was in India in 2012, which left more than
620 million people, or approximately 9 % of the
world’s population without electricity.
In response to these recent large-scale power
outages, the IEC commissioned the present
White Paper with a view to examining how best to
maintain local electricity supplies after a large-scale
blackout.
This White Paper considers the complex challenges
involved in preparing for, and recovering from,
major electricity outages, with particular focus on
the “customer side” of the electricity system taken
from experiences of the 2011 earthquake in Japan.
The fi rst part of this White Paper considers non-
technical issues, with reference to large unknown
solutions between disasters and electric facilities;
in particular, the challenge of classifying disasters
and a facility’s preparedness for major outside
electricity and a facility’s ability to cope with various
magnitudes of power loss. Likewise the concept
of an ECS and ECP are introduced as a critical
precursor to ensuring a facility is best prepared to
manage electricity outages.
Based on real experience, examples are given
throughout the White Paper of best-practice
methods for:
Planning and assessing a facility’s response to
major disasters, and
Recovering from disasters
The use of new technologies such as microgrids
to improve the resilience of electricity supply
The White Paper’s principal focus is on one of the
most recent major developments facing the electrical
power industry: the concept of the “microgrid”.
Whilst often viewed as a means for encouraging
the uptake of renewable energy or for managing
peak demand challenges on the broader electricity
system, microgrids have particular characteristics
that can help with disaster preparedness and
recovery, and these are explored throughout this
White Paper.
1.2 Scope of this White Paper
This White Paper is the fourth in a series whose
purpose is to ensure that the IEC can continue to
contribute through its International Standards and
Conformity Assessment services to solving global
problems in electrotechnology. The White Papers
are developed by the IEC MSB, responsible for
analyzing and understanding the IEC’s market, so
as to help prepare the IEC to strategically face the
future.
In response to the signifi cant damage caused by
the Great East Japan Earthquake on the 11th March
2011, a discussion of disaster recovery approaches
was included in the IEC MSB meeting in Stockholm,

14
Sweden in June 2011. Following this, plans were put
together for a project examining the opportunities
and challenges microgrids may have for improving
resilience against large-scale electrical disasters,
or recovery from these. The proposal was based
on the methods of the “Technology and Market
Watch” special working group that published the
IEC White Papers in the Electrical Energy Effi ciency
and Electrical Energy Storage projects.
Market needs are most important to the
Microgrid for disaster recovery proposal, and new
technologies will be developed. Among these are
demand control, prioritization of loads, and further
innovation for saving and storing electricity. Societal
planning, investment in R&D, and standardization
are also essential as seen in Figure 1-1.
That is, for base technologies, safety functions are
required, and are a very important consideration in
standardization activities.
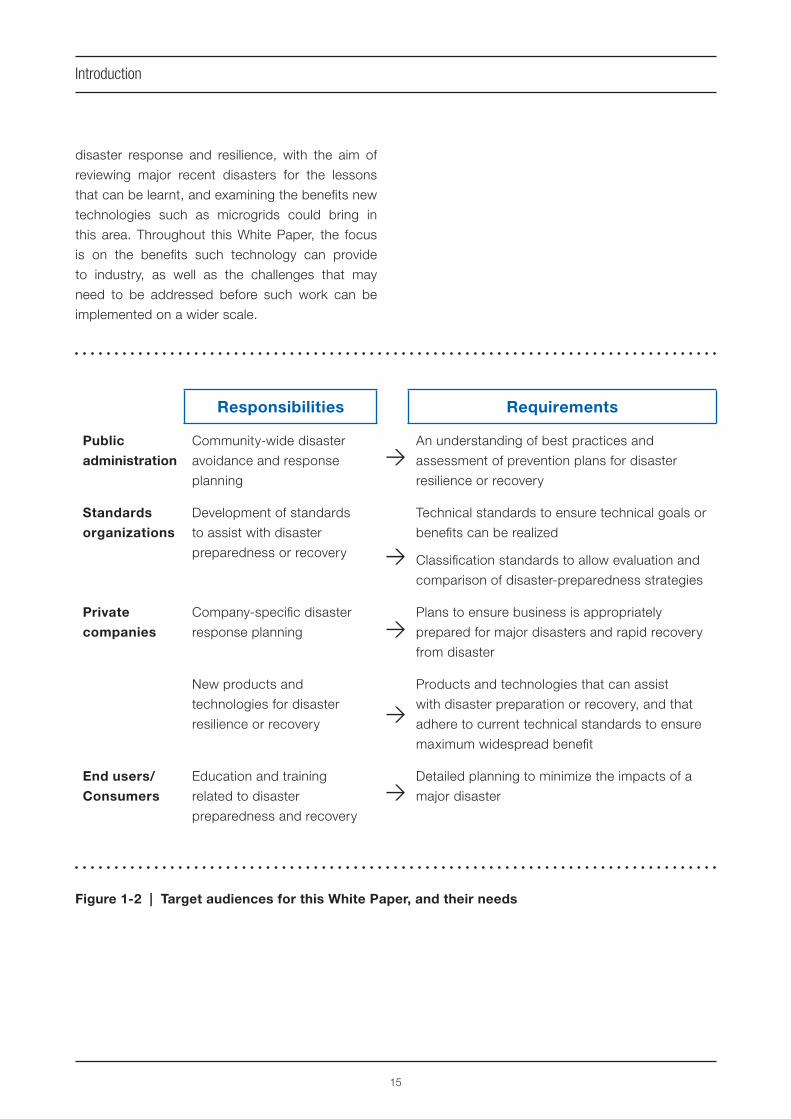
All levels of society have a part to play in preparing
for large-scale disasters and the subsequent
recovery. As shown in Figure 1-2 various actors,
ranging from public administrations to private
companies and the end user, have a role in the
planning of defences against major disasters and in
developing responses to ensure rapid restoration of
services. Consequently, this White Paper is aimed
at a wide-ranging audience – from those who
simply need to be aware of the latest technologies
available for maintaining electricity supply following
a major disaster, to the organizations charged with
developing the standards necessary to realize
these wider scale community benefi ts.
Improving the preparation and response to large-
scale electrical outages is a broad and diverse
area of activity, with efforts required in policy and
law, regulation, standardization, and technology
development. This project focussed on technical
measures that may be taken towards improving
Introduction
Grid blackout
Robust facilitiesand appliances
Microgrid
Recoveryfrom disaster
Most importantneeds
Needs of ECP fordisaster prevention
Police, law andregulation
Robustsmart grid
Technologies andforecast of
commercialization
MDR technologyreasonable price R&D
Recommendationfor
standardization
Saving electricitydemand control
Standardizationtime and
requirement
Recovery ofelectric power grid
Marketforecast
Enforcement ofelectricity facility
Policy for economicalincentives
Recommendation
Figure 1-1 | Needs of MDR from market viewpoint
15
Introduction
Responsibilities Requirements
Public
administration
Community-wide disaster
avoidance and response
planning
An understanding of best practices and
assessment of prevention plans for disaster
resilience or recovery
Standards
organizations
Development of standards
to assist with disaster
preparedness or recovery
Technical standards to ensure technical goals or
benefi ts can be realized
Classifi cation standards to allow evaluation and
comparison of disaster-preparedness strategies
Private
companies
Company-specifi c disaster
response planning
Plans to ensure business is appropriately
prepared for major disasters and rapid recovery
from disaster
New products and
technologies for disaster
resilience or recovery
Products and technologies that can assist
with disaster preparation or recovery, and that
adhere to current technical standards to ensure
maximum widespread benefi t
End users/
Consumers
Education and training
related to disaster
preparedness and recovery
Detailed planning to minimize the impacts of a
major disaster
Figure 1-2 | Target audiences for this White Paper, and their needs
disaster response and resilience, with the aim of
reviewing major recent disasters for the lessons
that can be learnt, and examining the benefi ts new
technologies such as microgrids could bring in
this area. Throughout this White Paper, the focus
is on the benefi ts such technology can provide
to industry, as well as the challenges that may
need to be addressed before such work can be
implemented on a wider scale.

17
Section 2Review of disasters connected with electrical facilities
2.1 Analyzing previous disaster
experiences
In considering the preparation for and effects of
widespread electrical disasters, it is worthwhile
reviewing recent major electricity outages: what
exactly occurred and how the electricity supply was
restored. Various nations have suffered enormous
damage from natural disasters in recent years:
The Great East Japan Earthquake on 11th March
2011 killed more than 15 000 people, destroyed
4 nuclear generation plants, and left several
million people without electricity
Numerous major industrial plants and business
facilities were severely damaged by the fl oods in
Thailand in 2011
Hurricane Sandy killed 285 people in the USA,
the Caribbean, and Canada in late October
2012, and left thousands without power
In all of these cases, in addition to the loss of life and
general physical damage caused by the disaster, the
effects on global commerce were a supplementary
cost to society – from production interruptions
at major factories to the cutting of global supply
chains. Preparedness against disasters is no longer
simply an issue for individual countries or regions,
but has become a global issue. The risks from such
disasters extend throughout the world.
This White Paper particularly focuses on
major disasters that cause electrical outages.
Earthquakes destroy transmission and distribution
systems, including cables, towers and utility poles.
Restoration of this infrastructure and the services
it provides can take very long periods of time.
Tsunamis, hurricanes and fl oods cause similar
damage to electrical facilities. Major pieces of
infrastructure such as generators can be fl ooded
or roads blocked, limiting delivery of fuel supplies
to local generators. Electrical equipment belonging
to consumers can be inundated with water, posing
the risk of electrocution. In some regions, wild
fi res constitute the most severe threat to electricity
transmission and distribution systems. In other
regions the weight of ice from snowstorms can
destroy transmission cables and towers.
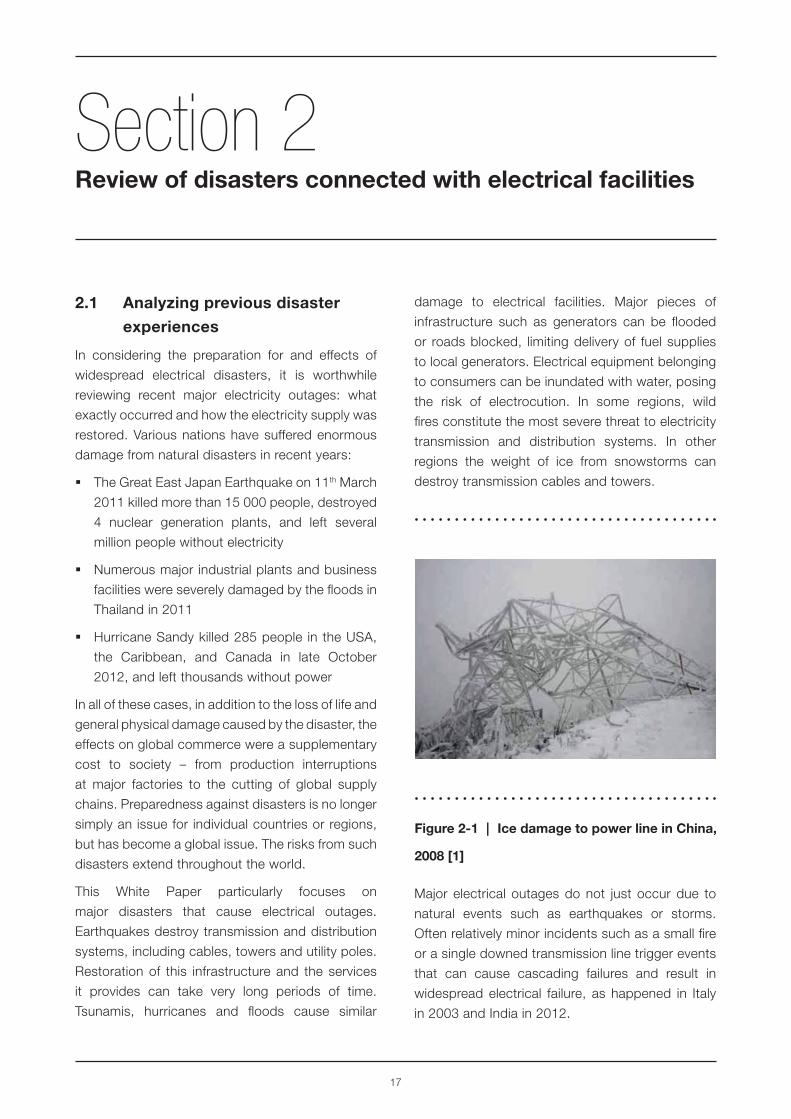
Major electrical outages do not just occur due to
natural events such as earthquakes or storms.
Often relatively minor incidents such as a small fi re
or a single downed transmission line trigger events
that can cause cascading failures and result in
widespread electrical failure, as happened in Italy
in 2003 and India in 2012.
Figure 2-1 | Ice damage to power line in China,
2008 [1]

18
A list of recent disasters that have caused major
power supply loss is shown in Table 2-1. The
table is not intended to comprehensively cover all
the major electrical disasters around the world in
recent times. Rather, Table 2-1 shows the diversity
of disasters and their root cause, from natural
disasters to human induced failures.
Review of disasters connected with electrical facilities
Grid blackout
Robust facilitiesand appliances
Microgrid
Recoveryfrom disaster
Most importantneeds
Needs of ECP fordisaster prevention
Police, law andregulation
Robustsmart grid
Technologies andforecast of
commercialization
MDR technologyreasonable price R&D
Recommendationfor
standardization
Saving electricitydemand control
Standardizationtime and
requirement
Recovery ofelectric power grid
Marketforecast
Enforcement ofelectricity facility
Policy for economicalincentives
Recommendation
Figure 2-2 | Thailand fl oods, 2011 [2]
Figure 2-3 | Wildfi res in Australia, 2009

19
Review of disasters connected with electrical facilities
Date Country/Region Type of disaster/Cause Impacts of disaster
July 2012 India Excessive heat (climate
conditions) caused
increased energy load.
Loss of one transmission
line caused a cascading
failure. Continued demand
problems exacerbated this
failure over two days.
Over 620 million people lost power,
requiring over 15 hours to restore
80 % of service.
October 2012 USA, East Coast Hurricane Sandy At least 285 people were killed
across the US, the Caribbean, and
Canada as a result of the storm.
The hurricane caused tens of billions
of dollars in damage in the US,
destroyed thousands of homes, and
left millions without electric service
for days.
July 2012 India Cascading failure after
400 kV Bina-Gwalior line
tripped.
The outage affected over 620
million people – about 9 % of the
world population –, or half of India’s
population, spread across 22 states
in Northern, Eastern, and Northeast
India. An estimated 32 GW of
generating capacity was taken offl ine
in the outage.
July 2011 Thailand Flood 450 people died. Widespread
blackouts affecting 13 million people,
some for up to 2 months.
April 2011 USA Tornadoes (650 in total) 400 people died.
3 nuclear reactors were shut down.
Blackouts affected over 20 million
people for up to 10 days.
Table 2-1 | Recent major electrical disasters, and their effects

20
Review of disasters connected with electrical facilities
Date Country/Region Type of disaster/Cause Impacts of disaster
March 2011 East Japan Earthquake and tsunami More than 15 000 people died.
4 nuclear reactors were destroyed.
Widespread blackouts affected more
than 4 million homes, lasting 7 to
8 days.
January-
March 2008
China Winter snow and ice
storms
129 people died, 1.66 million were
relocated. About 36 000 power
lines (10 kV and above) failed, 8 000
transmission towers (110 kV and
above) collapsed, 2 000 substations
failed.
April 2008 Western Europe Power system operation
poorly planned, resulting in
cascading failure.
Widespread blackout affecting more
than 5 million people for more than
2 hours.
August 2005 Indonesia Cascading failure after one
transmission line failed.
Widespread blackout, lasting
approximately 7 hours, affecting
100 million people.
August 2005 USA Hurricane Katrina More than 1 800 people died.
Estimated damage more than
USD 108 billion.
Blackouts across 3 states, lasting up
to 2 weeks.
December
2004
Countries
bordering the
Indian Ocean
Earthquake and tsunami More than 230 000 people died.
September
2003
Italy Cascading failure after
one transmission line was
damaged by a storm.
Nationwide blackout for more than
12 hours, affecting more than 56
million people.

21
Review of disasters connected with electrical facilities
Annex A presents further details on several of the
disasters listed in Table 2-1, provided by members
of this project with local experience or knowledge
of the disaster and the ensuing response.
Importantly, as well as reviewing the impact of
the major electrical disasters, project members
provided feedback on “lessons learnt” regarding
the impact of the disaster, or the recovery of
electricity supply after the disaster. These lessons
learnt provide valuable guidance for the focus of
this White Paper and what can be done to improve
the reliability and resilience of electricity supply.
Focus on a number of key observations comes out
of the various case studies:
The centralized nature of many power systems
means that relatively small damage, in a few key
areas, can lead to extensive power outages.
Often, these vulnerable areas were not identifi ed
prior to the disaster
Today, many electricity grids contain signifi cant
amounts of distributed generation, yet such
generation cannot be relied upon to maintain
electricity supply after a major electrical
disaster. From restrictions on the operation
of solar photovoltaic systems, to lack of fuel
supplies due to road blockages, there are a
variety of factors that mean the availability of
local distributed generation cannot be assumed
Whilst defence mechanisms such as sea walls
to prevent fl ooding, or uninterruptible power
supply systems, may be in place, often they were
inadequate for the disaster faced. In general, this
is an issue of planning and analysis – facilities
and end-users face signifi cant uncertainty in
how to evaluate the risks of natural disasters, or
their preparedness against such risks. Without
any uniform way of measuring these risks, or
preparedness for them, it is diffi cult for facilities
to evaluate their own position, to prepare
detailed disaster resilience or recovery plans, or
compare one facility against another
Areas (a neighbourhood, or perhaps a single
large facility) that had a range of distributed
generation, and careful management of supply
and demand, were often able to maintain supply
after a major electrical disaster, or at least
restore supply much faster than other areas
Given the observations above, the remainder
of this White Paper focuses on techniques for
disaster planning and preparedness, and the use of
microgrid technologies as a way of ensuring local
electricity supply reliability.

23
Section 3Planning for disasters and post-disaster recovery
3.1 Quality of planning
The range of disasters presented in Table 2-1 of
this White Paper, and the accompanying case
studies in Annex A clearly demonstrate that one
of the key factors in minimizing the damage and
costs associated with major electrical outages is
the quality of planning – how well-prepared an
organization was to avoid loss of electricity supply
after a major disaster, and, quite separately, how
well the recovery from a major electrical outage
was planned.
There is signifi cant effort needed in preparation
for disaster and post-disaster recovery, involving
various jurisdictions and organizations. This is an
area needing substantial improvement and requiring
a large amount of work, from the development
of standardized ways of classifying the potential
damage from various disasters, to measuring
and reporting a facility’s preparedness for outside
electrical failure, to the preparation of detailed
plans for recovery from major disasters.
The aim of this section is not to provide solutions
to the particular challenges involved, as this still
requires a signifi cant amount of future work from
numerous organizations. Instead various broad
concepts are introduced, indicating how disaster
preparedness and post-disaster recovery may
benefi t from standards and the preparation of plans
for the provision of reliable electricity supply.
3.2 Continuity planning
A key requirement for any successful business is
the completion of comprehensive strategic plans –
to ensure that the company in question prospers,
but which also project how the business would
respond to particular external events, including
catastrophic occurrences that might have a
dramatic impact on business performance. Such
continuity plans can ensure that a successful
business resumes operation as quickly as possible
following a disaster.
3.2.1 Business continuity planning
Perhaps the most widespread use of continuity
planning is in the area of BCP, which “identifi es an
organization’s exposure to internal and external
threats and synthesizes hard and soft assets
to provide effective prevention and recovery for
the organization, while maintaining competitive
advantage and value system integrity” [3]. BCP
should consider a range of events that might affect
operations, from supply chain interruptions to loss
of critical infrastructure or the effects of physical or
cyber-attacks. BCP involves the following stages:
Business impact analysis, which splits
organizational functions and activities into
critical or non-critical areas. Critical functions
are those where interruption would cause
signifi cant problems. Having identifi ed the
critical functions, a business impact analysis will
then determine the recovery requirements for
each critical function
Threat and risk analysis, which is based on
identifying potential threats and the necessary
steps to post-threat recovery
While BCP remains a relatively new domain, uptake
has been particularly successful in the information
technology industries. Here, coping with major

24
outages – whether from communication infrastructure
failures or cyber-attacks – is a critical task for
organizations such as data centres. Consequently,
a relatively signifi cant amount of work has been
undertaken in this area, including standardization
activities that provide guidelines and codes of
practice for planning against major interruptions.
Relevant International Standards here include:
ISO/IEC 27001:2013, Information technology
– Security techniques – Information security
management systems – Requirements
ISO/IEC 27002:2013, Information technology
– Security techniques – Code of practice for
information security controls
ISO/IEC 27031:2011, Information technology –
Security techniques – Guidelines for information
and communication technology readiness for
business continuity
ISO/IEC 24762:2008, Information technology –
Security techniques – Guidelines for information
and communications technology disaster recovery
services
3.2.2 The effectiveness of business
continuity planning following major
disasters
Whilst BCP are a growing area of attention for many
companies, experience from recent major disasters
suggests that more needs to be done.
In 2005, the Japanese government’s Disaster
Prevention Basic Plan [4] suggested that all
companies should develop a BCP, and rec-
ommended a target that all large-scale companies in
Japan develop and implement such a plan by 2018.
By 2011, 70 % of large-scale Japanese companies
and 35 % of middle-scale companies had prepared
and/or were in the process of planning BCP, when
the Great East Japan Earthquake struck.
However, most of the BCP did not work as
planned, and lack of electricity supply was a critical
factor in the process of post-disaster recovery.
Following this massive disaster, 271 companies
were surveyed regarding the impact of the disaster
[5]. Of these companies, 106 claimed they faced
signifi cant IT system problems after the earthquake,
and 137 companies did not have a BCP. Among
the Japanese companies surveyed who did have
a BCP, only one company replied that their plan
had worked as designed. Examples of some of the
comments received include: “(We) had prepared
for damage to our building, but the lack of electric
power was not assumed”, or “BCP does not work
for partial blackouts.”, and “It will be necessary
to rework our preparedness for a major disaster.”
These comments suggest that, even when
preparing BCP, the widespread loss of electricity
supply, or its actual effects on the business, had
not been suffi ciently considered. In analyzing the
gap between the disaster that ensued, and the
continuity plans originally developed, it is clear that
long grid outages, collapse of supply chains that
might affect electricity supply, or the loss of critical
infrastructure, were rarely foreseen.
In effect, a revision of BCP from real experiences
was essentially important and ECP became the
next step for recovery.
3.3 Electricity continuity planning
BCP often give only cursory attention to the
maintenance and/or restoration of electrical
services. Given the complexity of electricity
systems and the growing popularity of distributed
generation and related energy technologies
in customer’s premises, a new continuity plan
specifi cally focussed on electricity supply resilience
and restoration is needed in many organizations.
So-called ECP will specifi cally consider how to
rapidly restore electricity supply to a particular
site, based either on outside supply or internal
provision. However, the case of the provisions
of the preceding section shows that a BCP may
not work enough against unexpected disasters.
Planning for disasters and post-disaster recovery

25
Certainly a BCP also an ECP should be revised
based on PDCA (Plan-do-check-act) cycle on each
real case of an unexpected large scale disaster.
Preparedness against disaster will never be
perfect without appropriate operational strategies.
Installation of a back-up system or microgrids (i.e.
ECS is considered to be an investment in hardware)
reinforce the preparedness against disaster. The
hardware will demonstrate its full performance
when it is combined with appropriate software.
Following the lead of BCP, an ECP should, as
shown in Figure 3-1, include analysis of potential
threats to electricity supply, countermeasures to
these threats, implementation of these measures,
and testing and continued improvement of the
plans.
In contrast to BCP, unique electrical issues that
should be considered by an ECP include:
Alternative generation sources – the use of local
back-up generation
Dependencies outside the electrical equipment
that may affect electricity supply – for example,
the availability of fuel for back-up generators
Identifi cation of particular electrical loads, their
priority for business functions, and their energy
requirements
When preparing an ECP there are a number of
key steps to determine the particular threats to
electricity supply and steps to mitigate these risks
for a given facility. For example, when preparing an
ECP, it is critical to identify the risks that the various
types of natural disasters may pose to a particular
Planning for disasters and post-disaster recovery
Figure 3-1 | Example of an ECP
evel Estimate the levelof disaster
ECP byclassification Priority
of distribution
Function of ECSfor equipment Emergency
evacuationTraining for
disasterprevention
Immediateexecution of
ECS functions
Disaster alarm
Announce the disaster level
or severity
Create the
headquarters
Safety recoveryfor electricequipment
Improvement of plans
Preparedness for disaster Disaster strike Urgent
countermeasure Safety recovery Review for next preparation e S R
Plan disaster
countermeasuresMonitor and
forecast disaster Save energy Assessment of
ECS and ECP
Establish information
network
Restore supply

26
Planning for disasters and post-disaster recovery
facility. Currently, there is no standard method to
classify particular types of natural disaster and their
potential impact on a facility. Similarly, there is no
way to compare facilities – to determine whether
one facility (or design) is more resilient against a
certain disaster than another.
3.3.1 Electricity continuity systems
The use of an ECP to detail the restoration of
electricity supply after a disaster is only one step in
establishing a business’s broader resilience against
major electricity outages. Following the Great East
Japan Earthquake, the Japanese government
surveyed 571 businesses, asking “What prevented
your business from continuing its functions following
the earthquake?” [6].
As seen in Table 3-1, the predominant reason
given for the cessation of business after the
Great East Japan Earthquake was blackout.
Other major infl uences though were not related
to electricity supply such as access to gas, water,
and telecommunications which are also critical to
business operation.
The results in Table 3-1 suggest that whilst ECP
may determine particular threats to electricity
supply and the steps to mitigate risks, more plans
are needed. Consider, for example, when preparing
an ECP the steps necessary to identify the risks
that particular natural disasters pose to a facility.
Currently, there is no standard methodology to
classify particular types of natural disasters and
their potential impact on a facility. Similarly, there is
no way to compare facilities – to determine whether
1 Blackout (total loss of power) 54.8 %
2 Shutdown of transportation 37.8 %
3 Shutdown of telecommunications and internet 29.9 %
4 Employees not able to travel to work 28.0 %
5 Damaged production equipment 26.6 %
6 Business clients not attended to 25.6 %
7 Water outage 25.4 %
8 Damaged offi ce buildings 23.6 %
9 Clients facilities are damaged 22.9 %
10 Power shortage (brownouts) 20.8 %
11 Shutoff of gas supply 13.8 %
12 Damaged information systems 11.2 %
Table 3-1 | Survey results for interruption of business after the Great East Japan Earthquake
27
Planning for disasters and post-disaster recovery
one facility (or design) is more resilient against a
certain type of disaster than another.
An ECS is a macro-level plan that considers a wide
range of issues infl uencing a facility’s electricity
supply and its resilience. It should not only take the
continuity of local electricity into consideration, but
also the other infl uences shown in Table 3-1.
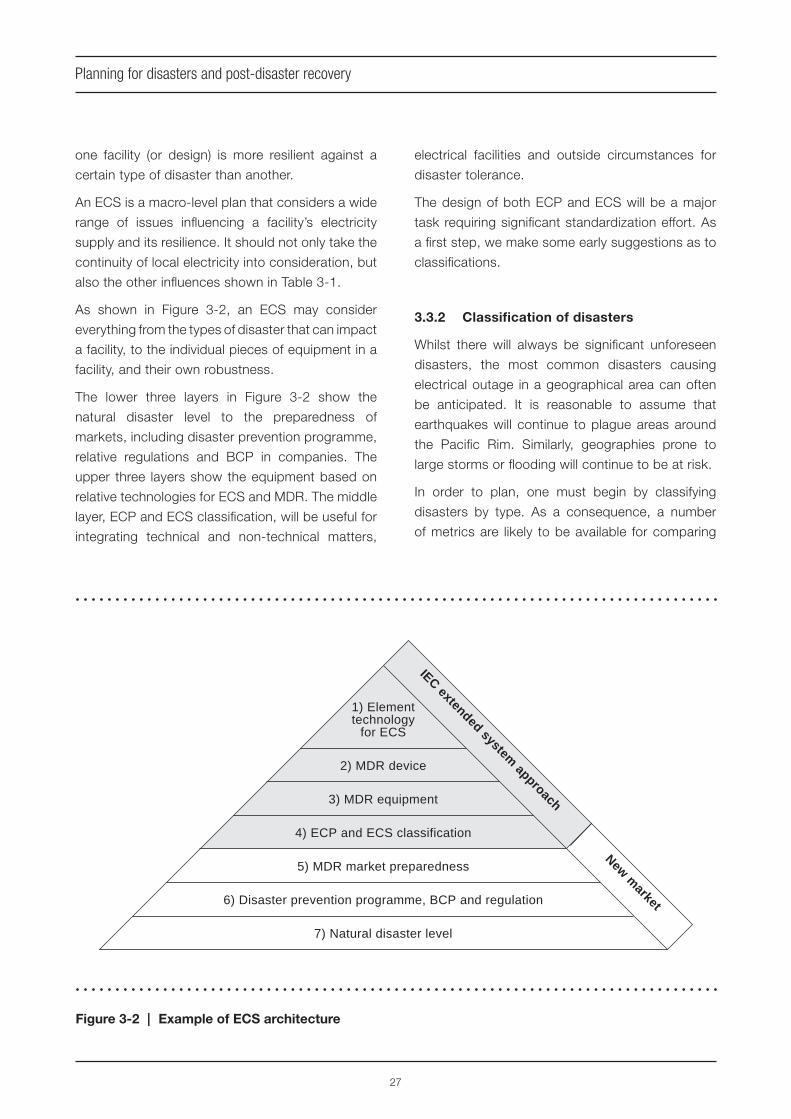
As shown in Figure 3-2, an ECS may consider
everything from the types of disaster that can impact
a facility, to the individual pieces of equipment in a
facility, and their own robustness.
The lower three layers in Figure 3-2 show the
natural disaster level to the preparedness of
markets, including disaster prevention programme,
relative regulations and BCP in companies. The
upper three layers show the equipment based on
relative technologies for ECS and MDR. The middle
layer, ECP and ECS classifi cation, will be useful for
integrating technical and non-technical matters,
electrical facilities and outside circumstances for
disaster tolerance.
The design of both ECP and ECS will be a major
task requiring signifi cant standardization effort. As
a fi rst step, we make some early suggestions as to
classifi cations.
3.3.2 Classifi cation of disasters
Whilst there will always be signifi cant unforeseen
disasters, the most common disasters causing
electrical outage in a geographical area can often
be anticipated. It is reasonable to assume that
earthquakes will continue to plague areas around
the Pacifi c Rim. Similarly, geographies prone to
large storms or fl ooding will continue to be at risk.
In order to plan, one must begin by classifying
disasters by type. As a consequence, a number
of metrics are likely to be available for comparing
1) Elementtechnology
for ECS
2) MDR device
3) MDR equipment
IEC extended system approach
New market
4) ECP and ECS classification
5) MDR market preparedness
6) Disaster prevention programme, BCP and regulation
7) Natural disaster level
Figure 3-2 | Example of ECS architecture

28
Planning for disasters and post-disaster recovery
likely impacts of the disaster versus the resilience
measures in place.
Some examples of such disaster metrics may
include:
Flood heights
Wind strength
Earthquake intensity
Lightning frequency
Tsunami height
Duration of inundation
The impacts of a disaster will vary depending on
the country, geography and infrastructure. Such
metrics may already exist in geographical or
meteorological records, but in the preparation of
ECP, these metrics need to be carefully selected
and assessed in terms of the insight they offer
regarding the likely impact on electricity supply.
Much work remains to be done in this area, with the
ultimate aim to standardize the way of measuring
and comparing potential natural disasters, so that
resilience measures can then be implemented.
3.3.3 Classifi cation of facilities
Once an understanding of likely disasters and
their severity has been established, a facility can
then start to evaluate to what extent it is prepared
against each disaster. Here, the goal is to design a
standard set of metrics that can indicate a facility’s
preparedness against disaster and loss of energy
supply, effectively allowing the level of preparedness
of each facility to be compared to one another.
The preparation of metrics to measure disaster
preparedness or resilience will be a complicated
exercise. This work will need to grapple with how
to measure a facility’s resilience against a very wide
range of potential natural disasters and how this
can be distilled into a number of common metrics.
Similarly, whilst “n-1” style metrics as used in the
utilities industry might indicate that a facility can
cope with a major infrastructure’s single failure, they
do not indicate other important factors, such as
length of the outage, dependencies on outside fuel
supplies, etc. The goal is to standardize a way of
measuring a facility’s preparedness against a variety
of disasters, to allow internal evaluation (as part of a
broader ECS), and comparison of different facilities.
ECS Class Criteria
Reliability Interruption Fluctuation Others
1 Required
reliability of
power supply
Acceptable
interruption period
Acceptable fl uctuation of
voltage and frequency2
3
4
5
…
XXX
Table 3-2 | Example criteria for load classifi cation

29
Planning for disasters and post-disaster recovery
3.3.4 Classifi cation of loads
When classifying a facility’s resilience against an
electrical outage, it is critical to have a detailed
understanding of the loads in the facility. We
suggest there are at least two further classifi cation
standards needed:
1) Classifi cation of load energy requirements
Different loads can accommodate different levels
of power quality, and/or length of supply failure,
without having signifi cant economic effect. There is
currently no standard method or metrics to specify
a load’s electricity supply requirements. Such
classifi cations may be based on individual pieces
of equipment, where classes of load are introduced
based on metrics such as:
Acceptable supply interruption duration
Acceptable supply frequency range
Acceptable supply voltage range
These metrics can then be assembled to form
various classifi cations of loads, with one example
classifi cation shown in Table 3-2. Again, much work is
needed here to standardize classifi cations to capture
the wide variety of loads and their requirements, yet
remain concise and readily interpreted.
2) Classifi cation of load priorities
When preparing an ECP for a facility, it will be critical
to understand the priority of various loads and their
energy requirements. For example, one common
response in times of constrained supply is to
shed low-priority loads in order to maintain supply
to critical infrastructure. Such low-priority loads
might also be used to earn a facility income, by
participating in wider demand-response schemes
(during regular supply), where a facility owner is paid
to shed loads at times of peak system demand. As
shown in Figure 3-3, loads that cannot cope with
supply interruption are also unlikely to be useful
when a demand response or load shed is needed.
There is currently no standard way to indicate the
priority of various loads in a facility. The application
of such a standardized assessment may include:
Communication of priority loads when preparing
ECP
Programming and inter-operability of technical
systems such as automated energy management
systems. If standardized classifi cation schemes
are in place, this will ease the implementation of
such automated control systems
Importantly, the defi nition of a particular load’s
priority and supply requirements may vary in
application, over time, or operating environment.
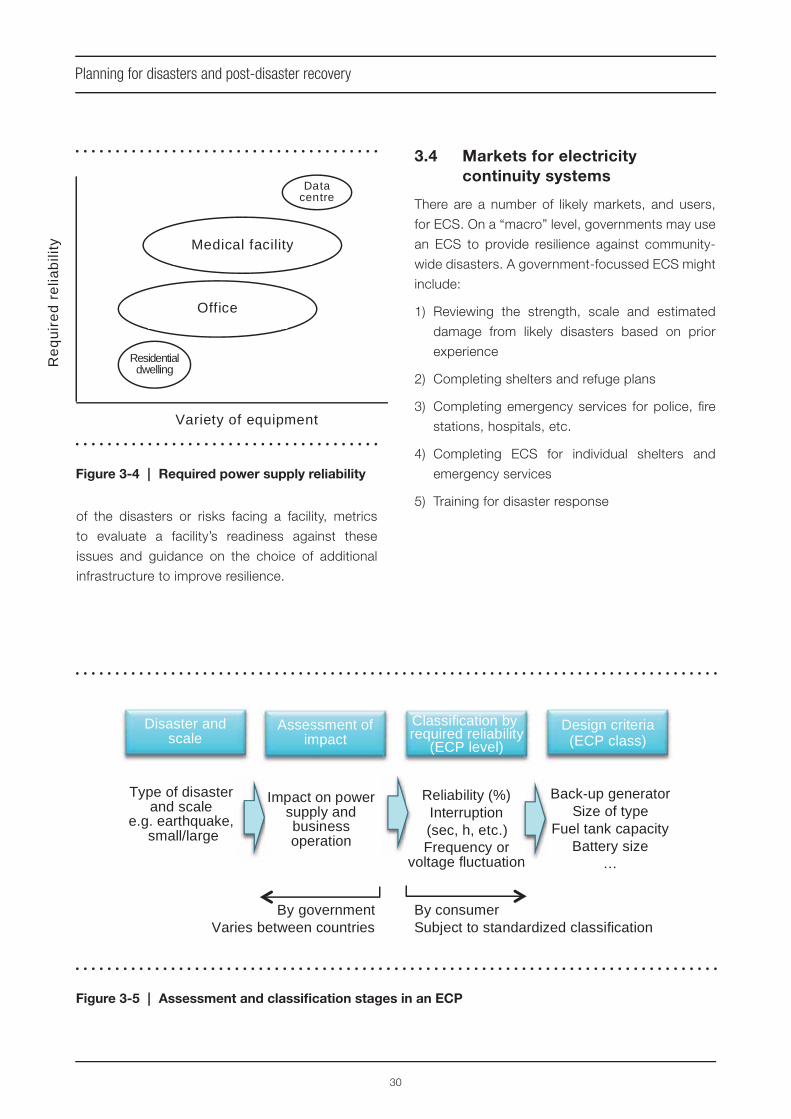
Classifi cations both by type of operation facility,
and equipment, are possible, as shown in Figure
3-4. A medical facility has critical loads (such
as a respirator) and non-critical loads (such as
an entertainment system for patients). An offi ce
building has no critical loads, but the computer
systems are very important for business continuity.
Dwellings usually have no high priority loads unless
a resident uses a home medical care system (such
as a dialysis machine).
These steps come together in an ECP as shown in
Figure 3-5, where the detailed planning of resilience
and restoration must include an understanding
High
High
Low
Low
Requiredreliability
Demand responsepriority
Non-important loads
Important loads
Figure 3-3 | Prioritization of load
30
Planning for disasters and post-disaster recovery
of the disasters or risks facing a facility, metrics
to evaluate a facility’s readiness against these
issues and guidance on the choice of additional
infrastructure to improve resilience.
3.4 Markets for electricity
continuity systems
There are a number of likely markets, and users,
for ECS. On a “macro” level, governments may use
an ECS to provide resilience against community-
wide disasters. A government-focussed ECS might
include:
1) Reviewing the strength, scale and estimated
damage from likely disasters based on prior
experience
2) Completing shelters and refuge plans
3) Completing emergency services for police, fi re
stations, hospitals, etc.
4) Completing ECS for individual shelters and
emergency services
5) Training for disaster response
Figure 3-4 | Required power supply reliability
Data centre
Medical facility
Office
Residential dwelling
Variety of equipment
Re
qu
ire
d r
elia
bili
ty
Disaster and scale
Assessment of impact
Classification by required reliability
(ECP level) Design criteria(ECP class)
Type of disaster and scale
e.g. earthquake, small/large
Impact on power supply and business operation
Reliability (%) Interruption (sec, h, etc.) Frequency or
voltage fluctuation
Back-up generator Size of type
Fuel tank capacity Battery size
…
By consumer Subject to standardized classification
By government Varies between countries
n
Figure 3-5 | Assessment and classifi cation stages in an ECP

31
Planning for disasters and post-disaster recovery
On the other hand, companies may also manage
their own company or facility-specifi c ECS. A
company-specifi c ECS might include:
1) Making decisions about the locations of
company facilities by ECS assessment
2) Continuity planning for core facilities after a
disaster has occurred
3) Including disaster and ECS analysis in any
investment decisions
Whilst the focus of ECS for a private company is
ultimately business continuity, such systems can
bring other benefi ts. For example, when considering
the addition of local generation to add electricity
supply redundancy, such generation may also
lower operating costs by reducing the dependency
on expensive grid electricity. Ultimately, the careful
planning needed to prepare a detailed ECS is likely
to bring additional benefi ts in energy expenditure,
return on capital, and so on.
3.5 The consumer market of
electricity continuity systems
and disaster relief functions
An additional market to consider as part of the
ECS is the consumer market. By best practice,
renewable energies (i.e. photovoltaic and batteries)
used in HEMS are effective for maintaining energy
during disasters. These HEMS played an important
role when rolling blackouts were instituted in March
2011 after the Great East Japan Earthquake.
In this specifi c case, it was only after the incident
that consumers recognized the fact that distributed
generations, such as photovoltaic generations
and CHP systems that are installed to realize CO2
zero emission houses are successful in quickly
recovering electricity supply in the case of disasters.
As it was in best practice, the HEMS that originally
intend CO2 reduction effectively functioned as ECS
in case of the earthquake disaster. Such houses are
penetrated very fast after that. For example, 5 356
sets of fuel cell CHP were installed in the houses
that were built by Sekisui House, a Japanese house
builder. 80 % of the newly constructed houses by
them are equipped with photovoltaic generations.
In addition, during a blackout, the switching on
of the electrical system must be automatic, since
manual operation by residents cannot be expected
at that time in general houses.
After the Great East Japan Earthquake, more than
50 % of new homebuyers prefer the houses with
advanced systems that contribute to CO2 reduction
and work as ECS. The main future specifi cations of
such ECS for residential dwellings are mentioned
below. Moreover, the ECS type home network
is shown in the Figure 3-6. Such houses are
important, concrete examples of the microgrid that
integrates DER.
The abovementioned MDR functionalities must be
integrated into daily operation by the consumer
(users), ensuring that users will become familiar
with their own operation of the HEMS and can thus
be prepared for blackouts.
For example, the sequence of ECS related events in
a smart home can be examined below as disaster-
relief functions:
1) Detecting loss of power from the grid
Delinking function for grid and microgrid
Power supply and monitoring functions from
batteries to microgrid
Checking function for safety inside microgrid
Communication tool to check safety of
connected appliances before recovery from
blackout
Minimizing power loss and saving conversion
loss by DC power
2) In case of using renewable energies
Penetration ratio (effi cient utilization), capacity
of batteries, ECS class should be well balanced
Assessment ECS class is needed for the

32
Planning for disasters and post-disaster recovery
installation site of PV, wind power
3) Relation with demand response
Selecting appliances depending on the priority
How to consume the limited power and select
appliances
Setting priority for battery power
4) Use of Electrical Energy Storage (EES)
contributes to ECS classifi cation
Adding ECS functions for disaster relief by EES
to daily system making the implementation
easier
5) Electric Vehicles (EVs) can return charge to
the home during blackouts
Microgrid technology is now extended not only to
the electricity industry but also to other electric
industries and consumers.
International Standards are needed and necessary
in ECS and should be promoted in order to position
these technologies over sectors of electrical
industries and encourage collaboration between
each industry.
In the cases above, standards are necessary for
safety and interconnecting. Figure 3-6 provides an
example of an ECS home energy network.
Figure 3-6 | ECS type home energy network from electrical energy effi ciency and electrical energy
storage
33
Section 4Post evaluation review of Japanese electrical facilities
and examples of best practice against disasters
4.1 General
The Great East Japan Earthquake has also enabled
to evaluate the preparedness of industrial facilities
for possible disasters. Focusing on electrical
facilities of some of the most important social
service organizations, it is critical in moving forward
that these businesses must be able to keep
their operations open, and to continue to have
electricity available to them. Hereafter are post-
event observations of telecommunication systems,
medical facilities and semiconductor factories.
The cases outlined in this section are very useful
in showing how specifi c facilities coped with major
disasters and subsequent electrical outages.
Three best-practice cases are then presented
to show how to maintain electricity reliability in
challenging circumstances based on microgrid
concepts.
4.2 Telecommunication systems
Telecommunication systems are a critical part
of society, and rely on a constant power supply.
Facilities such as mobile communication base
stations or telephone exchanges are classifi ed
based on their importance. High demand facilities
are given top priority and low demand facilities are
given less priority.
In addition to back-up generators and UPS,
mobile generators and mobile telecommunications
equipment are also commonly used in a modern
telecommunications system. Operation and
management of these devices is considered an
important challenge following any widespread
disaster. It will be necessary to deliver mobile
generators or refuel the generators. Appropriate
management of equipment and human resources
is important.
In the example of the Great East Japan Earthquake
the damage to telecommunication facilities was
widespread. Many communication cable routes
were destroyed, as were facilities including buildings
and equipment. Power supply was lost. Japanese
authorities responded as per their pre-prepared
disaster plans. They dispatched mobile generators
and alternative telecommunication facilities such
as mobile base stations, and personnel to maintain
working equipment and fi x damaged apparatus.
Throughout the disaster recovery effort the
authorities needed to work very closely with other
utility providers.
4.3 Medical facilities
A major challenge facing medical facilities is that
the electrical load normally increases following
a disaster. When a region is hit by a disaster the
injured seek treatment and medical facilities have
to take care of these patients even if the facilities
themselves are damaged.
In this context, a secure power supply is critical
for medical facilities to continue functioning, as
power interruption may cost lives. Typically, only
large medical facilities are equipped with back-up
generators and UPS, as these backup supplies
cannot be economically justifi ed for medium/small
facilities. Even where back-up generators exist,
refuelling after a major disaster is often problematic,
due to limited fuel supplies, or the diffi culty of getting

34
fuel to the site due to road damage, etc. Prioritizing
medical equipment and supplying power only to
critical loads is a crucial component of disaster
planning for such facilities, in order to minimize
back-up supply fuel consumption. Diversifying the
range of energy sources (e.g. electricity, natural
gas and kerosene) can improve the robustness of
the supply.
4.4 Semiconductor production
facilities
Japanese equipment and material suppliers
are leading players in the global semiconductor
industry. It is estimated that Japan-headquartered
equipment companies collectively capture about a
35 % share of the global semiconductor industry
spending per year.
Semiconductor production facilities require
high reliability and a high quality of power. Any
interruption to supply, even a short voltage drop, can
cause incredible damage. In many semiconductor
facilities, the shut-down and start-up process after
an electrical outage can take up to 11 days.
Given these constraints, most semiconductor
production facilities are equipped with a range of
back-up systems such as UPS and generators, as
shown in Table 4-1.
The Great East Japan Earthquake heavily
damaged a number of semiconductor production
facilities. Outside electrical infrastructures such as
transmission and distribution infrastructures were
also destroyed. In many facilities, the production
areas have no windows and therefore no lighting
without a power supply. Following the Great East
Japan Earthquake, this made recovery works at
each facility very diffi cult. In many cases, it took up
to a month to resume power supply to the facility.
4.5 Data centres
Data centres are considered to be one of the best
examples of an industry with relatively mature plans
for disaster preparation and recovery. For example,
after the Great East Japan Earthquake, no critical
damage to data centres was reported.
In Japan, the Data Centre Facility Standard (DCFS)
was developed by the Japanese Data Centre
Association to classify data centres and their
resilience to electricity supply failure. The Tier
Classifi cation System [7] and TIA-942 Standard are
widely used in the data centre industry to classify
data centres and their reliability, including against
energy supply failure. The DCFS standard is
based on the Tier classifi cation (TIA-942). The Tier
classifi cation defi nes the required power supply
Post evaluation review of Japanese electrical facilities and examples of best practice against disasters
Outage type Effect Duration Protection device
Power quality variation
(from lightning, etc.)
Voltage deviations Seconds UPS
Outside electricity
supply failure
Electricity supply interruption Hours Back-up generators
Major disaster Long-term blackout Days On site internal supply
(permanent)
Table 4-1 | Typical power supply systems in a semiconductor production facility

35
reliability of data centres as shown in Table 4-2 and
Table 4-3. Requirements for associated electrical
equipment such as transformers buildings, security,
air-conditioning and communication systems are
also defi ned to ensure power availability.
The DCFS is based on defi ning system requirements
such as redundancy of back-up generators and
UPS to fulfi l reliability standards. Ability to cope with
a major failure (N+1) and two major failures (N+2)
respectively are required for Tier 4. Recommended
minimum operating periods for back-up equipment
are also defi ned.
In the Great East Japan Earthquake no service
interruption occurred from DCFS-compliant data
centres.
4.6 Sendai microgrid
The Sendai microgrid is designed as an ideal power
supply system that can simultaneously provide
Post evaluation review of Japanese electrical facilities and examples of best practice against disasters
Tier 1 Tier 2 Tier 3 Tier 4
Centre reliability 99.67 % 99.75 % 99.98 % 99.99 %
Requirements
Tier 1 Tier 2 Tier 3 Tier 4
Independent power supply (to servers) Single Single Multiple Multiple
Back-up generator N/A N N N+1
UPS N N N+1 N+2
Recommendations
Fuel supply for back-up generator N/A 12 hours 12 hours 12/24 hours
UPS duration N/A 5 minutes 5 minutes 10 minutes
Table 4-3 | System requirements for data centre reliability standards
Table 4-2 | Data centre tier classifi cation system

36
Figure 4-1 | Sendai microgrid overview Figure 4-2 | Confi guration of Sendai microgrid
Post evaluation review of Japanese electrical facilities and examples of best practice against disasters
services with multiple power quality levels. The
microgrid was developed by NTT Facilities and
was installed on the campus of Tohoku Fukushi
University in Sendai City (see Figure 4-1).
The Sendai microgrid is an integrated 1 MW power
system consisting of power electronics equipment,
storage batteries, and distributed generators (gas
engine generators, solar cells, and fuel cells).
It can easily interconnect and disconnect with
existing utility power grids. In normal operation, the
Sendai microgrid is connected to a utility grid and
improves the level of power quality for the hospital,
welfare care facilities, and university buildings on
the campus. The microgrid can disconnect from
the utility grid after a power outage and continue
supplying power to essential loads or facilities
without interruption (see Figure 4-2).
Immediately after the Great East Japan Earthquake,
services continued to be supplied with high quality
power from the microgrid by using energy from
solar cells and storage batteries. Since the gas
supply network in the city of Sendai was intact, the
gas engine generators were soon able to restart
after power failure at the utility grid, and function
as the main power supply of the microgrid (see
Figure 4-3).
The Sendai microgrid had been extended after the
four years demonstration and could use heat as
well as electrical energy. The gas engine generator
sets and fuel cells worked as CHP units, producing
heat for hot water and space heating for the nearby
buildings, as well as electrical power.
The Sendai microgrid ensured that many patients in
the hospital and in the medical and welfare buildings
were able to survive and maintain their health. The
Sendai microgrid provided many victims who had
experienced unprecedented suffering with not only
an energy supply but also a sense of hope and
peace of mind. This real-life story demonstrates the
effectiveness of the microgrid in ensuring electricity
supply during the disaster.
4.7 Roppongi Hills (Tokyo)
Located in central Tokyo and opened in
2003, Roppongi Hills is a city within a city, providing
residential space, offi ces and recreational facilities

37
Post evaluation review of Japanese electrical facilities and examples of best practice against disasters
Figure 4-3 | Changing sources of power supply from Sendai microgrid after major earthquake
Figure 4-4 | Approximate topology of the Roppongi Hills microgrid system
Gas turbine exhaust heat
Steam header
Power distribution facility Power
generator
Gas turbine Generation of electric power using natural gas
Water supply
Steam boiler (steam is produced from waste heat)
Steam
Natural gas
Water supply
Cooling tower (hotel rooftop
Absorption chiller (steam is used to make chilled water) Steam flow
Power generator
Steam turbine (Steam is also used to generate electricity)
Power receiving facility
Back-up power (TEPCO)
utility grid
Electrical power
Natural gas

38
Moreover, the Roppongi Hills system was actually
called on to export power to the wider utility grid,
providing up to 4 000 kW to the surrounding area
during the blackouts.
Whilst a very reliable energy source, the Roppongi
Hills energy system has another advantage as it
operates with very high effi ciency, using 16 % less
energy and producing 18 % lower CO2 emissions
than a conventional facility of similar size, primarily
due to the use of heat pumps and local natural gas.
4.8 Smart energy system for
residential dwellings
Whilst previous examples focused on large-scale
deployments, microgrids also offered benefi ts to
residential buildings following the Great East Japan
Earthquake. A “smart energy system” microgrid
Figure 4-5 | Switching grid connection during
blackout
Post evaluation review of Japanese electrical facilities and examples of best practice against disasters
all within one building complex. Roppongi Hills
covers a geographical area of 84 800 m2 with a
total fl oor area of 724 500 m2 and took 17 years
to build.
A state of the art energy system was installed
during the construction of Roppongi Hills, as
shown in Figure 4-4. The system is based around
6 natural gas fi red turbines (6 360 kW each), with
enough capacity to cover the site’s entire electricity
demand. These turbines also provide steam for
space heating and cooling (via absorption chillers),
with cooling water and steam reticulated around
the site.
Given its dependence on natural gas supply, the
Roppongi Hills system featured careful design
of the gas mains to ensure reliable supply. This
includes:
Topology of the gas supply system – the gas
supply is confi gured in a loop, providing dual
supply directions to most loads, meaning
redundancy is built-in
The use of medium-pressure gas supply and
pipelines. Medium-pressure gas pipelines are
more resistant to disasters than the electrical
power transmission infrastructure – there has
been no interruption of medium-pressure gas
supplies in Japan during any natural disaster
Even if natural gas supply is interrupted,
Roppongi Hills has an emergency kerosene-
fuelled power generation system
The strength of the Roppongi Hills energy supply
system was proved after the Great East Japan
Earthquake. No blackouts occurred at Roppongi
Hills at the time of the earthquake, yet the broader
TEPCO area instituted rolling blackouts in the
surrounding suburbs from the 14th to 27th of March
2011, due to the loss of the Fukushima Daiichi
Nuclear Power Plant.
Since the Roppongi Hills energy system supplied
electricity during wider grid outages, local tenants
could continue their normal lives and business.
Needed functions • Outage detection • Automatic supply changeover • Load prioritization
Utility grid
Fuel cell
PV Battery
At electricity outage
Combination, switch and distribution of electric power
Backed up outlets
Normal outlets

39
Post evaluation review of Japanese electrical facilities and examples of best practice against disasters
was installed in a residential house in Saitama,
Japan, in February 2011. The system is based
around a photovoltaic generation system (4 kW)
and Li-ion battery (1.5 kWh), with an associated
home energy management system. The electricity
from the photovoltaic system can be used to charge
the battery, and thus made available for night-time
supply. The system can automatically change from
grid-connected mode to islanded mode and back,
incurring a brief 20 ms to 30 ms interruption to
supply when switching. This system is commercially
available today, at a price of USD 10 000 to
USD 20 000.
The residential microgrid system played an important
role when rolling blackouts were instituted in March
2011 after the Great East Japan Earthquake. In this
case, circuit breakers were automatically opened
and the house’s electricity system switched to a
microgrid when the external power supply was
lost as shown in Figure 4-5. At this point electricity
was supplied from the battery and/or PV system,
as shown in Figure 4-6. The residents could then
enjoy a completely normal life even though the
external grid was shut down.
Whilst the smart energy system demonstrated a
strong ability to provide continuity of power supply
in case of blackout, the cost of energy storage
remains a challenge to a more extensive uptake of
these residential-scale systems.
Battery supplied power during blackout (3.40 pm to 6.40 pm).
Figure 4-6 | Battery operation at blackout


41
Section 5Microgrids
5.1 General
Electricity systems have undergone signifi cant
changes in the past 10 years. For example, there
has been a rapid uptake of new, relatively small
generation technologies referred to as distributed
generation, and in many countries electricity load
has continued to grow dramatically. These changes
are often considered a challenge to electricity
system operation. However, one of the most recent
concepts, that of the microgrid, can actually be
an asset to system operation, particularly when
considering disaster preparation or recovery.
One way of managing the increasing complexity
of our electricity systems is to group distinct
distributed resources such as generators or loads,
so that they represent a single generator or load to
the wider electricity system. When such loads and
generators are located within close geographical
proximity of each other, such a system is often
referred to as a microgrid. More specifi cally, in
this work we defi ne a microgrid as a collection of
controllable and physically proximate distributed
generator and load resources, where there are
multiple sources of AC power and at least one of
these is based on a renewable energy technology
such as wind or solar energy.
A microgrid may or may not be connected to the
wider electricity grid. We defi ne an isolated microgrid
as one that is not connected to the utility grid in any
way, shape or form, but is a distinct island for which
no PCC exists. We defi ne a connected microgrid
as a microgrid that can be connected to the utility
grid. It may operate as a distinct island, but features
a PCC that allows interaction with the utility grid
(most typically to facilitate import/export of power).
There are a number of reasons microgrids are now
receiving signifi cant attention. They are a way of
coordinating the growing number of sites with local
on-site generation. For example, an industrial estate
with roof-mounted solar cells and a gas-powered
back-up generator can be transformed into a
microgrid by adding intelligent control systems to
the generators, then linking these to load controllers
to form a dynamic self-contained energy system.
Microgrids also represent an entirely new way of
powering remote or rural communities – rather than
one centralized (often diesel-powered) generating
station, these communities can be powered by a
large number of low-emissions generators, linked
with appropriate load control. As the range of
possibilities between these two examples is quite
wide, to assist with any ambiguity regarding what
is a microgrid, Table 5-1 provides some examples
of what, in this work, is not considered a microgrid.
An example is a connected microgrid system
deployed at an industrial campus. Power is obtained
from the grid to supply loads (the offi ces), as a
conventional site, but can also be obtained from
embedded generation, including a wind turbine,
solar photovoltaic panels and a micro-turbine.
All these feed power to the site via inverters. A
battery is equipped with a special two-way power
inverter that can both absorb power when excess
is available or supply it when there is a shortage.
If embedded generation is greater than the required
load, excess power can be exported to the grid via
the two-way PCC. The site can also be isolated
from the grid at the PCC, in which case the loads
are supplied from the embedded generation only. In
these circumstances, the EMS must carefully control
which loads are allowed to draw power, in order to

42
balance supply with demand. Fluctuations in the
renewable generation caused by changing weather
conditions are balanced by judicious charging and
discharging of the batteries, under the control of the
EMS. Some of the key features of this microgrid that
set it, and microgrids in general, apart from more
traditional power distribution systems are:
The use of distributed generation sources,
including renewable and CHP generators
The introduction of dynamic load control
systems
The use of multiple inverters
The ability to island the system, and
A point of common connection (for connected
microgrids)
These features may occur in isolation in traditional
electricity systems, but combine to form a unique
set of opportunities and hurdles when deployed
as a microgrid. These are explored in the following
sections.
5.2 Benefi ts of microgrids
5.2.1 To end users
One of the major benefi ts of microgrids is that
they typically reduce emissions associated
with electricity generation, and/or increase the
effi ciency of generation. Such benefi ts come from
the distributed generators used in microgrids,
which are often based on low or zero-emission
generation sources – from highly effi cient gas
turbines through to renewable energy systems. As
well as the effi ciency of the generator itself, their
close proximity to loads means the effi ciency of
distributed generators can be further improved
by utilizing their waste heat – for example, to heat
or cool nearby buildings. The overall effi ciency is
also improved because the transmission losses are
reduced as well.
Microgrids also allow end users to become
autonomous in their energy provision. By operating
Microgrids
Commonly used name Typical example Why this is not a microgrid
Local renewable energy
system
A single building with a local
renewable energy system (for
instance, a solar generator)
The loads and generators in such a
system rarely exhibit any form of intelligent,
dynamic control. There are rarely multiple
sources of AC power in such systems.
Local back-up power
supply
A single building with a local
back-up power supply (such
as batteries or a fossil-fuel
generator)
Typically such systems operate using a
single generation source or battery supply,
so do not fi t our defi nition of a microgrid
having multiple AC sources.
Grid-connected peaking
plant
Relatively large (>1 MW)
generators interspersed
throughout a distribution network
for meeting peak demand
Connected to a broader distribution
system, there are multiple points of
connection to the wider grid, violating our
defi nition that a microgrid has one single
point of connection.
Table 5-1 | What is NOT a microgrid

43
their own network of local generators and
coordinated loads, microgrid owner/operators can
end their reliance on the wider electricity grid. By
maintaining the ability to island from the wider grid,
a microgrid can ensure robust and reliable supply
for its enclosed loads, isolated from faults on the
wider electricity system. The microgrid can also
provide enhanced power quality compared with
the wider grid, useful in critical applications such
as semiconductor manufacture. This additional
resilience is one of the main benefi ts of microgrids in
relation to the challenge of disaster relief, and will be
further explored in later sections of this White Paper.
5.2.2 To utilities/distribution companies
One of the recent changes in modern electricity
networks has been the increasing uptake of
distributed generation. Whether it is solar cells
for renewable supply or reciprocating engines
providing CHP solutions, distributed generators are
now quite common in a modern electricity system.
Distributed generation poses a number of challenges
to the operation of electricity systems. It can reverse
the direction of power fl ow in certain parts of the
network. This can cause problems in networks
designed on the assumption power will fl ow in one
direction only. Further, to maintain power quality
in the network, it may be necessary to individually
manage each of the operating generators. With
large numbers of generators possibly operating at
any one time, centralized management of individual
distributed generators across the entire electricity
system can be a cumbersome task.
Microgrids ease the challenge of controlling large
numbers of distributed resources by making
distributed generation control an internal process,
operating within the microgrid. For example, by
managing a large number of distributed generators
on an industrial campus as a microgrid, we are
able to abstract the challenges of coordinating
and controlling multitudes of distributed resources
away from the wider utility grid. Each generator is
managed internally to the microgrid, and the entire
microgrid appears as only one single generator to
the broader electricity system. Here the microgrid,
with its single point of connection to the wider
electricity system, implicitly aggregates all the
resources within the microgrid to appear as a
large, single controllable resource. Ultimately, with
microgrid technologies, today’s electricity networks
can operate with large amounts of distributed
generation yet can use conventional command and
control techniques.
Microgrids can also assist with peak electricity
demand – the spikes in consumption that result in
under-utilized electricity distribution infrastructure
and often drive electricity price increases. In an
attempt to better manage peak demand, load
management technologies are being developed
that coordinate a variety of electrical loads so
the total electrical consumption adheres to a
set of constraints. This technique is particularly
benefi cial in a microgrid situation, where loads can
be managed to match time-varying distributed
generation capacity, as well as network throughput
capacity. An example is where load management
on a building air-conditioning system is used to
match the electricity consumption of the load with
the supply available from the renewable energy
sources, reducing the need for fossil-fuel generators
while maintaining occupant comfort in the
buildings. Ultimately, such active load management
means that the microgrid can be operated with
less generation held in reserve, improving broader
system utilization and reducing capital costs.
Microgrids can also assist power systems to operate
with significant renewable electricity generation.
The traditional view of electrifying remote areas
was that whilst some renewable sources could be
included, a large centralized fossil-fuelled generator
was needed to provide “spinning reserve” and act
as inertia for the generation system. Microgrids
challenge this theory: they are designed around
multiple small generators, without any single large
source of inertia. It is not uncommon now to find
Microgrids

44
Microgrids
microgrids operating with greater than 50 % of the
electrical load being met by renewable generation
supply.
5.3 Microgrids for disaster relief
Microgrids are inherently suitable for maintaining
electricity provision during or after a disaster. It is
fi rst worthwhile reviewing what electrical outages
typically mean for power system infrastructure, and
then how microgrids can help.
Faults on power distribution systems can occur for
a variety of reasons, from hardware failure through
to physical interruptions from storms or animal
intrusion. Protecting system assets from such faults
are devices such as circuit breakers, reclosers and
fuses, which isolate faulty network components
and allow re-routing of power in an attempt to
maintain the function of remaining assets. While
some aspects of power system operation and fault
response are automated, all systems still require
signifi cant manual oversight and intervention. In
short, even today, often the only way a utility knows
there has been an outage in the distribution system
is when a customer calls to report it.
One of the core challenges to the reliable operation
of contemporary power systems is their radial,
centralized nature. Essentially, system-wide failures
can occur if there is a failure at any central point
of the system, and there are signifi cant limits to
the dynamic reconfi guration possible. Though
some reconfi guration can occur at the edges of
the network, the core structure remains in place,
is diffi cult to change in situ and is at risk of failure.
As presented earlier in this White Paper, despite
the best efforts of engineers to maximize system
reliability, modern centralized power systems
remain prone to unexpected failure, whether from
cascading failures or widespread geographical
disasters. Microgrids can dramatically improve the
reliability of such power systems. The fi rst instance
of such reliability improvement occurs at the local
site of the microgrid. In times of disaster, an islanded
microgrid can continue operation, maintaining local
power supply autonomously.
Microgrids can also improve the reliability of supply
more broadly than their immediate vicinity. If the
wider grid is operational but strained, a microgrid
can assist by reducing the load on the wider grid,
or even exporting power from the microgrid to a
broader area. As well as power management,
microgrids can also help with voltage and frequency
control in such situations.
If the wider grid is not functioning, a carefully
managed local microgrid may be able to restore
power supply to its immediate neighbourhood by, in
essence, temporarily broadening the region of the
microgrid to create a larger islanded region around
the microgrid. Such scenarios need particularly
careful management to ensure electrical safety
and maintain the reliable operation of the microgrid
itself.
5.4 Microgrid associated
technologies
Technologies associated with microgrids range
from particular types of generation, through to
energy storage devices, load controllers, and
the underlying control and coordination systems.
Common technologies are listed below:
Microturbines are a fi xed generator based on gas-
turbine technology. These typically operate in the
25 kW to 100 kW range, and consist of a turbine,
electricity generator and inverter interfacing the
turbine with the wider electricity grid. Microturbines
have relatively clean exhausts, usually operate on
natural gas, and may be part of a CHP system (see
below).
Batteries are increasing in prevalence as a way
of providing reserve power during outages and for
smoothing the output of renewable energy sources.
There is an increasing range of battery technologies
available for deployment into electricity grids, from
traditional lead-acid technologies through to newer

45
Microgrids
fl ow-battery designs. Batteries are interfaced to the
electricity grid through an inverter/charger.
Flywheels/supercapacitors offer an alternative
to battery storage, with very high power outputs
possible at a lower cost. The focus on such systems
is the power available, rather than the total energy
stored – batteries can supply power for longer,
but fl ywheels and super-capacitors can supply
very large amounts of power in a short time, more
cheaply and with a longer lifetime than a battery.
Fuel cells produce electricity from an input fuel
and oxidant, but without the combustion of typical
fuel generators. They offer very high effi ciency and
low emissions, but are currently very expensive.
Renewable generators such as solar PV or wind
turbines are growing in prevalence as their reliability
improves and price of generated electricity
approaches that of non-renewable sources.
CHP systems improve the effi ciency of distributed
generators by capturing waste heat and utilizing it
in a downstream process. Typical applications of
CHP systems are in heating buildings, where the
waste heat from the generator is used to directly
heat a building, or cooling, where the waste heat
is used in a heat-driven-cooling process to cool a
building.
As well as the key generation and load technologies
introduced above, a number of “infrastructure”
technologies are required to fully realize the features
described in our earlier microgrid vision:
Advanced high-speed control methods to
maintain microgrid stability and provide
intelligent and dynamic operation, despite
having no central point of grid “inertia”
Advanced sensing, diagnostics, forecasting
and adaptation technologies to provide the
microgrid control system with detailed and
up-to-date information on the status of the
microgrid. Care must be taken to ensure that a
minimum number of sensors are used and that
the total capital outlay is also minimized
Integrated communications systems to link
the various resources in the microgrid to
ensure reliable operation, even during typical
communication outages
5.5 Microgrids around the world
Although the microgrid concept has only been
formalized in recent years, there are numerous
real-world networks that satisfy at least some of
the requirements of a functional microgrid. These
practical installations provide valuable insight into
both the operational issues that must be addressed
and the advantages that are offered within the new
power paradigm.
As shown in Table 5-2, many of the installations
around the world so far do not quite meet the full
microgrid vision detailed earlier on in this section.
Many of the systems installed thus far are based
on simple bi-generation setups (most often wind-
diesel), with a non-renewable source used to offer
baseline support to an intermittent renewable
technology. These generation sources are seldom
co-located with loads. Instead they mimic the
prevailing centralized generation and distribution
approach, albeit with a more interesting mix of
outputs, a smaller range and lower capacity. Since
most such systems are used to service small
remote communities, such as those in Bremer Bay,
Australia, on Cape Verde Islands and on Flores
Island (to name but a few), it also seems unlikely
that they offer any level of control over loads, be
it through demand management or otherwise. The
consequence is that while these simple networks
may aid in understanding the interaction between
generation types, use of batteries and, to some
extent, community acceptance of decentralized
power, they are insuffi ciently complex to provide a
full understanding of the issues facing microgrids,
or their benefi ts in disaster relief.
When examining general trends, Figure 5-1
indicates that wind turbines are by far the most
popular renewable generation technology in
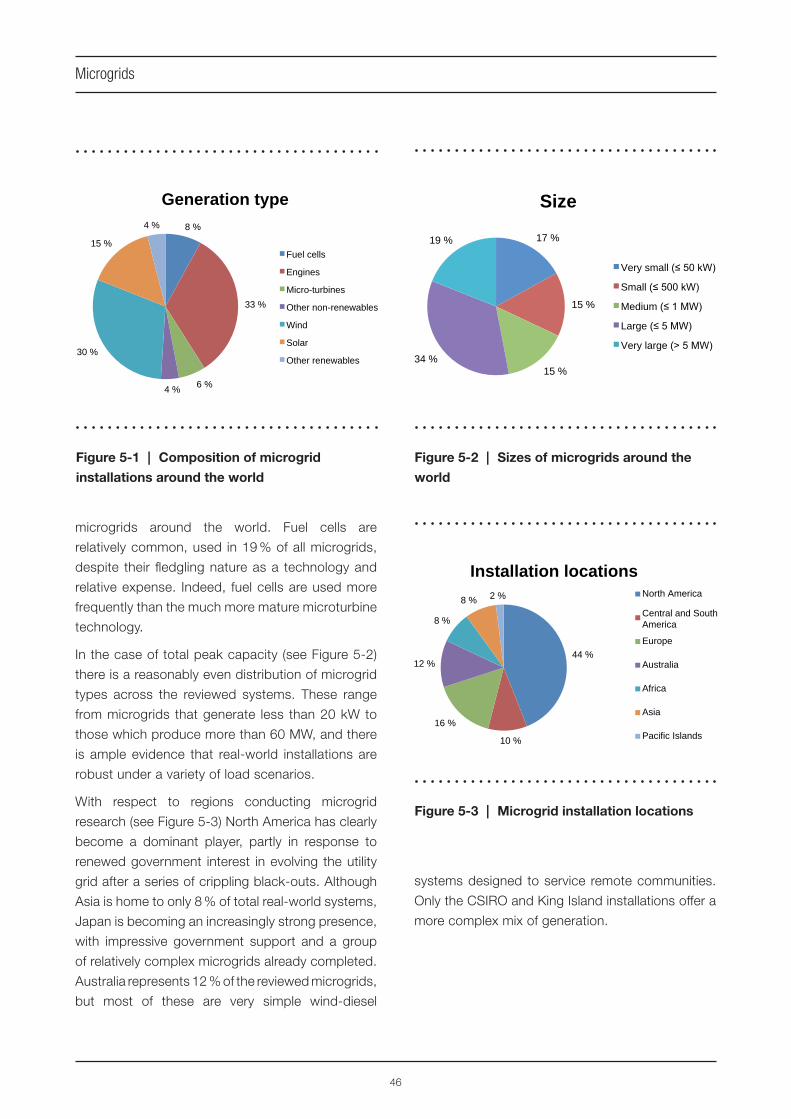
46
Microgrids
microgrids around the world. Fuel cells are
relatively common, used in 19 % of all microgrids,
despite their fl edgling nature as a technology and
relative expense. Indeed, fuel cells are used more
frequently than the much more mature microturbine
technology.
In the case of total peak capacity (see Figure 5-2)
there is a reasonably even distribution of microgrid
types across the reviewed systems. These range
from microgrids that generate less than 20 kW to
those which produce more than 60 MW, and there
is ample evidence that real-world installations are
robust under a variety of load scenarios.
With respect to regions conducting microgrid
research (see Figure 5-3) North America has clearly
become a dominant player, partly in response to
renewed government interest in evolving the utility
grid after a series of crippling black-outs. Although
Asia is home to only 8 % of total real-world systems,
Japan is becoming an increasingly strong presence,
with impressive government support and a group
of relatively complex microgrids already completed.
Australia represents 12 % of the reviewed microgrids,
but most of these are very simple wind-diesel
systems designed to service remote communities.
Only the CSIRO and King Island installations offer a
more complex mix of generation.
44 %
10 %
16 %
12 %
8 %
8 % 2 %
Installation locationsNorth America
Central and SouthAmerica
Europe
Australia
Africa
Asia
Pacific Islands
Figure 5-1 | Composition of microgrid
installations around the world
Figure 5-2 | Sizes of microgrids around the
world
Figure 5-3 | Microgrid installation locations
8 %
33 %
6 % 4 %
30 %
15 %
4 %
Generation type
Fuel cells
Engines
Micro-turbines
Other non-renewables
Wind
Solar
Other renewables
17 %
15 %
15 %34 %
19 %
Size
Very small (
Small (
Medium (
Large (
Very large (

47
Microgrids
Name Location
Research/
Features Capacity Storage
Generation types
Fu
el
ce
lls
Re
cip
roc
ati
ng
en
gin
es
Mic
rotu
rbin
es
Oth
er
no
n-r
en
ew
ab
les
Win
d
So
lar
Kythnos
microgrid
Kythnos
Island,
Greece
Services a remote
community
No utility grid
connection
(operational since
2003)
12 kW PV
85 kWh battery
5 kW
reciprocating
engine
Battery
x x x
Island
of Utsira
microgrid
Island of
Utsira,
Norway
Research and
development project
Fully autonomous
Linked to mainland
by sea cable
Services 10 homes
1.2 MW wind
50 kWh battery
5 kWh fl ywheel
48 kWh
electrolyzer
10 kW fuel cell
55 kW
reciprocating
engine
Battery,
fl ywheel
and
hydrogen
x x x
Bornholm
Island
microgrid
Bornholm
Island,
Denmark
Services a massive
27 320 customers
(domestic, agricultural,
commercial)
Uses load and
generation forecasting
Connected to Sweden
via cable
65 MW total Unknown
x
Table 5-2 | Some examples of microgrids from around the world [8]
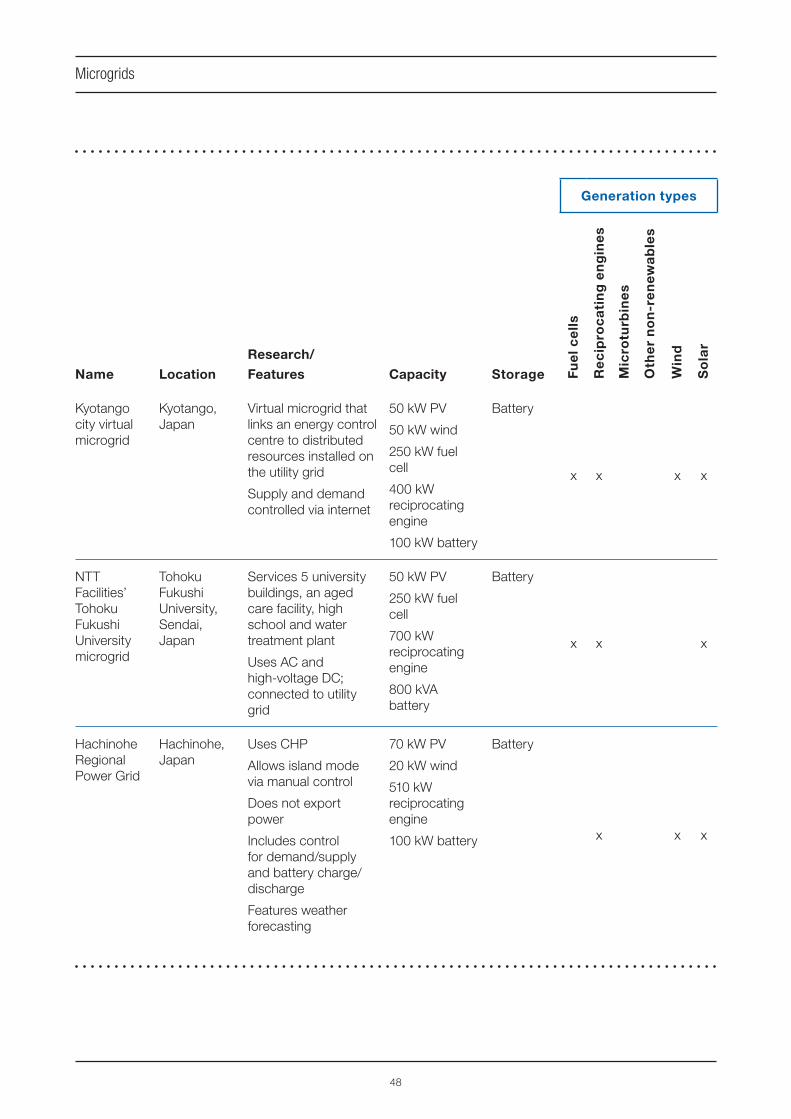
48
Microgrids
Name Location
Research/
Features Capacity Storage
Generation types
Fu
el
ce
lls
Re
cip
roc
ati
ng
en
gin
es
Mic
rotu
rbin
es
Oth
er
no
n-r
en
ew
ab
les
Win
d
So
lar
Kyotango
city virtual
microgrid
Kyotango,
Japan
Virtual microgrid that
links an energy control
centre to distributed
resources installed on
the utility grid
Supply and demand
controlled via internet
50 kW PV
50 kW wind
250 kW fuel
cell
400 kW
reciprocating
engine
100 kW battery
Battery
x x x x
NTT
Facilities’
Tohoku
Fukushi
University
microgrid
Tohoku
Fukushi
University,
Sendai,
Japan
Services 5 university
buildings, an aged
care facility, high
school and water
treatment plant
Uses AC and
high-voltage DC;
connected to utility
grid
50 kW PV
250 kW fuel
cell
700 kW
reciprocating
engine
800 kVA
battery
Battery
x x x
Hachinohe
Regional
Power Grid
Hachinohe,
Japan
Uses CHP
Allows island mode
via manual control
Does not export
power
Includes control
for demand/supply
and battery charge/
discharge
Features weather
forecasting
70 kW PV
20 kW wind
510 kW
reciprocating
engine
100 kW battery
Battery
x x x

49
Microgrids
Name Location
Research/
Features Capacity Storage
Generation types
Fu
el
ce
lls
Re
cip
roc
ati
ng
en
gin
es
Mic
rotu
rbin
es
Oth
er
no
n-r
en
ew
ab
les
Win
d
So
lar
CSIRO
Energy
Technology
Centre
microgrid
Newcastle,
New South
Wales,
Australia
Real-world system
designed to also
operate as an
experimental facility
Allows islanding,
import and export of
power
110 kW PV
60 kW wind
150 kW
turbines
3 kinds of
battery,
fourth type
planned x x x
Verve
Energy’s
Bremer Bay
wind-diesel
system
Bremer Bay,
Western
Australia,
Australia
40 % wind penetration
Currently an isolated
microgrid, with plans
for future utility grid
connection (though
export is unlikely)
1.3 MW
reciprocating
engine
660 kW wind
Unknown
x x
King Island
microgrid
King Island,
Tasmania,
Australia
18 % wind penetration
Services the island
community
110 kW solar
1 MWh battery
2.45 MW wind
Flow-
battery x x x
Cape Verde
wind-diesel
systems
Cape Verde
Islands
collection of remote
islands with wind-
diesel systems
Wind penetration
levels between 14 %
and 6 %
Between 4 MW
and 12 MW
reciprocating
engine
Between
600 kW and
900 kW wind
Unknown
x x
Powercorp
Flores
Island
microgrid
system
Flores Island,
Azores,
Portugal
Studies have
investigated impact of
penetration levels on
system stability
Achieved >50 % wind
penetration
600 kW
reciprocating
engine
1.48 MW hydro
600 kW wind
Unknown
x x

50
Microgrids
Name Location
Research/
Features Capacity Storage
Generation types
Fu
el
ce
lls
Re
cip
roc
ati
ng
en
gin
es
Mic
rotu
rbin
es
Oth
er
no
n-r
en
ew
ab
les
Win
d
So
lar
CICLOPS
microgrid
Soria, Spain Designed for
experimentation
Not strictly a
microgrid as the
three sources are
coupled to a single
common DC bus
20 kVA
reciprocating
engine
595 Ah battery
5 kW solar
7.5 kW wind
Battery
x x x
CESI
RICERCA
microgrid
test facility
Milan, Italy Features CHP
Reconfi gurable
topology
Allows island mode
Includes load banks
7 kW
reciprocating
engine
24 kW solar
8 kW wind
(simulated)
10 kW bio-mass
105 kW
microturbine
3 kW fuel cell
108 kW battery
100 kW fl ywheel
Battery
and
fl ywheel
x x x
x (sim
ula
ted
)
x
Chengde
microgrid
Chengde,
China
All renewable energy;
Connected to rural
power grid
60 kW PV
90 kW wind
180 kWh storage
Lithium
battery x x
Zhangbei
microgrid
Zhangbei,
China
100 % PV/wind
penetration
Serves a research
department (100 kW)
Uses generation
forecasting
Allows isolated and
grid-connected mode
120 kW PV
20 kW wind
400 kWh storage
Lithium
battery
x x

51
Section 6 Penetration of microgrids
6.1 Challenges and barriers
Whilst microgrid technologies hold great promise
as a transition path to low-emissions electricity net-
works, and as a way of improving the reliability or
resurrection of supply during disasters, a number
of fundamental challenges need to be addressed
before they become commonplace. These chal-
lenges are both technical and non-technical.
6.1.1 Technical challenges
Below are some of the fundamental technical
challenges to be addressed to enable wide scale
microgrid uptake.
6.1.1.1 Synchronizing multiple small
generators
The use of multiple distributed generators can
pose signifi cant challenges in a microgrid that is
not currently connected to a functioning wider grid.
In short, without the “inertia” provided by the wider
grid, the multiple small generators lose any form of
central stabilizing force. This can cause problems,
particularly with frequency and voltage stability. Such
issues are solved by developing intelligent control
schemes that synchronize the various devices. But
there are trade-offs. They typically rely on having
a relatively fast and ubiquitous communications
network available to link the various microgrid
components. Ultimately, although solutions exist,
the operation of a power system based on many
small components rather than one large generator
is a more complex task than current engineering
approaches are accustomed to.
6.1.1.2 Intermittent generation sources
Distributed generation based on renewable sources,
such as wind or solar, can pose an extra challenge
to microgrid development. The intermittency in the
power supply available from renewable generation
(caused by, for example, wind gusts or clouds
passing overhead) means that not only is power
fl ow bi-directional, but the power being fed into
the system from such sources at any one time can
vary randomly. Solutions here range from the use
of batteries or other energy storage to smooth out
generation intermittency, through to tighter coupling
of supply and demand to ensure demand matches
intermittent supply, and forecasting techniques
that can aid system management by predicting the
profi le of future generation.
6.1.1.3 The use of inverters
In a microgrid, inverters convert the DC output of the
generator to AC, control the frequency of this supply,
monitor power fl ows in the network, and provide
basic fault and isolation protection. The challenge to
successfully integrating inverters into the microgrid
is being able to facilitate parallel operation of
inverters serving potentially heterogeneous sources,
without loss of synchronization, propagation of
harmonics or loss of stability in general. Having a
small number of inverters presents a challenging,
but well-studied, dilemma. If the inverters use
centralized or master-slave control, current sharing
is enabled but high-bandwidth links are required
to facilitate the distribution of error signals [9]. In
contrast, distributed, on-board (to the inverter)
control reduces the bandwidth but at the cost
of synchronization diffi culties [9]. Though such

52
Penetration of microgrids
techniques appear well understood, they focus
upon systems with very few inverters. For larger
microgrids with numerous inverters, the available
literature is less comprehensive and doubts
remain as to the scalability of those techniques
proposed for small-scale systems. In particular,
given the complex interactions that may occur
between inverters [9], there is increasing potential
for problematic emergent phenomena to appear
as the size grows. Predicting and controlling such
behaviour is diffi cult and has not been suffi ciently
explored in earlier work.
6.1.1.4 Planning and design of microgrids
A large number of quite different devices make
the design of microgrids quite complex. Issues of
installation cost, environmental impact, line loss,
grid connectivity, reliability, resource longevity, reuse
of waste heat, capacity for intentional islanding and
physical constraints all affect the decision-making
process. Often, a goal such as maximized reliability
will confl ict with another such as minimized
operating costs. Overall, the complexity means
heuristics or rules-of-thumb for microgrid design
are inappropriate if an optimal or near-optimal
system confi guration is required. Sophisticated
design tools using artifi cial intelligence approaches
are needed for optimal microgrid planning, and
such tools are only now being realized.
6.1.1.5 Islanding
A central benefi t of the connected microgrid,
particularly in disaster relief, is the capacity to ride-
through failures which occur on the utility grid,
with limited loss of localized service. By rapidly
disconnecting from a faulting system (intentional
islanding), adjusting local generation and shedding
non-priority loads, particularly high levels of
reliability can be guaranteed for priority resources
on the microgrid. However, achieving this goal is
not straightforward. First, the fault condition on the
wider grid must be detected. Then, the microgrid
must transition to island mode in a controlled
manner – with the variety of distributed resources
cooperating, and the loads being batched to the
available generation capacity, which may include
shedding some low-priority loads. Finally, when
the fault on the wider grid is cleared, the microgrid
must be able to make the transition back to
normal service. Managing each of these phases is
a signifi cant technical challenge, and much work
remains to develop reliable, fl exible and affordable
microgrid controllers that can realize these goals.
6.1.1.6 Microgrid modelling
Microgrids are expensive to install and set up for
research purposes. Researchers and developers
often rely on software tools to model and then
predict the performance of microgrids but there is
no single tool available that is immediately suitable.
Further, in spite of the fact that many DER have
existed for some time, there are few accurate
models of wind turbines, solar PVs and fuel cells,
along with their associated controllers, currently
available [10] to use in existing modelling tools.
There is likewise no consensus on models used for
the economic planning of microgrids. Research is
currently underway to develop various models that
serve the needs of the particular research interests
of the modeller, for example, optimal operation
based on 30 minute demand data [11], [12].
Models of real time markets are being developed
[13] to investigate how microgrids can operate as
autonomous entities within the wider market.
Ultimately, the entire area of microgrid modelling,
from engineering to economic, is relatively
immature, and needs signifi cantly more work.
6.1.1.7 Microgrid protection
In general, devices, such as circuit breakers, that
detect and isolate faults in electricity systems
are specifi ed assuming that the source has an
available fault current much higher than the load.

53
Penetration of microgrids
In a microgrid, electricity can often fl ow in multiple
directions, depending what state the microgrid is in
at a particular time. This makes the planning and
operation of protection systems quite a challenge.
Compounding these challenges, faults may be
diffi cult to detect in microgrids, which often do
not have high fault currents, unlike the traditional
macrogrid. In such circumstances, a short circuit
scenario may be diffi cult to detect, as the short
circuit current was similar to the regular operating
state of the microgrid.
6.1.2 Non-technical barriers
As a new technology that represents a fundamental
shift in how we operate our power systems, a
number of non-technical barriers to microgrid
operation also exist.
6.1.2.1 Cost of microgrids
A barrier to the uptake of microgrids is often
the perceived higher fi nancial cost of DER
compared with generation in centralized power
stations. In particular, the higher per-kilowatt
price of distributed generators is often cited as a
drawback, while doubts remain about the on-going
maintenance and operation costs. Recent studies
however have found that the cost of generating
power in a microgrid is comparable with present
electricity supply, as long as support for PV is
available [10]. Moreover, in developing countries
without infrastructure, DERs may be more likely to
be cost effective, since their installation cost must
be compared with that of installing high voltage
transmission lines [14].
Financial cost features regularly in optimization
studies of microgrids, typically offset against other
desired properties, such as CO2 reduction. A great
deal of effort is being given to developing microgrid
models that will help calculate this offset. A case
study of the hypothetical installation of DERs in
a hotel reveals a 10 % cost saving and 8 % CO2
saving [15]. Behind these models are assumptions
about the cost of electricity sourced from traditional
power stations, which may prove incorrect when
a CO2 tax (or a similar mechanism) is imposed or
costs change as a result of new technologies.
6.1.2.2 Business models
Compounding the cost challenges of microgrids
is the broader problem of calculating their returns,
in order to justify their commercial benefi ts to a
business. In a simple analysis, a microgrid may
only operate as a system to provide uninterruptible
power after a wider electricity outage. Calculating
the fi nancial benefi t from this service, versus the
cheaper and less complicated option of insurance
can be a challenging prospect.
More sophisticated uses of microgrids may in fact
earn the owner a return – as discussed earlier in
this White Paper, microgrids may participate in
demand side response or similar programmes,
earning a return for the response they provide.
Whilst conceptually relatively simple, estimating the
actual returns from such concepts is quite diffi cult –
currently, the returns from participation in demand
side markets vary dramatically based on jurisdiction,
location and what incentive programmes are
currently in place. Add complications such as
varying fuel prices, and the risks inherent with new
technology, and calculating a business return from
microgrids is a challenging task.
6.1.2.3 Risk evaluation
Whilst one of the key benefi ts of microgrids is to
help with preparedness and recovery from major
electricity outages, the actual risk a particular
plant faces against such disasters is often poorly
understood. As shown in many of the case
studies in this White Paper, humans are generally
poor at estimating risks and their consequences,
the likelihood of major electrical outages, their
length, and subsequent effects on business. It

54
Penetration of microgrids
is understandable that stakeholders may also
underestimate the benefi ts a microgrid may offer.
6.1.2.4 Policy, regulation and standards
The microgrid concept is relatively new, so it is
not surprising that the regulatory framework for
integration of microgrids into the wider grid is still
developing [16]. Getting this framework right is
crucial, as it deeply affects the economic benefi ts
of microgrids [17]. It is clear that the current
framework poses some barriers for the uptake
of microgrids [15]. For example, IEEE Standard
1547 requires that grid-connected power inverters
can detect a grid fault and will shut down in that
event. Consequently, commercial inverters are
designed to do just that, and there is no incentive
for them to offer island transition and support of
uninterruptible supply in microgrids. This standard
is driving research into the static switch, which can
disconnect and reconnect in sub-cycle times [18].
At the operational level, there is no agreed policy
relating to the way microgrids should behave under
different operating conditions, such as with light
or heavy loads, with or without grid connection or
after communication failure (see, for example, [19]).
Research into standards is being conducted for the
operation of microgrids [20] and a new generation
of energy management systems is being designed
to meet the challenges, in particular to meet the
requirements of International Standard IEC 61970
[21]. The work as yet is in its early stages.
The potential for a microgrid to be owned by
different entities with confl icting interests is
also problematic. Policies should address how
investment and maintenance costs should be
apportioned between parties, what loads are to be
disconnected in the event of faults and what (if any)
compensation should be due in the event of a loss
of power.
6.1.2.5 Training
Perhaps one of the greatest challenges to the
widespread acceptance and uptake of microgrid
technologies is the general lack of familiarity with
the basic concepts behind them. As a relatively
new technology, there is a lack of confi dence in
dealing with the concept and in some cases ill-
informed preconceptions about their challenges.
This concern exists among legislators, electricity
systems operators and even technical personnel
responsible for microgrid design and installation.
Perhaps the latter category is the most worrying
– currently, in many countries and jurisdictions,
there is a general lack of awareness around the
design and construction of electrical systems with
embedded generation, two-way power fl ows,
islanding and other key characteristics. Such
issues can certainly be addressed by professional
development programmes, and need to be a key
consideration for the widespread uptake of these
technologies.
6.2 Future trends
As a rapidly developing technology, it is always
diffi cult to predict how the broader industry around
microgrids may develop. When considering the use
of microgrids for disaster relief, it is worth exploring
some of the possibilities. The following sections
introduce some of the most recent concepts being
considered.
6.2.1 Virtual microgrids
This White Paper defi nes a microgrid as having
a number of generation sources located
geographically close to each other. Intuitively, to
have any benefi t, generators must be connected
to the same electrical network, yet some of the
benefi ts of microgrids are possible with generators
remaining geographically distant. Such a scenario
can be referred to as a virtual microgrid.
55
Penetration of microgrids
One commercial example of a virtual microgrid
is with deregulated energy markets, where an
electricity retailer may benefi t from distributed
generation sources. When a retailer is exposed
to volatile electricity markets, it may use demand
management, or distributed generation, to help
manage its fi nancial risk. In this situation, the
retailer benefi ts simply by being able to dispatch
generation to reduce its total overall load profi le. It
does not matter where the generators are located,
or how they are electrically connected, as long as
they are customers of this particular retailer.
In the context of disaster preparedness or relief,
virtual microgrids may be relevant because they
bring a situation in which the entity controlling
the microgrid may have to manage a number
of disparate devices, residing in geographical
locations that have experienced quite different
conditions during the electricity outage.
6.2.2 Resource networks
This White Paper has focused on microgrids as
a network of electricity generators, yet in many
applications, electricity is only one of the key
resources at play. Water, gas and other resources
have their own distribution networks, and these
may interact with that of the microgrid. Ideally,
when considering broader resource management
questions, it is important to consider the interplay
between these various resources.
Recent research suggests that a microgrid should
not be studied as a network of electrical devices,
but, rather, as a network of key resources and
functions. This might include the provision of reliable
electricity and water supply, the use of natural gas,
and perhaps the provision of heating or cooling.
Whilst research or development around microgrids
of multiple resources is relatively immature, for
now we can make one key conclusion regarding
microgrids for disaster relief and preparation. As
was seen in the Roppongi Hills case study, for
an electrical microgrid that may be dependent
on other resources, such as gas fuel supplies,
factoring in such dependencies will be critical to
reliable microgrid operation.
6.2.3 Clustered microgrids
In this White Paper, microgrids have generally
been considered as a standalone entity, with the
focus being on how a single microgrid can restore
or maintain electricity supply within itself or (for
example) the challenges of managing multiple
resources within one microgrid. When microgrids
proliferate, a number of microgrids could possibly
be coordinated together. Such coordination
would involve using a hierarchical structure. With
no hierarchy, large numbers of microgrids being
controlled by one entity essentially face the same
challenges as in operating today’s macrogrid. On
the other hand, adding too many levels of hierarchy
adds overheads to the system, wasting resources
and slowing responsiveness.
In relation to disaster relief or preparedness,
clustered microgrids would have an impact similar
to that of the concept of virtual microgrids discussed
earlier. They would add to the management
complexity, but at the same time bring additional
fl exibility to the power system.


57
Section 7 Conclusions and recommendations
7.1 Conclusions
Large-scale disasters, from natural disasters such
as the Great East Japan Earthquake and tsunami,
to man-made disruptions such as the cascading
supply failures in Europe or India, come at a
huge cost to local communities, businesses and
society at large. Such costs are often caused by
the electrical outages frequently associated with
widespread disaster. Unfortunately, the number of
widespread electrical outages is growing. With our
modern dependence on electrical energy, it is clear
that the current state of affairs needs to change. We
need a way of strengthening our electricity supply
against disasters and, in the worst-case scenario,
providing rapid restoration of supply.
The predominant reason given for the cessation of
business after major disasters such as the Great East
Japan Earthquake is the interruption of electricity
supply. Often, such supply interruptions were not
anticipated, or adequately planned for. In considering
the case studies of major electrical disasters around
the world, it is clear that more needs to be done in
planning for electricity supply failure, and preparing
plans for the restoration of electricity supply and
continuation of business. Improving plans and
resilience against electricity supply failure will require
a broad range of activities – from the preparation
of standard ways to classify the potential impact
of disasters, or a facility’s own resilience against
disaster, to identifying dependencies such as fuel
supplies after road blockage, or even prioritizing
energy demands during times of constrained
supply. An initial starting point may be to take a
similar approach as in the burgeoning area of BCP,
and for individual businesses to carefully plan the
continuity of electricity supply, and all it entails.
ECS and ECP will be useful for administrations,
companies and end-users. In governments,
leadership is necessary so that they enhance the
plan of disaster countermeasures and provide
examples for the countermeasures. It is strongly
expected that companies enhance their planning
by including ECP as a business system and by
developping and adding functions to their products
aimed at contributing to the preparedness and the
quick recovery against disasters. These evaluation
methods require the IEC aid and supervision.
For end-users, education and training are very
important.
ECS and ECP must be designed for each
market based on scalability and interoperability.
Standardized guidelines could propose electricity
continuity, evaluation against disasters, certifi cation
for insurance against disasters and assessment of
ECP and ECS (see Figure 7-1).
One technology that can play a signifi cant part in
planning for more resilient and reliable electricity
supply systems is the microgrid, which builds on
the benefi ts of distributed generation technology.
Distributed generation, in the form of local gas or
diesel engines, through to rooftop solar systems
or even energy storage devices, is a relatively
common part of today’s electricity systems.
Distributed generators are now an accepted
means to improve the reliability of electricity supply
at their host site, acting as uninterruptable power
supplies. Yet today we are failing to realize the full
potential of distributed generators. By coordinating
multiple distributed generators, and integrating
control of loads with this function, we realize the
concept of a microgrid. Microgrids bring additional
benefi ts, such as improved reliability (no single

58
Conclusions and recommendations
point of failure), lower emissions through providing
for renewable energy supply, and even allowing for
the export of power to wider areas of the electricity
system.
This White Paper presents some examples of
microgrids around the world, also reviewing in detail
a number of microgrids that were able to maintain
electricity supply even after major disasters. In these
examples, ranging from single houses through to a
data centre or even broader commercial campus,
the resilience of the electricity supply improved
dramatically by having a carefully planned microgrid
based around a diversity of electricity generators,
operating closely with loads, and tied together with
an intelligent energy management system.
As a new technology, microgrids are not without
their challenges. As well as detailing the potential
benefi ts from microgrid technology, this White
Paper also examined some of the challenges to
their operation, from technical challenges such as
the lack of standards that specify common control
interfaces between devices in microgrids, through
to non-technical challenges such as appropriate
business models to support the business case for
microgrid development.
Following the examination of the recent major
electrical disasters, the response to these disasters,
and the availability of new technologies such as
microgrids, several recommendations can be made
for policy-makers, industry and standardization
organizations, aimed at improving the resilience of
our communities against electrical failure.
7.2 Recommendations for
policy-makers and regulators
7.2.1 Encourage the development of
electricity continuity planning and
systems
An ECP and ECS will ensure that poten-
tial disasters have been considered, and lo-
cal plans have been developed for the
restoration of power supply, emergency lighting,
telecommunications, and water and sewerage fa-
Safety, security and prevention of disaster planning and enforcement
Disaster countermeasure and strengthen BCP by ECP
1) Evaluation
ECS classification against disaster
2) ECP for users
Action plan when black out happened
3) Certification
Investment and insurance against disaster
4) Revision
ECS/ECP assessment by survey of disaster damages
Disaster-resistant systems, products and devices
Education and training for disaster prevention
Pub
lic
adm
inis
trat
ion
Com
pani
es
Use
rs
ECS/ECPMain market
Figure 7-1 | Main market for ECS/ECP

59
Conclusions and recommendations
cilities immediately following the loss of electricity
supply.
7.2.2 Consider the interaction of energy
supply and supporting utilities
When developing disaster recovery plans, regulators
need to consider the interaction of outages
between the end user’s energy supply system, and
supporting utilities such as telecommunications or
gas supply. These systems have proven critical to
one another’s operation, yet are often considered
in isolation.
7.2.3 Remove barriers and consider
incentives for demand-side measures
Policy makers should consider the benefi ts that
could be achieved from distributed generation, load
management and microgrid technologies, effectively
removing regulatory barriers to their operation.
In many jurisdictions, there is little incentive for
utilities to encourage such technologies, and
securing permission for grid connection can be a
cumbersome process.
7.3 Recommendations for utilities,
industry and researchers
7.3.1 Develop electricity continuity plans
Whilst many industries have disaster response
plans, these are generally focussed on the orderly
shutdown of a plant following a major disaster,
in order to preserve human safety and minimize
environmental issues. Industries should also
develop plans to re-establish their operations,
particularly after widespread electricity outages.
Such plans may consider the use of local
generation, the priority of loads, and other key
service dependencies. Such plans are likely to rely
on standards (yet to be developed) that include
specifying the nature of potential disasters, and
the resilience of a particular facility against these
disasters.
7.3.2 Consider microgrids as a broader
electricity system asset
Today, most thinking around distributed generation
or microgrids sees them as only benefi cial to a local
site. Yet microgrids offer many benefi ts to the wider
electricity system, both in normal operation, as well
as following a disaster. If regulators, operators and
owners start to consider microgrids as a broader
asset to the electricity system, reduced barriers,
reduced costs and greater impact are likely to
result.
7.3.3 Design microgrids to contain a
signifi cant amount of renewable
generation
Whilst microgrids have great potential to provide
uninterruptable energy supply, many of the case
studies in this White Paper showed that microgrids
that rely on diesel or gas supply are likely to suffer
from limited fuel availability after major disasters,
which will limit their usefulness. Whilst microgrids
that are predominantly based on renewable
energy will require advanced control mechanisms,
additional energy storage, load and supply
integration, they bring many benefi ts for disaster
preparedness and resilience.
7.3.4 Design microgrids and related
technologies around “plug and play”
principles
Microgrids are currently “bespoke” technologies
that are engineered from scratch to coordinate
multiple generators and loads, for one particular
deployment. Today’s microgrids do not allow an
operator to easily bring a new load or generator into
the microgrid, and coordinate it with all the other
components, or to easily introduce a microgrid to
60
Conclusions and recommendations
a new site. To reduce the cost of microgrids and
increase their uptake, a “plug and play” mechanism
needs to be developed, allowing for simple addition
of devices to – or reconfi guration of – the microgrid,
without the need for major additional engineering
work.
7.4 Recommendations for the IEC
and its committees
7.4.1 Develop guidelines to classify a
facility’s disaster preparedness
There is currently no uniformly accepted standard
that describes how resilient a particular facility is
against outside electricity supply failure. Whilst this
White Paper provides some early suggestions for
a classifi cation framework, more work is needed
to develop a classifi cation system that covers
a wide range of facilities and potential disasters.
Such standards are critical to the preparation of
detailed electricity continuity plans for a local site,
and the comparison of such plans across different
sites. These are desirable to be specifi ed as cross-
cutting guidelines.
7.4.2 Develop guidelines to classify how a
microgrid operates
Once a facility has a microgrid in place, there
are many ways it may operate – it may be able
to autonomously re-connect to the grid, it may
have only ten minutes of local energy supply, it
may not be able to operate islanded, etc. There
is currently no uniformly accepted standard that
helps to understand how microgrids behave, or
interact with the wider electricity system. Whilst
this White Paper provides some early suggestions
for a classifi cation framework, more work is needed
to develop a system that covers a wide range of
microgrids and potential operations.
7.4.3 Review the above guidelines when
major disasters happen
It is always diffi cult to predict the impact and likely
best responses to a particular disaster, so much
can be learnt from the analysis after a major
disaster such as the Great East Japan Earthquake,
and the responses that ensued. All organizations
should revise their preparatory material following a
major disaster – from electricity continuity plans for
one particular business, through to classifi cation
systems, and/or IEC International Standards.

61
Annex A Case studies
General
In order to provide a starting point to understand
the level of disruption a natural or man-made
disaster can impose on the supply of electricity
to the world’s population, nine case studies are
presented here. The studies represent a cross-
section of events that caused large numbers of
electricity customers to be affected.
Besides the historical facts given in each case study
in T`ables A1 to A9, a “lessons learnt” summation
is also provided. These lessons will allow utilities,
planners and standards providers to develop
guidelines in preparing for future outages.
Disaster name and date Hurricane Sandy (superstorm)
29 October 2012
Duration of electricity outage (macrogrid) See Figure A1-2
Duration of electricity outage (internal to site) Approximately 10 days
Duration between disaster and electricity
supply failing
From minutes to no more than a couple of hours
with respect to the storm eye making landfall
Number of people affected More than 8 million customers (i.e. more than
20 million people)
Total generation capacity lost (MW) 300 MW in Manhattan’s thermal power plant;
9 MW solar rooftop outside Philadelphia;
3.2 MW Linden PV solar farm; preventive shut
down of 3 250 MW in 3 nuclear power plants
Total transmission/distribution capacity lost
(MW)
Unknown. Little damage to the transmission
portion but signifi cant damage to the distribution
portion
Estimated cost of disaster US Government estimates at more than
USD 70 billion
Type of facility that was affected Telecommunications central offi ce
Table A1 | Case study 1: Hurricane Sandy, USA, 2012

62
Case studies
What caused the electricity supply failure
Superstorm Sandy was a post tropical cyclone (hurricane with low temperature centre of circulation) that
affected the Northeastern US in late October 2012. Although Sandy’s wind speeds were at the low end of
hurricane strength, Sandy’s extensive size caused a large storm surge that affected coastal areas. Even when
the winds were not particularly intense compared to many other hurricanes, the presence of many trees
in this area and the large size of the storm caused many outages, mostly at the power distribution level of
electric grid, in this case mostly overhead lines.
How was electricity supply restored (internal to site)
Verizon’s Garden City Central Offi ce building, powered by seven UTC 200 kW fuel cells in grid connected
mode and by three 1.6 MW diesel engine-generators in grid islanded mode never lost power.
How was electricity supply restored (macrogrid)
By conventional means. Power restoration in the general area where this site is located (Long Island) was
considered to be uncommonly slow [22] which prompted an investigation by the State of New York on the
electric utility serving this area (Long Island Power Authority) and the resignation of LIPA’s president.
What lessons can we learn about electricity supply resilience, restoration, or microgrid operation
from this disaster?
Little damage to the power grid leads to extensive power outages. Buried infrastructure tends to be more
resistant to hurricanes but damage takes signifi cantly longer to be repaired. Microgrids powered by sources
using natural gas may be a good solution for hurricane-prone areas. Several sites relying on onsite standby
diesel generators lost power due to engine fuel starvation originated, in turn, by diesel and gasoline supply
disruptions.
Also to be considered:
Proper vegetation management is important to avoid trees falling on utility lines
Back-up generators should be tested for their reliability to ensure that in the event of power loss they can
be switched on without problem. Storing enough fuel for these generators to operate for more than one
day is advised
Most grid-connected solar PV systems were not operational because of safety systems installed to
protect utility workers and grid integrity on restart (anti-islanding feature). Availability of even a limited
amount of renewable energy, such as solar or microwind, combined with energy storage and a secure grid
disconnect mechanism, would allow buildings to provide critical services over an extended period of time
Microgrids, supported by distributed energy generation, are a potential solution, as they allow decentralized
energy distribution at a community-based scale. The application of district heating, cooling and energy
plants and renewable energy generation is more scalable, cost-effective and resilient at a community level
than their use in individual building applications. Water treatment and other critical services can also be
provided more cost-effectively within a community-scale microgrid

63
Case studies
Figure A1-1 | Seven 200 kW fuel cells at
Verizon’s Garden City Central Offi ce on 3rd
November 2012 [23]
Figure A1-3 | Preliminary information on
the percentage of power grid components
damaged during superstorm Sandy [23]
Figure A1-2 | Superstorm Sandy: preliminary information about power grid outages duration (left)
and incidence (right) [23]
Outage incidence indicates the
peak percentage of electricity
customers in a county experi-
encing a grid power outage with
respect to total number of elec-
tricity customers in the county.

64
Case studies
Disaster name and date Pacifi c coast of Tohoku Earthquake Tsunami (the
Great East Japan Earthquake and Tsunami)
11 March 2011
Duration of electricity outage (macrogrid) Maximum duration 99 days
Duration of electricity outage (internal to site) N/A
Duration between disaster and electricity supply
failing
Immediate (but further destroyed by tsunami within
minutes of the earthquake)
Number of people affected 8.45 million houses
Total generation capacity lost (MW) 28 000 MW (including overall earthquake)
Total transmission/distribution capacity lost (MW) Included in the above item
Estimated cost of disaster JPY 25 trillion (including overall earthquake)
Type of facility that was affected N/A
Table A2 | Case study 2: Great East Japan Earthquake and Tsunami, 2011
What caused the electricity supply failure
The Great East Japan Earthquake occurred at 2.40 pm on 11th March 2011. The seismic centre was 130 km
east of the Tohoku region of Japan. A magnitude 9.0 earthquake, it was the largest earthquake in Japan’s
history, and the focal region was vast – 500 km by 200 km (= 100 000 km2).
The earthquake triggered a tsunami which hit the length of Japan’s east coast, with water reaching a height
of more than 10 m and peaking at more than 40 m. It was also the largest tsunami in Japan’s history.
The Pacifi c coast of east Japan suffered catastrophic damage. The tsunami wave crashed over seawalls and
the body of water went up river reaching several kilometres inland, fl ooding a total area of 561 km2.
As the wave crashed through, it carried with it rubble, ships and vehicles. That debris was then dragged out
to sea before being washed back inland, again and again.
The water and heavy debris destroyed many buildings and severely damaged others with collapsed ceilings
damaging electrical cabling and equipment.
Power systems including generation plants, power lines and substations were also destroyed by the tsunami.
The Daiichi Fukushima Nuclear Plant was hit by water 15 metres high at 3.27 pm and at 3.35 pm 40 to 50
minutes after the earthquake.
All power was lost including the back-up generation system which then disabled cooling of the nuclear
reactors. This chain reaction caused hydrogen explosions and melt-downs at 3 reactors. Thermal power
plants on the coastline were also damaged by the tsunami. None of the reactors could resume operation.
4.4 million customers of Tohoku Electric Power Company and 4.05 million customers of TEPCO lost power
after the earthquake.

65
Case studies
How was electricity supply restored (internal to site)
Data centres could continue operation thanks to back-up generators. A microgrid facility in Sendai, also
continued to supply power.
How was electricity supply restored (macrogrid)
Electricity supply was restored by 19 March to the area supplied by TEPCO, and the number of homes
without power was reduced to 160 000 in the area supplied by Tohoku Electric Power Company. Rolling
blackouts were conducted on 28 March due to the shortage of power supply in the TEPCO area, caused in
turn by the destruction of power plants.
Again 400 million homes lost power because of aftershocks on 7 April.
It took 99 days (18 June) for complete restoration.
Mandatory power savings of 15 % were implemented in the Tohoku Electric Power Company and TEPCO
areas in the summer of 2011.
Municipal government refused to agree to the resumption of operation of nuclear power plants after
maintenance. This decision caused electricity shortages in many regions of Japan that had not been damaged
by the tsunami or the earthquake.
What lessons can we learn about electricity supply resilience, restoration, or microgrid operation
from this disaster?
The tsunami was unprecedented, and existing breakwaters and seawalls were demonstrably inadequate in
protecting the coastline. This has led to a revision of the potential scale and nature of disasters in the area.
The disaster plan designed to prepare for such events is now being revised. The region’s large power plants,
including nuclear and thermal power plants, are located along the coastline for cooling water and refuelling.
The tsunami demonstrated that critical facilities such as these must be installed higher above sea level.
Damage to electrical facilities, including nuclear power plants, caused loss of power for long periods, resulting
in a critical accident.
The tsunami also highlighted the importance of increasing power interchange capacity and the need to
install local photovoltaic generation and batteries. Rolling blackouts severely affected the private sector and
also demonstrated the importance of providing a minimum power supply to business facilities that need
continuous power supply.

66
Case studies
Disaster name and date Chinese winter storms
2008
Duration of electricity outage (macrogrid) About 2 months from the beginning of the storms
to restore power supply to all customers
Duration of electricity outage (internal to site) Not a microgrid case
Duration between disaster and electricity
supply failing
N/A
Number of people affected 129 people died; 1.66 million were relocated,
and many more were affected in power,
communication and traffi c systems interruption,
house collapse and damages to crops
Total generation capacity lost (MW) N/A
Total transmission/distribution capacity lost
(MW)
About 36 000 power lines (10 kV and above)
failed; 8 000 transmission towers (110 kV and
above) collapsed; 2000 substations failed
Estimated cost of disaster Direct economic loss: nationwide more than RMB
0.15 trillion; power industry about RMB 25 billion
Type of facility that was affected Transmission lines/towers, distribution lines/
poles, substations
Table A3 | Case study 3: Chinese winter storms, 2008
What caused the electricity supply failure
A series of long-lasting winter storms with heavy snows, ice and abnormally cold temperatures caused heavy
icing on power grid facilities, exceeding the designed ice thickness the facilities should be able to withstand.
Coal supply for thermal power plants was affected by interruption of transportation.
How was electricity supply restored (internal to site)
Not a microgrid case
How was electricity supply restored (macrogrid)
Hundreds of thousands of utility staff, thousands of emergency mobile generators and a huge amount of
power network equipment and materials were engaged in the task of de-icing, rush repairs and rebuilding
power facilities.

67
Case studies
What lessons can we learn about electricity supply resilience, restoration, or microgrid operation
from this disaster?
Many of the power systems’ defi ciencies were exposed, including grid structure and strength, generation
mix and distribution, coal supply to power plants, power supply to power system communication links, anti-
icing and de-icing measures, disaster precaution/monitoring, emergency response training of utility staff and
customers, etc.
Theoretically, microgrids might be able to help maintain power supply to critical customers, or even support
in grid splitting and recovery. But concerns were raised on how microgrids can contribute to fi ghting such
long-lasting winter storms, since the transportation of fuels to them may be interrupted, and the sunshine for
PV generation is weak due to the bad weather.
Figure A3 | Ice-damaged transmission tower, China [1]

68
Case studies
Disaster name and date Hurricane Ike
Landfall on 13 September 2008
Duration of electricity outage (macrogrid) See Figure A4-5
Duration of electricity outage (internal to site) N/A
Duration between disaster and electricity
supply failing
In some areas, such as the southern tip of the
Bolivar Peninsula, power was lost about 12 hours
before the hurricane eye made landfall. In the
Ohio River valley outages started more than a day
after Ike made landfall in Texas
Number of people affected About 4 million customers (more than 12 million
people)
Total generation capacity lost (MW) 2 050 MW in Sabine Power plant
Total transmission/distribution capacity lost
(MW)
Unknown. Little damage to the transmission
portion but signifi cant damage to the distribution
portion
Estimated cost of disaster USD 30 billion in 2008
Type of facility that was affected Not a microgrid case
Table A4 | Case study 4: Hurricane Ike, USA, 2008
What caused the electricity supply failure
Hurricane Ike made landfall on the north-eastern coast of Texas on 13 September 2008 as a category two
hurricane in the Saffi r-Simpson scale (maximum of 5). Although its wind strength was moderate, its large size
created a storm surge typical of much stronger hurricanes, which levelled several coastal towns (see for example
Figure A4-1). Having caused signifi cant damage in Texas, the remnants of Hurricane Ike moved north and east
towards the Ohio River Valley, where it combined with a cold front. This combination created a signifi cant storm
that caused major power outages in the Ohio River Valley, more than 1000 miles from Ike’s landfall point. As a
result of these combined effects, Hurricane Ike is still to date the worst hurricane in terms of power outages that
have ever affected the US Gulf Coast area – even worse than Hurricane Katrina (see Figure A4-2).
How was electricity supply restored (internal to site)
The site shown in Figure A4-3 is an apartment complex in the northern tip of Galveston Island. Power to this site
was restored by the deployment of a portable diesel generator provided by the local utility company and that
was connected to the distribution portion of the electric grid. Hence, it can be considered an ad-hoc microgrid.

69
Case studies
How was electricity supply restored (macrogrid)
By conventional means. These conventional means included the deployment of transformers on wheels (see
Figure A4-4) to restore service in damaged substations and replacement of thousands of damaged poles and
hundreds of miles of overhead conductors. Power restoration in the general area where this site is located
took more than 2 weeks. Power restoration and damage intensity information are shown in Figure A4-5.
What lessons can we learn about electricity supply resilience, restoration, or microgrid operation
from this disaster?
Little damage to the electricity distribution grid can lead to extensive power outages. Existence of a microgrid
may have prevented loss of service in most of the areas affected by this hurricane. Deployment of ad-hoc
distributed generation reduced the power outage duration in specifi c sites. Natural gas distribution service
was not signifi cantly affected by this hurricane except in relatively small areas where the damage was
extreme.
Figure A4-1 | Gilchrist, Texas, after Hurricane
Ike [24]
Figure A4-2 | Power outage information of the
2005 and 2008 hurricanes that affected the USA
[25]

70
Case studies
Figure A4-3 | Apartment complex in Galveston Island, Texas, powered by a portable generator
connected to the distribution portion of the grid [24]
Figure A4-4 | Portable transformer used to restore service in a damaged substation [24]

71
Case studies
Figure A4-5 | Power outage duration (left) and intensity (right) due to Hurricane Ike [22] [24]
Figure A4-6 | Power grid damage from records
obtained with fi eld damage assessments [24]

72
Case studies
Disaster name and date River fl oods in Thailand
August-December 2011
Duration of electricity outage (macrogrid) None
Duration of electricity outage (internal to site) 0 to 2 months depending on location
Duration between disaster and electricity
supply failing
1 month
Number of people affected 13 million; 450 people died
Total generation capacity lost (MW) None
Total transmission/distribution capacity lost (MW) 135 MW (lost or shutdown)
Estimated cost of disaster USD 45 billion, mostly economic opportunity loss
Type of facility that was affected Industrial estates, homes and communities
Table A5 | Case study 5: River fl oods, Thailand, 2011
What caused the electricity supply failure
Although river fl oods occur every year in the central areas of Thailand, the 2011 fl ood was the worst in the
previous 50 years. Storms hit the north of Thailand in July-August. Massive volumes of water moved south
and overfl owed rivers in the north and central areas. Flood water levels reached more than two metres
in some places. Due to the fl at plains of the region, the fl ood waters and their effects remained for 2 to 3
months. Hundreds of thousands of people had to be evacuated. Factories in industrial estates had to be
closed and electricity supply shut down. Some transmissions and distribution poles went down and medium
voltage substations were also fl ooded.
How was electricity supply restored (internal to site)
Not a microgrid case
How was electricity supply restored (macrogrid)
There was minimal damage to the macrogrid as none of the energy production facilities were in fl ood areas.
Electricity services were quickly restored to homes and factories after the water receded. Some substations
that were temporarily closed due to fl ood could be activated using spare parts.
What lessons can we learn about electricity supply resilience, restoration, or microgrid operation
from this disaster?
Flooding from rain can be anticipated many weeks before it arrives. Accurate prediction about its volume,
speed and direction can prevent or lessen the severity of the disaster. Electrical equipment such as high
voltage transformers can be elevated to avoid the fl oodwater. Thailand does not have a microgrid. These
fl oods show that if a microgrid facility is in the vicinity of a fl ood area, its capability is jeopardized.
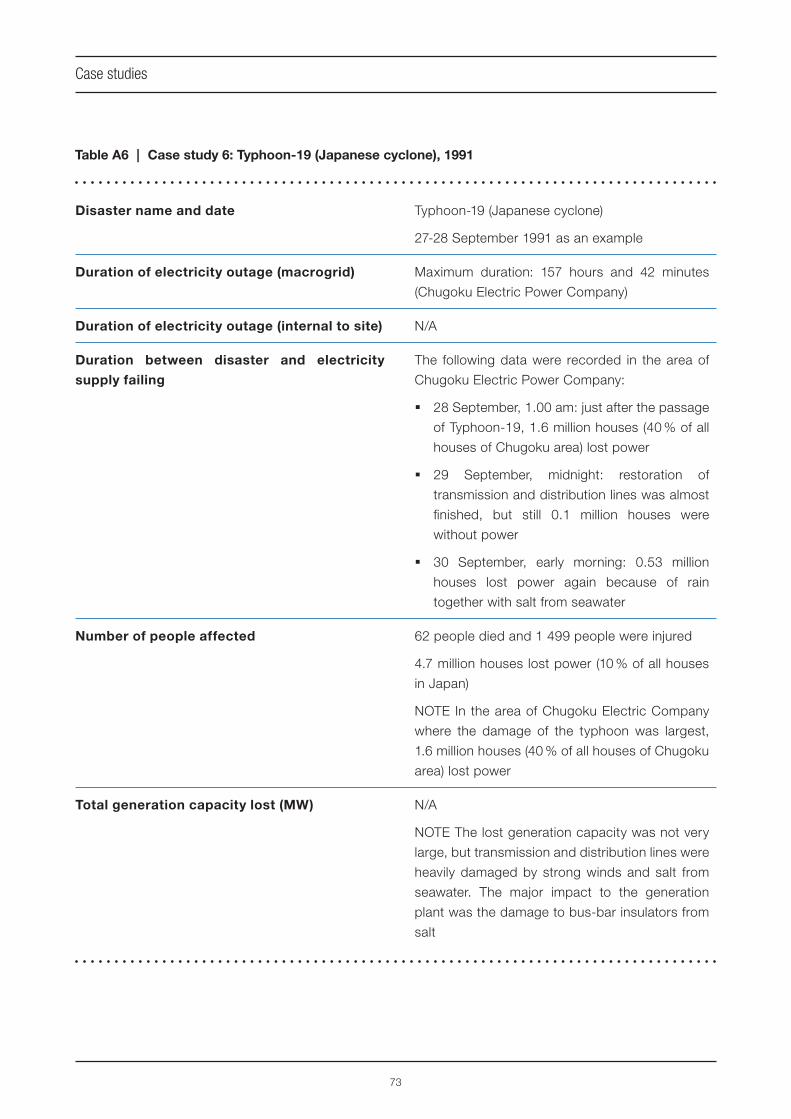
73
Case studies
Disaster name and date Typhoon-19 (Japanese cyclone)
27-28 September 1991 as an example
Duration of electricity outage (macrogrid) Maximum duration: 157 hours and 42 minutes
(Chugoku Electric Power Company)
Duration of electricity outage (internal to site) N/A
Duration between disaster and electricity
supply failing
The following data were recorded in the area of
Chugoku Electric Power Company:
28 September, 1.00 am: just after the passage
of Typhoon-19, 1.6 million houses (40 % of all
houses of Chugoku area) lost power
29 September, midnight: restoration of
transmission and distribution lines was almost
fi nished, but still 0.1 million houses were
without power
30 September, early morning: 0.53 million
houses lost power again because of rain
together with salt from seawater
Number of people affected 62 people died and 1 499 people were injured
4.7 million houses lost power (10 % of all houses
in Japan)
NOTE In the area of Chugoku Electric Company
where the damage of the typhoon was largest,
1.6 million houses (40 % of all houses of Chugoku
area) lost power
Total generation capacity lost (MW) N/A
NOTE The lost generation capacity was not very
large, but transmission and distribution lines were
heavily damaged by strong winds and salt from
seawater. The major impact to the generation
plant was the damage to bus-bar insulators from
salt
Table A6 | Case study 6: Typhoon-19 (Japanese cyclone), 1991

74
Case studies
Total transmission/distribution capacity lost
(MW)
The following data were recorded in the area of
Chugoku Electric Power Company (no available
data for all of Japan):
Transmission: 24 power lines failed, and there
were 28 incident points caused by the collapse
of a steel tower (by strong wind) and salt from
seawater
Distribution: 1 900 distribution poles failed
(causing 64 % power failure of distribution
lines). 14 000 failures of pole transformers
by salt from seawater, and 3 500 utility poles
collapsed
Estimated cost of disaster Payment of insurance: JPY 568 billion
Type of facility that was affected Not a microgrid case
What caused the electricity supply failure
The years 1991 and 2004 were bad for typhoons in Japan. In 2004, more than 10 typhoons hit Japan. In
1991, one big typhoon (Typhoon-19) had a large impact.
On 27 September 1991 at 4.00 pm, Typhoon-19 made landfall in the Nagasaki prefecture and proceeded
north along the shoreline of the Japan Sea. Typhoon-19 was very large: its central pressure was 940 hPa,
its maximum wind speed at the centre was 50 m/s, the storm covered more than 25 km2, it was 300 km in
diameter, with the broader area of strong winds covering 15 km2 from the centre of the storm.
There were record-high winds especially in the Chugoku area. Along its course, many power failures were
caused by damage to transmission and distribution lines caused by strong winds. Power equipment was
also damaged by salt from seawater over a wider area and the salt damage was exacerbated by rain after
the passage of Typhoon-19, which caused secondary power failures – or extended the duration of power
failures, some to more than 157 hours.
It took 6 days to restore power completely after the damage caused by Typhoon-19.
How was electricity supply restored (internal to site)
Not a microgrid case
How was electricity supply restored (macrogrid)
The power utility company conducted the restoration. Shortly after the passage of Typhoon-19, they started
replacement of the collapsed utility poles, steel towers and other power equipment including snapped
transmission and distribution lines.
75
Case studies
What lessons can we learn about electricity supply resilience, restoration, or microgrid operation
from this disaster?
The power utility company is continuously making efforts to reduce the length of power outage after each
disaster. They are making transmission and distribution networks with redundant supplies, constructing
stronger utility poles, and making power equipment resistant to salt damage.
For example, in 2004, Typhoon-18, similar in size to 1991’s Typhoon-19, hit the Chugoku area. But the
damage from Typhoon-18 was remarkably reduced. Only 350 utility poles collapsed, approximately 1/10 of
the number in Typhoon-19. 0.95 million houses suffered power failure, approximately 60 % of those affected
by Typhoon-19.
The best way to prepare is by predicting more accurately the course of the typhoon. By using the
meteorological satellite, the typhoon position is measured every hour, and the predicted course of the
typhoon for the coming 24 hours is updated every 3 hours. With better warning, people can go home from
school, offi ce, etc., to prepare. Factories can shut down their machines and facilities to avoid unexpected
power failure that would damage machines, and prepare to restart.
As for the microgrid, the effects of the typhoon are largely the collapse of utility poles, snapping of
transmission and distribution lines, salt damage by seawater etc. A microgrid system that consists of
underground distribution lines and substations would be preferable. A facility-level microgrid with private
power generation would also be preferable.
A typhoon usually passes in a day and does not damage transport systems supplying fuel. One or two days’
fuel stock may be suffi cient for private power generation.
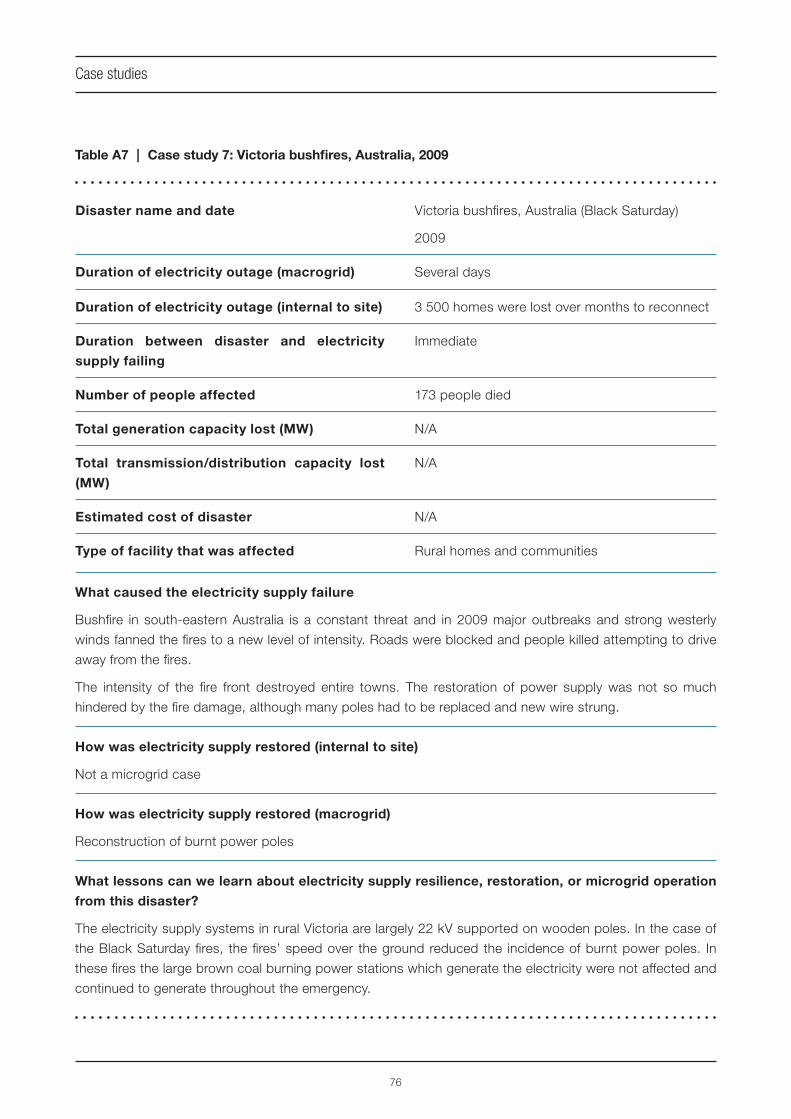
76
Case studies
Disaster name and date Victoria bushfi res, Australia (Black Saturday)
2009
Duration of electricity outage (macrogrid) Several days
Duration of electricity outage (internal to site) 3 500 homes were lost over months to reconnect
Duration between disaster and electricity
supply failing
Immediate
Number of people affected 173 people died
Total generation capacity lost (MW) N/A
Total transmission/distribution capacity lost
(MW)
N/A
Estimated cost of disaster N/A
Type of facility that was affected Rural homes and communities
Table A7 | Case study 7: Victoria bushfi res, Australia, 2009
What caused the electricity supply failure
Bushfi re in south-eastern Australia is a constant threat and in 2009 major outbreaks and strong westerly
winds fanned the fi res to a new level of intensity. Roads were blocked and people killed attempting to drive
away from the fi res.
The intensity of the fi re front destroyed entire towns. The restoration of power supply was not so much
hindered by the fi re damage, although many poles had to be replaced and new wire strung.
How was electricity supply restored (internal to site)
Not a microgrid case
How was electricity supply restored (macrogrid)
Reconstruction of burnt power poles
What lessons can we learn about electricity supply resilience, restoration, or microgrid operation
from this disaster?
The electricity supply systems in rural Victoria are largely 22 kV supported on wooden poles. In the case of
the Black Saturday fi res, the fi res’ speed over the ground reduced the incidence of burnt power poles. In
these fi res the large brown coal burning power stations which generate the electricity were not affected and
continued to generate throughout the emergency.

77
Case studies
Line crews from the distribution companies were quickly on the scene restoring electricity supply but in most
cases the houses which they had supplied had been destroyed.
Nevertheless, it is folly to use wooden poles in fi re-prone areas. Whilst current practice is to use concrete
poles for new construction, millions of older, wooden poles remain, with regulators apparently powerless to
infl uence the distributors to upgrade their old wooden pole assets.

78
Case studies
Disaster name and date Cyclone Tracy, Darwin, Australia
25 December 1974
Duration of electricity outage (macrogrid) Several months; last customer connected
6 months later
Duration of electricity outage (internal to site) 4 days to hospital and emergency services
Duration between disaster and electricity
supply failing
Immediate
Number of people affected 50 000
Total generation capacity lost (MW) Minimal
Total transmission/distribution capacity lost
(MW)
Complete city system lost
Estimated cost of disaster Unavailable
Type of facility that was affected City of Darwin
Table A8 | Case study 8: Cyclone Tracy, Darwin, Australia, 1974
What caused the electricity supply failure
Extreme cyclonic event directly overhead- Cyclone Tracy category four storm. Cyclone Tracy was a very
severe tropical cyclone that hit Darwin (population 50 000) with great precision in the early hours of Christmas
Day in 1974. Wind speeds were not recorded as all wind speed recording equipment was swept away.
However, reverse engineering of the failures of engineered structures produced estimated wind speeds of
between 320 km/h and 350 km/h.
How was electricity supply restored (internal to site)
Not a microgrid case
How was electricity supply restored (macrogrid)
Most buildings and much of the electricity supply system were destroyed. The electricity supply system
consisted of a heavy oil-fi red steam power station, 66 kV transmission system and 11 kV and 22 kV
distribution mostly on overhead steel poles. The power station was damaged but not destroyed and was
able to generate electricity by day 4 to supply the Royal Darwin Hospital. Damage to distribution lines was
the main holdup in reconnecting those customers who were capable of taking supply and the last customer
requiring reconnection was connected in June 1975, about 6 months after the cyclone.
The principal problem for the electricity system was distribution damage. The distribution assets were not
just destroyed by the high winds but by the fl ying debris of thousands of houses blowing apart and impacting
on distribution assets.

79
Case studies
What lessons can we learn about electricity supply resilience, restoration, or microgrid operation
from this disaster?
The lesson for microgrids in cyclone areas is simple – build the distribution underground and harden the
power stations and substations against the effects of wind, water and debris damage.
Figure A8-1 | Cyclone Tracy, Darwin, Australia, 1974 [26]

80
Case studies
Disaster name and date Blackout in Italy
28 September 2003
Duration of electricity outage (macrogrid) A black out affected the entire Italian grid, with
the exception of the Sardinia island. The duration
was from 3 to 20 hours, depending on the zone
of the country
Duration of electricity outage (internal to site) N/A
Duration between disaster and electricity
supply failing
The initial event was a tree fl ashover of a high
voltage line, feeding Italy from Switzerland, at
3.00 am, on Sunday, 28 September 2003.
The blackout happened about 30 minutes later
Number of people affected 56 million people
Total generation capacity lost (MW) In sequence, all the interconnecting lines between
Italy and neighbouring countries were lost as well
as all the generation units in Italy
When the blackout happened, the load of the
Italian grid was about 27 500 MW, well below
its peak. The Italian grid was fed by its internal
sources with 20 500 MW and by import of 7 000
MW
Total transmission/distribution capacity lost
(MW)
N/A
Estimated cost of disaster A precise analysis is not available. Some
independent sources estimate the cost at about
EUR 390 million. This is an estimate and the
situation might have been worse if the disaster
had happened on a workday
Type of facility that was affected N/A
Table A9 | Case study 9: Cascading failure, Italy, 2003

81
Case studies
What caused the electricity supply failure
The supply failure originated at the loss of an interconnecting line (called “Lukmanier”, a 380 kV line from
Switzerland to Italy) early on a Sunday morning, caused by a tree fl ashover. The attempt to reclose the line
was unsuccessful due a too high phase angle.
After that event, another interconnecting line (called “San Bernardino”, a 380 kV line) became overloaded and
the operators decided to reduce the Italian import of energy. However, the measures taken were not suffi cient
(probably because they underestimated the reduction necessary) and the latter line also tripped, probably
due to a sag of the cables, overheated by the current in excess of the rated value, with a consequent tree
fl ashover. This latter event is still uncertain.
In a few seconds, other lines interconnecting Italy to France, Austria, and Slovenia tripped in sequence,
leaving Italy isolated from the rest of the European grid. Automatic load shedding was put into operation in
Italy but the voltage and frequency in the northern Italy grid began to collapse too much and in sequence the
power stations on duty began to trip too. In two minutes the entire Italian grid lost its generation capacity and
a general blackout was unavoidable.
How was electricity supply restored (internal to site)
Not a microgrid case
How was electricity supply restored (macrogrid)
The plan to restore the entire grid was put into operation immediately after the failure by the transmission
and distribution system operators. However, due to the extent of the blackout, the procedure for restoring
the power was slow and the entire Italian grid was completely restored after 20 hours. In some parts of the
country the energy was lost for few hours only, while other parts waited a full day before having energy again.
What lessons can we learn about electricity supply resilience, restoration, or microgrid operation
from this disaster?
The various commissions that investigated the blackout said that the major causes were the unsuccessful
reclosing of the fi rst line that tripped and lack of a sense of urgency by the grid operators after this event,
especially regarding the overload of the second line that tripped in sequence. The various reports said that
a natural event and human error in incorrectly evaluating the situation were the basis of the blackout.
Could microgrids have been a solution? Probably not on such a large scale, since microgrids are not a
solution for a nation-wide disaster.
However, microgrids could possibly have been a solution on relatively small scales, like grids for single
communities, or for single industries that need a high quality of service in terms of energy supply, or for
urban electric transport in order to provide regular service. The power for these microgrids can be provided
by distributed generators (either renewable or conventional ones) and each microgrid must be controlled by
its own power management system in order to be able to operate in an island mode.


83
[1] Courtesy of Anhui provincial power company, a subsidiary of State Grid Corporation of China.
Available from: http://china.rednet.cn/c/2008/01/21/1424530.htm
[2] Kyodo News/AP #. Available from:
http://www.boston.com/bigpicture/2011/10/thailand_fl ood_reaches_bangkok.html
[3] ELLIOT, D., E. SWARTZ, and B. HERBANE (1999). Just waiting for the next big bang: business
continuity planning in the UK fi nance sector. Journal of Applied Management Studies, Vol. 8,
p. 43-60. Here: p. 48.
[4] KAZUSA, S. Disaster management plan of Japan. Director for Disaster Management, Cabinet
offi ce, Government of Japan, 2005. Available from:
http://management.kochi-tech.ac.jp/PDF/IWPM/IWPM_Kazusa.pdf
[5] Perfect guide of BCP for disaster and saving electric power (in Japanese). Nikkei BP, 16 June
2011.
[6] Cabinet Offi ce, Government of Japan, Survey on Efforts on Business Continuity. The White Paper
for Disaster Prevention (in Japanese). 2012, p. 86-87.
[7] Uptime Institute Tier Certifi cations. Available from: http://uptimeinstitute.com/TierCertifi cation
[8] SIOSHANSI, Fereidoon P. Smart Grid: Integrating Renewable, Distributed & Effi cient Energy.
Academic Press, 2011.
[9] KONG, S., D. CORNFORTH, and A. BERRY. A new approach to the design of multiple inverter
systems using evolutionary optimization. To appear in: IEEE Power and Energy Society General
Meeting, 26-30 July 2009. Calgary, Alberta, Canada.
[10] BANDO S., H. ASANO, T. TOKUMOTO, T. TSUKADA, and T. OGATA. Optimal operation planning of
a photovoltaic-cogeneration-battery hybrid system. International Conference on Power Systems
Technology (POWERCON), 2006. Chongqing, China.
[11] BANDO S., and H. ASANO. Cost, CO2 emission, and primary energy consumption of a microgrid.
IEEE-Power-Engineering-Society General Meeting, 2007. Tampa, FL, USA.
[12] JOKIC A., E. H. A. WITTEBOL, and P. P. J. VAN DEN BOSCH. Dynamic market behavior of
autonomous network-based power systems. International Conference on Future Power Systems,
2005. Amsterdam, Netherlands.
References
84
[13] ABU-SHARKH S., R. J. ARNOLD, J. KOHLER, R. LI, T. MARKVART, J. N. ROSS, K. STEEMERS,
P. WILSON, and R. YAO. Can microgrids make a major contribution to UK energy supply?.
Renewable and Sustainable Energy Reviews, 2006, 10(2): p. 78-127.
[14] BLYDEN B. K., and W. J. LEE. Modifi ed microgrid concept for rural electrifi cation in Africa. General
Meeting of the Power-Engineering-Society, 2006. Montreal, Canada.
[15] MARNAY C., G. VENKATARAMANAN, M. STADLER, A. S. SIDDIQUI, R. FIRESTONE, and
B. CHANDRAN. Optimal technology selection and operation of commercial-building microgrids.
IEEE Transactions on Power Systems, 2008, 23(3): p. 975-982.
[16] COSTA P. M., M. A. MATOS, and J. A. P. LOPES. Regulation of microgeneration and microgrids.
Energy Policy, 2008, 36(10): p. 3893-3904.
[17] MOISES COSTA P., and M. A. MATOS. Economic analysis of microgrids including reliability
aspects. In 9th International Conference on Probabilistic Methods Applied to Power Systems,
2006.Stockholm, Sweden.
[18] KLAPP D., and H. T. VOLLKOMMER. Application of an intelligent static switch to the point of
common coupling to satisfy IEEE 1547 compliance. IEEE-Power-Engineering Society General
Meeting, 2007. Tampa, FL, USA.
[19] PHILLIPS L. R. Tasking and policy for distributed microgrid management. IEEE-Power-Engineering-
Society General Meeting, 2007. Tampa, FL, USA.
[20] KROPOSKI B., C. PINK, T. BASSO, and R. DEBLASIO. Microgrid standards and technology
development. IEEE Power Engineering Society General Meeting, 2007. Tampa, FL, USA.
[21] ZHANG Y. Y., M. Q. MAO, M. DING, and L. C. CHANG. Study of energy management system for
distributed generation systems. 3rd International Conference on Electric Utility Deregulation,
Restructuring and Power Technologies, 2008. Nanjing, China.
[22] KRISHNAMURTHY V., and A. KWASINSKI. Characterization of Power System Outages Caused by
Hurricanes through Localized Intensity Indices. PES General Meeting, 2013.
[23] Courtesy of Alexis KWASINSKI, Ph.D. Assistant Professor, The University of Texas at Austin, 2012.
[24] Courtesy of Alexis KWASINSKI, Ph.D. Assistant Professor, The University of Texas at Austin, 2008.
[25] U.S. DOE. Image in the public domain.
[26] Copyright David ASTLEY. TrekEarth posts may be copied and used in accordance with the terms of
the Creative Commons Attribution-NonCommercial-ShareAlike2.5 licence.
References

®
InternationalElectrotechnicalCommission
T +41 22 919 [email protected]
3 rue de Varembé PO Box 131CH-1211 Geneva 20Switzerland
® Registered trademark of the International Electrotechnical Commission. Copyright © IEC, Geneva, Switzerland 2014.
ISBN 978-2-8322-1151-9
CHF 50.-
IEC
WP
Mic
rogr
ids:
2014
-03(
en)