microemulsion polymerization - nanoparticles.org - the ...nanoparticles.org/pdf/39-kaler.pdf · why...
TRANSCRIPT
P•
MM M M
PM• MM
M
M M
MM
M
M
M
M
M
M
I•
IM•
M•
M
M
M
M
M
Microemulsion Polymerization
Eric W. KalerDepartment of Chemical Engineering
University of DelawareNewark, DE 19716
Jen O’DonnellKevin Hermanson
Carlos Co (U. Cincinnati)Renko de Vries (Wageningen U.)

Characteristics and Structures
Emulsion:•Two Phase•Energy Needed to Form•Opaque•Monomer Drops > 1 µm
Microemulsion: •One Phase•Spontaneous•Transparent/ •Swollen Micelles ( D < 20 nm)

Why Study Microemulsion Polymerization?
Polymerization in a confined environment may lead to unique polymer morphologies, e.g. tacticityand knotting.
“Knotted” polymer chain in solution
Produces nanosized (~15 nm) latex particles smaller than those obtainable by emulsion polymerization
“Paint” the walls of a microporous material
Dry
“Seeds” for emulsion polymerization
Extremely high MW( ~20 million daltons)
are readily made

Outline
• Problems and Model Mixtures• How to Make Microemulsions• Microstructures• Polymerization – Kinetics and Model• Structure Evolution• Multiple Additions• The End!

Ternary Phase Diagrams at 60ºC
Added degree of freedomfrom mixing surfactants is used to tune one phase oil-in-water microemulsions
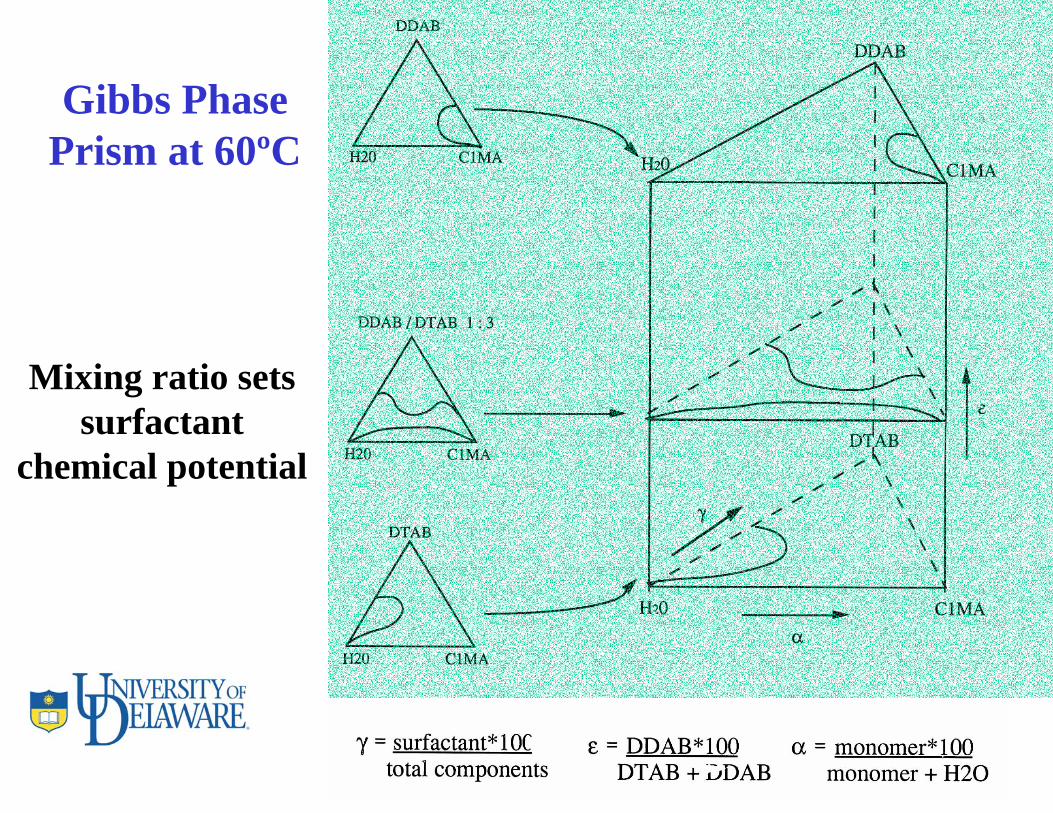
Gibbs Phase Prism at 60ºC
Mixing ratio sets surfactant
chemical potential

Free Radical Thermal Polymerization

kp 60°C (L mol-1 s-1)
3401015 1140 995
Monomers
CH2
CH3
OO
CH2CH2
CH2CH2
CH2CH3
n-C6MA
CH2
CH3
OO
CH2CH2
CH2CH3
n-C4MA
CH2
CH3
OOC
CH3
CH3CH3
t-C4MA
CH CH2
Styrene
Water Solubility60°C (mM) ~ 0.4 3.4 4.3 4.6
Tg (°C) - 5 20 128 106
Reaction at 60°C

A Basic Recipe
• Surfactant mixture to tune phase behavior
Cationic surfactantsDTAB
DDAB
• Monomer with low water solubility - hexylmethacrylate (0.4 mM)
• Polymer with low Tg - polyhexylmethacrylate (-5°C)
• Radical initiator with simple dissociation kinetics - V50 (not persulfates)

P•
MM M M
PM•
MM
M
M M
MM
M
M
M
M
M
M
I•
IM•M•
310~Particles#Micelle#
Initiation by IM•
Propagation
Initiationby M•
ChainTransfer
A Simple View Of Microemulsion Polymerization
M
M
M
M
M
5 nm

V – 50 Polymerizations
1. Rapid polymerization
2. 100% conversions
3. Rate profile parabolic
4. Average maximumrate at about 39%conversion

Microemulsion Polymerization – John Morgan
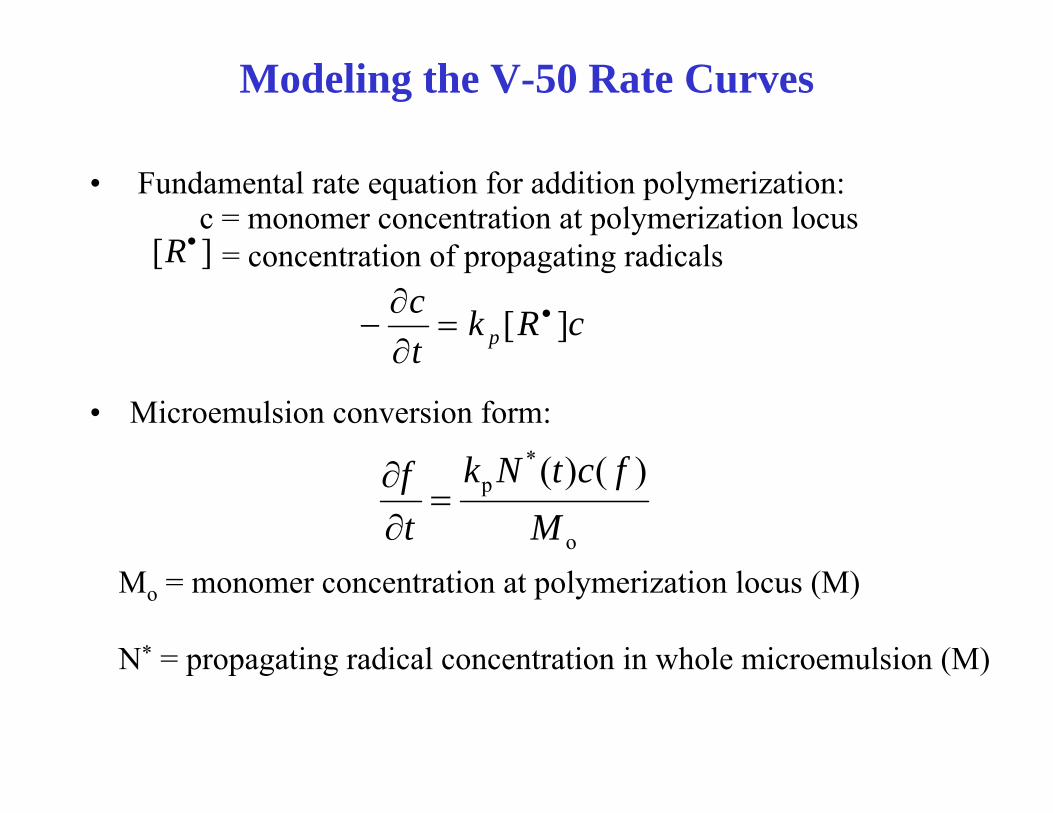
Modeling the V-50 Rate Curves
• Fundamental rate equation for addition polymerization:
• Microemulsion conversion form:
][ •R
cRktc
p ][ •=∂∂
−
c = monomer concentration at polymerization locus= concentration of propagating radicals
Mo = monomer concentration at polymerization locus (M)
N* = propagating radical concentration in whole microemulsion (M)
o
*p )()(
MfctNk
tf=
∂∂

Modeling the V-50 Rate Curves (cont.)
• Assumption: Monomer concentration within polymer particles given by:
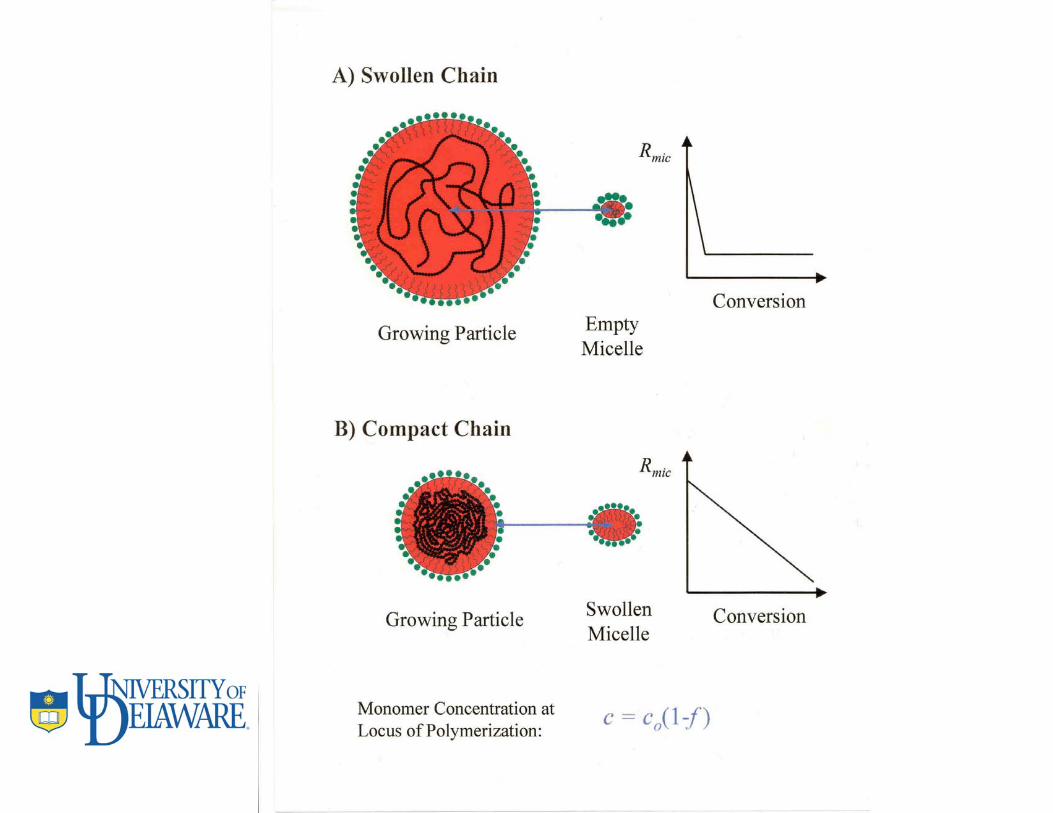
c = co (1 – f )co = initial concentration of monomer, M
• Entry rate is constant; all radicals remain active
N*(t) = ρot
ρo = rate of radical entry, M s-1

Modeling the V-50 Rate Curves (cont.)
• Rate Equation:
o
oop
Mck
A
fAttf
ρ=
−=∂∂ )1(
)1()()(
o
p
o
*p ft
Mck
MfctNk
tf oo −==∂∂ ρ
Or
Parameter:
Conversion: )21exp(1 2Atf −−=

Modeling Implications
2/1
5.0
:Rate Maximum of Time
39.01 :Rate Maximumat Conversion
:Maximum Rate
−
−
=
=−=
=′
At
ef
eAf
• Dependence on Initiator Concentration:
Assume ρo = 2kd [I]
then A goes as [I]

Measured Rate Constants
– Propagation Rate Constant• kp = 995 M-1s-1 (Pulsed Laser Polymerization)
– Initiator Decomposition Rate Constant• kd = 3 x 10⁻⁵ M-1s-1 (Literature)
– Initial Monomer Concentration in Droplet• C0 = 1.0 M (SANS)
– Initial Monomer Concentration in microemulsion• M0 = 0.257 (Formulation)
N.B. No fitted parameters!

Comparison with Experiment
Quantitative Agreement Through to Full Conversion

Kinetic Modeling: Monomer Concentration at Locus of Polymerization
Carlos Co, Renko de Vries
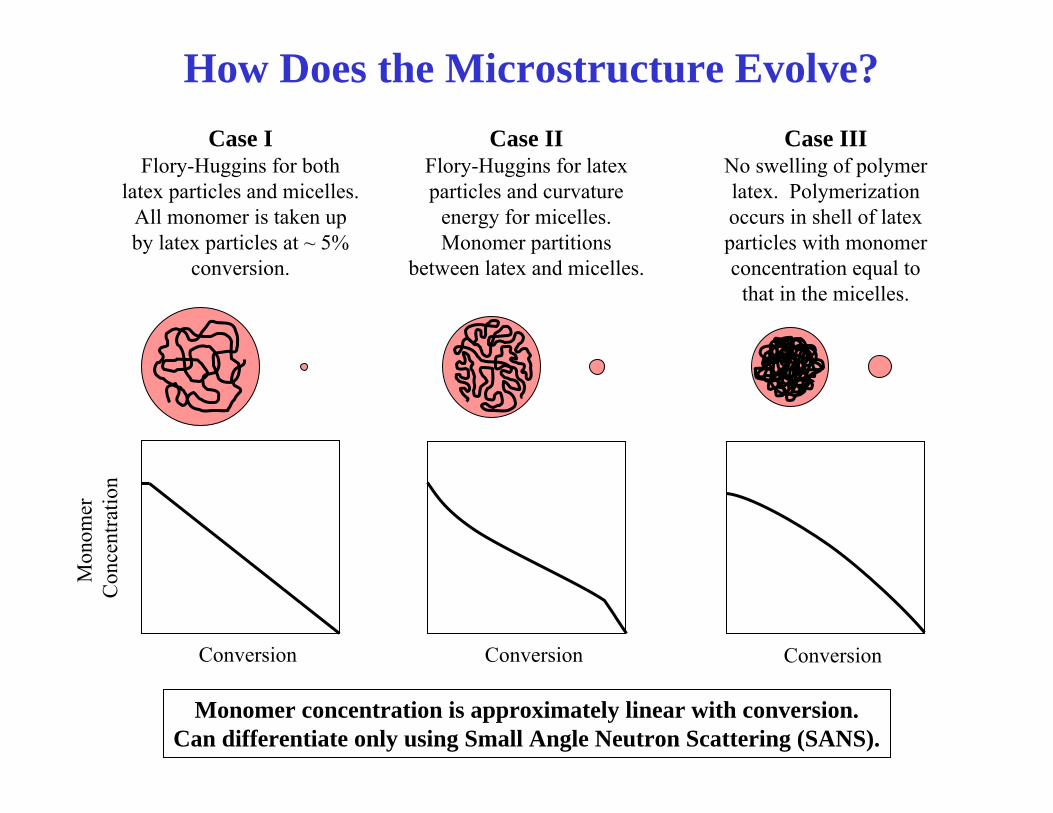
How Does the Microstructure Evolve?Case I
Flory-Huggins for bothlatex particles and micelles.
All monomer is taken upby latex particles at ~ 5%
conversion.
Case IIFlory-Huggins for latexparticles and curvature
energy for micelles.Monomer partitions
between latex and micelles.
Case IIINo swelling of polymerlatex. Polymerizationoccurs in shell of latexparticles with monomerconcentration equal to
that in the micelles.
Mon
omer
C
once
ntra
tion
Conversion ConversionConversion
Monomer concentration is approximately linear with conversion.Can differentiate only using Small Angle Neutron Scattering (SANS).

Small Angle Neutron Scattering (SANS)
Length1~q⎥⎦
⎤⎢⎣⎡θ
λπ
=2
sin4q
I(q) = n P(q) S(q)
P(q) ⇒ Single particle properties(size, shape, composition)
S(q) ⇒Relative positionsof particles due to
interactions
FormFactor
StructureFactor
⇒
⇒
2D Detector
Neutron Source θSample
λ q
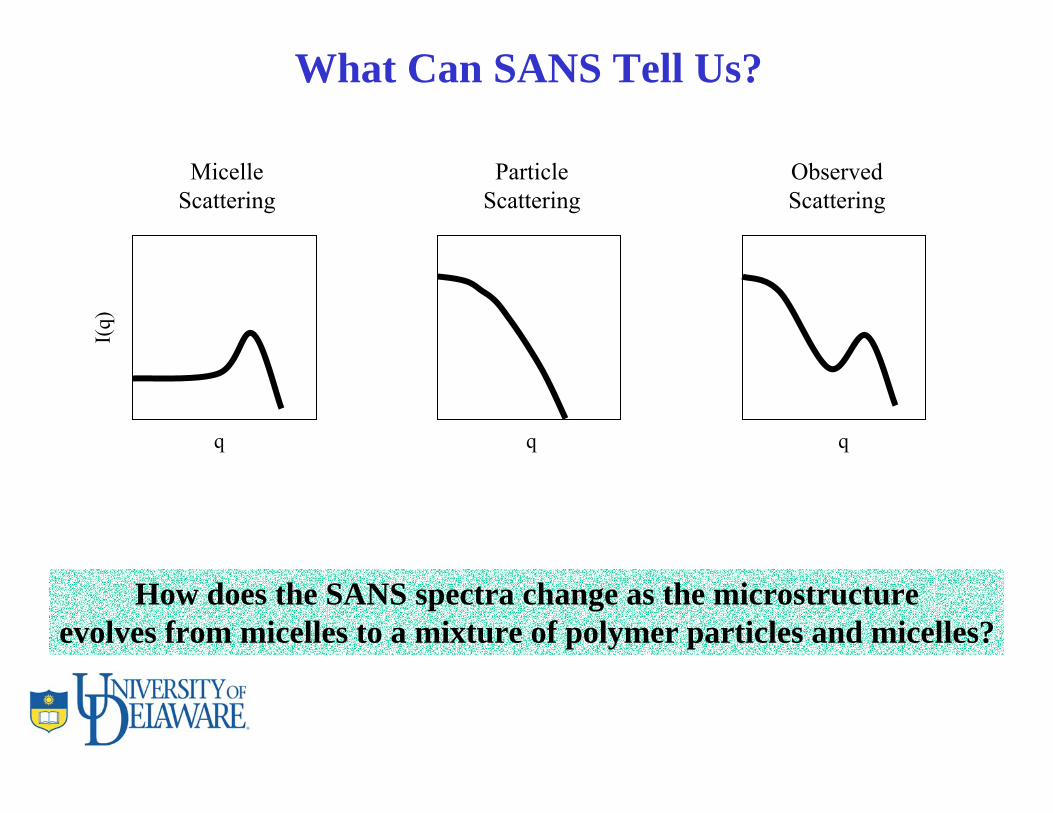
What Can SANS Tell Us?I(
q)
MicelleScattering
ParticleScattering
ObservedScattering
q q q
How does the SANS spectra change as the microstructureevolves from micelles to a mixture of polymer particles and micelles?

Reactor for Online Scattering During
Polymerization

Online SANS / Kinetics Experiments
Gradual shifts in SANS spectra indicate that monomer partitionsbetween the micelles and the polymer particles. Case I is incorrect.
q (Å-1)
Inte
nsity
(cm
-1)
1
10
100
1000
0.01
0.10
0%10%38%65%85%96%100%
IncreasingParticleSize andNumberDensity
DecreasingMicelle Size
C6MA (DTAB/DDAB)

Connection of particle size to MWD
• Basic Idea– Growing chain of L segments was initiated at an
earlier time t1
– At t1, calculate Δt for one propagation event– Number of chains initiated during Δt is N(L)
– Assume single chain particles• Final result is analytical• See Morgan and Kaler, Macromolecules, 1998

Predicted MW and Size Distributions

SANS Model for Online SANS Spectra
Discretize Model-Predicted Particle Size Distribution
Effective HS InteractionsForm Factors
Polymer Micelle
Three AdjustableParameters
Rmaj
RminREHS
Calculate model intensities using Vrij’s analytical equation

Online SANS Modeling Results
q (Å-1)
Inte
nsity
(cm
-1)
1
10
100
1000
0.01
0.02
0.04
0.06
0.08
0.10
0.20
C6MA (DTAB/DDAB)
0% 65% 100%
Minor Radius (Å) 29 23 20
Aspect Ratio 2.1 2.3 2.2
Minor/HSRadius Ratio 1.6 1.7 1.6
Micelle Dimensions(Fitted Parameters)
0% 65% 100%
Avg Radius (Å) 160 130
Stdev (Å) 50 70
Particle Size Distribution(Model Predictions)
To within the accuracy of the predicted particle size distributions, the polymer particles are not swollen by monomer.
0%
100%
65%

SANS Model Fitting Results
Particle size distribution model is consistent with SANS
Micelle size decreases steadilywith increasing conversion

Validation of SANS Swelling Experiments(n-C4MA)
q (Å-1)
Inte
nsity
(cm-1
)
1
10
100
1000
0.00 0.05 0.10 0.15
OnlineSwelling4%
33% OnlineSwelling
75% OnlineSwelling
cryo-TEM by Stefan Burauer (Universitaet zu Koeln)

Molecular Weight Distribution
By Pat Cotts, Dupont
1.422.41001.226.137
1.918.64
Mw/MnMw (106)Conv. (%)
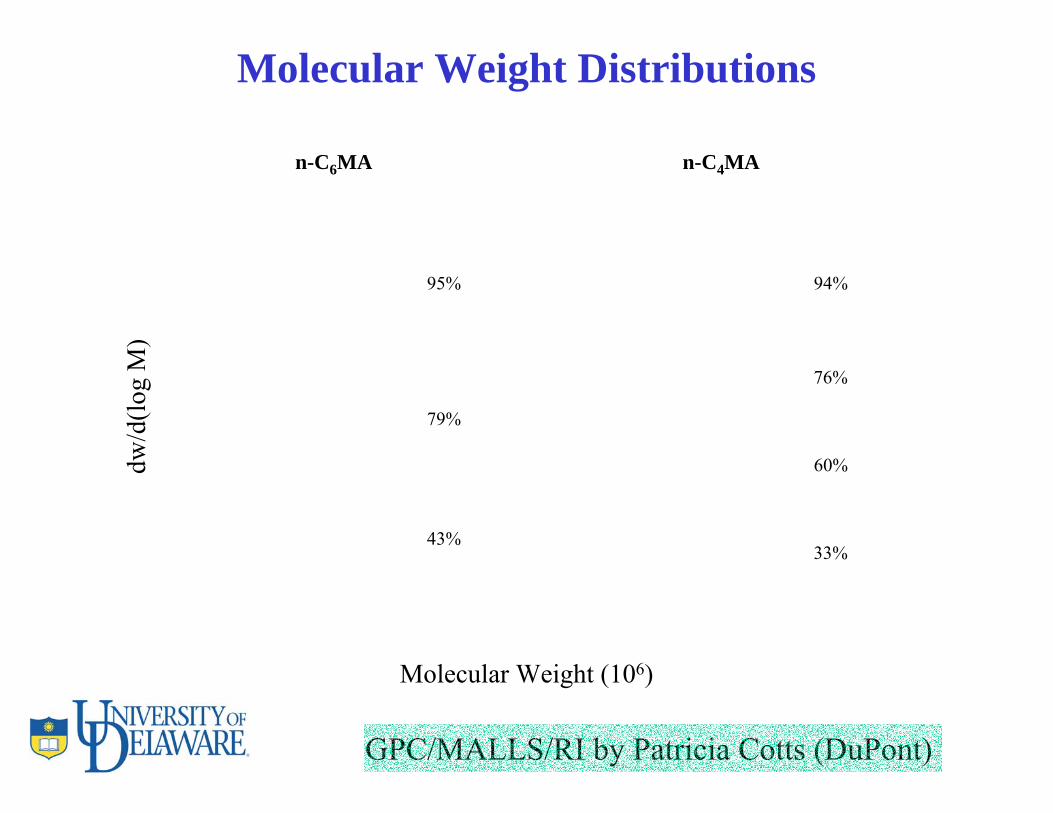
GPC/MALLS/RI by Patricia Cotts (DuPont)
Molecular Weight Distributionsdw
/d(lo
gM
)
Molecular Weight (106)
n-C6MA
43%
79%
95%
n-C4MA
33%
60%
76%
94%

Polystyrene Exceeds Chain Transfer Limit
P • + M
PM •
P + M •
kp
ktr
kp/ktr ratio sets characteristic
limiting molecular weight
Styrene free-radical polymerizations (60°C) limited to ~2·106 daltons.
MW~15 ·106 polystyrene is consistently prepared by microemulsion polymerization
Styrene
dw/d
(log
M)
Molecular Weight (106)
27%
53%
70%
91%

Summary: A Simple Model for Microemulsion Polymerization
Rate Equation
( )
knownisMρck
A
f1Attf
o
oop=
−=∂∂
⎟⎟⎠
⎞⎜⎜⎝
⎛−−=
2tA1exp1f:Conversion
2
39.021exp1f:ratemaxatConversion =⎟⎠⎞
⎜⎝⎛−−=
Predictions for Particle Size and Molecular Weight Distributions
Kinetic Predictions
Molecular Weight (106)
dw/d
(log
M)
V50
Con
cent
ratio
n

How to Increase Polymer Loading?
…Sequential Addition Polymerization
[ ]( )⎟⎟⎠
⎞⎜⎜⎝
⎛+−−= tNtIk
Mck
exp1f o*2
do
op
N* = ρο t + N*o
[ ]( )od NtIkM
fcktf *
o
op 2)1(
+−
=∂∂
Kinetics
Initial Step 1
M
M
M
M
Refill
M
•Radicals present from prior monomer additions
1 2
3 4
5
Additional Steps
Step 2
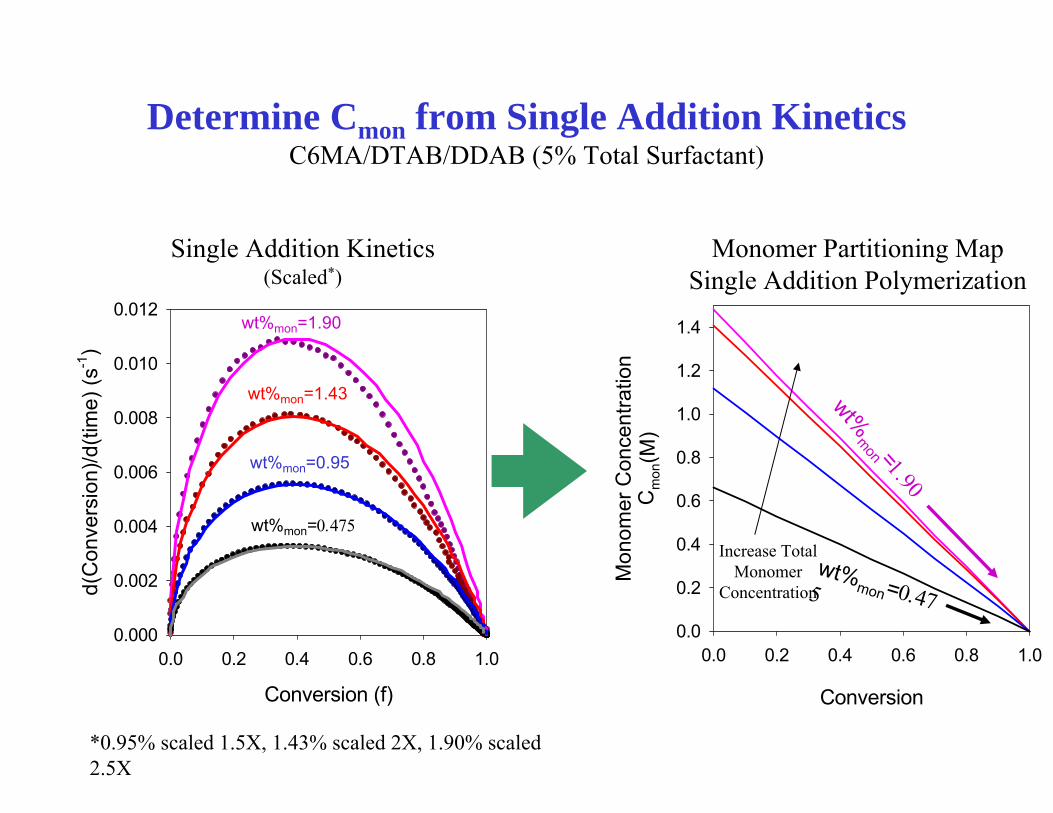
Determine Cmon from Single Addition KineticsC6MA/DTAB/DDAB (5% Total Surfactant)
Conversion
0.0 0.2 0.4 0.6 0.8 1.0
Mon
omer
Con
cent
ratio
nC
mon
(M)
0.0
0.2
0.4
0.6
0.8
1.0
1.2
1.4
wt%mon=0.475
wt%mon =1.90
Monomer Partitioning MapSingle Addition Polymerization
Single Addition Kinetics (Scaled*)
Increase Total Monomer
Concentration
*0.95% scaled 1.5X, 1.43% scaled 2X, 1.90% scaled 2.5X
Conversion (f)
0.0 0.2 0.4 0.6 0.8 1.0
d(C
onve
rsio
n)/d
(tim
e) (s
-1)
0.000
0.002
0.004
0.006
0.008
0.010
0.012
wt%mon=0.475
wt%mon=0.95
wt%mon=1.90
wt%mon=1.43

Determine Cmon for Multiple Addition Polymerization
Conversion (f)
0.0 0.2 0.4 0.6 0.8 1.0
Mon
omer
Con
cent
ratio
nC
mon
(M)
0.0
0.2
0.4
0.6
0.8
1.0
1.2
1.4
Monomer Partitioning MapSingle Addition Polymerization
0.475% Monomer0.475% Polymer
0.475% Monomer0.95% Polymer
0.475% Monomer1.43% Polymer
New Co
Conversion (f)
0.0 0.2 0.4 0.6 0.8 1.0
Mon
omer
Con
cent
ratio
nC
mon
(M)
0.0
0.2
0.4
0.6
0.8
1.0
1.2
1.4
Monomer Partitioning MapMultiple Addition Polymerization
Addition 4
Addition 1
Addition 1 Co=0.66MAddition 2 Co=0.56MAddition 3 Co=0.47MAddition 4 Co=0.37M
Cmon=Co(1-f)

Conversion (f)
0.0 0.2 0.4 0.6 0.8 1.0
d(C
onve
rsio
n)/d
(tim
e) (s
-1)
0.000
0.002
0.004
0.006
0.008 Addition 1
Addition 2
Addition 3
Addition 4
Multiple Addition Kinetics
Measured vs. Predicted Kinetics(offset*)
Conversion (f)
0.0 0.2 0.4 0.6 0.8 1.0
d(C
onve
rsio
n)/d
(tim
e) (s
-1)
0.000
0.001
0.002
0.003
0.004
0.005Co decreases lowering reaction rate
Measured Kinetics
[ ]( )o*
do
op NtIk2M
)f1(cktf
+−
=∂∂Multiple Addition Model
The predicted data matched the measured data when N*o=0
* Addition 2 offset 0.001, Addition 3 offset 0.002, Addition 4 offset 0.003
Addition 1Addition 2Addition 3Addition 4
2530
3540
4550
5560
65
0
20
40
60
80
100
423222
121
DiameterAddition
Inte
nsity
(I/I m
ax*1
00)
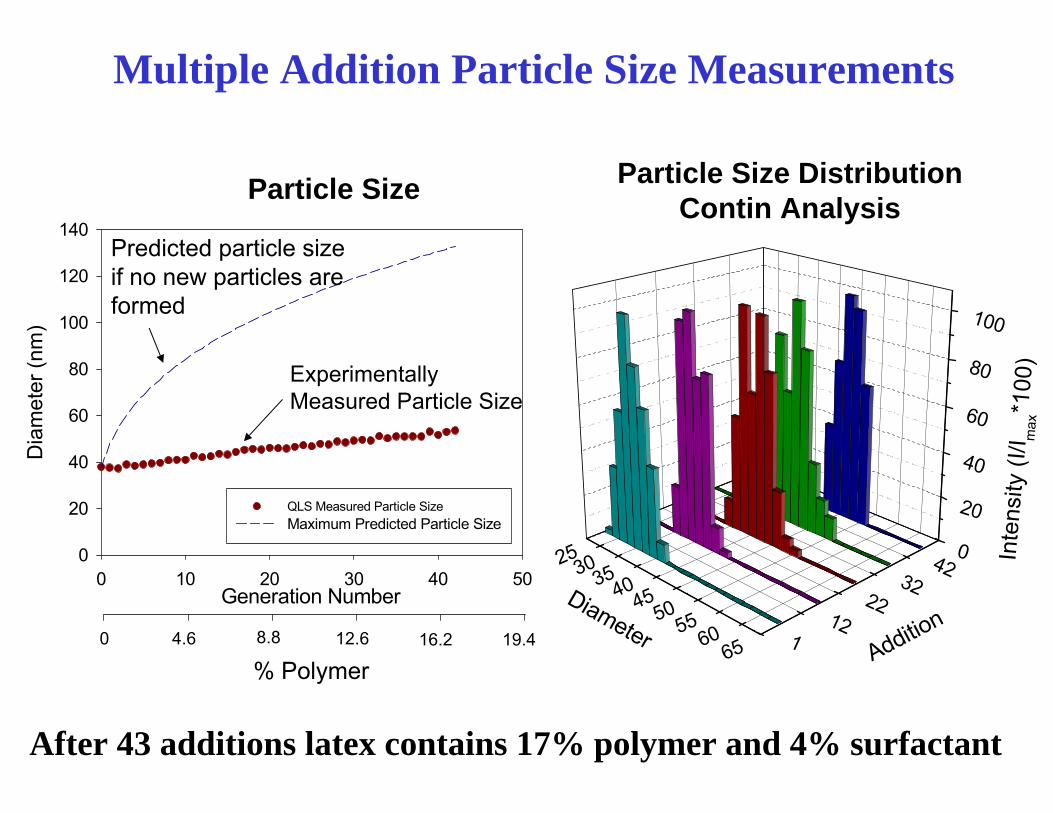
Generation Number0 10 20 30 40 50
Dia
met
er (n
m)
0
20
40
60
80
100
120
140
QLS Measured Particle SizeMaximum Predicted Particle Size
Particle Size DistributionContin AnalysisParticle Size
Multiple Addition Particle Size Measurements
0 8.84.6 16.212.6 19.4
% Polymer
Predicted particle size if no new particles are formed
After 43 additions latex contains 17% polymer and 4% surfactant
Experimentally Measured Particle Size

Summary
• Microemulsion polymerization produces small monodisperse particles
• Initiator charge plays no role (with pH control…)• Reaction rate and MWD can be modeled with minimal
assumptions and no free parameters• Microstructures “meter” monomer and control
polymerization• Commercially interesting concentrations can be
produced by sequential (or continuous) polymerization