microdata on trade in services – data set and empirical findings, the case of austria 2nd meeting...
TRANSCRIPT

Microdata on Trade in Services – data set and empirical findings, the case of Austria
2nd Meeting of the Working Party on International Trade in Goods and Trade in Services Statistics (WPTGS)
16-18 November 2009

www.oenb.at [email protected] 2 -
Foundations
• Legal status of OeNB as statistics provider adopted– Use of statistical, register and administrative information
• Switch from settlement data to direct reporting– Stratified corporate sample within the scope of SBS
• Recalculation of prior figures– Time series break in results – Trade volume shrunk, degree of detail increased (EBOPS)
• Harmonization of OeNB’s company database with business register
• Linkage of trade in services with structural data
2004
2009

www.oenb.at [email protected] 3 -
Motivation
• How plausible are survey results within the framework of SBS?• How can trends in the BoP be explained?• How do Austrian characteristics (firm and regional structure)
matter?• How can modern data needs be met (New New Trade Theory)?

www.oenb.at [email protected] 4 -
Coverage
• “Basic Population”– Annual SBS, census with cutoff limits (employment,
sales revenues) – Extract of only enterprises registered (identification
criteria)– 2006, 138,306 enterprises
• Sample– 4,963 non-financial corporations either exporting and/or
importing services

www.oenb.at [email protected] 5 -
Data Set
– Company designation (Name, ID)
– Headquarter (Region)– Date of establishment– Industry (NACE 2003)– Employment – Sales revenues – Outward FDI (Y/N)– Inward FDI (Y/N, control)– Exports of goods– Imports of goods– Type of service– Country– Service Exports – Service Imports
• Trade in Services Survey• Foreign Trade Statistics• SBS• Business Register• OeNB’ company database

www.oenb.at [email protected] 6 -
Sample characteristics
• 940 manufacturing companies– 19% of the sample– 6% of the basic population– Machinery, equipment, metals; publishing and food industry
• 222 construction companies– 4% of the sample– Less than 2% of the population
• 3,560 service providers– 72% of the sample– 3% of the population– Wholesale and commission trade, supporting and auxiliary
transport activities, land transport, computer and related activities, management consulting, management of holding companies, architectural and engineering services, advertising

www.oenb.at [email protected] 7 -
Relation to the BoP
Exports Imports Exports Imports
20.434 14.935 95 85
7.998 6.878 98 851.117 878 99 98
729 574 94 941.037 705 87 82
379 1.009 89 962.775 425 99 92
314 126 95 83104 95 63 63
41 37 79 72412 337 90 89526 716 85 88
1.337 248 94 95
1.710 612 94 9321 60 69 87
442 768 80 721.387 1.322 99 98
107 144 59 23Personal, cultural, and recreational services Services between related enterprises, n.i.e.Other business servicesAgricultural, mining, and on-site processing services
Architectural, engineering, and other technical services
Research and developmentAdvertising, market research, and public opinion Business and management consulting
Royalties and license fees
Accounting, auditing, bookkeeping, and tax consulting services
Legal servicesOperational leasing services
Communications services
EUR million
Computer and information services
% of the 2006 balance of payments
Construction services
Merchanting and other trade-related services
Source: OeNB, Statistics Austria.
Transportation
Concentration sample Degree of coverageType of service
Total services

www.oenb.at [email protected] 8 -
Asymmetric Allocation of Trade Revenues
0%
10%
20%
30%
40%
50%
60%
70%
80%
90%
100%
0% 10% 20% 30% 40% 50% 60% 70% 80% 90% 100%
90% of enterprises account for 19% of service revenues abroad, 10% of enterprises (384) account for 81%.
Source: OeNB, Statistics Austria.
www.oenb.at [email protected] 9 -
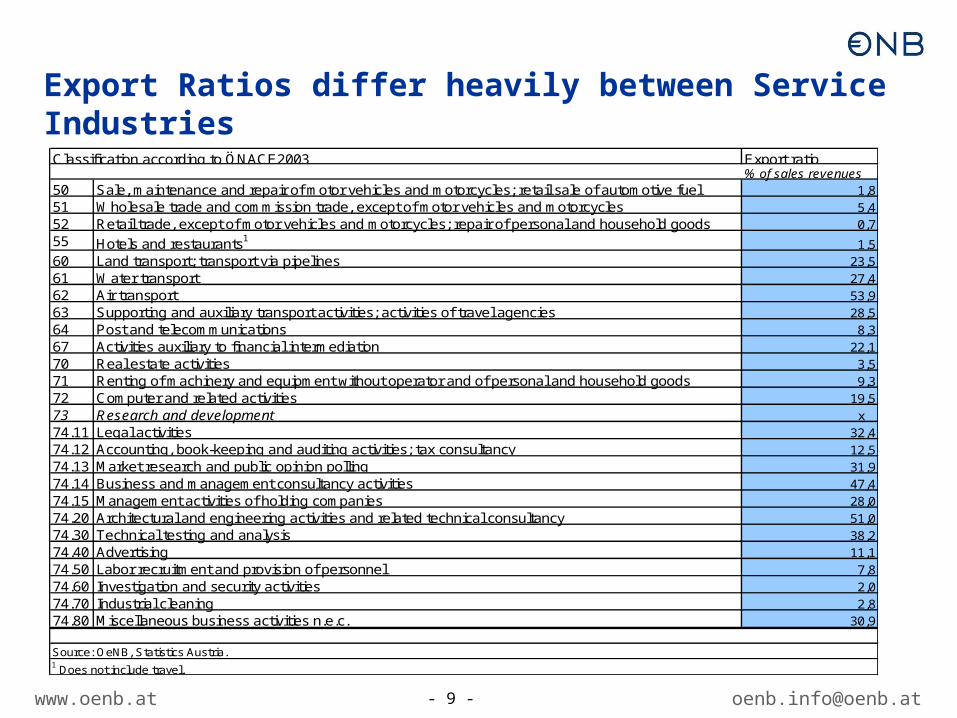
Export Ratios differ heavily between Service Industries
Export ratio% of sales revenues
50 Sale, maintenance and repair of motor vehicles and motorcycles; retail sale of automotive fuel 1,851 Wholesale trade and commission trade, except of motor vehicles and motorcycles 5,452 Retail trade, except of motor vehicles and motorcycles; repair of personal and household goods 0,755 Hotels and restaurants1
1,560 Land transport; transport via pipelines 23,561 Water transport 27,462 Air transport 53,963 Supporting and auxiliary transport activities; activities of travel agencies 28,564 Post and telecommunications 8,367 Activities auxiliary to financial intermediation 22,170 Real estate activities 3,571 Renting of machinery and equipment without operator and of personal and household goods 9,372 Computer and related activities 19,573 Research and development x74.11 Legal activities 32,474.12 Accounting, book-keeping and auditing activities; tax consultancy 12,574.13 Market research and public opinion polling 31,974.14 Business and management consultancy activities 47,474.15 Management activities of holding companies 28,074.20 Architectural and engineering activities and related technical consultancy 51,074.30 Technical testing and analysis 38,274.40 Advertising 11,174.50 Labor recruitment and provision of personnel 7,874.60 Investigation and security activities 2,074.70 Industrial cleaning 2,874.80 Miscellaneous business activities n.e.c. 30,9
Classification according to ÖNACE2003
1 Does not include travel.
Source: OeNB, Statistics Austria.

www.oenb.at [email protected] 10 -
Link between Exports and Company Size
0% 20% 40% 60% 80% 100%
Legal services
Management consulting
Merchanting and other trade-related services
On-site processing, agriculture and mining
Personal, cultural and recreational services
Advertising, market rsearch and public opinion polling
Operational leasing
Other business serivces
Accounting, bookkeeping and auditing activities; tax consultancy
Services between related enterprises not included elsewhere
Computer and related activities
Royalties and license fees
Transportation
Architectural, engineering and other technical services
Construction
Communications services
Research and development
1 to 10 employees 11 to 49 employees 50 to 249 employees 250+ employees
% of total
Source: OeNB, Statistics Austria.

www.oenb.at [email protected] 11 -
Imports by Local versus Group Companies
0% 10% 20% 30% 40% 50% 60% 70% 80% 90% 100%
Research and development
Services between related enterprises not included elsewhere
Merchanting and other trade-related services
Royalties and license fees
Architectural, engineering and other technical services
Legal services
Advertising, market research and public opinion polling
Other business services
Computer and information services
Construction services
Transportation
Management consulting
On-site processing, agriculture and mining
Operational leasing
Communications services
Personal, cultural and recreational services
Accounting, auditing, bookkeeping, and tax consulting services
Local firms Outward FDI Inward FDI Outward and inward FDI
% of total
Source: OeNB, Statistics Austria.

www.oenb.at [email protected] 12 -
About 5,000 enterprises 770, 000 employees Export revenues of about 20.4 bn EUR Highest in transportation, but technically innovative services grow
dynamically 10% of exporters gain 80% of export revenues Large companies are engaged in network and innovative services,
small and medium sized firms in knowlegde intensive service exports 1, 000 service traders only have one partner country, 30 have more
than 100 Only half of service exports are attributable to local firms, the other
half falls upon fewer group companies Strong correlation between goods and service trade
Who dominates Austria‘s Trade in Services -

www.oenb.at [email protected] 13 -
Future Outlook
• Integration of 2007 data into OeNB‘s official database • Regular publication of data and analysis
– www.oenb.at– www.a-i-c.at
• Integration of financial sector• Access to microdata• International discussion about common patterns and trends