microclimate and ecological threshold responses in a warming and wetting experiment following whole...
TRANSCRIPT

ORIGINAL PAPER
Microclimate and ecological threshold responses in a warmingand wetting experiment following whole tree harvest
M. D. McDaniel & R. J. Wagner & C. R. Rollinson &
B. A. Kimball & M. W. Kaye & J. P. Kaye
Received: 21 August 2012 /Accepted: 3 June 2013# Springer-Verlag Wien 2013
Abstract Ecosystem climate manipulation experiments(ECMEs) are a key tool for predicting the effects of climatechange on ecosystems. However, the strength of inferencesdrawn from these experiments depends on whether the ma-nipulated conditions mimic future climate changes. WhileECMEs have examined mean temperature and moistureconditions, ecosystem processes may respond more to mi-croclimatic thresholds (e.g., freeze–thaw events). We report-ed the mean and microclimatic thresholds from a post-clearcut ECME in a temperate, mixed deciduous forest.Target treatments were ambient, warmed (+∼2 °C), wetted(+∼20 % precipitation), and warmed+wetted. Wetted treat-ments increased mean monthly precipitation by 23 %, butdid not change the amount of time the soil water potentialwas below the permanent wilting point. Relative to ambient,warmed treatments increased the mean temperatures of thesurface and soil by 1.8 and 2.5 °C, respectively. Warmingdecreased the number of soil freeze–thaw events and in-creased the number of growing degree days, frost-free days,and amount of time leaf surface temperatures were in theoptimal photosynthetic range. Our results showed that, even
when ECMEs mimic mean predicted climate conditions,their effect on microclimatic thresholds can be variable. Wesuggest that measuring these and other microclimatic thresh-olds will be essential for interpreting ECME results andassessing their value in predicting ecosystem responses tofuture climate change.
AbbreviationsECME Ecosystem climate manipulation experimentFC Field capacityFFD Frost-free daysFoRCE Forest Regeneration and Climate Change
ExperimentF-Ts Freeze–thaw eventsGDD5 Growing degree days above a base temperature of
5 °CLTG35 Leaf temperature >35 °COLT Optimum leaf temperatureOWC Optimum water contentPWP Permanent wilting pointVWC Volumetric water content
1 Introduction
Global climate is predicted to change due to anthropogenicfactors, with a possible 2 to 5 °C increase in global temper-ature within the next century (Solomon 2007). In that sametime frame, precipitation regimes are expected to exhibitgreater spatial variability, with a larger degree of uncertaintyin the predictions (Solomon 2007). For northeastern USA,the predictions for changes in annual precipitation rangefrom slightly negative to +30 % (Hayhoe et al. 2007).
Ecologists are using a suite of tools to predict ecosystemresponses to climate change, and one of the key approachesis plot-scale ecosystem climate manipulation experiments(ECME). Some of the common methods used in ECMEs to
Electronic supplementary material The online version of this article(doi:10.1007/s00704-013-0942-9) contains supplementary material,which is available to authorized users.
M. D. McDaniel (*)Department of Natural Resources and the Environment, Universityof New Hampshire, 114 James Hall, Durham, NH 03824, USAe-mail: [email protected]
R. J. Wagner : C. R. Rollinson :M. W. Kaye : J. P. KayeDepartment of Ecosystem Science and Management, ThePennsylvania State University, 113 Forest Resources Building,University Park, PA 16802, USA
B. A. KimballUS Arid Land Agricultural Research Center, USDA AgriculturalResearch Service, 21881 North Cardon Lane, MaricopaAZ 85138, USA
Theor Appl ClimatolDOI 10.1007/s00704-013-0942-9

manipulate temperature include infrared (IR) lamps (Harteet al. 1995), open top chambers (Norby et al. 1997), or buriedcables (Melillo et al. 2002). Studies on the effects of precip-itation changes to ecosystems include increases or decreasesin the total amount of precipitation, changes in the frequencyof precipitation events, and changes in the timing of large-scale precipitation events (Fay et al. 2000; Knapp et al. 2002;Wullschleger and Hanson 2006). More recently, ecologistsare using ECMEs that cross temperature and precipitationtreatments in order to test for interactive effects. A meta-analysis of 85 experiments (Wu et al. 2011) concluded thatthe few experiments crossing temperature with precipitationmanipulations resulted in smaller interactive effects thanpredicted by additive interaction models and recommendedmore research be done. Additionally, it is known that tem-perature and moisture can have counteracting effects on eachother. For example, Carlyle et al. (2011) found that decreas-ing precipitation in open top chambers increased temperatureby 0.4 °C and that watering decreased temperature by 0.4 °C.Thus, the methods used in ECMEs do not act independentlyor exclusively on the variables that they are intended totarget.
ECMEs often target fixed increases in climate variables(e.g., set increases in air or soil temperatures); however, themean change in temperature or moisture conditions may notadequately describe treatment effects on microclimate if themanipulations also change the frequency or duration of timethat climate extends beyond critical ecological thresholds. Anecological threshold can be defined as a nonlinear ecosystemresponse to an environmental driver (Groffman et al. 2006). Inthis manuscript, our goal is not to reveal thresholds, but rather,to take advantage of several well-established ecologicalthresholds (e.g., freezing) and quantify effects of climatechange manipulations on the duration and frequency thatthresholds are crossed.
An important temperature threshold for soil biogeochemi-cal cycling is the freezing point of water (0 °C), below whichsoil microbial activity is dramatically reduced (Rivkina et al.2000), although activity has been measured in soils as lowas −39 °C (Panikov et al. 2006). The number of soil freeze–thaw events (F-Ts) or cycles has been linked to increasedlosses of both soil C and N (DeLuca et al. 1992; Groffmanet al. 2001b; Grogan et al. 2004). Themainmechanisms thoughtto be driving this increased cycling is the lysing of soil microbialcells or fine root dieback from the physical stress of freezing,followed by the metabolism or leaching of the available C and Nduring the thaw cycle (Matzner and Borken 2008).
Plant physiology is strongly influenced by ambient and leafsurface temperatures. Freezing temperatures can be regardedas an ecological threshold because plants can experiencetissue damage when the temperature drops below 0 °C(Pearce 2001). Temperature regimes over the growing seasoncan be represented by indices common in forestry and
agriculture that relate surface temperature to plant growth suchas the number of frost-free days (FFD) or growing degree days(GDD) (Sykes et al. 1996). It is widely thought that plantsmust experience a critical number of days with mean temper-atures >5 °C (growing degree days above a base temperatureof 5 °C [GDD5]) for the regulation of phonological eventssuch as leaf out (Lechowicz 1984). Because a day with anaverage temperature of 5 °C may still experience frost, GDDand FFD are complementary temperature-related thresholdsused for studying plant growth responses to the environment(Körner and Basler 2010; van der Meer et al. 2002).
Actual leaf surface temperature is an important control onplant physiology, affecting both carbon fixation and waterloss through evapotranspiration (Dreyer et al. 2001; Kobzaand Edwards 1987). Helliker and Richter (2008) used stableoxygen isotopes in tree rings to show that most tree C is fixedwhen leaf temperatures are 19.2–23.6 °C across a broadrange of ecosystems from the tropics to boreal forests. Thissuggests another temperature-related threshold range thatcould be useful for evaluating potential effects of an alteredmicroclimate on plant success. In addition, leaf photosyn-thetic pathways have been shown to be negatively affectedby temperatures above 35 °C (Schrader et al. 2004).
Both plant and soil microbial processes respondnonlinearly to well-established soil moisture thresholds.Plant physiological and morphological responses to waterstress are also strongly controlled by thresholds in soil mois-ture, particularly in arid ecosystems (Schwinning andEhleringer 2001). For instance, the permanent wiltingpoint (PWP) is the lowest water potential at which aplant can access water from the soil (Veihmeyer andHendrickson 1949). Although there is a wide range ofsoil water potential values over which plants can drawwater (from −1.0 to −8.0 MPa), the conventional thresh-old of PWP is considered to be −1.5 MPa (Lamberset al. 2008). The PWP can serve as a measureablethreshold to separate stressed and unstressed conditionsof plants, as well as a measure of inhibited soil micro-bial activity and nutrient cycling (Porporato et al. 2004).
We established an ECME combining temperature andprecipitation manipulations in 2007 in a recently harvestednortheastern temperate forest in central Pennsylvania. Theexperiment was conducted in a postharvest environmentbecause of our interest in early successional forest commu-nity responses to predicted changes in climate. The experi-mental design applied four treatments: warmed (+∼2 °C),wetted (+∼20 % precipitation), warmed+wetted, and ambi-ent (control). Our objectives for this paper are to sum-marize how manipulations used to simulate predictedclimate change affect the microclimate of the ecosys-tem and to highlight how a climate manipulation ex-periment may alter the frequency and duration of keyecological thresholds.
M.D. McDaniel et al.

We have three categories of hypotheses regardingwarming and wetting effects on ecological thresholds:
1. Direct effects of increased temperature and precipitation,without interactions. We hypothesize that warming alonewill increase the number of FFD, GDD5, surface tem-peratures in the optimum leaf temperature (OLT) rangefor C assimilation, surface temperatures >35 °C (leaftemperature >35 °C [LTG35]) where photosynthesis issuppressed, and soil F-Ts. Wetting will decrease thefrequency that soil moisture falls below the PWP andincrease the time that soils are between PWP and fieldcapacity (FC).
2. Interactive effects in which warming treatments causedrying. We hypothesize that warming will have a dryingeffect counteracting the wetting effect on moisture-dependent thresholds of PWP and PWP-FC.
3. Interactive effects in which wetting treatments causecooling. We hypothesize that wetting will have a coolingeffect counteracting the warming effect on temperature-dependent thresholds of FFD, GDD5, OLT, LTG35, andF-Ts.
These seven microclimatic parameters (FFD, GDD5,OLT, LTG35, F-Ts, PWP, and FC) exert strong control overecosystem structure and function in a temperate forest eco-system, especially in a secondary successional forest (Chenet al. 1999). Furthermore, the selected microclimatic param-eters encompass those where the responses in ecosystemprocesses to temperature or precipitation may be either hin-dered (e.g., LTG35) or enhanced (e.g., OLT).
2 Materials and methods
The Forest Regeneration and Climate Change Experiment(FoRCE) was located in the Pennsylvania State University’sStone Valley Forest in central Pennsylvania (40°40′32″ N,77°54′00″ W). The average mean temperature in the regionis 8.6 °C. The annual average maximum is 27 °C in July,while the average minimum is −8 °C in January. Meanannual precipitation was 1,046 mm from 1899 to 2006(PSC 2010). The site was situated on a southeast-facingslope with a 14 % grade. The soils were a fine loamy, mixed,superactive, mesic Oxyaquic Fragiudalfs in the Clarksburgseries derived from a Tuscarora sandstone parent material.Depth to bedrock is approximately 2.5 to 3 m. The meanparticle size distribution of the A horizon was 17 % sand,67 % silt, and 16 % clay. Prior to installing the study plots,the overstory canopy in a 2-ha area was removed by wholetree harvesting, leaving only advanced tree regeneration<0.5 m tall. Harvesting resulted in 34 % decrease in the massof O horizon material and a 20 % increase in bulk density(Rollinson and Kaye 2012). Postharvest woody debris <2 cm
thick was left on plots and evenly distributed. A 2-m highfence was installed around the study area to exclude deer andother large mammals.
The experimental design was a 2×2 factorial randomizedcomplete block. Sixteen 2×4-m plots (Fig. S1) were ar-ranged into 4 blocks with 1 plot of each of the followingtreatments: warmed, wetted, warmed+wetted, and ambient(or control). Each experimental plot was surrounded by a0.5-m tall mesh fence spaced 1 m from the plot borders thatwas erected in spring 2009 to deter rodent herbivory. Onehalf of each plot (2×2 m) was randomly selected as a “nat-ural” subplot and vegetation was allowed to naturally regen-erate (right side of Fig. S1). The other half of the plot wasdesignated as the “planted” subplot and was planted withseeds from 11 eastern tree species and weeded on a regularbasis (for vegetation responses to treatments, see Rollinsonand Kaye 2012 and Rollinson et al. 2012).
2.1 Temperature and precipitation manipulations
Our goal was to increase daily canopy temperatures by ap-proximately 2 °C and ambient precipitation by 20 % of thelong-term average. The targeted temperature increases werebased on general circulation models (GCMs) that predictwarming from 2 to 5 °C and within the next century(Solomon 2007). Model predictions for precipitation changesin northeastern USA are far more variable than temperature(Hayhoe et al. 2007), but 20 % was chosen because it was onthe wetter end of the predictions and greater than the historicalcoefficient of variation (16 % from 1882 to 2005).
Warmed treatments were achieved in plots using a pro-portional–integrative–derivative (PID) control system de-scribed in Kimball (2005). The PID system works by pro-gramming the IR heater controllers to maintain constantcanopy temperature differentials between ambient andwarmed plots. The PID system was programmed to maintaindaytime and nighttime canopy temperatures by 1.5 and3.0 °C above those of unheated reference plot temperatures,respectively. Over each warmed plot hung two 165×15-cmIR heaters with maxima of 100 W m−2 output (HS-2420,240 V, 2,000 W Electric Radiant Infrared Heater withModified Reflector, Kalglo Electronics Inc., Bethlehem,PA, USA) suspended 1.5 m above the ground on a steelcable supported by 2.4 m tall steel posts. Plots were warmedcontinuously from May 2008 through August 2010. Due tofire hazard from plant contact with the heaters, all heaterswere raised to 2 m in April 2010. The shading effect and dripline caused by the heaters were mimicked in the wetted andreference plots by installing “dummy” heaters with the samephysical dimensions and shading as the real heaters, butlacking a heating element.
The surface temperature in each plot was recorded by infra-red radiometers (IRR; model IRR-P, Apogee Instruments Inc.,
Microclimate and ecological threshold responses in a warming and wetting experiment following whole tree harvest

Logan, UT, USA), CR1000 data logger (Campbell Scientific,Logan, UT, USA), and a multiplexer (model AM16/32;Campbell Scientific, Logan, UT, USA). The plot surface waseither plant or soil, depending on the time of year and time sinceharvest, and temperature measurements were taken in the centerof the 2×4-m plots (incorporating both “natural” and “planted”subplots). The IRRs were installed 2 m above the canopy andtilted 45° from parallel to the surface, so that they viewed anoval that was 2.3 mwide by 3.8 m long (ellipse area of 6.9 m2).IRR temperature was averaged over 1-h periods and recordedby the CR1000 data logger. Every 15 s, IRR sensor tempera-tures in warmed plots were compared to ambient plots withinthe same block to calculate the heating needed to maintain thetarget warming. A signal was then sent to a dimmer switch(LCED-2484 Incandescent Light Dimmer 249 V Single Phase60 Hz 8.5 KW; Kalglo Electronics Inc., Bethlehem, PA, USA)for each block that is in three voltage settings: “off” (0 V),quarter power (5 V), or full power (10V). The dimmers use oneof three signals (off, half, or full) to send to the four heaters inthat block to maintain the target temperature difference. TheKalglo IR heaters have a maximum electrical requirement of2,000Wand are 20% efficient at low wind over 4 m2 (Kimball2005), so the maximum IR radiation impinging on the plotsfrom the heaters was about 100 W m−2. Similar methodologyhas been used in grassland and alpine experiments to study theeffects of a warming climate (Price and Waser 2000; Wan et al.2002; Morgan et al. 2011) and is currently employed in borealforests and old field successional ecosystems (websites: http://forestecology.cfans.umn.edu/B4WARMED.html and http://www.ecosystems.umb.edu/bace.html).
Soil temperature was measured with Decagon ECH2OEC-TM soil probes (Decagon Devices, Inc., Pullman, WA,USA) installed 3 cm below the mineral soil surface approx-imately 50 cm from the plot center in the “natural” subplots.The ECH2O EC-TM probes were installed parallel to thelonger side of the plots (4 m side). Effective soil temperaturewas measured at 5 cm depth. Soil moisture and temperaturewere recorded every hour within each plot. Starting in fall of2009, a handheld temperature probe (model 9847N made byTaylor) was used to verify ECH2O EC-TM temperature datain the natural subplots every 2 weeks during the growingseason. The Taylor probe integrates temperature readingsfrom 0 to 8 cm depth. Three temperature readings from theTaylor probe were taken after the probe had been insertedinto the soil surface for approximately 1 min and averaged. Aclimate station with a thermistor (CR107-L; CampbellScientific, Logan, UT, USA) and anemometer were used torecord air temperature and wind speed at one location nearthe center of the harvested area throughout the experiment.
The wetted treatments received weekly water additionsthat totaled 20 % of the average long-term precipitationreceived in the nearby state college (∼10 km NE of the studysite). Mean monthly precipitation from 1882 to 2005 was
calculated from the US Historical Climatology Network data(Easterling et al. 1996). The calculated 20 % monthly pre-cipitation was divided into weekly watering amounts.During the growing season (April–November), water wasapplied weekly by hand with watering cans and water col-lected in on-site precipitation catchments. Five precipitationcatchments were constructed adjacent to the study plotsusing a wooden frame covered with clear corrugated roofingthat drained into 55-gal opaque barrels through roofing gut-ters. The barrels were wrapped with reflective insulation tolimit passive solar heating and reduce algal growth in thestored water. In the winter months (December–March), opentop containers were installed near the study plots to capturesnow, ice, and precipitation. Precipitation caught in the con-tainers was manually distributed on the plots weekly assnow, ice, or water. If the precipitation was in liquid form,we delivered the volume equivalent of 20 % of the long-termmean. If the collected precipitation was snow or ice, wemodified the delivery of the wetted treatment by adding thesnow and ice collected in containers that represent 20 % ofthe area of a study plot. The mass of the snow or ice insidethe containers was recorded and used to calculate waterequivalent in millimeters of wet precipitation.
A tipping bucket rain gauge within the study area mea-sured ambient precipitation. The quantity of water (whetherliquid, snow, or ice) applied weekly to the watered plots wasrecorded and percent effective watered treatment was calcu-lated by week, month, year, and experiment duration bydividing the wetted treatment amount by the ambient precip-itation. Soil volumetric water content (VWC) was measuredbetween 3.5 and 6.5 cm using the same Decagon ECH2OEC-TM soil probes recording hourly temperature. Starting insummer of 2009, additional soil VWC measurements werecollected every 2 weeks with a Theta Probe-type ML2x(Delta-T Devices, Cambridge, England). The Theta Probeintegrates VWC along 0 to 5 cm depth. In each naturalsubplot, three Theta Probe measurements were taken withinthe inner 25 cm boarder, and each of the three measurementswas the median of three readings from that specific location.Finally, gravimetric soil water content (in grams H2O pergram OD soil) was measured every season.
2.2 Climate-driven ecological thresholds
The six thresholds addressed by our hypotheses are (1)cumulative GDD5 and FFD, (2) optimal leaf temperaturefor photosynthesis (OLT), (3) LTG35, (4) soil F-Ts, (5) soilwater content below PWP, and (6) volumetric soil watercontent between PWP and FC or optimum water content(OWC).
Total GDD5 were calculated from May 2008 to August2010 with the equation ∑([(Tmax+Tmin) /2]−Tbase) withTbase=5 °C. We used the dominant method for calculating
M.D. McDaniel et al.
GDD, whe r e i f [ (Tm a x + Tm i n ) / 2 ] < T b a s e , t h e n[(Tmax+Tmin)/2]=Tbase (McMaster and Wilhelm 1997). FFDwere the number of days between March and November wherethe minimum daily IRR temperature was >0 °C. Optimal leafsurface temperature for carbon fixation was identified as 19.2–23.6 °C (Helliker and Richter 2008). The number of hourlysurface temperature measurements that fell between 19.2 and23.6 °C during daylight hours were summed for each plot andthen averaged within treatments. Likewise, the LTG35 was cal-culated in the samemanner but for all the data since temperaturesrarely exceeded this value at night.
The number of F-Ts was summed for each plot for theduration of the experiment. Soil F-Ts were identified with 5-cm depth soil temperature data from the Decagon ECH2OEC-TM soil probes. F-Ts occurred each time temperature fellbelow 0 °C and then returned above 0 °C. Not only is thefrequency of soil F-Ts biogeochemically important, but alsothe duration (Henry 2007). Therefore, we also calculated theduration between a freezing and thawing event for each plot.
The OWC was defined as any soil VWC between PWPand FC after converting these moisture thresholds frommatrix potentials to VWC. Water retention curves for fivesoil cores and bulk densities were used to make this conver-sion. For the water retention curves, a combination of raisedwater columns for potentials −0.001 to −0.01 MPa andpressure plates for potentials −0.01 to −1.5 MPa were used.The water retention curve was modeled using the vanGenuchten (1980) equation. The average VWC for each ofthe five soil cores at −1.5 MPa was 0.11 m3 m−3, which weused as the threshold value for PWP (Lambers et al. 2008).The average VWC when soil cores were at −0.01 MPa was0.28 m3 m−3, which we used as the threshold value for FC(Brady and Weil 2000).
2.3 Data analysis
Temperature and soil moisture data were presented and ana-lyzed in histograms. Histogram bins were created according toa modified method of Freedman and Diaconis (1981). Weused the equation h=2×[Q1−Q3]/n1/3, where h is the binsize, n is the total number of data points, and Q1 and Q3 arequartile 1 (25 %) and quartile 3 (75 %), respectively. Thenumber of bins (k) was calculated by using k=[Max−Min]/h,where Max and Min are the maximum and minimum values,respectively. Bivariate histograms of soil temperature andmoisture were created by crossing 1 °C intervals in tempera-ture with 0.010 m3 m−3 intervals in VWC in order to achievegreater resolution. All data analyses were conducted withStatistical Analysis Software version 9.1 (SAS Institute Inc.,Cary, NC, USA). Repeated-measures analysis of variance(ANOVA) was used to test treatment effects on soil moistureand temperature with proc mixed. The data used in theserepeated-measures ANOVA were pooled by month. For
ANOVAs on ecological threshold histogram data, post hoctests were performed to compare treatment means using lsmeans in SAS. An alpha value of 0.05 was used to determinesignificance. Data losses in the Decagon ECH2O EC-TMprobes due to damage from animals were gap-filled usingthe most recent 200 or more values in a simple linear regres-sion against other plots from the same treatment. These re-gressions had R2 values >0.75. Data for VWC were trimmedto the time period between the months of April to Octoberbecause the data were not as reliable during months withfreezing temperatures.
3 Results
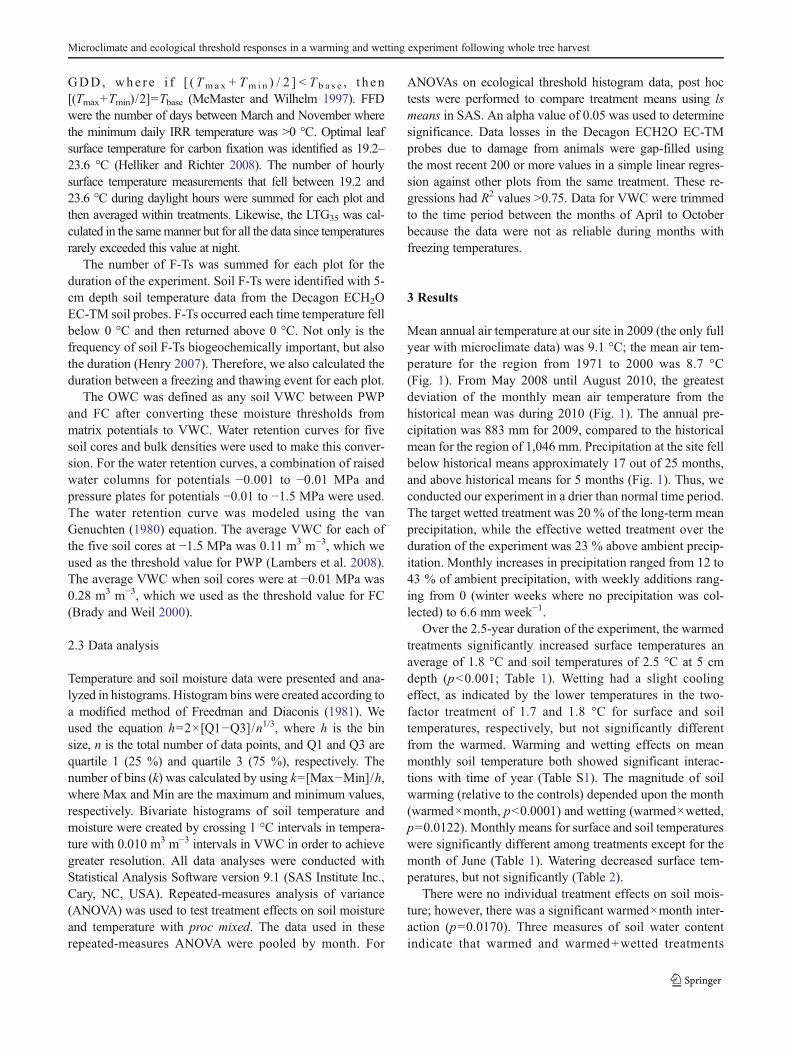
Mean annual air temperature at our site in 2009 (the only fullyear with microclimate data) was 9.1 °C; the mean air tem-perature for the region from 1971 to 2000 was 8.7 °C(Fig. 1). From May 2008 until August 2010, the greatestdeviation of the monthly mean air temperature from thehistorical mean was during 2010 (Fig. 1). The annual pre-cipitation was 883 mm for 2009, compared to the historicalmean for the region of 1,046 mm. Precipitation at the site fellbelow historical means approximately 17 out of 25 months,and above historical means for 5 months (Fig. 1). Thus, weconducted our experiment in a drier than normal time period.The target wetted treatment was 20 % of the long-term meanprecipitation, while the effective wetted treatment over theduration of the experiment was 23 % above ambient precip-itation. Monthly increases in precipitation ranged from 12 to43 % of ambient precipitation, with weekly additions rang-ing from 0 (winter weeks where no precipitation was col-lected) to 6.6 mm week−1.
Over the 2.5-year duration of the experiment, the warmedtreatments significantly increased surface temperatures anaverage of 1.8 °C and soil temperatures of 2.5 °C at 5 cmdepth (p<0.001; Table 1). Wetting had a slight coolingeffect, as indicated by the lower temperatures in the two-factor treatment of 1.7 and 1.8 °C for surface and soiltemperatures, respectively, but not significantly differentfrom the warmed. Warming and wetting effects on meanmonthly soil temperature both showed significant interac-tions with time of year (Table S1). The magnitude of soilwarming (relative to the controls) depended upon the month(warmed×month, p<0.0001) and wetting (warmed×wetted,p=0.0122). Monthly means for surface and soil temperatureswere significantly different among treatments except for themonth of June (Table 1). Watering decreased surface tem-peratures, but not significantly (Table 2).
There were no individual treatment effects on soil mois-ture; however, there was a significant warmed×month inter-action (p=0.0170). Three measures of soil water contentindicate that warmed and warmed+wetted treatments
Microclimate and ecological threshold responses in a warming and wetting experiment following whole tree harvest

decreased soil moisture, but not significantly (Table 2). Wettedtreatments showed no significant overall long-term increases insoil water content measured volumetrically or gravimetrically(Table 1). However, we observed pulses in VWC after wettingevents that typically lasted several hours (data not shown).
To validate soil temperature and moisture data collectedwith the Decagon ECH2O probes, we compared soil temper-ature and moisture data collected independently with hand-held probes. Buried sensors and handheld probes were well-correlated for soil temperature (R2=0.97), but not for VWC(R2=0.40) (Fig. 2). Buried Decagon VWC tended to under-estimate VWC compared to the handheld Theta Probe underVWC of 0.3 and, conversely, to overestimate VWC above0.3 (Fig. 2). We also used handheld probes to compare soiltemperature and moisture between the “planted” and “natu-ral” subplots. The soil moisture data were similar betweensubplots, falling along a 1:1 line (Fig. S2), but the soiltemperature was often greater in the “planted” subplots. Onaverage, “planted” subplots were 2.7±0.2 °C warmer than“natural” subplots.
Surface temperatures in warmed plots showed a signifi-cant increase in frequencies of 18–30 °C hourly measure-ments compared to nonwarmed plots, although this treat-ment effect diminishes for temperatures >33 °C (Fig. 3).The greatest effect of warming in both the single-factor andtwo-factor treatments was seen in the temperature ranges ofless than −6 to 0 °C, where frequencies in these bins weremuch higher than ambient and wetted (Fig. 3a). As expected,warmed treatments also experienced fewer hourly measure-ments below 0 °C than ambient or wetted. Warmed treat-ments significantly increased the number of GDD5 (Fig. 3b;p<0.0001) and FFD (Fig. 3c; p<0.0001). Warmed treat-ments recorded a greater number of hourly measurementswithin the range of optimal leaf temperature for C assimila-tion (19.2–23.6 °C based on Helliker and Richter 2008) thanambient and wetted (Fig. 3d; p<0.0001).
Generally, significant differences in soil temperatureamong treatments were at lower and higher temperatureranges (Fig. 4a). Warming significantly increased the num-ber of hourly soil temperatures recorded between 24 and
Month-Year
1 2 3 4 5 6 7 8 9 10 11 12 1 2 3 4 5 6 7 8 9 10 11 12 1 2 3 4 5 6 7 8 9 10 11 12
Mon
thly
Mea
n P
reci
pita
tion
(mm
)
0
20
40
60
80
100
120
140
160
180
200Historical+/- Std. Dev. of HistoricalAdded Precip.FoRCE
Mon
thly
Mea
n Te
mpe
ratu
re (
o C)
-10
-5
0
5
10
15
20
25
30Historical+/- Std. Dev. of HistoricalFoRCE
2008 2009 2010
a
b
Fig. 1 a Historical monthly mean air temperature (dashed line) and±standard deviations (dotted lines), and FoRCE air temperature (solidline) from 2008 to 2010. b Precipitation historical monthly means(dashed lines) and ±standard deviations (dotted lines), measured
precipitation at the FoRCE site (solid line), and amount of additionalprecipitation added to the wetted treatment plots (bars). Historicaltemperature and precipitation data were retrieved from Penn StateClimatologist (PSC 2010, http://climate.met.psu.edu)
M.D. McDaniel et al.

30 °C compared to ambient and wetted treatments (Fig. 4a).Warmed treatments did not greatly decrease the number ofhourly measurements recorded below 0 °C compared tononwarmed, but did significantly decrease measurementsof soils between 0 and 6 °C. Warmed treatments had signif-icantly less F-Ts (p=0.0006) than ambient and wetted treat-ments (Fig. 4b). There was also a significant warmed×-wetted effect on the duration of F-Ts (p=0.0402), but nosignificant difference among treatments.
There were no discernible trends in the distributionof VWC measurements compared among treatments(Fig. 5a), although there was one bin (0.15–0.20 range)with significant treatment effects on VWC. Warmed andwetted treatments did not significantly affect the numberof measurements when soils were below PWP (<0.11VWC) or extremely wet (>0.5 VWC), nor did thetreatments significantly alter the frequency of measure-ments between PWP and FC (Fig. 5b).
Table 1 Monthly averages for surface and soil temperatures and VWC from May 2008 to August 2010
Month Ambient Warmed Wetted Warmed+Wetted
Surface temperature (°C) January −4.9 (0.1) −2.8 (0.2) −4.9 (0.1) −2.6 (0.2)
February −2.1 (0.0) 0.5 (0.1) −2.3 (0.1) 0.1 (0.1)
March 5.8 (0.1) 8.0 (0.2) 5.7 (0.1) 7.8 (0.1)
April 11.2 (0.2) 12.9 (0.1) 11.2 (0.0) 12.9 (0.3)
May 15.5 (0.1) 17.0 (0.0) 15.3 (0.0) 16.8 (0.2)
June 21.1 (0.2) 21.9 (0.3) 21.0 (0.1) 21.9 (0.3)
July 22.0 (0.3) 23.5 (0.1) 21.5 (0.1) 23.2 (0.3)
August 21.0 (0.2) 23.0 (0.2) 20.7 (0.3) 22.5 (0.3)
September 17.1 (0.2) 18.9 (0.2) 16.7 (0.4) 18.9 (0.5)
October 9.4 (0.2) 11.1 (0.4) 9.0 (0.1) 11.4 (0.5)
November 5.4 (0.2) 7.5 (0.4) 5.0 (0.1) 7.5 (0.4)
December −1.5 (0.1) 0.5 (0.1) −1.8 (0.1) 0.6 (0.2)
Soil temperature (°C)at 5 cm depth
January 0.5 (0.1) 2.2 (0.5) 0.7 (0.0) 1.8 (0.3)
February 0.5 (0.2) 2.4 (0.4) 0.6 (0.1) 2.0 (0.3)
March 5.2 (0.1) 8.4 (0.4) 5.3 (0.2) 8.2 (0.3)
April 11.6 (0.2) 14.2 (0.4) 11.6 (0.2) 13.7 (0.2)
May 15.5 (0.2) 17.4 (0.4) 15.3 (0.1) 16.8 (0.1)
June 20.0 (0.3) 21.8 (0.3) 20.4 (0.2) 20.7 (0.1)
July 21.1 (0.1) 23.5 (0.3) 21.6 (0.3) 22.6 (0.1)
August 21.0 (0.1) 23.8 (0.3) 21.5 (0.3) 22.9 (0.2)
September 18.0 (0.1) 20.8 (0.3) 18.5 (0.2) 20.1 (0.4)
October 11.8 (0.3) 14.1 (0.7) 12.1 (0.1) 14.2 (0.5)
November 8.0 (0.2) 10.8 (0.8) 7.9 (0.1) 10.4 (0.6)
December 2.3 (0.3) 5.1 (0.6) 2.4 (0.1) 4.5 (0.3)
Soil moisture (m3 m−3)at 5 cm depth
January
February
March
April 0.336 (0.032) 0.333 (0.016) 0.340 (0.024) 0.324 (0.017)
May 0.333 (0.035) 0.323 (0.017) 0.354 (0.021) 0.306 (0.021)
June 0.264 (0.039) 0.253 (0.011) 0.272 (0.019) 0.235 (0.025)
July 0.207 (0.037) 0.195 (0.005) 0.209 (0.015) 0.192 (0.023)
August 0.193 (0.035) 0.149 (0.006) 0.165 (0.024) 0.172 (0.028)
September 0.220 (0.032) 0.180 (0.012) 0.177 (0.020) 0.179 (0.026)
October 0.335 (0.033) 0.278 (0.019) 0.288 (0.028) 0.262 (0.033)
November
December
Standard errors (n=4) are in parentheses, and treatments significantly different than ambient are in italics
Microclimate and ecological threshold responses in a warming and wetting experiment following whole tree harvest

Binned frequencies of combined soil temperature andmoisture intervals (e.g., 9–10 °C and 0.22–0.23 VWC)
showed different patterns in warmed versus wetted soils(Fig. 6). Each panel in Fig. 6 plots the mean (n=4) frequen-cies for each treatment. Warming shifted the inverted L-shaped bivariate frequency figures in ambient and wettedto a more diagonal shape. The ambient and wetted treatmentsappeared to have a wider distribution in both temperatureand moisture directions. The warmed treatment has less wet-hot measurements than all the other treatments. Ambient andwetted treatments show distinct vertical lines across the leftside of the graphs between freezing and ∼2 °C, whereaswarmed and warmed+wetted graphs do not have as distinctvertical lines, but do have large, high-frequency wet-coldareas (upper left corners).
4 Discussion
One important question that arises from this research andother ECME results is: Do the climate manipulations actual-ly represent what is predicted to occur by GCMs? Warmingwith IR heaters has sparked a debate as to whether or not theyrealistically mimic future terrestrial microclimate conditions(Aronson and McNulty 2009; Kimball 2011). Kimball(2005) mentions that vapor pressure deficits caused by theIR heaters can be one of the main unintended warmingeffects, but that this can be overcome by adding supplemen-tal water. Carlyle et al. (2011) found that using open topchambers and rainout shelters to manipulate temperature andprecipitation created unintended “crossover” effects. In otherwords, manipulating temperature will affect a precipitationresponse variable (soil moisture) and vice versa. We ob-served this in our experiment as supplemental precipitationhad a cooling effect on soil temperatures. The inextricablelink between these two microclimate variables was furtheremphasized in this study.
Suspended IR heaters simulated the increases in meantemperature by raising surface temperatures an average of1.8 °C. This increase in surface temperature was accompa-nied by a mean increase in soil temperature of up to 2.5 °C.
Table 2 Mean deviations from ambient (i.e., treatment minus ambient) for soil temperature and moisture from May 2008 to August 2010
Warmed Wetted Warmed+Wetted
Soil temperature or moisture measurement n Difference from ambient temperature (°C)
Surface temperature—infrared radiometer 19,255 1.8 (0.0) −0.3 (0.0) 1.7 (0.0)
Soil temperature—Decagon ECH2O 20,588 2.5 (0.0) 0.2 (0.0) 1.8 (0.0)
Soil temperature—Taylor 10 1.8 (0.2) 0.3 (0.2) 1.4 (0.3)
Difference from ambient water content (m3 m−3)
Volumetric water content—Decagon ECH2O 17,010 −0.029 (0.000) −0.013 (0.000) −0.026 (0.000)
Volumetric water content—Theta 22 −0.022 (0.020) 0.003 (0.004) −0.017 (0.009)
Gravimetric water content 9 −0.060 (0.019) 0.034 (0.016) −0.005 (0.047)
Mean deviations of treatments (n=4) and standard errors are shown in parentheses. Values significantly different than ambient are shown in italics
Decagon ECH2O EC-TM Temperature (°C)
0 5 10 15 20 25 30
Tayl
or T
herm
omet
er T
empe
ratu
re (
°C )
0
5
10
15
20
25
30AmbientWarmedWettedWarmed + Wetted
y = 1.0051x - 0.1563R2 = 0.9706
Decagon ECH2O EC-TM VWC
0.0 0.1 0.2 0.3 0.4 0.5 0.6
Thet
a pr
obe
VW
C
0.0
0.1
0.2
0.3
0.4
0.5
0.6
y = 0.4566x - 0.1733R2 = 0.4002
b
a
Fig. 2 a Soil temperature regression as measured by the DecagonECH2O EC-TM probes at 5 cm depth and Taylor thermometers inte-grating 0–8 cm depth. b Soil moisture regression as measured by theDecagon ECH2O EC-TM probes at 5 cm depth and Theta Probesintegrating soil moisture from 0 to 5 cm depth
M.D. McDaniel et al.

Other studies have observed similar heating effects using thesame IR heaters (Harte et al. 1995; Kimball 2005; Wan et al.2002). The interactive effects of warming and wetting hadlittle effect on surface temperatures, but decreased soil
warming by over 25 %, from an average of +2.5 °C inwarmed plots to +1.8 °C in warmed+wetted plots. Thisinteraction was likely due to the cooling effects of greaterevapotranspiration in warmed+wetted plots. Vapor pressure
c
0
200
400
600
800
Surface Temperature - Infrared Radiometer
Temperature (°C) Interval
<-6
-6- -
3-3
- 00
- 33
- 66
- 99
- 12
12- 1
515
- 18
18- 2
121
- 24
24- 2
727
- 30
30- 3
3>
33
Fre
quen
cy
0
500
1000
1500
2000
2500Ambient Warmed Wetted Warmed & Wetted
< PWP < PWP
b
0
2000
4000
6000
8000
10000
a abb
a abb
d
Ambient Warmed Wetted Warmed &0
500
1000
1500
Wetted
aab b
a
***
***
*** *** **
***
***
***
*
**
Fig. 3 Surface temperatures (in degrees Celsius) measured with Apo-gee IRR. a Frequency of readings from May 2008 to August 2010.*p<0.05, **p<0.01, ***p<0.001, significance levels. b GDD5. c FFD.d Frequency of events with leaf temperatures in optimum C fixation
range (OLT, 19.2 to 23.6 °C). Bars represent treatment means and errorbars are ±1 standard error (n=4). Post hoc tests were least squaredmeans with significance set at α<0.05, and lowercase letters indicatesignificance
Soil Temperature - Decagon ECH2O EC-TM
Temperature (°C) Interval
<-6
-6- -
3-3
- 00
- 33
- 66
- 99
- 12
12- 1
515
- 18
18- 2
121
- 24
24- 2
727
- 30
30- 3
3>
33
Fre
qu
ency
0
1000
2000
3000
4000
5000
Ambient Warmed Wetted Warmed & Wetted
a
b
Ambient Warmed Wetted Warmed &0
20
40
60
80
aa
b b
Wetted
*
***
***
***
*
**
***
***
Fig. 4 Soil temperatures (in degrees Celsius) measured with DecagonECH2O EC-TM probes. a The frequency of temperature readings at5 cm depth. *p<0.05, **p<0.01, ***p<0.001, significance levels. bThe frequency of soil F-Ts from May 2008 to August 2010. Bars
represent treatment means and error bars are the standard error(n=4). Post hoc tests were least squared means with significance setat α<0.05, and lowercase letters indicate significance
Microclimate and ecological threshold responses in a warming and wetting experiment following whole tree harvest

gradients and evapotranspiration have been shown to changeunder warming simulated by these IR heaters, and addingwater could alleviate this artifact (Kimball 2005).
We hypothesized that the warming treatment wouldlengthen the growing season by increasing the number ofGDD5 and FFD. Our data support this hypothesis; warmed
and warmed+wetted plots had more FFD and GDD thanambient or wetted only plots. Even though wetted treatmentsgenerally depressed surface temperatures over the course ofthe experiment, wetting had little effect on GDD5 and FFD.In temperate forests, the mean annual temperature is belowthe OLT range for C fixation (Helliker and Richter 2008).
Volumetric Water Content - Decagon ECH2O EC-TM
VWC Interval (m3 m-3)
0.00
-0.0
50.
05-0
.10
0.10
-0.1
50.
15-0
.20
0.20
-0.2
50.
25-0
.30
0.30
-0.3
50.
35-0
.40
0.40
-0.4
50.
45-0
.50
>0.5
0
Fre
qu
ency
0
1000
2000
3000
Ambient Warmed Wetted Warmed & Wetted b
Ambient Warmed Wetted Warmed &0
2000
4000
6000
8000
10000
Wetted
a**
Fig. 5 Soil VWC measured with Decagon ECH2O EC-TM probes. aThe frequency of VWC readings at 5 cm depth from May 2008 toAugust. *p<0.05, **p<0.01, ***p<0.001, significance levels. b Fre-quency of readings between PWP, determined at a value of −15 MPa,
and FC (−0.01MPa). Bars represent treatment means and error bars arethe standard error (n=4). Post hoc tests were least squared means withsignificance set at α<0.05, and lowercase letters indicate significance
Vol
umet
ric W
ater
Con
tent
(m3 m
-3)
0.1
0.2
0.3
0.4
0.5
0 25 50 75 100 125
Temperature (°C)
0 5 10 15 20 25
0.1
0.2
0.3
0.4
0.5
0 5 10 15 20 25
Ambient Warmed
Wetted Warmed + Wetted
a b
c d
Fig. 6 Bivariate contourhistograms with soiltemperature and VWCfrequencies at 5 cm depthshown for a ambient, bwarmed,cwetted, and dwarmed+wettedtreatments. Frequencies, shownin the colors, are the means(n=4) from each treatment. Thehistogram bins were created bycrossing 0.01 intervals in VWCwith 0.5 intervals in temperature
M.D. McDaniel et al.

Thus, we predicted that the warmed treatments would increasethe number of hours that plant surface temperatures are withinthe optimal photosynthetic range of 19.2 to 23.6 °C. Thishypothesis was also supported; we found that warmed plotsexperienced significantly more time in the optimum tempera-ture range than nonwarmed plots. Biochemical processes,such as photosynthesis and respiration, are increased at highertemperatures because of changes in activation energy andenzyme function (Way and Oren 2010); however, these effectswill not be experienced similarly by all plant species. Forinstance, in some regions, plants are already at or near theirgrowing season optima temperatures and they could be neg-atively impacted by climate change. Therefore, the conse-quences of a warmer world on plant-level physiology couldscale up to have regional to global impacts on species successand distribution (Hamann andWang 2006; Iverson and Prasad1998).We found that temperatures above 35 °C occurred in alltreatments, which is a temperature threshold where plantbiochemical pathways are adversely affected (Schrader et al.2004).Warmed plots only had slightly (nonsignificant) greaterfrequency of measurements above 35 °C.
The freezing point of soil water is a critical temperaturethreshold in soils and can exert controls on ecosystem func-tioning. Based on prior research (Fitzhugh et al. 2001;Groffman et al. 2001a), we hypothesized that warming wouldreduce snowpack that insulates soils, leading to an increase insoil F-Ts (Hardy et al. 2001). In contrast to our expectation,warmed plots had fewer soil F-Ts than ambient plots or wettedplots. A major difference between snow removal experimentsand our experiment is that, after melting, thermal inputs fromthe IR heaters prevented exposed soils from dropping below0 °C. One explanation for these results is that the PID systemcontrolling the warming is quick enough to warm before soiltemperatures reach 0 °C. In contrast, a system that has aslower feedback mechanism may warm soils, next allow themto cool below 0 °C, and then warm them again, therebycreating more F-Ts. Soil F-Ts are an important threshold fordetermining soil microbial processes and root dynamics(Fitzhugh et al. 2001; Groffman et al. 2001a; Matzner andBorken 2008), and our results show that this threshold is verysensitive to details of heater programming.
The direct effect hypothesis that wetting increases soilmoisture was not supported. We did not show that wettingincreased the time that soil moisture is between PWP(−1.5 MPa) and FC (−0.01 MPa). Our data trend in thisdirection, but the treatments were not significantly different.The lack of a prolonged soil moisture effect seen in thewatered treatments was unexpected, as was the lack of soildrying in the warmed plots (Harte et al. 1995; Kimball 2005).Possible explanations for the lack of soil moisture response toclimate manipulations include soil probe limitations (e.g.,high variability) and possible effects of plant communitieson the physical soil conditions or water movement from soils.
Decagon ECH2O probe readings have been found to betemperature dependent, with every 1 °C increase in tempera-ture relating to a 0.1 % decrease in the VWC estimate(Czarnomski et al. 2005). However, this artifact of warmingon VWC would cause warmed treatments to have lowerVWC, which is opposite to the trend we observed (Fig. 5b).Additionally, forest harvesting disturbs soil hydrologic pro-cesses (Huang et al. 1996), which could in turn affect both soilwater content and probe efficacy. Indeed, soil moisture asmeasured with the Decagon probes was much more variablethan temperature (Figs. 4 and 5) and did not correlate as wellwith an independent measure of surface soil moisture (Fig. 2).
Another factor affecting soil temperature and moistureprobe operation could be the large amount of regenerativeroot growth resulting from the postharvest environment of ourstudy site. Roots were observed growing around the Decagonsoil moisture probes, which could have affected soil moisturereadings by either interference or plant drawdown of soilwater. The lack of soil drying effect by warming may havebeen due to water transported by plants from deeper toshallower depths in the soil profile, which we cannot confirmbecause we only have moisture data to 5 cm depth. Treespecies’ composition measured in these plots were differentamong treatments (Rollinson et al. 2012), and individual treespecies are known for differences in soil water uptake andhydraulic lift (Aranda et al. 2012; Jackson et al. 1999).However, we found that overall root biomass in the upper15 cm was not different among plots (unpublished data).Thus, concomitant changes in plant communities with wettingmay have been responsible for the lack of a wetting effect onsoil moisture, but we were unable to confirm this.
The interactions of the treatment effects on soil temperatureand moisture were apparent in the altered distributions in thebivariate histograms (Fig. 6). Observing soil temperature andmoisture frequency data in these bivariate histograms can bemore helpful than the individual microclimate histograms alone(Figs. 4 and 5) because these two variables have interactingeffects on ecosystem structure and function. First, the verticallines between 0 and ∼2 °C are indicative of unreliable VWCreadings during this time because of soil water freezing. Thewarmed treatments, while lacking this vertical line, show anincrease in frequency of data in the wet and just-above-freezingregions, which is due to the IR heaters preventing freezing andkeeping the soils moist. The overall shift in distributions frommore of an “inverted L” shape in the nonheated to a diagonalshape in the warmed treatments reflects a warming-induceddrying at higher temperatures. These data suggest that we haveultimately changed the soil temperature–moisture regimes, butthat there are anomalies missed (e.g., high variability innonheated plots at lower temperatures) when analyzing eachmicroclimate variable separately.
The seven climate-driven ecological thresholds we exam-ined in this manuscript impact ecosystem functioning and
Microclimate and ecological threshold responses in a warming and wetting experiment following whole tree harvest

structure. Added precipitation did not noticeably affect thenumber of extremely dry or wet measurements. Warmedtreatments often resulted in less snowpack (from observa-tion), but the IR heater warming was great enough to preventsoil freezing. Warmed treatments also increased the GDD5,FFD, and the time leaf temperatures spent in the optimalphotosynthetic range. PWP was used as an indicator of waterstress; watered and warmed treatments did not show anysignificant effect on frequency of readings below PWP.Thus, some of the climate-driven, ecologically importantthresholds followed predictable patterns (direct warminghypotheses); however, some of our hypotheses were notsupported, meaning that unpredictable threshold responsesare possible in the use of ECMEs intended to study theeffects of climate change on ecosystem structure andfunction.
5 Conclusion
Mean warming predicted by GCMs for northeastern USAwas successfully mimicked in a postharvest forest climatemanipulation experiment in central Pennsylvania. Thiswarming was expected to lead to changes in the regeneratingforest ecosystem’s structure and function. Despiteaugmenting precipitation by 23 %, we did not observe aprolonged response in soil moisture with the Decagonprobes. Interactive effects between the two climate variables(wetting-induced cooling of surface and soil temperatures)emphasize the importance of conducting multivariate cli-mate change experiments. On the whole, the microclimatein this regenerating forest ecosystem showed significant re-sponses to what are low-level to mid-level predicted changesof climate in the northeastern USA. We found that some ofthe hypotheses regarding critical, climate-driven ecologicalthresholds from a warmed and wetted experiment were sup-ported. However, the increase of F-Ts and lack of prolongedVWC increase due to wetted treatments contrasted with ourinitial hypotheses.
Ecosystem climate manipulation studies often report onlymean responses in microclimatic variables (e.g., mean tem-perature increases), and our data are consistent with thesefindings. However, we evaluated thresholds that are likely asimportant, if not more, to ecological functioning as means ofmicroclimatic variables. We suggest that future ECMEs,especially those crossing multiple treatments, also reportmicroclimatic thresholds that are known to impact ecologicalfunctioning.
Acknowledgments We thank Brandon Frazier, Christopher Hone,and Erica Dreibelbis for their help in the field and laboratory. Thisresearch was supported by a grant from the Northeastern RegionalCenter of the Department of Energy National Institute for ClimateChange Research.
References
Aranda I, Forner A, Cuesta B, Valladares F (2012) Species-specificwater use by forest tree species: from the tree to the stand. AgrWater Manage 114:67–77
Aronson E, McNulty S (2009) Appropriate experimental ecosystemwarming methods by ecosystem, objective, and practicality. AgrFor Meteor 149:1791–1799
Brady N, Weil R (2000) The nature and properties of soils. PrenticeHall, Upper Saddle River
Carlyle C, Fraser L, Turkington R (2011) Tracking soil temperature andmoisture in a multi-factor climate experiment in temperate grass-land: do climate manipulation methods produce their intendedeffects? Ecosystems 14:489–502
Chen J, Saunders S, Crow T, Naiman R, Brosofske K, Mroz G,Brookshire B, Franklin J (1999) Microclimate in forest ecosystemand landscape ecology. BioSci 49:288–297
Czarnomski N, Moore G, Pypker T, Licata J, Bond B (2005) Precisionand accuracy of three alternative instruments for measuring soilwater content in two forest soils of the Pacific Northwest. Canad JFor Res 35:1867–1876
DeLuca T, Keeney D, McCarty G (1992) Effect of freeze–thaw eventson mineralization of soil nitrogen. Biol Fert Soils 14:116–120
Dreyer E, Le Roux X, Montpied P, Daudet F, Masson F (2001)Temperature response of leaf photosynthetic capacity in seedlingsfrom seven temperate tree species. Tree Physiol 21:223–232
Easterling D, Karl T, Mason E, Hughes P, Bowman D (1996) UnitedStates Historical Climatology Network (U.S. HCN) monthly tem-perature and precipitation data. ORNL/CDIAC-87, NDP-019/R3.Carbon Dioxide Information Analysis Center, Oak Ridge NationalLaboratory, US Department of Energy, Oak Ridge, Tennessee
Fay P, Carlisle J, Knapp A, Blair J, Collins S (2000) Altering rainfalltiming and quantity in a mesic grassland ecosystem: design andperformance of rainfall manipulation shelters. Ecosyst 3:308–319
Fitzhugh R, Driscoll C, Groffman P, Tierney G, Fahey T, Hardy J(2001) Effects of soil freezing disturbance on soil solution nitro-gen, phosphorus, and carbon chemistry in a northern hardwoodecosystem. Biogeochem 56:215–238
Freedman D, Diaconis P (1981) On the histogram as a density estima-tor: L2 theory. J Appl Math Mech 57:453–476
Groffman P, Driscoll C, Fahey T, Hardy J, Fitzhugh R, Tierney G(2001a) Colder soils in a warmer world: a snow manipulationstudy in a northern hardwood forest ecosystem. Biogeochem56:135–150
Groffman P, Driscoll C, Fahey T, Hardy J, Fitzhugh R, Tierney G(2001b) Effects of mild winter freezing on soil nitrogen and carbondynamics in a northern hardwood forest. Biogeochem 56:191–213
Groffman P, Baron J, Blett T, Gold A, Goodman I, Gunderson L,Levinson B, Palmer M, Paerl H, Peterson G, Poff N, Rejeski D,Reynolds J, Turner M, Weathers K, Wiens J (2006) Ecologicalthresholds: the key to successful environmental management or animportant concept with no practical application? Ecosystems 9:1–13
Grogan P, Michelsen A, Ambus P, Jonasson S (2004) Freeze–thawregime effects on carbon and nitrogen dynamics in sub-arctic heathtundra mesocosms. Soil Biol Biochem 36:641–654
Hamann A, Wang T (2006) Potential effects of climate change onecosystem and tree species distribution in British Columbia.Ecology 87:2773–2786
Hardy J, Groffman P, Fitzhugh R, Henry K, Welman A, Demers J,Fahey T, Driscoll C, Tierney G, Nolan S (2001) Snow depthmanipulation and its influence on soil frost and water dynamicsin a northern hardwood forest. Biogeochem 56:151–174
Harte J, Torn M, Chang F, Feifarek B, Kinzig A, Shaw R, Shen K(1995) Global warming and soil microclimate: results from ameadow-warming experiment. Ecol Appl 5:132–150
M.D. McDaniel et al.

Hayhoe K, Wake C, Huntington T, Luo L, Schwartz M, Sheffield J,Wood E, Anderson B, Bradbury J, Degaetano A, Troy T, Wolfe D(2007) Past and future changes in climate and hydrological in-dicators in the US Northeast. Clim Dynam 28:381–407
Helliker B, Richter S (2008) Subtropical to boreal convergence of tree-leaf temperatures. Nature 454:511–514
Henry H (2007) Soil freeze–thaw cycle experiments: trends, methodo-logical weaknesses and suggested improvements. Soil BiolBiochem 39:977–986
Huang J, Lacey S, Ryan P (1996) Impact of forest harvesting on thehydraulic properties of surface soil. Soil Sci 161:79–86
Iverson L, Prasad A (1998) Predicting abundance of 80 tree speciesfollowing climate change in the eastern United States. EcolMonogr 68:465–485
Jackson P, Meinzer F, Bustamante M, Goldstein G, Franco A, Rundel P,Caldas L, Igler E, Causin F (1999) Partitioning of soil wateramong tree species in a Brazilian Cerrado ecosystem. TreePhysiol 19:717–724
Kimball B (2005) Theory and performance of an infrared heater forecosystem warming. Glob Change Biol 11:2041–2056
Kimball B (2011) Comment on the comment by Amthor et al. on“Appropriate experimental ecosystem warming methods” byAronson and McNulty. Agr For Meteor 151:420–424
Knapp A, Philip A, Blair J, Collins S, Smith M, Carlisle J, Harper C,Danner B, Lett M, McCarron J (2002) Rainfall variability, carboncycling and plant species diversity in a mesic grassland. Science298:2202–2205
Kobza J, Edwards G (1987) Influences of leaf temperature on photo-synthetic carbon metabolism in wheat. Plant Physiol 83:69–74
Körner C, Basler D (2010) Phenology under global warming. Science327:1461–1462
Lambers H, Chapin F, Pons T (2008) Plant water relations, plantphysiological ecology. Springer, New York, pp 163–223
Lechowicz M (1984) Why do temperate deciduous trees leaf out atdifferent times? Adaptation and ecology of forest communities.Am Nat 124:821–842
Matzner E, Borken W (2008) Do freeze–thaw events enhance C and Nlosses from soils of different ecosystems? A review. Europ J SoilSci 59:274–284
McMaster G, Wilhelm W (1997) Growing degree-days: one equation,two interpretations. Agr For Meteor 87:291–300
Melillo J, Steudler P, Aber J, Newkirk K, Lux H, Bowles F, Catricala C,Magill A, Ahrens T, Morrisseau S (2002) Soil warming andcarbon-cycle feedbacks to the climate system. Science 298:2173–2176
Morgan J, LeCain D, Pendall E, Blumenthal D, Kimball B, Carrillo Y,Williams D, Heisler-White J, Dijkstra H, West M (2011) C4
grasses prosper as carbon dioxide eliminates desiccation inwarmed semi-arid grassland. Nature 476:202–206
Norby R et al (1997) Temperature-controlled open-top chambers forglobal change research. Glob Change Biol 3:259–267
Panikov N, Flanagan P, Oechel W, Mastepanov M, Christensen T(2006) Microbial activity in soils frozen to below −39 °C. SoilBiol Biochem 38:785–794
Pearce R (2001) Plant freezing and damage. Ann Bot 87:417–424Porporato A, Daly E, Rodriguez-Iturbe I (2004) Soil water balance and
ecosystem response to climate change. Am Nat 164:625–632Price M,Waser N (2000) Responses of subalpine meadow vegetation to
four years of experimental warming. Ecol Appl 10:811–823PSC (2010) The Pennsylvania State Climatologist. http://climate.met.
psu.edu. Accessed 12 Feb 2010Rivkina E, Friedmann E, McKay C, Gilichinsky D (2000) Metabolic
activity of permafrost bacteria below the freezing point. ApplEnviron Microb 66:3230–3233
Rollinson C, Kaye M (2012) Experimental warming alters phenologyof certain plant functional groups in an early-successional forestcommunity. Glob Change Biol 18:1108–1116
Rollinson C, Kaye M, Leites L (2012) Community assembly and plantcover responses to experimental warming and increased precipita-tion of an early successional forest. Ecosphere 3:122
Schrader S, Wise R, Wacholtz W, Ort D, Sharkey T (2004) Thylakoidmembrane responses to moderately high leaf temperature in Pimacotton. Plant Cell Environ 27:725–735
Schwinning S, Ehleringer J (2001) Water use trade-offs and optimaladaptations to pulse-driven arid ecosystems. J Ecol 89:464–480
Solomon S (ed) (2007) IPCC climate change 2007—the physical sci-ence basis. Contribution of Working Group I to the fourth assess-ment report of the intergovernmental panel on climate change, vol4. Cambridge University Press, New York
Sykes M, Prentice I, Cramer W (1996) A bioclimatic model for thepotential distributions of North European tree species under pres-ent and future climates. J Biogeogr 23:203–233
van der Meer P, Jorritsma I, Kramer K (2002) Assessing climate changeeffects on long-term forest development: adjusting growth, phenology,and seed production in a gap model. For Ecol Manage 162:39–52
van GenuchtenM (1980) A closed-form equation for predicting the hydrau-lic conductivity of unsaturated soils. Soil Sci Soc Am J 44:892–898
Veihmeyer F, HendricksonA (1949)Methods of measuring field capacityand permanent wilting percentage of soils. Soil Sci 68:75–94
Wan S, Luo Y, Wallace L (2002) Changes in microclimate induced byexperimental warming and clipping in tallgrass prairie. GlobChange Biol 8:754–768
Way D, Oren R (2010) Differential responses to changes in growthtemperature between trees from different functional groups andbiomes: a review and synthesis of data. Tree Physiol 30:669–688
Wu Z, Dijkstra P, Koch G, Peñuelas J, Hungate B (2011) Responses ofterrestrial ecosystems to temperature and precipitation change: ameta-analysis of experimental manipulation. Glob Change Biol17:927–942
Wullschleger S, Hanson P (2006) Sensitivity of canopy transpiration toaltered precipitation in an upland oak forest: evidence from a long-term field manipulation study. Glob Change Biol 12:97–109
Microclimate and ecological threshold responses in a warming and wetting experiment following whole tree harvest