microchemicaljournal - xiamen university · 2.3. watersamples tap water was collected in...
TRANSCRIPT
Contents lists available at ScienceDirect
Microchemical Journal
journal homepage: www.elsevier.com/locate/microc
Automated syringe-pump-based flow-batch analysis for spectrophotometricdetermination of trace hexavalent chromium in water samplesXiangyu Zhu, Yao Deng, Peicong Li, Dongxing Yuan, Jian Ma⁎
State Key Laboratory of Marine Environmental Science, Fujian Provincial Key Laboratory for Coastal Ecology and Environmental Studies, College of the Environment andEcology, Xiamen University, Xiamen 361102, People's Republic of China
A R T I C L E I N F O
Keywords:Flow-batch analysisSyringe pumpLiquid waveguide capillary cellHexavalent chromiumBottled water
A B S T R A C T
In this work, we established an automated spectrophotometric method for determining hexavalent chromium inwater samples using an integrated syringe pump-based environmental water analyzer (iSEA) based on the classic1,5‑diphenylcarbazide chemistry. The device was computer-controlled with programs written by LabVIEW. Theeffects of reagent concentration, sample salinity and foreign ion interferences were investigated. Standard so-lutions (GBW(E)081584-1) were used to test the accuracy of the method. When equipped with a 5 cm Z-shapedflow cell, the detection limit was 0.024 μM with sample throughput of> 30 h−1. In order to meet the re-quirements for trace Cr(VI) determination, the system was modified with a 2.5m liquid waveguide capillary cell(internal diameter of 0.55mm). The sample consumption was< 2.1mL. The detection limit was 0.54 nM withsample throughput of 20 h−1 and good linearity with R2= 0.9985 (n=110, obtained over 14 days). The twomethods were successfully applied to determine Cr(VI) level in different water samples including tap water, riverwater, industrial wastewater and 37 brands of bottled water with spiked recovery in the range of 89.5%–117%.
1. Introduction
Chromium (Cr) is extensively and intensively used in modern in-dustry. Its applications include metal finishing, electroplating, textiledyes, catalyst and wood preservatives. Due to its wide use, largequantities of chromium are released into the environment causingwidespread pollution [1]. Chromium typically exists in two oxidationstates in surface and ground water - trivalent and hexavalent, which arevery different in charge and physicochemical properties [2]. Trivalentchromium [Cr(III)] is considered to be a trace element essential for theproper functioning of living organisms, whereas hexavalent chromium[Cr(VI)] can induce tumors in the alimentary tract of animals viadrinking water exposure [3]. Currently, World Health Organization(WHO) has set a 50 μg/L (~0.96 μM) provisional guideline value fortotal chromium in drinking water. It should be noted that the guidelinevalue is designated as provisional because of uncertainties in the tox-icological database [4]. The Office of Environmental Health HazardAssessment (OEHHA) of California has published an impressive0.02 μg/L (∼0.4 nM) Public Health Goal (PHG) for hexavalent chro-mium in drinking water [5]. Although PHG is based solely on scientificand public health considerations, and not on economic factors andtechnical feasibility, it underlines the paramount importance ofachieving accurate, sensitive and specific detection of Cr(VI) in
environmental and potable water for both environmental quality andpublic health concerns. It should also be noted that OEHHA has in-itiated the update of the PHG for Cr(VI) in 2016 and is still in process[6].
As a widespread and notorious hazardous material, Cr(VI) has re-ceived ongoing attention from both environment researchers and ana-lytical chemists. Instrumental techniques including atomic absorptionspectrometry (flame-AAS, graphite-furnace-AAS, electrothermal-AAS)[7–9], inductively coupled plasma optical emission spectrometry (ICP-OES) [10], and inductively coupled plasma mass spectrometry (ICP-MS)[11] etc., have been well established for the analysis for chromium.However, these benchtop instruments typically require trained ex-pertise and time-consuming pretreatments for selective determinationof Cr(VI) [12]. Very recently, some novel methods have been reported,such as laser-induced breakdown spectroscopy [13], thermal lens mi-croscopy [14], nanostructured hybrid photoelectrochemical sensor [15]and functionalized fluorescent probes [16,17]. Nevertheless, the re-quirements of sophisticated instruments and commercially unavailablematerials might limit their wide application for routine analysis.Therefore, it remains important to develop novel rapid, accessible andeasy-to-use Cr(VI) detection methods.
Spectrophotometric detection based on the classic 1,5‑diphe-nylcarbazide (DPC) chemistry is an attractive approach due to its
https://doi.org/10.1016/j.microc.2018.12.040Received 20 November 2018; Received in revised form 19 December 2018; Accepted 19 December 2018
⁎ Corresponding author.E-mail address: [email protected] (J. Ma).
Microchemical Journal 145 (2019) 1135–1142
Available online 20 December 20180026-265X/ © 2018 Elsevier B.V. All rights reserved.
T
simplicity, good sensitivity and high selectivity for Cr(VI). Both its basicform of colorimetric method and development of ion chromatography-post column reaction method have been accepted as standard methods[18]. Although more than a century has passed since the early estab-lishment of the DPC chemistry [19], the well-known reaction has beencontinuously coupled to a variety of sample pretreatment processes(solid phase extraction (SPE) [20], solid phase microextraction (SPME)[21], hollow fiber membrane liquid phase microextraction (HF-LPME)[22], dispersive liquid-liquid microextraction (DLLME) [23], etc.) andanalytical devices (microfluidic paper-based analytical device (μPAD)[22], 3D printed flow device [24], etc.), thus breathing new life intothis chemistry. Among the various modifications and evolutions, flow-based methods [25–28] stand out because of their automation, ease ofoperation, possible miniaturization, good reproducibility and versati-lity. For example, Ohira et al. [29] reported an ion transfer device (ITD)to separate oppositely-charged Cr(III) and Cr(VI), and the two differentacceptor solutions were subsequently determined by flow injectionanalysis (FIA), which was easier to operate compared to their previousICP-MS adaptation of ITD [30].
Among varieties of flow-based methods, flow-batch analysis (FBA)allows implementation of well-established wet chemistries whileminimizing operator errors [31]. Combined features of flow-based andbatch-wise systems make FBA suitable for routine, field and versatileuse [32,33]. Recently, a fully-automated integrated Syringe-pump-based Environmental-water Analyzer (iSEA) was developed in ourgroup, which was portable, robust and has been successfully applied toperform high-resolution real-time monitoring of ammonium in freshwater and coastal area [34,35]. The iSEA system implemented FBA, butit utilized a programmable syringe pump and only one glass syringe,together with a LED light source and a miniature CCD spectro-photometer. In principle, iSEA exploited the concept of “Lab-in-Syr-inge” (LIS) which was proposed by Maya et al. [36–38]. In LIS format,certain drawbacks involved in FIA and FBA like decreased sensitivitywith non-equilibrium detection [39] and volume inaccuracy for longtime determination due to roller pulsation of peristaltic pumps [31] arecircumvented. To date, the attractive features of LIS have been re-cognized and the versatility of LIS has been demonstrated by manyother applications [28,40–42]. A novel in-syringe magnetic-stirring-assisted dispersive liquid–liquid microextraction for trace determina-tion of Cr(VI) in waters using the DPC chemistry was reported pre-viously [43]. Considering the low concentration of Cr(VI) in typicalwater samples, especially in drinking water, conventional flow cellswith< 5 cm pathlength may not provide sufficient sensitivity. Longpathlength absorbance spectrophotometry, based on Lambert–Beer'slaw, is a green alternative strategy for trace metal analysis by avoidinglaborious pretreatment procedures which commonly involve toxic or-ganic solvents [44]. Liquid waveguide capillary cell (LWCC) has provenits applications in the determination of trace chromium [45–48] andother metals [49–53].
Based on the above background, herein, we present an automatedsyringe-pump-based flow-batch analysis method using 5 cm Z-shapedflow cell and 2.5 m LWCC for measuring Cr(VI) concentrations at dif-ferent levels. The effects of reagent concentration, sample salinity andinterferences on DPC chemistry were evaluated. The proposed methodwas applied to determine Cr(VI) levels in tap water, river water, in-dustrial wastewater and 37 brands of bottled drinking water with sa-tisfactory recovery.
2. Experimental
2.1. Reagents and solutions
Chemicals used throughout were of analytical grade, and purchasedfrom Sinopharm Chemical Reagent Co., China unless stated otherwise.All chemicals were used as received without further purification.Freshly made ultrapure water (resistivity ≥18.2MΩ cm, Millipore Co.,
USA) was used to prepare solutions. Aged oligotrophic surface seawatercollected from South China Sea which contained only nanomolar Cr(VI)was used for studying matrix effects. All containers were sequentiallyrinsed with ultrapure water, 2M HCl and ultrapure water prior to use.
Stock solution of Cr(VI) (4.00mM) was prepared by dissolving solidK2Cr2O7, previously dried at 105 °C for 2 h, in ultrapure water. Workingstandards of Cr(VI) were prepared daily by stepwise dilution of stocksolution. DPC solution of 0.5% (m/V) was prepared daily by dissolving0.10 g of 1,5‑diphenylcarbazide in 20mL of high purity acetone (Tedia,HPLC/Spectro). H2SO4 solution of 2.5M was prepared by dilution ofconcentrated sulfuric acid in ultrapure water (Guaranteed reagent,Xilong Scientific Co., Ltd.).
In interference study, standards of Cu(II), V(V) and Mo(VI) wereobtained by dissolving CuCl2 2H2O, NH4VO3 (Xilong Scientific Co.,Ltd.) and (NH4)6Mo7O24 4H2O (Guangdong Guanghua Sci-Tech Co.,Ltd.), respectively, in ultrapure water. Fe(III) stock solution (1000mg/L) was obtained from CertiPUR® (Merck, Germany). Standard solutionsof Cr(VI) (GBW(E)081584-1) used in the accuracy test were purchasedfrom Beijing Haianhongmeng Reference Material Technology Co., Ltd.
2.2. Apparatus and procedures
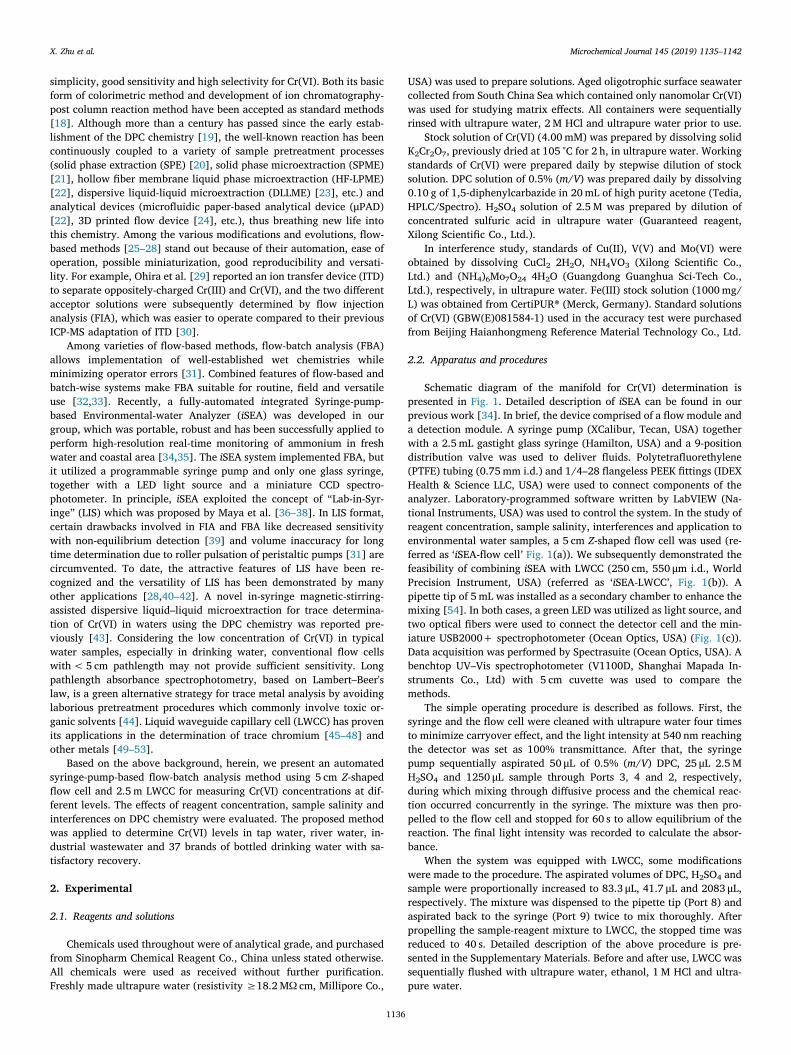
Schematic diagram of the manifold for Cr(VI) determination ispresented in Fig. 1. Detailed description of iSEA can be found in ourprevious work [34]. In brief, the device comprised of a flow module anda detection module. A syringe pump (XCalibur, Tecan, USA) togetherwith a 2.5mL gastight glass syringe (Hamilton, USA) and a 9-positiondistribution valve was used to deliver fluids. Polytetrafluorethylene(PTFE) tubing (0.75mm i.d.) and 1/4–28 flangeless PEEK fittings (IDEXHealth & Science LLC, USA) were used to connect components of theanalyzer. Laboratory-programmed software written by LabVIEW (Na-tional Instruments, USA) was used to control the system. In the study ofreagent concentration, sample salinity, interferences and application toenvironmental water samples, a 5 cm Z-shaped flow cell was used (re-ferred as ‘iSEA-flow cell’ Fig. 1(a)). We subsequently demonstrated thefeasibility of combining iSEA with LWCC (250 cm, 550 μm i.d., WorldPrecision Instrument, USA) (referred as ‘iSEA-LWCC’, Fig. 1(b)). Apipette tip of 5mL was installed as a secondary chamber to enhance themixing [54]. In both cases, a green LED was utilized as light source, andtwo optical fibers were used to connect the detector cell and the min-iature USB2000+ spectrophotometer (Ocean Optics, USA) (Fig. 1(c)).Data acquisition was performed by Spectrasuite (Ocean Optics, USA). Abenchtop UV–Vis spectrophotometer (V1100D, Shanghai Mapada In-struments Co., Ltd) with 5 cm cuvette was used to compare themethods.
The simple operating procedure is described as follows. First, thesyringe and the flow cell were cleaned with ultrapure water four timesto minimize carryover effect, and the light intensity at 540 nm reachingthe detector was set as 100% transmittance. After that, the syringepump sequentially aspirated 50 μL of 0.5% (m/V) DPC, 25 μL 2.5MH2SO4 and 1250 μL sample through Ports 3, 4 and 2, respectively,during which mixing through diffusive process and the chemical reac-tion occurred concurrently in the syringe. The mixture was then pro-pelled to the flow cell and stopped for 60 s to allow equilibrium of thereaction. The final light intensity was recorded to calculate the absor-bance.
When the system was equipped with LWCC, some modificationswere made to the procedure. The aspirated volumes of DPC, H2SO4 andsample were proportionally increased to 83.3 μL, 41.7 μL and 2083 μL,respectively. The mixture was dispensed to the pipette tip (Port 8) andaspirated back to the syringe (Port 9) twice to mix thoroughly. Afterpropelling the sample-reagent mixture to LWCC, the stopped time wasreduced to 40 s. Detailed description of the above procedure is pre-sented in the Supplementary Materials. Before and after use, LWCC wassequentially flushed with ultrapure water, ethanol, 1M HCl and ultra-pure water.
X. Zhu et al. Microchemical Journal 145 (2019) 1135–1142
1136
2.3. Water samples
Tap water was collected in centrifugal tubes from our lab inXiang'an campus of Xiamen University, China. After collection, thesample was immediately filtered through 0.45 μm syringe filters andanalyzed. River water was collected from Jiulong River, Fujian, China,filtered and analyzed as soon as possible. Industrial wastewater sampleswere collected using low density polyethylene bottles from an anon-ymous chromium electroplating steelworks in Zhangzhou, Fujian,China. Samples were transported to the lab, filtered and analyzedwithin 24 h.
For trace Cr(VI) determination, 37 brands of bottled water sampleswere purchased from local markets and online store in duplicate (ex-cept that 7 brands had only one sample) and kept sealed until analysis.The water samples were divided into three categories in terms of thewater type: (1) purified or pure drinking water (8 brands), (2) naturalmineral/spring/lake water (25 brands), and (3) drinking water withartificial additives (oxygen or minerals like KCl or MgSO4, 4 brands).
3. Results and discussion
3.1. Optimization of H2SO4 and DPC concentrations
As described above, the iSEA system implements combined flow-batch analysis and stopped-flow analysis. Additionally, with the aid ofprogrammable syringe pump, it is convenient to carry out reagentconcentration optimization and investigate the kinetics of the reactionwithout changing any hardware. To this end, ultrapure water wasspiked with 4.0 μM and 0.5 μM of Cr(VI) standards and then reactedwith varying volumes of H2SO4 (final concentration 0.014M–0.136M)and DPC solution (final concentration 0.005%–0.036%). Absorbancewas recorded for 5min. Reaction rate, sensitivity and repeatabilitywere taken into overall consideration.
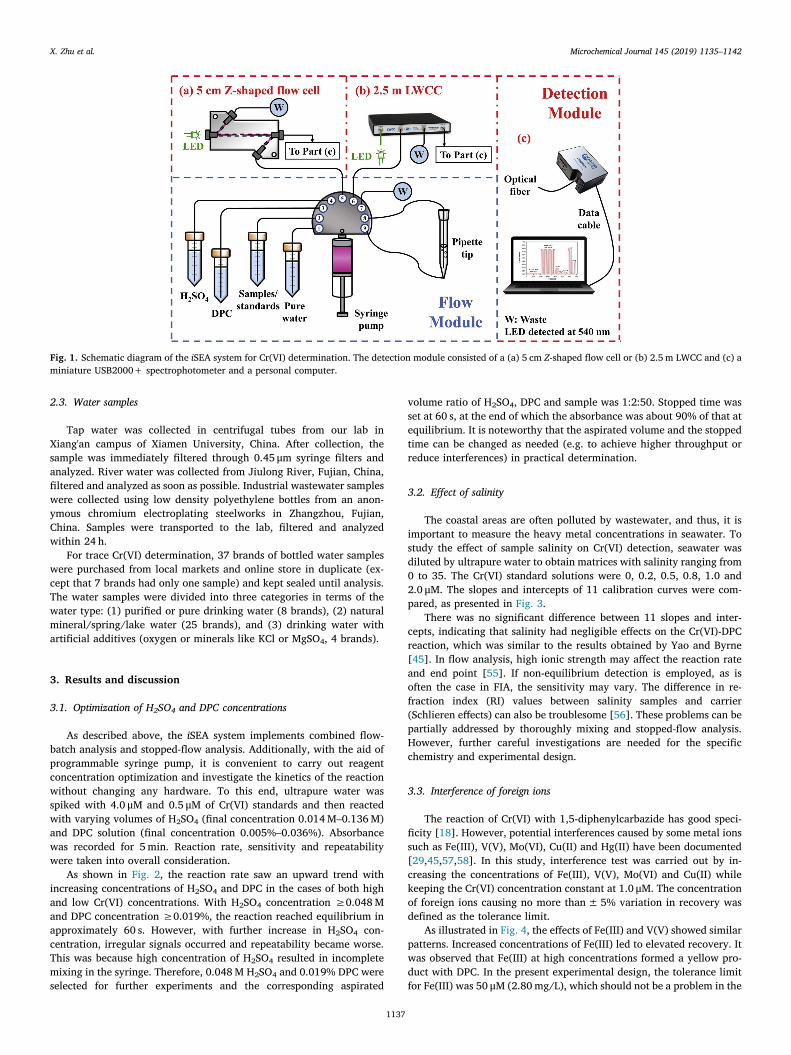
As shown in Fig. 2, the reaction rate saw an upward trend withincreasing concentrations of H2SO4 and DPC in the cases of both highand low Cr(VI) concentrations. With H2SO4 concentration ≥0.048Mand DPC concentration ≥0.019%, the reaction reached equilibrium inapproximately 60 s. However, with further increase in H2SO4 con-centration, irregular signals occurred and repeatability became worse.This was because high concentration of H2SO4 resulted in incompletemixing in the syringe. Therefore, 0.048M H2SO4 and 0.019% DPC wereselected for further experiments and the corresponding aspirated
volume ratio of H2SO4, DPC and sample was 1:2:50. Stopped time wasset at 60 s, at the end of which the absorbance was about 90% of that atequilibrium. It is noteworthy that the aspirated volume and the stoppedtime can be changed as needed (e.g. to achieve higher throughput orreduce interferences) in practical determination.
3.2. Effect of salinity
The coastal areas are often polluted by wastewater, and thus, it isimportant to measure the heavy metal concentrations in seawater. Tostudy the effect of sample salinity on Cr(VI) detection, seawater wasdiluted by ultrapure water to obtain matrices with salinity ranging from0 to 35. The Cr(VI) standard solutions were 0, 0.2, 0.5, 0.8, 1.0 and2.0 μM. The slopes and intercepts of 11 calibration curves were com-pared, as presented in Fig. 3.
There was no significant difference between 11 slopes and inter-cepts, indicating that salinity had negligible effects on the Cr(VI)-DPCreaction, which was similar to the results obtained by Yao and Byrne[45]. In flow analysis, high ionic strength may affect the reaction rateand end point [55]. If non-equilibrium detection is employed, as isoften the case in FIA, the sensitivity may vary. The difference in re-fraction index (RI) values between salinity samples and carrier(Schlieren effects) can also be troublesome [56]. These problems can bepartially addressed by thoroughly mixing and stopped-flow analysis.However, further careful investigations are needed for the specificchemistry and experimental design.
3.3. Interference of foreign ions
The reaction of Cr(VI) with 1,5‑diphenylcarbazide has good speci-ficity [18]. However, potential interferences caused by some metal ionssuch as Fe(III), V(V), Mo(VI), Cu(II) and Hg(II) have been documented[29,45,57,58]. In this study, interference test was carried out by in-creasing the concentrations of Fe(III), V(V), Mo(VI) and Cu(II) whilekeeping the Cr(VI) concentration constant at 1.0 μM. The concentrationof foreign ions causing no more than±5% variation in recovery wasdefined as the tolerance limit.
As illustrated in Fig. 4, the effects of Fe(III) and V(V) showed similarpatterns. Increased concentrations of Fe(III) led to elevated recovery. Itwas observed that Fe(III) at high concentrations formed a yellow pro-duct with DPC. In the present experimental design, the tolerance limitfor Fe(III) was 50 μM (2.80mg/L), which should not be a problem in the
Fig. 1. Schematic diagram of the iSEA system for Cr(VI) determination. The detection module consisted of a (a) 5 cm Z-shaped flow cell or (b) 2.5m LWCC and (c) aminiature USB2000+ spectrophotometer and a personal computer.
X. Zhu et al. Microchemical Journal 145 (2019) 1135–1142
1137
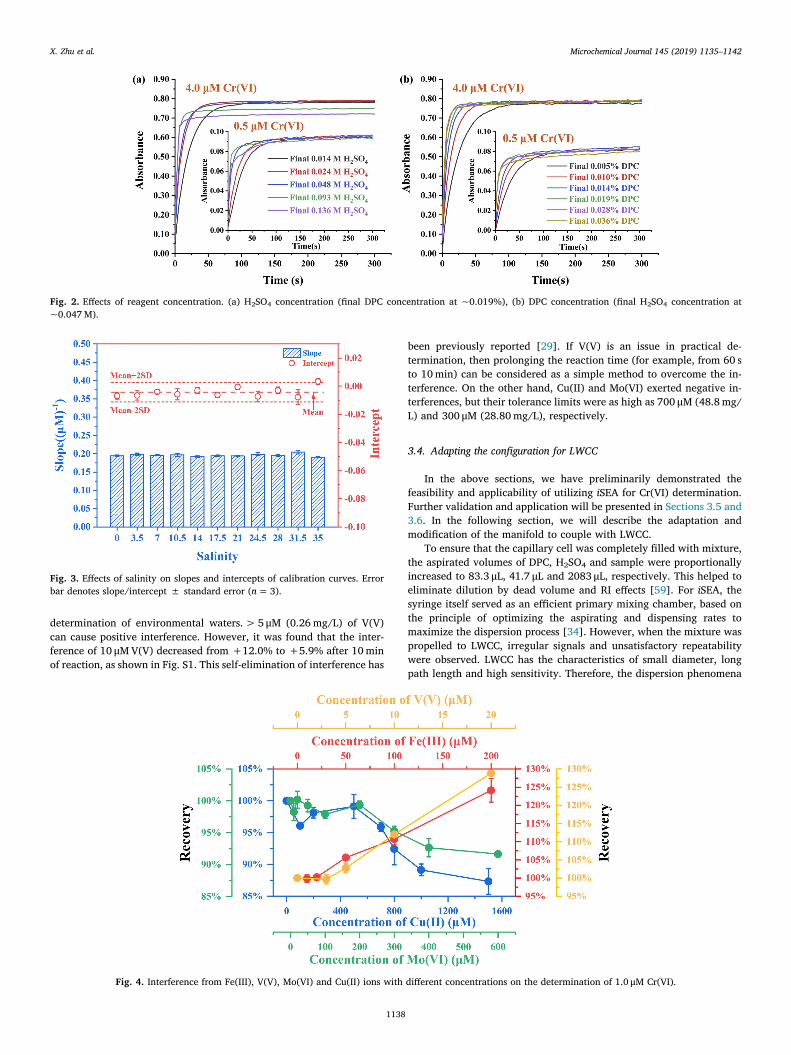
determination of environmental waters.> 5 μM (0.26mg/L) of V(V)can cause positive interference. However, it was found that the inter-ference of 10 μMV(V) decreased from +12.0% to +5.9% after 10minof reaction, as shown in Fig. S1. This self-elimination of interference has
been previously reported [29]. If V(V) is an issue in practical de-termination, then prolonging the reaction time (for example, from 60 sto 10min) can be considered as a simple method to overcome the in-terference. On the other hand, Cu(II) and Mo(VI) exerted negative in-terferences, but their tolerance limits were as high as 700 μM (48.8mg/L) and 300 μM (28.80mg/L), respectively.
3.4. Adapting the configuration for LWCC
In the above sections, we have preliminarily demonstrated thefeasibility and applicability of utilizing iSEA for Cr(VI) determination.Further validation and application will be presented in Sections 3.5 and3.6. In the following section, we will describe the adaptation andmodification of the manifold to couple with LWCC.
To ensure that the capillary cell was completely filled with mixture,the aspirated volumes of DPC, H2SO4 and sample were proportionallyincreased to 83.3 μL, 41.7 μL and 2083 μL, respectively. This helped toeliminate dilution by dead volume and RI effects [59]. For iSEA, thesyringe itself served as an efficient primary mixing chamber, based onthe principle of optimizing the aspirating and dispensing rates tomaximize the dispersion process [34]. However, when the mixture waspropelled to LWCC, irregular signals and unsatisfactory repeatabilitywere observed. LWCC has the characteristics of small diameter, longpath length and high sensitivity. Therefore, the dispersion phenomena
Fig. 2. Effects of reagent concentration. (a) H2SO4 concentration (final DPC concentration at ~0.019%), (b) DPC concentration (final H2SO4 concentration at~0.047M).
Fig. 3. Effects of salinity on slopes and intercepts of calibration curves. Errorbar denotes slope/intercept ± standard error (n=3).
Fig. 4. Interference from Fe(III), V(V), Mo(VI) and Cu(II) ions with different concentrations on the determination of 1.0 μM Cr(VI).
X. Zhu et al. Microchemical Journal 145 (2019) 1135–1142
1138

may differ from U or Z shaped flow cells [60], and might require bettermixing conditions. It was assumed that for trace Cr(VI) determinationwith LWCC, insufficient mixing in the syringe resulted in differences inmixture homogeneity and reaction rate. To test the effect of mixingfurther, a series of mixed reagents (MR) was prepared by mixing 0.5%(m/V) DPC and H2SO4 solutions with concentrations ranging from0.5M to 2.5M at volume ratio of 2:1. It was found that the signal andrepeatability were improved by mixing MR with sample and propellingthe mixture to the LWCC. However, the stability of MR was not sa-tisfactory and all MR solutions developed appreciable color within oneday (Fig. S2). It was found that, the higher the H2SO4 concentration, thefaster was the color development. Deteriorated colorimetric reagentscause increase in absorbance, especially for blank solution, and the rateof deterioration may be related to environmental conditions such astemperature and humidity. The single DPC solution can be kept at roomtemperature for> 30 days, during which no significant loss of sensi-tivity was observed for the determination of 0–4.0 μM Cr(VI) standardswith 5 cm flow cell (Fig. S3). The stability of MR might be improved ifthe concentrations of DPC and H2SO4 were much lowered. However, asshown in Fig. 2, the reaction time would be consequently prolonged.
As recommended by Amornthammarong et al. [54], a 5mL pipettetip was utilized as a secondary mixing chamber. The dispersion andaspiration of the mixture took turns between the tip and the syringe.Complete mixing was achieved as evidenced by the good similarity inthe results of the determination of mineral water samples by iSEA-LWCC and by manually mixing reagents and samples and then injectingfor LWCC detection (see Fig. 6, red circles).
3.5. Analytical performance and validation
Under the optimized conditions, the analytical figures of merit ofthe proposed analyzer are summarized in Table 1. Calibration curveswere constructed using the data obtained during 14 days, indicatinggood reproducibility of the method. Fig. 5(a) shows the calibrationcurve of iSEA-LWCC for Cr(VI) detection and the inset illustrates the
corresponding spectrum and typical signal output. For iSEA-flow cell,the calibration curve and typical signal output are presented in Fig. S4.Method detection limit (MDL) was calculated by three times the stan-dard deviation (SD) of the measurement blanks (n=11) divided by theslope of the calibration curve, and estimated to be 0.024 μM and0.54 nM for 5 cm flow cell and 2.5 m LWCC, respectively. Repeatabilityof the analytical results was characterized by relative standard devia-tions (RSDs) of consecutive determinations, and the RSD values werewithin 5% for all concentrations (see Table 1), indicating high precisionof the results. To further evaluate the reliability of iSEA-LWCC, con-tinuous determination of 10 nM Cr(VI) standards (n=90) and mineralwater samples (~14 nM, n=100) was performed (Fig. 5(b) & (c)). Thecorresponding RSDs were 2.63% and 3.50%, respectively, suggestinggood working conditions for long-time continuous determination.Standard solutions (GBW(E)081584-1) were used to test the accuracy ofthe method. Results in Fig. 6 (blue triangles) indicated that con-centration measured by iSEA agreed well with the certified values,showing good accuracy of the method. High throughput rates of> 30
Table 1Summary of analytical performance of the proposed method.
Characteristics iSEA-flow cell iSEA-LWCC
Slope 0.1909 ± 0.0004 0.0091 ± 3.4E-5Intercept −0.0031 ± 0.0006 0.0063 ± 0.0019Linearity R2= 0.9992, n=144, 14 days R2=0.9985, n=110, 14 daysMDL 0.024 μM 0.54 nMRSD 2.65% for 0.2 μM (n=11) 4.04% for 10 nM (n=10)
0.85% for 1.0 μM (n=11) 0.47% for 20 nM (n=10)0.40% for 4.0 μM (n=11) 0.47% for 40 nM (n=10)
Throughput > 30 h−1 20 h−1
Fig. 5. (a) Calibration curve for iSEA-LWCC Cr(VI) detection with concentration varying from 0 to 100 nM. Inset illustrates corresponding spectrum and typical signaloutput. (b) iSEA-LWCC continuous determination of 10 nM Cr(VI) standards (n=90, RSD=2.63%) and (c) mineral water sample (~14 nM, n=100,RSD=3.50%).
Fig. 6. Comparison of determination results of the proposed method withstandards. Red circles denote results obtained by iSEA-LWCC and by manuallymixing reagents and samples, followed by LWCC detection (n=7). Greensquares denote results obtained by iSEA-flow cell and by benchtop spectro-photometer with manual operation (n=12). Blue triangles denote determi-nation of standard solutions (analyzed after 500–160,000-fold dilution, re-spectively). Note the log scale of axes. (For interpretation of the references tocolor in this figure legend, the reader is referred to the web version of thisarticle.)
X. Zhu et al. Microchemical Journal 145 (2019) 1135–1142
1139
h−1 and 20 h−1 were obtained for iSEA-flow cell and iSEA-LWCC, re-spectively, which were adequate for routine analysis.
3.6. Application to water samples
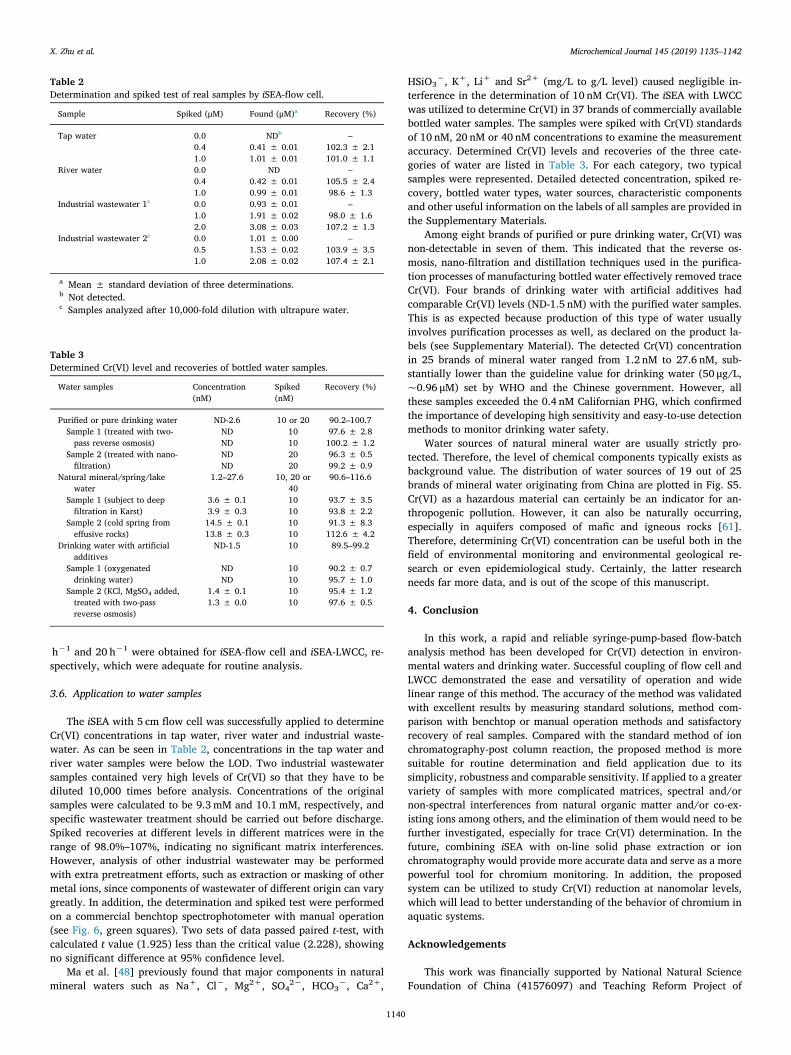
The iSEA with 5 cm flow cell was successfully applied to determineCr(VI) concentrations in tap water, river water and industrial waste-water. As can be seen in Table 2, concentrations in the tap water andriver water samples were below the LOD. Two industrial wastewatersamples contained very high levels of Cr(VI) so that they have to bediluted 10,000 times before analysis. Concentrations of the originalsamples were calculated to be 9.3 mM and 10.1mM, respectively, andspecific wastewater treatment should be carried out before discharge.Spiked recoveries at different levels in different matrices were in therange of 98.0%–107%, indicating no significant matrix interferences.However, analysis of other industrial wastewater may be performedwith extra pretreatment efforts, such as extraction or masking of othermetal ions, since components of wastewater of different origin can varygreatly. In addition, the determination and spiked test were performedon a commercial benchtop spectrophotometer with manual operation(see Fig. 6, green squares). Two sets of data passed paired t-test, withcalculated t value (1.925) less than the critical value (2.228), showingno significant difference at 95% confidence level.
Ma et al. [48] previously found that major components in naturalmineral waters such as Na+, Cl−, Mg2+, SO4
2−, HCO3−, Ca2+,
HSiO3−, K+, Li+ and Sr2+ (mg/L to g/L level) caused negligible in-
terference in the determination of 10 nM Cr(VI). The iSEA with LWCCwas utilized to determine Cr(VI) in 37 brands of commercially availablebottled water samples. The samples were spiked with Cr(VI) standardsof 10 nM, 20 nM or 40 nM concentrations to examine the measurementaccuracy. Determined Cr(VI) levels and recoveries of the three cate-gories of water are listed in Table 3. For each category, two typicalsamples were represented. Detailed detected concentration, spiked re-covery, bottled water types, water sources, characteristic componentsand other useful information on the labels of all samples are provided inthe Supplementary Materials.
Among eight brands of purified or pure drinking water, Cr(VI) wasnon-detectable in seven of them. This indicated that the reverse os-mosis, nano-filtration and distillation techniques used in the purifica-tion processes of manufacturing bottled water effectively removed traceCr(VI). Four brands of drinking water with artificial additives hadcomparable Cr(VI) levels (ND-1.5 nM) with the purified water samples.This is as expected because production of this type of water usuallyinvolves purification processes as well, as declared on the product la-bels (see Supplementary Material). The detected Cr(VI) concentrationin 25 brands of mineral water ranged from 1.2 nM to 27.6 nM, sub-stantially lower than the guideline value for drinking water (50 μg/L,~0.96 μM) set by WHO and the Chinese government. However, allthese samples exceeded the 0.4 nM Californian PHG, which confirmedthe importance of developing high sensitivity and easy-to-use detectionmethods to monitor drinking water safety.
Water sources of natural mineral water are usually strictly pro-tected. Therefore, the level of chemical components typically exists asbackground value. The distribution of water sources of 19 out of 25brands of mineral water originating from China are plotted in Fig. S5.Cr(VI) as a hazardous material can certainly be an indicator for an-thropogenic pollution. However, it can also be naturally occurring,especially in aquifers composed of mafic and igneous rocks [61].Therefore, determining Cr(VI) concentration can be useful both in thefield of environmental monitoring and environmental geological re-search or even epidemiological study. Certainly, the latter researchneeds far more data, and is out of the scope of this manuscript.
4. Conclusion
In this work, a rapid and reliable syringe-pump-based flow-batchanalysis method has been developed for Cr(VI) detection in environ-mental waters and drinking water. Successful coupling of flow cell andLWCC demonstrated the ease and versatility of operation and widelinear range of this method. The accuracy of the method was validatedwith excellent results by measuring standard solutions, method com-parison with benchtop or manual operation methods and satisfactoryrecovery of real samples. Compared with the standard method of ionchromatography-post column reaction, the proposed method is moresuitable for routine determination and field application due to itssimplicity, robustness and comparable sensitivity. If applied to a greatervariety of samples with more complicated matrices, spectral and/ornon-spectral interferences from natural organic matter and/or co-ex-isting ions among others, and the elimination of them would need to befurther investigated, especially for trace Cr(VI) determination. In thefuture, combining iSEA with on-line solid phase extraction or ionchromatography would provide more accurate data and serve as a morepowerful tool for chromium monitoring. In addition, the proposedsystem can be utilized to study Cr(VI) reduction at nanomolar levels,which will lead to better understanding of the behavior of chromium inaquatic systems.
Acknowledgements
This work was financially supported by National Natural ScienceFoundation of China (41576097) and Teaching Reform Project of
Table 2Determination and spiked test of real samples by iSEA-flow cell.
Sample Spiked (μM) Found (μM)a Recovery (%)
Tap water 0.0 NDb –0.4 0.41 ± 0.01 102.3 ± 2.11.0 1.01 ± 0.01 101.0 ± 1.1
River water 0.0 ND –0.4 0.42 ± 0.01 105.5 ± 2.41.0 0.99 ± 0.01 98.6 ± 1.3
Industrial wastewater 1c 0.0 0.93 ± 0.01 –1.0 1.91 ± 0.02 98.0 ± 1.62.0 3.08 ± 0.03 107.2 ± 1.3
Industrial wastewater 2c 0.0 1.01 ± 0.00 –0.5 1.53 ± 0.02 103.9 ± 3.51.0 2.08 ± 0.02 107.4 ± 2.1
a Mean ± standard deviation of three determinations.b Not detected.c Samples analyzed after 10,000-fold dilution with ultrapure water.
Table 3Determined Cr(VI) level and recoveries of bottled water samples.
Water samples Concentration(nM)
Spiked(nM)
Recovery (%)
Purified or pure drinking water ND-2.6 10 or 20 90.2–100.7Sample 1 (treated with two-pass reverse osmosis)
ND 10 97.6 ± 2.8ND 10 100.2 ± 1.2
Sample 2 (treated with nano-filtration)
ND 20 96.3 ± 0.5ND 20 99.2 ± 0.9
Natural mineral/spring/lakewater
1.2–27.6 10, 20 or40
90.6–116.6
Sample 1 (subject to deepfiltration in Karst)
3.6 ± 0.1 10 93.7 ± 3.53.9 ± 0.3 10 93.8 ± 2.2
Sample 2 (cold spring fromeffusive rocks)
14.5 ± 0.1 10 91.3 ± 8.313.8 ± 0.3 10 112.6 ± 4.2
Drinking water with artificialadditives
ND-1.5 10 89.5–99.2
Sample 1 (oxygenateddrinking water)
ND 10 90.2 ± 0.7ND 10 95.7 ± 1.0
Sample 2 (KCl, MgSO4 added,treated with two-passreverse osmosis)
1.4 ± 0.1 10 95.4 ± 1.21.3 ± 0.0 10 97.6 ± 0.5
X. Zhu et al. Microchemical Journal 145 (2019) 1135–1142
1140

Fujian Province: Cultivation of Personalized talents (FBJG20180095).The authors would like to thank Miss Zhe Liu and Mr. Shitong Zhou forkindly purchasing bottled water samples from Singapore, Malaysia andJapan, and Miss Zhaoying Chen for her kind help during the experi-mental period.
Appendix A. Supplementary data
Supplementary data to this article can be found online at https://doi.org/10.1016/j.microc.2018.12.040.
References
[1] X. Zhao, P.A. Sobecky, L. Zhao, P. Crawford, M. Li, Chromium(VI) transport andfate in unsaturated zone and aquifer: 3D Sandbox results, J. Hazard. Mater. 306(2016) 203–209.
[2] J. Kotaś, Z. Stasicka, Chromium occurrence in the environment and methods of itsspeciation, Environ. Pollut. 107 (2000) 263–283.
[3] A. Zhitkovich, Chromium in drinking water: sources, metabolism, and cancer risks,Chem. Res. Toxicol. 24 (2011) 1617–1629.
[4] World Health Organization, Guidelines for Drinking-Water Quality, 4th edition,(2017) (incorporating the 1st addendum).
[5] The Office of Environmental Health Hazard Assessment of California, Californiapublic health goals data for chromium-hexavalent, https://oehha.ca.gov/water/chemicals/chromium-hexavalent, (2011) , Accessed date: 14 December 2018.
[6] The Office of Environmental Health Hazard Assessment of California, Initiation ofrisk assessments for chemicals in drinking water, https://oehha.ca.gov/water/crnr/initiation-risk-assessments-chemicals-drinking-water-2016, (2016) , Accessed date:14 December 2018.
[7] E. Rossi, M.I. Errea, M.M.F. de Cortalezzi, J. Stripeikis, Selective determination ofCr (VI) by on-line solid phase extraction FI-SPE-FAAS using an ion exchanger resinas sorbent: an improvement treatment of the analytical signal, Microchem. J. 130(2017) 88–92.
[8] P. Liang, H. Sang, Speciation of chromium in water samples with cloud point ex-traction separation and preconcentration and determination by graphite furnaceatomic absorption spectrometry, J. Hazard. Mater. 154 (2008) 1115–1119.
[9] Z. Tahmasebi, S.S.H. Davarani, H. Ebrahimzadeh, A.A. Asgharinezhad, Ultra-tracedetermination of Cr (VI) ions in real water samples after electromembrane extrac-tion through novel nanostructured polyaniline reinforced hollow fibers followed byelectrothermal atomic absorption spectrometry, Microchem. J. 143 (2018)212–219.
[10] T.S. Munonde, N.W. Maxakato, P.N. Nomngongo, Preconcentration and speciationof chromium species using ICP-OES after ultrasound-assisted magnetic solid phaseextraction with an amino-modified magnetic nanocomposite prepared from Fe3O4,MnO2 and Al2O3, Microchim. Acta 184 (2017) 1223–1232.
[11] B. Markiewicz, I. Komorowicz, A. Sajnóg, M. Belter, D. Barałkiewicz, Chromium andits speciation in water samples by HPLC/ICP-MS – technique establishing me-trological traceability: a review since 2000, Talanta 132 (2015) 814–828.
[12] X. Zhao, N. Song, W. Zhou, Q. Jia, Preconcentration procedures for the determi-nation of chromium using atomic spectrometric techniques: a review, Cent. Eur. J.Chem. 10 (2012) 927–937.
[13] A.A.C. Carvalho, D.M. Silvestre, F.O. Leme, J. Naozuka, D.P. Intima, C.S. Nomura,Feasibility of measuring Cr(III) and Cr(VI) in water by laser-induced breakdownspectroscopy using ceramics as the solid support, Microchem. J. 144 (2019) 33–38.
[14] E. Cedeño, H. Cabrera, A.E. Delgadillo-López, O. Delgado-Vasallo,A.M. Mansanares, A. Calderón, E. Marín, High sensitivity thermal lens microscopy:Cr-VI trace detection in water, Talanta 170 (2017) 260–265.
[15] T. Fang, X. Yang, L. Zhang, J. Gong, Ultrasensitive photoelectrochemical determi-nation of chromium(VI) in water samples by ion-imprinted/formate anion-in-corporated graphitic carbon nitride nanostructured hybrid, J. Hazard. Mater. 312(2016) 106–113.
[16] J.R. Zhang, A.L. Zeng, H.Q. Luo, N.B. Li, Fluorescent silver nanoclusters for ultra-sensitive determination of chromium(VI) in aqueous solution, J. Hazard. Mater. 304(2016) 66–72.
[17] H. Li, D. Li, Y. Guo, Y. Yang, W. Wei, B. Xie, On-site chemosensing and quantifi-cation of Cr(VI) in industrial wastewater using one-step synthesized fluorescentcarbon quantum dots, Sensors Actuators B Chem. 277 (2018) 30–38.
[18] E.W. Rice, R.B. Baird, A.D. Eaton, L.S. Clesceri, Standard Methods for theExamination of Water and Wastewater, 22nd edition, 3500-Cr, American PublicHealth Association, American Water Works Association, Water EnvironmentFederation, 2012.
[19] A. Moulin, Colorimetric determination of chromium, Bull. Soc. Chim. Fr. 31 (1904)295–296.
[20] J. Ma, B. Yang, R.H. Byrne, Determination of nanomolar chromate in drinking waterwith solid phase extraction and a portable spectrophotometer, J. Hazard. Mater.219–220 (2012) 247–252.
[21] H. Sereshti, F. Amini, H. Najarzadekan, Electrospun polyethylene terephthalate(PET) nanofibers as a new adsorbent for micro-solid phase extraction of chromium(VI) in environmental water samples, RSC Adv. 5 (2015) 89195–89203.
[22] W. Alahmad, N. Tungkijanansin, T. Kaneta, P. Varanusupakul, A colorimetric paper-based analytical device coupled with hollow fiber membrane liquid phase micro-extraction (HF-LPME) for highly sensitive detection of hexavalent chromium in
water samples, Talanta 190 (2018) 78–84.[23] H.R. Sobhi, E. Azadikhah, M. Behbahani, A. Esrafili, M. Ghambarian, Application of
a surfactant-assisted dispersive liquid-liquid microextraction method along withcentral composite design for micro-volume based spectrophotometric determina-tion of low level of Cr(VI) ions in aquatic samples, Spectrochim. Acta A 202 (2018)36–40.
[24] C. Calderilla, F. Maya, V. Cerdà, L.O. Leal, 3D printed device for the automatedpreconcentration and determination of chromium (VI), Talanta 184 (2018) 15–22.
[25] Y. Luo, S. Nakano, D.A. Holman, J. Ruzicka, G.D. Christian, Sequential injectionwetting film extraction applied to the spectrophotometric determination of chro-mium(VI) and chromium(III) in water, Talanta 44 (1997) 1563–1571.
[26] M. Yang, J. Li, J. Wang, Field speciation of chromium with a sequential injectionlab-on-valve incorporating a bismuthate immobilized micro-column, Talanta 72(2007) 1710–1716.
[27] S. Motomizu, Computer-controlled fluid-flow chemical analysis (CC-FCA) and itsapplication to environmental analytical chemistry, Pure Appl. Chem. 84 (2012)1999–2013.
[28] J. Paluch, J. Kozak, M. Wieczorek, M. Kozak, J. Kochana, K. Widurek,M. Konieczna, P. Koscielniak, Novel approach to two-component speciation ana-lysis. Spectrophotometric flow-based determinations of Fe(II)/Fe(III) and Cr(III)/Cr(VI), Talanta 171 (2017) 275–282.
[29] S.I. Ohira, K. Nakamura, M. Chiba, P.K. Dasgupta, K. Toda, Matrix isolation with anion transfer device for interference-free simultaneous spectrophotometric determi-nations of hexavalent and trivalent chromium in a flow-based system, Talanta 164(2017) 445–450.
[30] S.I. Ohira, K. Nakamura, C.P. Shelor, P.K. Dasgupta, K. Toda, Simultaneous elec-trodialytic preconcentration and speciation of chromium(III) and chromium(VI),Anal. Chem. 87 (2015) 11575–11580.
[31] P.H.G.D. Diniz, L.F. de Almeida, D.P. Harding, M.C.U. de Araújo, Flow-batch ana-lysis, TrAC Trends Anal. Chem. 35 (2012) 39–49.
[32] N. Amornthammarong, J.-Z. Zhang, P.B. Ortner, An autonomous batch analyzer forthe determination of trace ammonium in natural waters using fluorometric detec-tion, Anal. Methods 3 (2011) 1501–1506.
[33] N. Amornthammarong, J.-Z. Zhang, P.B. Ortner, J. Stamates, M. Shoemaker,M.W. Kindel, A portable analyser for the measurement of ammonium in marinewaters, Environ. Sci.: Processes Impacts 15 (2013) 579–584.
[34] J. Ma, P. Li, Z. Chen, K. Lin, N. Chen, Y. Jiang, J. Chen, B. Huang, D. Yuan,Development of an integrated syringe-pump-based environmental-water analyzer(iSEA) and application of it for fully automated real-time determination of ammo-nium in fresh water, Anal. Chem. 90 (2018) 6431–6435.
[35] P. Li, Y. Deng, H. Shu, K. Lin, N. Chen, Y. Jiang, J. Chen, D. Yuan, J. Ma, High-frequency underway analysis of ammonium in coastal waters using an integratedsyringe-pump-based environmental-water analyzer (iSEA), Talanta 195 (2019)638–646.
[36] F. Maya, J.M. Estela, V. Cerdà, Completely automated in-syringe dispersive li-quid–liquid microextraction using solvents lighter than water, Anal. Bioanal. Chem.402 (2012) 1383–1388.
[37] F. Maya, B. Horstkotte, J.M. Estela, V. Cerdà, Lab in a syringe: fully automateddispersive liquid–liquid microextraction with integrated spectrophotometric de-tection, Anal. Bioanal. Chem. 404 (2012) 909–917.
[38] F. Maya, B. Horstkotte, J.M. Estela, V. Cerdà, Automated in-syringe dispersive li-quid-liquid microextraction, TrAC Trends Anal. Chem. 59 (2014) 1–8.
[39] V. Cerdà, J. Avivar, A. Cerdà, Laboratory automation based on flow techniques,Pure Appl. Chem. 84 (2012) 1983–1998.
[40] G. Giakisikli, M. Miró, A. Anthemidis, Integrated lab-in-syringe platform in-corporating a membraneless gas–liquid separator for automatic cold vapor atomicabsorption spectrometry, Anal. Chem. 85 (2013) 8968–8972.
[41] S. Soares, W.R. Melchert, F.R.P. Rocha, A flow-based procedure exploiting the lab-in-syringe approach for the determination of ester content in biodiesel and diesel/biodiesel blends, Talanta 174 (2017) 556–561.
[42] B. Horstkotte, M. Miró, P. Solich, Where are modern flow techniques heading to?Anal. Bioanal. Chem. 410 (2018) 6361–6370.
[43] C. Henríquez, B. Horstkotte, P. Solich, V. Cerdà, In-syringe magnetic-stirring-as-sisted liquid–liquid microextraction for the spectrophotometric determination of Cr(VI) in waters, Anal. Bioanal. Chem. 405 (2013) 6761–6769.
[44] F.R.P. Rocha, L.S.G. Teixeira, J.A. Nóbrega, Green strategies in trace analysis: aglimpse of simple alternatives for sample pretreatment and analyte determination,Spectrosc. Lett. 42 (2009) 418–429.
[45] W.S. Yao, R.H. Byrne, Determination of trace chromium(VI) and molybdenum(VI)in natural and bottled mineral waters using long pathlength absorbance spectro-scopy (LPAS), Talanta 48 (1999) 277–282.
[46] Q. Li, K.J. Morris, P.K. Dasgupta, I.M. Raimundo, H. Temkin, Portable flow-injec-tion analyzer with liquid-core waveguide based fluorescence, luminescence, andlong path length absorbance detector, Anal. Chim. Acta 479 (2003) 151–165.
[47] C.M.C. Infante, F.R.P. Rocha, A critical evaluation of a long pathlength cell for flow-based spectrophotometric measurements, Microchem. J. 90 (2008) 19–25.
[48] J. Ma, D. Yuan, R.H. Byrne, Flow injection analysis of trace chromium (VI) indrinking water with a liquid waveguide capillary cell and spectrophotometric de-tection, Environ. Monit. Assess. 186 (2014) 367–373.
[49] R.N.M.J. Páscoa, I.V. Tóth, A.O.S.S. Rangel, A multi-syringe flow injection systemfor the spectrophotometric determination of trace levels of iron in waters using aliquid waveguide capillary cell and different chelating resins and reaction che-mistries, Microchem. J. 93 (2009) 153–158.
[50] Y. Huang, D. Yuan, Y. Zhu, S. Feng, Real-time redox speciation of iron in estuarineand coastal surface waters, Environ. Sci. Technol. 49 (2015) 3619–3627.
[51] S. Feng, D. Yuan, Y. Huang, K. Lin, Y. Zhu, J. Ma, A catalytic spectrophotometric
X. Zhu et al. Microchemical Journal 145 (2019) 1135–1142
1141

method for determination of nanomolar manganese in seawater using reverse flowinjection analysis and a long path length liquid waveguide capillary cell, Talanta178 (2018) 577–582.
[52] S.G. Silva, J.A. Nóbrega, F.R.P. Rocha, Exploiting Mn(III)/EDTA complex in a flowsystem with solenoid micro-pumps coupled to long pathlength spectrophotometryfor fast manganese determination, Microchem. J. 98 (2011) 109–114.
[53] B. Horstkotte, M. Alexovič, F. Maya, C.M. Duarte, V. Andruch, V. Cerdá, Automaticdetermination of copper by in-syringe dispersive liquid–liquid microextraction of itsbathocuproine-complex using long path-length spectrophotometric detection,Talanta 99 (2012) 349–356.
[54] N. Amornthammarong, P.B. Ortner, J.-Z. Zhang, A simple, effective mixing chamberused in conjunction with a syringe pump for flow analysis, Talanta 81 (2010)1472–1476.
[55] S. Coverly, R. Kérouel, A. Aminot, A re-examination of matrix effects in the seg-mented-flow analysis of nutrients in sea and estuarine water, Anal. Chim. Acta 712(2012) 94–100.
[56] A.C.B. Dias, E.P. Borges, E.A.G. Zagatto, P.J. Worsfold, A critical examination of the
components of the Schlieren effect in flow analysis, Talanta 68 (2006) 1076–1082.[57] C.K. Pires, B.F. Reis, A. Morales-Rubio, M. de la Guardia, Speciation of chromium in
natural waters by micropumping multicommutated light emitting diode photo-metry, Talanta 72 (2007) 1370–1377.
[58] L.V. Mulaudzi, J.F.V. Staden, R.I. Stefan, Determination of chromium(III) andchromium(VI) by use of a spectrophotometric sequential injection system, Anal.Chim. Acta 467 (2002) 51–60.
[59] L.J. Gimbert, P.M. Haygarth, P.J. Worsfold, Determination of nanomolar con-centrations of phosphate in natural waters using flow injection with a long pathlength liquid waveguide capillary cell and solid-state spectrophotometric detection,Talanta 71 (2007) 1624–1628.
[60] R.N.M.J. Páscoa, I.V. Tóth, A.O.S.S. Rangel, Review on recent applications of theliquid waveguide capillary cell in flow based analysis techniques to enhance thesensitivity of spectroscopic detection methods, Anal. Chim. Acta 739 (2012) 1–13.
[61] A. Vengosh, R. Coyte, J. Karr, J.S. Harkness, A.J. Kondash, L.S. Ruhl, R.B. Merola,G.S. Dywer, Origin of hexavalent chromium in drinking water wells from thepiedmont aquifers of North Carolina, Environ. Sci. Technol. Lett. 3 (2016) 409–414.
X. Zhu et al. Microchemical Journal 145 (2019) 1135–1142
1142