microbiology and atmospheric processes: biological, physical and
TRANSCRIPT
Biogeosciences, 6, 721–737, 2009www.biogeosciences.net/6/721/2009/© Author(s) 2009. This work is distributed underthe Creative Commons Attribution 3.0 License.
Biogeosciences
Microbiology and atmospheric processes: biological, physical andchemical characterization of aerosol particles
D. G. Georgakopoulos1, V. Despres2,3, J. Frohlich-Nowoisky2,3, R. Psenner4, P. A. Ariya5, M. Posfai6, H. E. Ahern7,B. F. Moffett7, and T. C. J. Hill7
1Agricultural University of Athens, Athens, Greece2Max Planck Institute for Chemistry, Mainz, Germany3Johannes Gutenberg University, Mainz, Germany4University of Innsbruck, Innsbruck, Austria5McGill University, W. Montreal, Canada6University of Pannonia, Veszprem, Hungary7University of East London, London, UK
Received: 31 January 2008 – Published in Biogeosciences Discuss.: 8 April 2008Revised: 3 April 2009 – Accepted: 24 April 2009 – Published: 30 April 2009
Abstract. The interest in bioaerosols has traditionally beenlinked to health hazards for humans, animals and plants.However, several components of bioaerosols exhibit phys-ical properties of great significance for cloud processes,such as ice nucleation and cloud condensation. To gaina better understanding of their influence on climate, it istherefore important to determine the composition, concen-tration, seasonal fluctuation, regional diversity and evolu-tion of bioaerosols. In this paper, we will review brieflythe existing techniques for detection, quantification, physicaland chemical analysis of biological particles, attempting tobridge physical, chemical and biological methods for anal-ysis of biological particles and integrate them with aerosolsampling techniques. We will also explore some emergingspectroscopy techniques for bulk and single-particle analysisthat have potential for in-situ physical and chemical analy-sis. Lastly, we will outline open questions and further de-sired capabilities (e.g., in-situ, sensitive, both broad and se-lective, on-line, time-resolved, rapid, versatile, cost-effectivetechniques) required prior to comprehensive understandingof chemical and physical characterization of bioaerosols.
Correspondence to:D. G. Georgakopoulos([email protected])
1 Introduction
Aerosols are a suspension of liquid, solid, or multiple-phasesof condensed matter in the atmosphere with size ranges ofca., 0.001 to 100µm. From the size-distribution, aerosolsare divided into three categories: (1) nuclei mode (0.005 to0.1µm), accumulation mode (0.1–2µm) and coarse mode(>2µm) (Walter, 2001). The particle size is determined bythe formation processes and subsequent atmospheric chemi-cal and physical transformations. Bioaerosols are a fractionof organic aerosols and are generally defined as living (e.g.,bacteria, fungi, viruses), dead, debris, or by-products of bi-ological activities such as semi-volatile organic compoundsand micromolecules. As bioaerosol definition demonstrates,this group of aerosols includes a wide range of organic mat-ter with large degree of variability in physical and chemicalcharacteristics such as size, shape, phase, composition, struc-ture, solubility, volatility, hygroscopicity and surface prop-erties. Bioaerosols can be single spore, pollen, bacteria andviruses, to biological aggregates, to products and by-productsas well as attached to non-biological particles.
Bioaerosols may have a significant impact on climate, act-ing as cloud condensation nuclei and ice nuclei which caninitiate precipitation. Aerosol particles of biological origin(cells, cell fractions or organic matter of animal, plant andmicrobial origin) form a significant portion of atmosphericaerosols, sometimes reaching close to 50% numerically of all
Published by Copernicus Publications on behalf of the European Geosciences Union.
722 D. G. Georgakopoulos et al.: Bioaerosol characterization
aerosol particles (Jaenicke, 2005). Research on bioaerosolshas mostly focused on their detection and enumeration re-lated to public health hazards, and several methods for sam-pling, and measurement of aerosol number density, shape,optical, and surface properties, chemical characterization ofcondensed and semi-volatile matter and identification of bi-ological particles have been developed. There is not onetechnique, however, capable to fully capture the physical andchemical complexity of biological matter.
Methods of characterization target either the entire cell orspecific cell components in a sample of air or precipitation.Methods that target the entire cell involve microscopic ex-amination, immunological identification, or, in the case ofmicroorganisms, culture on various nutrient media. Methodsto detect cell components are very diverse: they target bio-chemical markers (proteins, fatty acids, sugars) or nucleicacids (DNA and RNA) and are often a combination of differ-ent strategies.
Biological ice nuclei (bacteria, pollen, plankton, lichens)are active at relatively warm temperatures, between−2 and−9◦C, a range where very few, if any, inorganic ice nucleiare active . Although the ice nucleation property of var-ious organisms has been documented (reviewed by Lund-heim, 2002), detailed studies on the mechanism have beendone only for bacteria. Several bacterial ice nucleation geneshave been cloned from all known species with ice nucleationactivity. The genes have been sequenced and the gene prod-uct, a protein on the outer cell membrane, has been isolatedand its structure described (Warren, 1995). For other ice nu-cleating organisms, the nature of the ice nucleation factor isnot known. Even if the gene responsible for this property ispresent in the genome, bacterial ice nucleation is not alwaysfully expressed. Nutritional and environmental factors influ-ence this expression and the subsequent ice nucleation activ-ity of the bacterium (O’Brien et al., 1988; Nemecek-Marshallet al., 1993). It is not known if such variability exists in otherorganisms with ice nucleation activity. It is possible to char-acterize all species present in an aerosol sample and identifythose with reported ice nucleation activity. It is a lot moredifficult, however, to directly prove that these species are icenucleation active in situ.
Here we present the main methods that are used to char-acterize the biological component of aerosols, starting withmethods to quantify and identify entire cells, followed bymethods to measure total biomass or specific cell compo-nents and those that allow quantification and identificationof cells down to species level. We review the techniques forstudying specific properties of individual biological particles.We also show that it is possible to identify and quantify aclass of biological ice nuclei in bioaerosols, ice nucleationactive bacteria, the best described biological ice nuclei.
This paper originates from the European Science Founda-tion workshop on Microbial Meteorology held in Avignon,France in 2006. It is part of a series of papers from this work-shop in this journal.
2 Methods based on detection of entire cells, spores,pollen and viruses
2.1 Cell culture
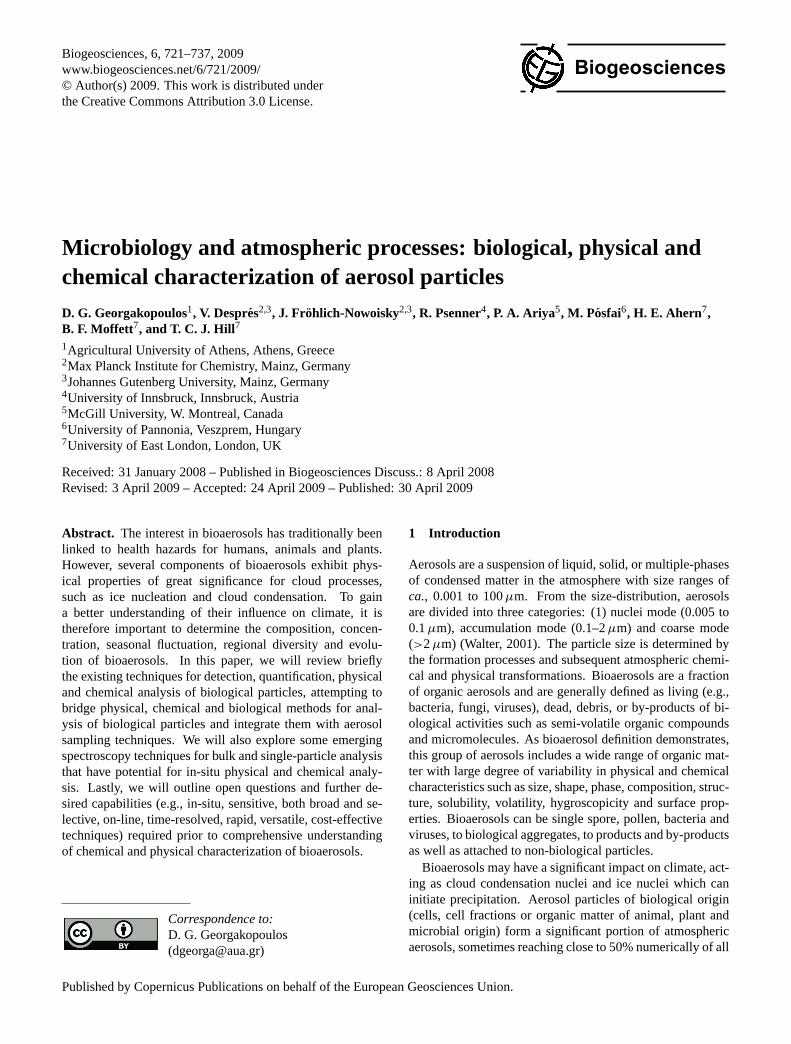
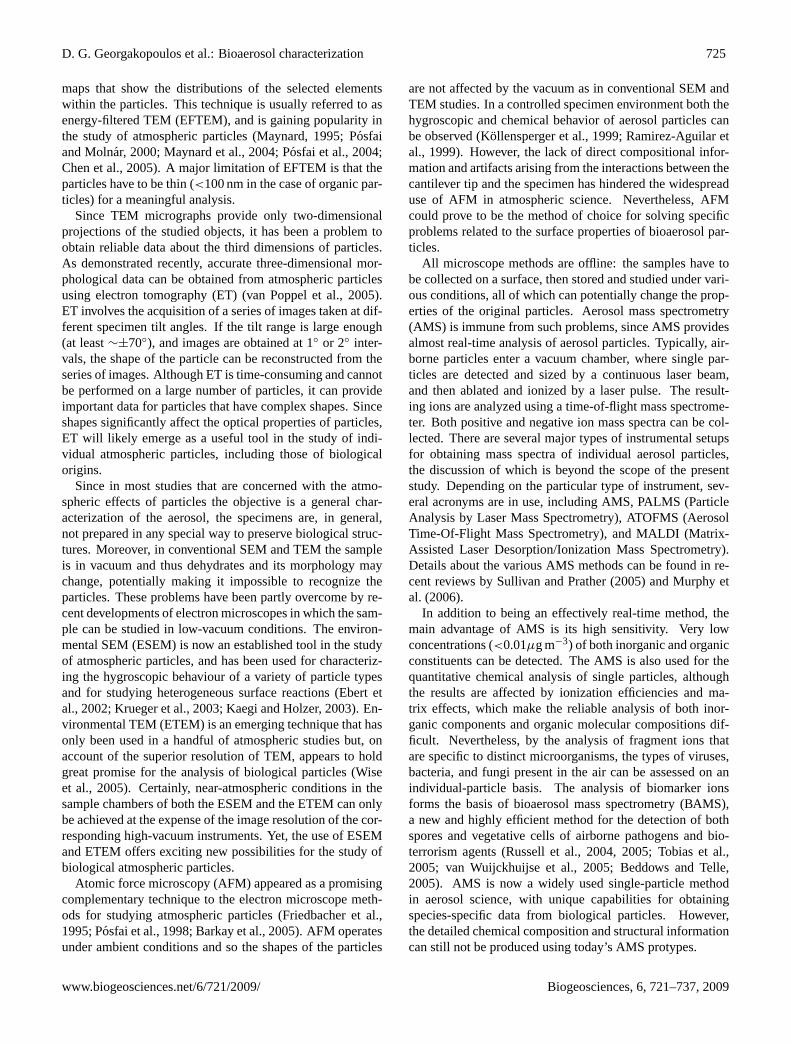
Classic isolation techniques on nutrient media have beenwidely used to enumerate and characterize airborne bacte-ria and fungi (Lighthart, 1997; Andreeva et al., 2001; Baueret al., 2002). These are collected by impaction on a filter oran agar surface and, after incubation, visible colonies that de-velop are enumerated and subsequently identified. Bacteriaare identified biochemically (Gram stain, metabolic profileof carbon sources, enzymes produced, pathogenicity, etc).Fungi are identified mainly by morphological characteristicsof spores and fruiting bodies. An advantage of this method isthe compatibility with several types of air samplers, designedto be fitted with Petri dishes or filter holders. A limitationis that it underestimates the actual number and diversity ofmicroorganisms in a bioaerosol, because only microorgan-isms that are metabolically active and reproduce under theimposed culture conditions will be enumerated, but not thosein the viable but non-culturable state. In filtered air collectedover Salt Lake City, Radosevich et al. (2002) found that only0.08% of all bacteria were cultivable, while in cloud watersamples collected at the Puy de Dome, France, by Amatoet al. (2005) the range was 0.02–0.8%. Interestingly, Tongand Lighthart (2000) recorded a high variability in summerabove pastures of 0–50%, but typically<10%. As, there isno nutrient medium suitable for growth of all microorgan-isms, a variety of media and incubation conditions is nec-essary for a provisional assessment of bioaerosol diversity orenumeration of a selected group of microorganisms. For bac-teria, R2A, designed for stressed, water-borne heterotrophs,was recommended as a standard general medium by Kelloggand Griffin (2006), and when used with Trypticase Soy byAmato et al. (2007) did recover a wide diversity of Gram-positive and -negative species. However, to revive bacteriafrom a 3.6 km deep ice core sample, Christner et al. (2001)used 10 media. Even with groups considered amenable, cul-turing may show bias. For example, when Pseudomonadsisolated from a cloud sample on nutrient agar amended withcycloheximide were compared with Pseudomonads identi-fied in the same sample by direct DNA-based analysis us-ing ARDRA (see below) the two sets tended to cluster intoseparate groups (Fig. 1).
Fungi are selectively isolated in acidified media and me-dia containing antibiotics to prevent bacterial growth. Toeliminate variability in results, especially for microorganismsfound in low numbers in bioaerosols, large sample sizes andreplications are required. A source of variability is also theerror associated with air samplers where air passes throughholes: microorganisms that pass through the same hole andland on the agar surface as aggregates may produce only onecolony, thus underestimating their actual number (manufac-turers do provide statistical corrections for the number of
Biogeosciences, 6, 721–737, 2009 www.biogeosciences.net/6/721/2009/
D. G. Georgakopoulos et al.: Bioaerosol characterization 723
Isolate
Clone
P. putida
Clone
Clone
Isolate
P. brenneri
CloneAntarctic bacterium
P. fluorescens
Isolate
Isolate
Arctic bacterium
Clone
P. trivialis
P. tolaasii
Clone
Clone
Clone
P. syringae
Isolate Isolate
Fig. 1. Comparison of strains obtained by culturing (labelled “Iso-
late”) with those obtained by direct DNA-based analysis (labelled“Clone”) of a Scottish cloud sample. Reference strains are shownunderlined, and the scale bar equates to a 1% difference between se-quences (region used was from 530 to 1390 of the 16S rRNA gene).
microorganisms). In principal, however, we have to acknowl-edge that cultivation means selection, and the number of cul-turable microorganisms in environmental samples is gener-ally low (1% or less). Generally, unless one is interested in aparticular group whose growth requirements are well docu-mented, culturing is not a practical approach for communitycharacterisation.
2.2 Microscopy
Microscopic examination and enumeration of airborne bi-ological particles is done with air samples that are drawnonto appropriate glass slides, glass rods, or filters fitted onthe sampler. Slides are divided into grids and many (typi-cally ≥30) fields of view are necessary to estimate the num-ber of particles of biological origin in a given volume ofair. For most microorganisms, species identification is notpossible without processing the sample with a technique de-signed to identify taxa or species, such as immunospecificstaining with fluorescent dyes. To facilitate enumeration offungal spores, for example, several stains that differentiatefungal spores from debris are available (Burge, 1995). Fun-gal spores and pollen are also identified by morphology, al-though it requires a significant level of expertise. Bacteriaare normally counted after staining with a fluorescent dye,such as DAPI (4′6 diamidino-2-phenylindol) or SYBR GreenI and II, that binds to DNA; however, a large number of bac-teria must be present in the sample (over 104 l−1) to avoiderrors. The number of bacteria in cloud water can be muchlower (103 l−1), thus special care is necessary to preventoverestimation of cell densities (Sattler et al., 2001). Bac-
teria can also be drawn into a liquid which is subsequentlyconcentrated for improved counting. An advantage of mi-croscopy over culture techniques, especially when dyes suchas acridine orange are used to detect viable cells, is the pos-sibility to enumerate the non-culturable fraction of microor-ganisms, which may be significant. However, it is possibleto misidentify microorganisms from debris of non-biologicalorigin. The use of fluorescent in situ hybridisation (FISH)with specific probes targeted at the small subunit of riboso-mal RNA (16S rRNA) (Amann and Ludwig, 2000) is nowa widely used tool to distinguish certain groups of bacteriaor even clones (Pernthaler et al., 1998). For the creation ofprobes, see Sect. 3.3.2. The method also works in dilute sam-ples but seems to be limited by the number of ribosomes percell. To overcome these problems, Pernthaler et al. (2002)developed a method (CARD-FISH) that enhances the fluo-rescent signal by more than an order of magnitude. Thismethod allows, in principle, counting of the number of cellsby using a general probe for Bacteria or Archaea, but detec-tion of specific groups, genera or species is time consumingand limited by their total abundance.
It is more difficult to determine the total number ofviruses in environmental samples. The presence of viruses inbioaerosols is usually monitored for human, animal, or planthealth purposes, but in most cases, only one or few species ofviruses are counted, using methods to specifically detect par-ticles of the viruses under investigation. Studies of total virusparticle numbers in environmental samples are rare and relymostly on counts of virus-like particles in several fields ofmicroscopic observation after staining with fluorescent dyes(Noble and Furhman, 1998).
2.3 Immunological detection
Immunological detection has been widely used to detect mi-croorganisms of medical or phytopathological significance.Antibodies isolated from the serum of inoculated animals candetect a number of different microorganisms. They are pro-duced by the immune system of the animal as a reaction tospecific antigens on the surface of the microorganism, suchas proteins, polysaccharides, etc. It is therefore necessary toproduce antibodies with specificity towards a single species,to avoid false positive detection and errors in counts. Mono-clonal antibodies offer increased specificity and may be use-ful for characterization of bioaerosols.
Antibodies can be used as vectors carrying a label to vi-sualise a cell or virus. Labels include fluorescent dyes (flu-orescence microscopy), enzymes (enzyme immunoassay) ora radioactive compound. In fluorescence microscopy, onlycells to which the antibody/fluorescent dye conjugate bindswill be visible (fluoresce) under the microscope. Theoreti-cally it should be possible to selectively stain and detect icenucleation active bacteria, using an antibody with specificityfor the ice nucleation protein. Although antisera against thisprotein have been produced they have not been used to detect
www.biogeosciences.net/6/721/2009/ Biogeosciences, 6, 721–737, 2009
724 D. G. Georgakopoulos et al.: Bioaerosol characterization
bacterial ice nuclei in environmental samples. These meth-ods have been used to measure allergens in bioaerosols, andare compatible with bioaerosol sampling techniques (Chap-man, 1995).
2.4 Flow cytometry
In flow cytometry, a suspension of cells (from culture or envi-ronmental samples) is passed rapidly in front of a measuringwindow. Light emitted from a source is scattered by particlesin the liquid and several parameters such as size, shape, bio-logical and chemical properties can be measured simultane-ously. Autofluorescence or indirect fluorescence of cells af-ter labelling is also used to detect cells. Cell labelling is donewith DNA or RNA-binding fluorescent dyes (as described insection 2.2), fluorochromes conjugated to taxa-, species- orprotein-specific antibodies, or probes for nucleic acids. It ispossible to differentiate live from dead cells, metabolicallyactive from non-active cells, particles of biological and non-biological origin, and to identify taxa, or even species, andviruses. For bioaerosol samples drawn into a liquid, a mini-mum concentration of 1000 cells ml−1 is necessary for detec-tion. This limitation can be overcome by allowing for longersampling times. Viruses in environmental samples can alsobe identified using SYBR Green I (which binds to their nu-cleic acid) and counting for particles with scatter character-istics of known viruses (Marie et al., 1999). Flow cytometryoffers great speed in sample processing and identification.Automation allows for more accurate enumeration of biolog-ical particles in bioaerosols and flow cytometry has been usedto monitor biocontaminants in indoor aerosols (Birenzvige etal., 2003; Stetzenbach et al., 2004; Chi and Li, 2005).
To identify bacterial ice nuclei in bioaerosols using flowcytometry, a specific antibody recognizing the ice nucleationprotein on cell membranes, or a nucleic acid probe specificfor the IN gene conjugated to a fluorochrome, could be used.
2.5 Physical and chemical characterization of biologicalatmospheric particles: single particle methods
The physical and chemical characterization of atmosphericparticles traditionally involves the study of bulk samples.However, since biological particles form a small fraction ofthe total aerosol, the analysis of bulk samples rarely producesdetailed information on the properties of such particles. Incontrast, studies of individual particles can provide data onthe sizes, shapes, compositions, structures, and surface prop-erties of any types of particles. Various microscope and spec-troscopic methods are now routinely applied in atmosphericscience, but single-particle studies specifically aimed at un-derstanding the atmospheric effects of biological particlesare scarce. Below we review the techniques, both establishedand emerging, that have been used or are potentially usefulfor studying specific properties of individual biological par-ticles.
In general, the distinct types of biological particles havewell-defined size ranges and characteristic shapes that en-able their identification using microscope techniques (Ta-ble 3). The larger particles, including spores and pollen, canbe studied using optical microscopy (OM) and epifluores-cent microscopy (described in Sect. 2.2). Scanning electronmicroscopy (SEM) in combination with energy-dispersiveX-ray spectrometry (EDS) has been used for studying sin-gle atmospheric particles since the 1980s (Anderson et al.,1988; van Borm et al., 1989). In the past two decadesSEMs equipped with field-emission guns became availableand their improved spatial resolution made the observation ofthe morphologies of bacteria and viruses also possible (Ebertet al., 2004). Using secondary electron images, the three-dimensional shapes of the particles can be visualized. Chem-ical information is usually obtained using an EDS detectorattached to the microscope. EDS analyses of the concen-trations of light elements (including C, N, and O) are gener-ally inaccurate or semi-quantitative at best (Osan et al., 2000;Worobiec et al., 2003); thus, elemental compositions arenot generally useful for the identification of specific biolog-ical components. Nevertheless, on the basis of size, shape,and elemental composition, the particles can be confidentlyassigned into relatively broad categories such as “marine”,“crustal”, or “biological” (Ebert et al., 2004; de Hoog et al.,2005; Laskin et al., 2006). A great advantage of SEM is thatparticle analysis can be automated and thousands of singleparticles can be analyzed in each sample.
Transmission electron microscopy (TEM) provides thehighest specificity among the microscope methods for theanalysis of several particle properties. The sizes and the two-dimensional projected shapes of any types of biological par-ticles, including bacteria and viruses, are conveniently stud-ied using TEM (Matthias-Maser and Jaenicke, 1994; Posfaiet al., 2003; Niemi et al., 2006). The high resolution ofthe TEM permits the observation of minute details withinparticles. Particle aggregations and thus the degree of in-ternal mixing of the individual components of the aerosolcan be assessed. A unique capability of TEM is that thestructures of particles can be studied using electron diffrac-tion (ED). Structural information is used for identifying crys-talline substances and for obtaining a better understandingof the structure-dependent properties of amorphous particles(Posfai et al., 1995; Kis et al., 2006).
Elemental compositions can be obtained in the TEM byusing EDS or electron energy-loss spectroscopy (EELS).Compared to EDS analysis in the SEM, the TEM providesmore spatial detail within individual and potentially com-plex particles; however, the TEM is operated manually, andmuch fewer particles can be analyzed than in an automatedSEM. EELS is particularly suited for the study of light el-ements (such as C, N, and O) that are important in bio-logical particles (Katrinak et al., 1992; Chen et al., 2005).By selecting energy windows at specific core-loss regionsof the EEL spectrum, it is possible to obtain compositional
Biogeosciences, 6, 721–737, 2009 www.biogeosciences.net/6/721/2009/
D. G. Georgakopoulos et al.: Bioaerosol characterization 725
maps that show the distributions of the selected elementswithin the particles. This technique is usually referred to asenergy-filtered TEM (EFTEM), and is gaining popularity inthe study of atmospheric particles (Maynard, 1995; Posfaiand Molnar, 2000; Maynard et al., 2004; Posfai et al., 2004;Chen et al., 2005). A major limitation of EFTEM is that theparticles have to be thin (<100 nm in the case of organic par-ticles) for a meaningful analysis.
Since TEM micrographs provide only two-dimensionalprojections of the studied objects, it has been a problem toobtain reliable data about the third dimensions of particles.As demonstrated recently, accurate three-dimensional mor-phological data can be obtained from atmospheric particlesusing electron tomography (ET) (van Poppel et al., 2005).ET involves the acquisition of a series of images taken at dif-ferent specimen tilt angles. If the tilt range is large enough(at least∼±70◦), and images are obtained at 1◦ or 2◦ inter-vals, the shape of the particle can be reconstructed from theseries of images. Although ET is time-consuming and cannotbe performed on a large number of particles, it can provideimportant data for particles that have complex shapes. Sinceshapes significantly affect the optical properties of particles,ET will likely emerge as a useful tool in the study of indi-vidual atmospheric particles, including those of biologicalorigins.
Since in most studies that are concerned with the atmo-spheric effects of particles the objective is a general char-acterization of the aerosol, the specimens are, in general,not prepared in any special way to preserve biological struc-tures. Moreover, in conventional SEM and TEM the sampleis in vacuum and thus dehydrates and its morphology maychange, potentially making it impossible to recognize theparticles. These problems have been partly overcome by re-cent developments of electron microscopes in which the sam-ple can be studied in low-vacuum conditions. The environ-mental SEM (ESEM) is now an established tool in the studyof atmospheric particles, and has been used for characteriz-ing the hygroscopic behaviour of a variety of particle typesand for studying heterogeneous surface reactions (Ebert etal., 2002; Krueger et al., 2003; Kaegi and Holzer, 2003). En-vironmental TEM (ETEM) is an emerging technique that hasonly been used in a handful of atmospheric studies but, onaccount of the superior resolution of TEM, appears to holdgreat promise for the analysis of biological particles (Wiseet al., 2005). Certainly, near-atmospheric conditions in thesample chambers of both the ESEM and the ETEM can onlybe achieved at the expense of the image resolution of the cor-responding high-vacuum instruments. Yet, the use of ESEMand ETEM offers exciting new possibilities for the study ofbiological atmospheric particles.
Atomic force microscopy (AFM) appeared as a promisingcomplementary technique to the electron microscope meth-ods for studying atmospheric particles (Friedbacher et al.,1995; Posfai et al., 1998; Barkay et al., 2005). AFM operatesunder ambient conditions and so the shapes of the particles
are not affected by the vacuum as in conventional SEM andTEM studies. In a controlled specimen environment both thehygroscopic and chemical behavior of aerosol particles canbe observed (Kollensperger et al., 1999; Ramirez-Aguilar etal., 1999). However, the lack of direct compositional infor-mation and artifacts arising from the interactions between thecantilever tip and the specimen has hindered the widespreaduse of AFM in atmospheric science. Nevertheless, AFMcould prove to be the method of choice for solving specificproblems related to the surface properties of bioaerosol par-ticles.
All microscope methods are offline: the samples have tobe collected on a surface, then stored and studied under vari-ous conditions, all of which can potentially change the prop-erties of the original particles. Aerosol mass spectrometry(AMS) is immune from such problems, since AMS providesalmost real-time analysis of aerosol particles. Typically, air-borne particles enter a vacuum chamber, where single par-ticles are detected and sized by a continuous laser beam,and then ablated and ionized by a laser pulse. The result-ing ions are analyzed using a time-of-flight mass spectrome-ter. Both positive and negative ion mass spectra can be col-lected. There are several major types of instrumental setupsfor obtaining mass spectra of individual aerosol particles,the discussion of which is beyond the scope of the presentstudy. Depending on the particular type of instrument, sev-eral acronyms are in use, including AMS, PALMS (ParticleAnalysis by Laser Mass Spectrometry), ATOFMS (AerosolTime-Of-Flight Mass Spectrometry), and MALDI (Matrix-Assisted Laser Desorption/Ionization Mass Spectrometry).Details about the various AMS methods can be found in re-cent reviews by Sullivan and Prather (2005) and Murphy etal. (2006).
In addition to being an effectively real-time method, themain advantage of AMS is its high sensitivity. Very lowconcentrations (<0.01µg m−3) of both inorganic and organicconstituents can be detected. The AMS is also used for thequantitative chemical analysis of single particles, althoughthe results are affected by ionization efficiencies and ma-trix effects, which make the reliable analysis of both inor-ganic components and organic molecular compositions dif-ficult. Nevertheless, by the analysis of fragment ions thatare specific to distinct microorganisms, the types of viruses,bacteria, and fungi present in the air can be assessed on anindividual-particle basis. The analysis of biomarker ionsforms the basis of bioaerosol mass spectrometry (BAMS),a new and highly efficient method for the detection of bothspores and vegetative cells of airborne pathogens and bio-terrorism agents (Russell et al., 2004, 2005; Tobias et al.,2005; van Wuijckhuijse et al., 2005; Beddows and Telle,2005). AMS is now a widely used single-particle methodin aerosol science, with unique capabilities for obtainingspecies-specific data from biological particles. However,the detailed chemical composition and structural informationcan still not be produced using today’s AMS protypes.
www.biogeosciences.net/6/721/2009/ Biogeosciences, 6, 721–737, 2009
726 D. G. Georgakopoulos et al.: Bioaerosol characterization
Fourier Transform Infrared Spectroscopy (FTIR) and Nu-clear Magnetic Resonance (NMR) Spectroscopy (Posfai etal., 1994; Blando et al., 1998; Ariya et al., 2002; Soban-ska et al., 2003; Liu et al., 2005; Cote et al., 2008) for bio-material atmospheric analysis are grouped here together be-cause the information available from both methods, and thustheir strengths and drawbacks, are similar. A larger fractionof the material is amenable to analysis than with chromato-graphic methods (Blando et al., 1998), and the sample neednot necessarily be pre-fractionated or extracted, although itmay in fact be further fractionated before NMR (Decesari etal., 2000, 2001; Sannigrahi et al., 2006), or rinsed with suc-cessive solvents between FTIR spectra (Blando et al., 1998;Maria et al., 2003).
Similarly, FTIR provides functional group informationwhich can be used to compare samples to material of knownorigin or age. An FTIR study of organic aerosols in theSmoky Mountains (Blando et al., 1998) determined the sizedistribution of compound classes, including carbonyls andorganosulfur compounds, finding that much of the materialwas polar, and showed that FTIR could characterize amountsof material too small to be analyzed chromatographically.FTIR with successive solvent rinses showed that a variablefraction (60–90%) of organic material in size-fractionatedaerosols in the Eastern Caribbean free troposphere was hy-drophobic; functional groups in each size fraction were quan-tified. Functional groups may also be summed to estimate to-tal organic carbon (Blando et al., 1998; Zappoli et al., 1999;Maria et al., 2002, 2003; Decesari et al., 2007; Gilardoni etal. 2007; Samburova et al., 2007), avoiding some of the arti-facts which affect TOCA.
2.6 Characterization of biological ice nuclei in environ-mental samples
Biological ice nuclei in environmental samples such asbioaerosols and precipitation can be detected and enumer-ated when particles in samples are isolated and suspended inwater, because they cause immersion freezing of water (Vali,1971) at various subzero temperatures. This test, however,cannot differentiate biological ice nuclei from abiotic ones,although all known biological ice nuclei are active at warmertemperatures than abiotic nuclei. A simple and elegant ap-proach has been described in two recent papers by Christneret al. (2008). They estimated the abundance of biological icenuclei in snow and rain by treating their samples with agentsthat destroy cell integrity and ice nucleation activity. In allknown biological ice nuclei, intact cells are more active thandisrupted cells or isolated cell components (Warren, 1995).Christner et al. treated their samples with heat (95◦C) to de-nature most proteins, and lysozyme, an enzyme that destroysthe cell wall of bacteria. By estimating the number of totalice nuclei and eliminating the activity of biological ice nucleiin a sample, they calculated their percentage in samples ofsnow and rain. This strategy can easily be adapted to detect
biological ice nuclei in samples of bioaerosols, for example,when isolated bioaerosol particles are finally suspended inwater.
3 Methods based on detection of cell components
3.1 General biomass measures
These are useful to determine the organic carbon content ofaerosols, but the small biomass of cloud/rain samples limitsthe available methods. C:N:P ratios typical of organisms areoften compared to marine plankton samples from where theclassical Redfied stoichiometry of 106:16:1 has been derived.However, as the group of Mikal Heldal from the University ofBergen, Norway, has shown for marine and freshwater bac-teria, this ratio fluctuates over a wide range and may thus notbe used as an unambiguous indicator of living cells.
3.2 Measures of ATP levels
Irrespective of the substrate metabolised the ultimate energycarrier for biosynthesis in all cells is ATP (adenosine triphos-phate). Energy cannot be stored in ATP as it is transient andonly produced when cells are active. For many years it hasbeen used by soil scientists and food microbiologists as ameasure of microbial viability. Amato et al. (2007) were thefirst to measure ATP levels in cloud water and, based on theavailable figures for the amount of ATP per viable cell, con-cluded that the vast majority of bacteria in their eight sampleswere in a viable but non-culturable state.
3.3 Methods based on detection and analysis of nucleicacids
3.3.1 DNA/RNA isolation
One major limitation of DNA extraction is that all poten-tial sources (e.g., bacterial cells, fungal spores, or plant tis-sues) all require different extraction conditions. DNA is ex-tracted either from liquid samples or filters. To settle parti-cles in liquid samples a centrifugation force of 3000×g, forat least 20 min, seems to be the minimum recommended, but≥5000×g is preferable. If cloud water, rain or snow is col-lected directly into RNAlater (essentially a saturated solutionof ammonium sulphate made by Ambion), to also preservethe RNA, it should be diluted to a final sample:RNAlatervolume ratio of 1:1 immediately before centrifugation oth-erwise it may be too dense to allow the particles to settle (itsdensity also requires that it be continuously stirred duringcollection). Since the pellet is often invisible and easily dis-turbed, we recommend removal of the supernatant by aspira-tion. Filters can either be cut up and used directly for DNAextraction (so long as the filter used doesn’t bind DNA) orshaken to dislodge the aerosol particles. Peccia and Hernan-dez (2006) recommend shaking filters at 100 rpm for 12 h in
Biogeosciences, 6, 721–737, 2009 www.biogeosciences.net/6/721/2009/

D. G. Georgakopoulos et al.: Bioaerosol characterization 727
conical flasks on a rotary shaker. However, we found thatthis may be too gentle and that additional intermittent vigor-ous shaking by hand was required.
For DNA extraction, various methods and kits are avail-able, and the method used should be chosen depending onthe aims of the analysis (Despres et al., 2007). In comparisonto other commercial kits the FastDNA Spin kit for soil (Bio101 Systems) used with Lysing Matrix E proved to be themost appropriate to extract DNA from different organisms(Bacteria, fungi, plants, animals,Archaea) on different filtermaterials (glass or quartz fibre, cellulose nitrate, polypropy-lene). Lowering the pH of the extractant to≤7.5 with 3Msodium acetate (pH 5) before the silica step will dramaticallyincrease DNA recovery in dilute samples. Kits tend to usechaotropic guanidine salts for lysis and are reliable and veryconvenient. However, we got higher DNA yields from bac-teria and no carry-over of PCR-inhibiting salts using the sur-factants SDS and CTAB (Ahern et al., 2007). Pre-digestionof the sample with both lysozyme (to digest cell walls, es-pecially of Gram positives) and proteinase K (Read, 2001)is important, as is the use of bead beating to mechanicallydisrupt cells.
The subsequent PCR reaction can be inhibited by addi-tional substances present in the samples, which bind to thetemplate DNA or to the polymerase. This inhibition can besevere and prevent DNA amplification completely. The char-acteristics of such inhibitory substances are only partly un-derstood. It is for example known that humic acids act asinhibitory substances, and also that soot or sea salt particlesmight influence the reaction. Preliminary observations revealsome patterns: the more air sampled and the finer the parti-cles filtered (PM2.5 vs. PM>2.5) the more inhibition; aerosolsfrom highly industrialised cities show more inhibition thanfrom smaller cities in rural regions; and we have found thatsamples from the coast can be very inhibited by the salt.
To reduce inhibition it is necessary to remove or minimizethese inhibitors by performing additional purification stepsor by reducing the amount of template DNA (and its co-extracted inhibitors)(see Peccia and Hernandez 2006). How-ever, we have found that reducing the quantity of DNA orincreasing the amount of polymerase enzyme were oftennot successful (but worth testing). We do, however, rec-ommend using kits for extracting DNA from soils becausethey are designed to cope with common inhibitors such ashumic acids. In a careful comparison of methods, Kempet al. (2006) recommended repeated silica extractions, usingPromega Wizard® PCR Preps, to simply remove inhibitors.We have also found that running the genomic DNA thougha 0.5% agarose gel is highly effective at removing inhibitorysalts and tannins; the tannins run ahead of the DNA enablingthe high molecular weight DNA (>10 kb) to be cut out andthe gel used directly for PCR. Choice ofTaqalso matters; us-ing the same extract some gave no product while others am-plified well. In conclusion we found that there is no general
strategy to overcome inhibition. For each reaction one needsto experiment empirically with the conditions, but especiallywith the extraction kit and the choice of polymerase.
The high sensitivity of PCR introduces the risk of am-plifying any trace amounts of contaminant DNA which, ifundetected, may cause serious misinterpretation of the data.For example, Despres et al. (2007) found that while glass fi-bre filters were sterile, up to 1µg DNA was found on newpolypropylene filters. However, contamination with DNA oreven bacterial or fungal spores can be avoided by decontam-ination prior to sampling. For example, filters can be auto-claved (and/or pre-soaked in 3% H2O2 for 2 h) or baked at300◦C for 12 h. Peccia and Hernandez (2006) warn againstrelying upon autoclaving alone for decontamination. Gasplasma H2O2 sterilisation can be used on larger equipment.Additionally, gloves and breamed tweezers should be usedto avoid direct contact. In any case, it is necessary to ex-tract blanks along with the samples to monitor for possiblecontamination, and if detected, such contamination can beanalyzed and compensated for (Despres et al., 2007).
Techniques can be used to discriminate between DNAfrom sources that are alive or active, although the distinc-tion between these is debatable. RNA rather than DNA canbe isolated as this gives an indication of which cells are ac-tive. Alternatively a vital stain can be used and the viablecells obtained by flow cytometry. A simpler approach, EMAPCR, based on the same concept of membrane integrity butusing ethidium monoazide, can be used to prevent DNA fromdead cells being included in the analysis (Knut et al., 2004).However, this technique has proven to be efficient only fora limited number of species. A more robust technique withwider applications is based on propidium monoazide (PMA)for selective removal of DNA from dead cells in a sample(Nocker et al., 2006).
3.3.2 Using the Polymerase Chain Reaction (PCR) withbioaerosols
The PCR has revolutionised microbial ecology by facilitat-ing the direct analysis of nucleic acids in any sample. It isused to copy, many million-fold, specific regions (typically<1000 bases) of the genome, providing enough for analy-ses. Often<100 target molecules are sufficient template fora successful amplification, and a single bacterium or fungalspore can be detected in fully optimised reactions (e.g., Zenget al., 2004).
The most common gene used for community analysisis the gene coding for the 16S rRNA subunit of the ribo-somes (coded by16S rDNA) ofBacteriaandArchaea, andits analogue, the gene for the 18S rRNA subunit of the ri-bosomes (coded by 18S rDNA), in eukaryotic microorgan-isms, animals and plants. It is an essential structural com-ponent of the ribosome, a cell organelle which synthesisesprotein. Parts of its sequence are the same in all bacte-ria while others vary to differing degrees. This allows the
www.biogeosciences.net/6/721/2009/ Biogeosciences, 6, 721–737, 2009

728 D. G. Georgakopoulos et al.: Bioaerosol characterization
conserved sequences to be targeted for attachment of thetwo flanking primers that are required for PCR amplifica-tion, while intervening variable regions are used for analysisof diversity and identification. Universal 16S rDNA and 18SrDNA primers are given in Despres et al. (2007) and Ahernet al. (2007), and probeBase (http://www.microbial-ecology.net/probebase/) and probeCheck (http://131.130.66.200/cgi-bin/probecheck/content.pl?id=home) provide compre-hensive databases of rDNA primers and probes for prokary-otes and eukaryotes.
Often the PCR products are sequenced and then thenext task is to determine the identity of the DNA. This isachieved by comparing the new sequence to those alreadyavailable by interrogating online databases. For 16S rRNAwe recommend the Ribosomal Database Project (http://rdp.cme.msu.edu/), containing over 400,000 sequences. TheARB database (http://www.arb-home.de/) contains many ad-ditional sequences but requires UNIX to run. For bacteria thegenerally accepted levels of discrimination are 99% similar-ity for strains, 97-99% for species and 95–97% for genera.Often a complete or very close match is obtained. Increas-ingly the closest matches are environmental clones whichgive little useful information other than where the sampleoriginated. For broader coverage to include other sources ofDNA, the EMBL Nucleotide Sequence Database or one of itspartners is recommended. This database is produced in col-laboration with GenBank (USA) and the DNA Database ofJapan (DDBJ). Each collects a portion of the total sequencedata reported and all sites are updated daily. The BLASTsearch engine provided by the National Center for Biotech-nology Information (http://www.ncbi.nlm.nih.gov/BLAST/)is the easiest to search for closest matches.
A recent approach to characterize bioaerosols used bacte-rial 16S rRNA genes in microarrays (Brodie et al., 2007).Microarrays are chips carrying sets of DNA from knowngenes in a predetermined order on the surface. The genepool can be designed to represent a small or large group oforganisms. DNA from environmental samples is labelled,heated and allowed to hybridize with the DNA on the mi-croarray. If complementary sequences exist in both the sam-ple and the microarray, then they hybridize and the sequencedetermined from the position of the fluorescence on the chip.Brodie et al. (2007) constructed a microarray carrying 16SrRNA genes (using 16S rDNA) from most known bacterialtaxa and used it to analyse the diversity and changes of thebacterial microflora in urban aerosol samples. Their methodrequired several steps of normalization and appropriate sta-tistical analysis, and was more sensitive in detecting bacterialtaxa than the standard method of cloning and sequencing am-plified 16S rDNA fragments.
To obtain greater resolution, other genes, or the regionsbetween genes, can be used. For speciating fungi the spacerregion between rRNA genes is used while for plants therbcLchloroplast gene provides additional taxonomic information(see Despres et al., 2007). To increase intrageneric discrim-
ination within the Pseudomonads, Yamamoto et al. (2000)recommend the combined use of thegyrB andrpoD genes.
There are no universal primers available to analyse virusparticles in the same way, and considering their numbers anddiversity, this is a serious impediment. Viruses in bioaerosolscan be detected by using specific primers for each species inthe PCR reaction, but quantification of the total content ofviruses in a sample of bioaerosols cannot be done with PCR.Moreover, for RNA viruses, reverse transcription of the viralgenome from RNA to DNA precedes PCR detection.
Most known alleles of the ice nucleation gene have beensuccessfully amplified using PCR on mostly limited sets ofisolates (see Table 1). Primers forinaW (P. fluorescens) havehad only limited success, due to its variability; Ahern (2007)found three times greater sequence difference (in block 4 ofthe core and the C-terminal region) between twoinaW genes(Warren at al. 1986 and isolate 26 in Castrillo et al. 2000)than exists betweeninaZ, K and V.She recommended ob-taining entire gene sequences, using shotgun cloning, from arange of isolates to assess its true diversity. Primers withbroader range are being designed (Guilbaud et al. 2007).These target theinaW, inaY and inaZ, inaK and inaV al-leles and have been tested on many diverse ice nucleationactive strains ofP. syringae, P. viridiflava, P. fluorescens, P.putida, Panteoa agglomeransandXanthomonas campestris.
If RNA (e.g., 16S rRNA or the messenger RNA of an ac-tively transcribed IN gene) is the target, the initial reversetranscriptase step (enzymatic conversion of the RNA to copyDNA) required for subsequent PCR is likely to be problem-atic. Sensitivity of the reverse transcriptase enzyme to salts,alcohols or phenol remaining from the RNA isolation, andinhibition of the polymerase enzymeTaqby residual reversetranscriptase enzyme are just some of the causes of poten-tially gross under-estimation of RNA levels in such low copynumber samples. Ahern (2007) attempted to quantify 16SrRNA from bacteria and Pseudomonads in two cloud watersamples and obtained very low apparent levels. She recom-mended that without extensive initial optimisation, RNA berestricted to use with methods assessing the presence or ab-sence of specific rRNA sequences and not quantification.
3.3.3 Amplified Ribosomal DNA Restriction Analysis(ARDRA)
The mixture of PCR products obtained from an aerosolsample can be separated into individual molecules by genecloning. This involves joining individual PCR products to aself replicating vector which is then transformed into a hostcell, usuallyE. coli. This is plated onto agar and when thehost cell divides copies of the recombinant DNA moleculeare passed onto the progeny. Following many cell divisionscolonies (clones) are produced. Each of these contains a sin-gle 16S rDNA sequence from one bacterial cell present inthe original mixture. A number of these (generally fifty toseveral hundred) can then be sequenced and the identity of
Biogeosciences, 6, 721–737, 2009 www.biogeosciences.net/6/721/2009/

D. G. Georgakopoulos et al.: Bioaerosol characterization 729
Table 1. Primers used successfully to amplify ice nucleation genes from environmental isolates.
Allele Primers developed (forward & reverse positions from the startcodon of the IN gene)
Annealingtemp (◦C)
No. of iso-lates used
Reference
inaA 5-ATGAGTGTATCGCTATTGAAACTCATGG-3 (221-248)5-ACGATATTATTGTCCTCATCCATCTGG-3 (3924–3950)
58 1 Dimos et al. (2006)
inaW 5-GCGGTCTGGTATGGCCTATTT-3 (59-79)5-CCGGCGTATCGCTATTGTCC-3 (3588–3607)
47 2* Castrillo et al. (2000)
5-AACCAGATTGCGAGTCATAAG-3 (3052–3072)5-CATGGCTGAATCTGAGACTGG-3 (3612–3632)
59 1** Ahern (2007)
inaZ 5-GAGAATGGTCTGGTCGGTTTACTGTGG-3 (124–150)5-TCAACACCGTTCTCACCCGTTCTGG-3 (3494–3518)
58 5 Dimos et al. (2006)
5′-CAAGTGTCACGTTACCGGTG-3′ (404–423)5′-ATCCAGTCATCGTCCTCGTC-3′ (3571–3590) 55 3* Castrillo et al. (2000)
inaZ/K/V/W/Y Primers targeting core and C-terminal under development − ∼100 Guilbaud et al. (2007)
∗ Product shown in paper∼1 kb larger than expected. AlsoinaW amplification of isolate 26 (used by Castrillo et al., 2000) unable to berepeated by Ahern (2007).∗∗ Exceptionally strong product using aforementioned isolate 26 but amplification unsuccessful when used on a range of otherP. fluorescensisolates (Caroline Guilbaud, personal communication).
members of the community determined. To enable a largernumber of clones to be analysed and so increase coverageeach can first be re-amplified using vector specific primersand the product cut with a restriction enzyme to generate abanding pattern of between 2 and 8 fragments for each clone(see Sect. 3.3.4). The choice of enzyme is crucial and hasbeen assessed systematically (Moyer et al., 1996).The pat-terns are then sorted on the basis of the number and size offragments into operational taxonomic units (OTUs) and rep-resentatives from each group sequenced (Moffett et al., 2003;Ahern et al., 2007). ARDRA is fairly labour intensive but rel-atively inexpensive and combined with targeted sequencingprovides the identity of the dominant members of a commu-nity
3.3.4 Terminal Restriction Fragment Length Poly-morphisms (T-RFLP) and Ribosomal IntergenicSpacer Analysis (RISA)
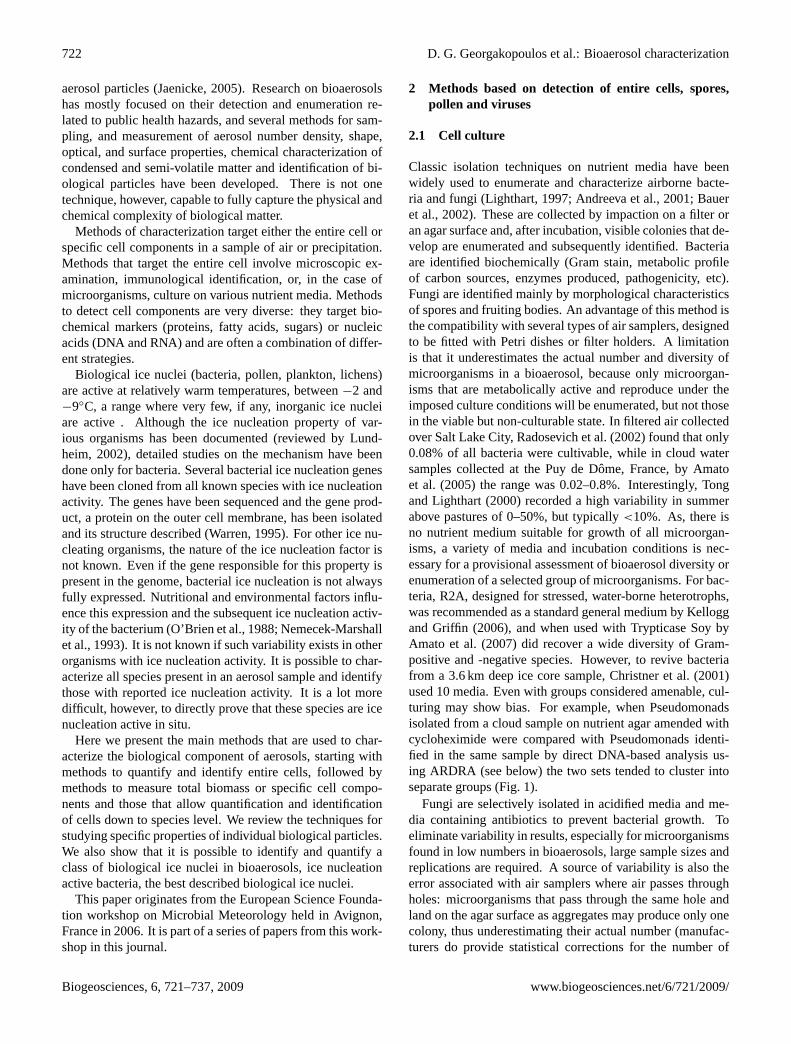
For the broad characterization of microbial community struc-ture and diversity, T-RFLP can be applied. It also gives a veryrough estimate of relative abundances. As T-RFLP was origi-nally designed for bacteria, we outline here the method usingbacteria as the default. T-RFLP can, however, also be appliedto other organisms like fungi, where the ITS regions, themostly non-coding spacer regions between adjacent rRNAgenes, are the most informative.
A PCR is performed in which one primer is fluorescentlylabelled. The amplification products are then digested with arestriction enzyme which cuts the DNA at a defined site. For
example,MspI cuts the sequenceCCGGGGCC
. The position of
the cut site varies among the different bacterial groups andtherefore the length of the labelled terminal fragment varies.
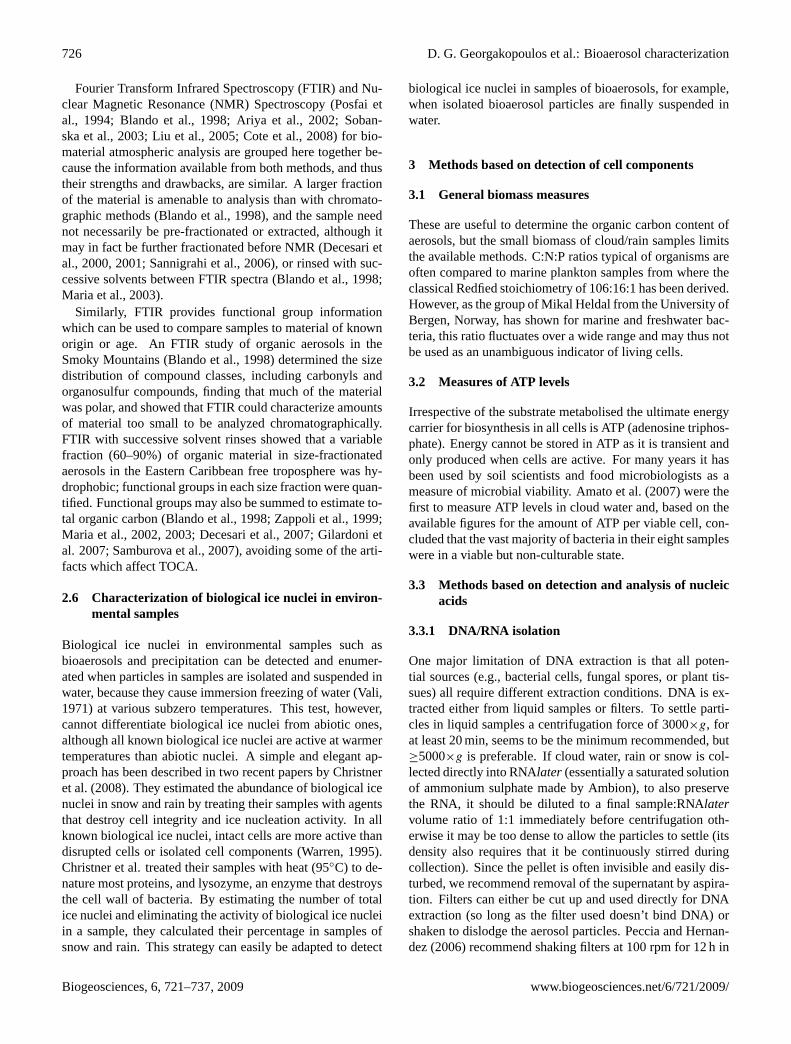
BetaprotecobacteriumunidentifiedActinobacteriumPrimer
Fig. 2. T-RFLP trace of the bacteria (16S rRNA gene digested withMspI) in an aerosol sample (PM2.5) taken in Munich in spring,2005.
After digestion the fluorescently-labelled end fragments areseparated by electrophoresis and their lengths (position ofthe peak along the profile) and intensities (peak area) can becalculated (Fig. 2).
The diversity represented by a T-RFLP profile is highlydependant upon choice of enzyme and the part of the geneused to generate the terminal fragments. For example,MspIis particularly good when used with the front of the 16SrRNA gene, using the primer 27f (confirmed on aerosols byDespres et al. (2007) and rain water by Helen Ahern, un-published data). Primer and enzyme combinations can betested on personal and public 16S rRNA databases usingT-RFLP simulation programs, available at MiCA 3 (http://mica.ibest.uidaho.edu/) and the Ribosomal Database ProjectII (http://rdp.cme.msu.edu, release 8.1). Using MiCA 3 thefollowing enzymes were predicted to produce the most di-verse profile using the front of the 16S gene to generate ter-minal fragments:Hpy188III, HhaI, ScrFI, Hpy188I andBfaI(MspI is in the top 10). One complication can be clustersof peaks. This is caused because the length between the la-belled primer and a site that is cut can naturally vary slightly
www.biogeosciences.net/6/721/2009/ Biogeosciences, 6, 721–737, 2009
730 D. G. Georgakopoulos et al.: Bioaerosol characterization
between species. The result is a mound of peaks which canbe difficult to resolve.
If the PCR products are simultaneously cloned and se-quenced the size of the terminal fragment each will producecan be calculated, and so each can be tentatively assignedto a T-RF peak. Thus the relative abundance of taxonomi-cally identified bacterial groups can be judged. However, oneshould keep in mind that different bacterial groups can havethe same restriction site and thus the relative amount can bemisleading. Also, since different bacteria possess from 1–15copies of the 16S rRNA gene the size of the peak can only beconsidered a semi-quantitative guide to abundance.
Although the 16S region is particularly good for T-RFLPanalysis it also has drawbacks. At least in air samples, bacte-ria, fungi and plant material are all sampled simultaneously.As the DNA is extracted in one step, chloroplast 16S rDNAis often co-amplified with bacterial 16S rDNA since, due totheir common origin, they possess many similarities. Thishas to be considered in the interpretation.
In comparison with the analysis of clone libraries(ARDRA or direct sequencing of clones), T-RFLP is muchfaster and cheaper. If the former approach is used,≥300clones have to be analyzed to obtain reliable estimates ofabundances and diversity levels in diverse samples. Thusfor a fast overview of the diversity and relative abundancesT-RFLP is highly useful. For a detailed analysis, however,subsequent sequence analysis is necessary to, for example,detect species that produce the same T-RF peak.
Another useful approach to obtain a broad profile of com-munity diversity is Ribosomal Intergenic Spacer Analysis(RISA or ARISA when automated). This measures thelength of the gap between the 16S and 23S rRNA genes,which can vary from 150 to 1550 bp (Scheinert et al., 1996;Maron et al., 2005). By amplifying the region in all or aspecific group of bacteria in a sample then separating theproducts by electrophoresis a profile of peaks will be gen-erated. Maron et al. (2005) performed ARISA on two airsamples, revealing both to be highly diverse and distinct. Aswith T-RFLP, but to a lesser degree, one peak may be com-prised of products of several species. But unlike T-RFLP, asingle species may produce two or sometimes three peaks.This is because the gap between the 16 S and 23 S genes candiffer in different ribosomal RNA operons in a bacterium’sgenome. In the five fully sequenced strains ofPseudomonasfluorescensandP. syringae, four have spacer regions all ofone length (but unique for each strain) while oneP. syringaestrain has two (534 and 550 bp). Comparing eight Pseu-domonads, Danovaro et al. (2006) found only one with twopeaks in ARISA, and clearly demonstrated the method’s su-periority over T-RFLP with this genus. Even though ARISAhas inherently greater resolving power (ie, number of peaksproduced per sample; see Danovaro et al., 2006), both greatlyunderestimate total diversity in diverse samples (Bent et al.,2007).
3.3.5 Denaturing/Thermal Gradient Gel Electrophore-sis (D/TGGE)
The mixture of PCR products can also be separated by beingrun on a gel which separates products on the basis of their in-ternal sequence, which affects their melting behaviour. PCRproducts are electrophoresed on a gel with a linearly increas-ing gradient of chemicals (DGGE) or temperature (TGGE).The fragments remain double stranded until the denaturingconditions cause melting of certain regions (domains). Prod-ucts with the lowest melting temperature domains (thosewith runs of A-T base pairs) melt first and the branchingof the molecule causes a sharp decrease in mobility. Asthese molecules continue to move slowly into higher con-centrations of denaturant, additional domains undergo stranddissociation. Single base changes in any of these domainswill alter their melting temperature and so will lead to dif-ferent mobilities. However when the most stable domainsmelt the fragment undergoes complete dissociation and theresolving power of the gel is lost. To overcome this problemone of the PCR primers has a GC-rich “clamp” attached toit which resists the denaturing conditions of the gel (Muyzerand Smalla, 1998; Myers et al., 1985).
The end result is a multiple-banded fingerprint of the com-munity which is very useful for comparisons to determine ifthere is any value in pursuing a more detailed analysis. Thisis especially true for less complex communities such as thosein extreme environments. Diverse samples may produce toomany bands to be resolved. In addition individual bands canalso be cut from the gel and sequenced. One limitation is thatonly PCR products up to 500 bp can be separated efficiently.This limits the precision of subsequent identification basedon sequence comparison. In addition single bacteria can pro-duce more than one band and resolution may be insufficientas products with different sequences may migrate to the sameposition on the gel (Ranjard et al., 2000), although to a lesserextent than T-RFLP.
An analogous technique to T/DGGE, in terms of techniqueand gel product, is Single Strand Conformation Polymor-phism (Schwieger and Tebbe, 1998). Smalla et al. (2007)compared DGGE, T-RFLP and SSCP for their ability tofingerprint DNA extracts from four soils. T-RFLP andSSCP produced tighter clusters of replicate soil samples thanDGGE. Methodologically too, SSCP may be preferable toT/DGGE since the equipment is cheaper, it is easier to findcompatible primers and it does not need a gradient gel (BirgitSattler, personal communication).
3.3.6 Quantitative PCR (qPCR)
A more recent technique, quantitative real-time PCR, can beused to not only detect but also determine the number ofcopies of a chosen gene in a sample. As with standard PCR,depending on the gene and primers used the target for quan-tification can be broad (e.g., all bacteria using the 16 S rDNA)
Biogeosciences, 6, 721–737, 2009 www.biogeosciences.net/6/721/2009/

D. G. Georgakopoulos et al.: Bioaerosol characterization 731
Table 2. Dominant bacterial groups found in studies using direct DNA-based methods.
Sampling site Sampling date/s Dominant bacterial groups Analysis method Reference
Urban aerosol,Salt Lake City, UT
Oct 2000 25% High G+C Gram +ve23% Low G+C Gram +ve23%α, β, γ , δ Proteobacteria
Cloning & sequencing Radosevich et al., 2002
Urban aerosol,San Antonio & Austin, TX
May–Aug 2003 35% Low G+C Gram +ve Bacilli;thereafter high diversity
Cloning & sequencing;Gene chip
Brodie et al., 2007
Urban (but rural nearby) aerosol,Livermore, CA
Aug 2000 Great majority Low G+C Gram +ve ofBacillus-Lactobacillus-Streptococcussubdivision
Cloning & sequencing;Gene chip
Wilson et al., 2002
Rural aerosol,south of Paris, France
Mar & May 2003 60% Proteobacteria13% Low G+C Gram +ve11% High G+C Gram +ve
Cloning & sequencing Maron et al., 2005
Urban, rural &high alpine aerosol,South Germany
Sep 2003,Jun–Sep 2004,Feb–May 2005
62–92%γ thenβ Proteobacteria(87–95% Proteobacteria using T-RFLP peakintensities)19% High G+C Gram +ve
Cloning & sequencing;T-RFLP
Despres et al., 2007
Coastal rural cloud & rain,NW Scotland, UK
Oct 2003 36%γ , β thenα Proteobacteria(the most abundant five OTUs)
Cloning & sequencing Ahern et al., 2007
Surface snow,Tyrolean Alps, Austria
May 1995 40%β Proteobacteria(of total DAPI counts)
In situ hybridisation forβProteobacteria;DAPI staining
Alfreider et al., 1996
or narrow (e.g., an ice nucleating species using a specific INgene). If the number of copies of the gene per cell is knownthen it can be converted to cell counts or microbial biomass.qPCR is the only practicable method available for accuratequantification of multiple samples, especially those with verylow numbers of cells (<100).
The method requires that the accumulation of PCR productbe monitored as the reaction proceeds. The number of PCRcycles needed to first detect the product (the threshold cycle)is then used to determine the number of copies present atthe start. If there very few target molecules then more repli-cation cycles are needed before the product is first detected(and vice versa). The threshold cycle is proportional to thelog of the initial DNA concentration, and the number of genecopies is determined by reference to a calibration curve gen-erated using DNA from known numbers of cells, spores orquantity of mycelium. Calibration curves are typically linearover at least 5 orders of magnitude. Conversion of 16S rRNAgene copy number to cell number can introduce error sincedifferent species of bacteria possess from 1–15 copies of thegene per cell (Cole and Girons, 1994); in Pseudomonads itvaries from 4–7. Fogel (1999) reported an average of 3.8copies per cell of the 16 S gene per bacterial species, and inleachate and nitrifying biofilm we estimated an average of3.5.
One approach to monitor product accumulation uses thedye Sybr Green which only fluoresces when it binds to dou-ble stranded DNA. A great advantage of using Sybr Greenis that it is simple and cheap to convert standard PCR toquantitative. However, reaction optimization is essentialto ensure amplification of only the target, since any non-specific product will also be detected. Primers also com-
bine with each other during PCR to form small double-stranded primer-dimers, and fluorescence from these needsto be minimised by measuring fluorescence at a tempera-ture high enough for them to have dissociated. Alternatively,fluorophore-containing DNA probes, such as TaqMan, Hyb-probes, molecular beacons and scorpion probes can be addedto the reaction mix. These are designed so that they willonly fluoresce if they are annealed to the correct target se-quence. As the product accumulates, the level of fluores-cence increases proportionally. They use different mecha-nisms to report annealing (eg, bound TaqMan probes are di-gested byTaq polymerase, freeing the fluorophore from aquencher embedded in the probe) but share several features:they provide very specific and reliable detection of the am-plified gene, but require careful design and optimisation, andare more costly and emit less light than Sybr Green.
A potentially major problem for qPCR with environmentalsamples is PCR bias which can differentially affect the ratesof amplification of the samples versus the standards, andcause underestimation of the samples’ true gene copy num-ber. The principal problem is from inhibitors co-extractedwith the DNA which can inhibit the PCR of each sample todiffering degrees (e.g., Gruntzig et al., 2001). Jansson andLeser (2004) noted that the extrapolation to an external stan-dard curve used by qPCR is not well suited to environmentalsamples because a small variation in the PCR reaction effi-ciency can produce large differences in product yield in latercycles. An improvement, sigmoidal curve-fitting, has beensuggested by Rutledge (2004). Samples can also be spikedwith a known number of copies of the targeted gene and thelevel of inhibition estimated.
www.biogeosciences.net/6/721/2009/ Biogeosciences, 6, 721–737, 2009

732 D. G. Georgakopoulos et al.: Bioaerosol characterization
Table 3. Characteristics of single-particle methods that are used for the study of the properties of atmospheric aerosol particles.
Particle properties that can be studiedMethods Size and shape Composition Structure Surface and hygroscopic
propertiesAdvantages and drawbacks
OM ∼0.2µm resolution epifluorescent mi-croscopy for identifyingbiological components
No No low resolution
SEM ∼20 nm resolutionwith an FEG-SEM;approximate 3-Dmorphology fromsecondary electronimages
elemental analysis withEDS; semi-quantitativefor light elements
No ESEM for the study of hydra-tion/dehydration cycles
can be automated, good statis-tics; relatively low spatial andcompositional specificity
TEM 1A resolution possible;accurate three-dimensional mor-phology from ET (invacuum)
elemental analysis withEDS; elemental anal-ysis with EELS andenergy-filtered images,suitable for light ele-ments in thin particles(<100 nm)
from electrondiffraction
ETEM for the study of hydra-tion/dehydration cycles
high spatial specificity forshape, composition, andstructure; manually operated,labor-intensive, resulting inpoor statistics
AFM nm resolution, approx-imate 3-D morphology
No No works under ambient condi-tions, hydration/dehydrationcycles can be studied
mechanical properties of sur-faces can be studied; labor-intensive, interpretation of re-sults ambiguous; no composi-tional information
AMS particle sizing and indi-rect shape informationfrom laser scattering
+ and − ion fragmentmass compositions;
No surface composition can beprobed by two-laser AMS;suitable for heterogeneoussurface chemistry
fast response (down to ms);extremely good sensitivity andstatistics; specific biogeniccomponents can be identi-fied (BAMS); interpretation ofcompositions often ambigu-ous; no image and no struc-tural information
AFM: atomic force microscopy; AMS: aerosol mass spectrometry; BAMS: bioaerosol mass spectrometry; ED: electron diffraction; EDS:energy-dispersive X-ray spectrometry; EELS: electron energy-loss spectroscopy; ESEM: environmental scanning electron microscopy; ET:electron tomography; ETEM: environmental transmission electron microscopy; FEG: field-emission gun; OM: optical microscopy; SEM:scanning electron microscopy; TEM: transmission electron microscopy
We have used qPCR on DNA extracted from orographiccloud water (Bowbeat, Scottish borders) to count the totalnumber of 16 S rRNA genes (ie, all bacteria) and the numberof 16S rRNA genes contributed by the Pseudomonads. De-tection used Sybr Green I. The total number was around 8300copies ml−1 cloud water whereas the number contributed bythe Pseudomonads was about 150. Provisional analyses in-dicate that this ratio corresponded reasonably well with theclone frequency of Pseudomonads using ARDRA. qPCR en-ables rapid investigation of multiple samples for the abun-dance of any chosen phylogenetic group and key functionalgenes. Development of primers that will detect and quantifyall IN gene alleles is an urgent priority.
3.3.7 Dominant bacteria in bioaerosols using DNA-based methods
While culture-based studies of atmospheric aerosols indi-cate dominance by Gram-positive bacteria (e.g., Kellogg andGriffin, 2006) direct DNA-based methods reveal a more di-verse assemblage, with an intriguing suggestion of a predom-
inance by the High and Low G+C Gram-positives in the USAbut a higher relative abundance of the Proteobacteria (espe-cially theβ andγ subdivisions) in Europe (Table 2). Usingculturing, Amato et al. (2007) found that Gram-positives aremore abundant than the Proteobacteria in winter, and viceversa, but no such clear trend is apparent from these studies.
4 Conclusions
Detection, quantification and characterization of particlesof biological origin in aerosols, including microorganisms,pollen, plankton, plant and animal debris, etc., is necessaryto understand the role and the effects of bioaerosols ina number of processes, from physical effects, such asice-nucleation, to atmospheric chemistry, ecology, andhealth effects. It is generally believed that the biosphere(for example vegetation) influences and perhaps drivesclimate changes. Bioaerosols have been recently suggestedas a potentially important factor, but their role in climateremains undetermined. What is the contribution of different
Biogeosciences, 6, 721–737, 2009 www.biogeosciences.net/6/721/2009/

D. G. Georgakopoulos et al.: Bioaerosol characterization 733
bioaerosols to significant atmospheric processes such asice nucleation or cloud condensation? To address these,we need a clearer picture of the composition, seasonalfluctuation, regional diversity and evolution of bioaerosols.In this paper we have described and reviewed current andemerging methods for the characterisation of bioaerosols.Most were developed to monitor human, animal and planthealth hazards, and therefore were designed to detect oneor a few groups of organisms. For example, methods tocharacterize microorganisms in bioaerosols have too oftenrelied on isolation and culture. It now seems that reports ofnumbers of microorganisms in bioaerosols where the culturemethod was used may have grossly underestimated the truenumber by one to four orders of magnitude. Meteorologistsoften question the effect of biotic components in aerosolson precipitation, an argument based on published numbersof bacteria and fungi in atmospheric samples which wereconsidered too small to have an impact. However, estima-tions were in most cases produced using culture methods.Even less work has been done to determine the number ofplant, virus or animal fragments in bioaerosols and verylittle is known about their potential effect on atmosphericprocesses. For example, what might be the effect ofsecondary bioaerosol components (e.g. protein crystals)which may no longer be associated with nucleic acids? Orparticles of mixed composition? From a meteorologicalperspective, it is important to know the actual compositionof a bioaerosol in order to evaluate or model the role ofindividual components as ice nuclei or cloud condensationnuclei which potentially trigger precipitation. To this end,only pollen and certain bacteria have been characterized asice nuclei; the ice nucleation property of certain bacteriahas been well studied, but for pollen and other biologicalice nuclei nothing is known about the factors that determinetheir ice nucleation properties. It is therefore important thatfuture research is coordinated, in characterizing the compo-sition, seasonal fluctuation and evolution of ice nucleationand cloud condensation components (starting perhaps withthe most abundant), toward understanding the role of theindividual components. We would like to point out thatsignificant progress in characterizing the role of bioaerosolsin atmospheric processes could be achieved with a reversestrategy: characterize the biological (or non-biological)nature of particles that already have exhibited interestingproperties such as ice nucleation by using sampling methodsfor in situ isolation of ice nuclei from aerosols near theground or in the atmosphere. New methods of bioaerosolcharacterization that can be integrated into methods andequipment used in cloud physics should be developed, toserve the integration of research from the various disciplinesof microbiology, meteorology, molecular biology, cloudphysics and cloud chemistry.
Edited by: M. Dai
References
Ahern, H. E.: Cloud Borne Bacteria: Community Composition andPotential Impact on Atmospheric Nucleation, PhD Thesis, Uni-versity of East London, 2007.
Ahern, H. E., Walsh, K. A., Hill, T. C. J., and Moffett B. F.: Fluores-cent pseudomonads isolated from Hebridean cloud and rain wa-ter produce biosurfactants but do not cause ice nucleation, Bio-geosciences, 4, 115–124, 2007,http://www.biogeosciences.net/4/115/2007/.
Alfreider, A., Pernthaler, J., Amann, R., Sattler, B., Glockner, F. O.,Wille, A., and Psenner, R.: Community analysis of the bacteriaassemblages in winter cover and pelagic layers of a high moun-tain lake using in situ hybridization, Appl. Environ. Microb., 62,2138–2144, 1996.
Amann, R., and Ludwig, W.: Ribosomal RNA-targeted nucleic acidprobes for studies in microbial ecology, FEMS Microbiol. Rev.,24, 555–565, 2000.
Amato, P., Menager, M., Sancelme, M., Laj, P., Mailhot, G. D., andDelort, A.-M.: Microbial population in cloud water at the Puyde Dome: implications for the chemistry of clouds, Atmos. Env.,39, 4143–4153, 2005.
Amato, P., Parazols, M., Sancelme, M., Laj, P., Mailhot, G., andDelort, A.-M.: Microorganisms isolated from the water phaseof tropospheric clouds at the Puy de Dome: major groups andgrowth abilities at low temperatures, FEMS Microbiol. Ecol., 59,242–54, 2007.
Amato, P., Parazols, M., Sancelme, M., Mailhot, G., Laj, P., and De-lort, A.-M.: An important source of micro-organisms for cloudwater at the Puy de Dome (France), Atmos. Environ., 41, 8253–8263, 2007.
Anderson, J. R., Aggett, F. J., Buseck, P. R., Germani, M. S.,and Shattuck, T. W.: Chemistry of individual aerosol particlesfrom Chandler, Arizona, an arid urban environment, Environ.Sci. Technol., 22(7), 811–818, 1988.
Andreeva, I. S., Belan, B. D., Borodulin, A. I., Buryak, G. A.,Zhukov, V. A., Panchenko, M. V., Penenko, V. V., Petrishchenko,V. A., and Safatov, A. S.: Variability of the content of live mi-croorganisms in the atmospheric aerosol in southern regions ofWestern Siberia, Doklady Biol. Sci., 381, 530–534, 2001.
Ariya, P. A., Nepotchatykh, O., Igntova, O., and Amyot, M.: Micro-biological degradation of organic compounds in the atmosphere,Geophys. Res. Lett., 29, 341–344, 2002.
Barkay, Z., Teller, A., Ganor, E., Levin, Z., and Shapira, Y.: Atomicforce and scanning electron microscopy of atmospheric particles,Microsc. Res. Techniq., 68(2), 107–114, 2005.
Bauer, H., Kasper-Giebl, A., Loflund, H., Giebl, H., Hitzenberger,R., Zibuschka, F., and Puxbaum, H.: The contribution of bacteriaand fungal spores to the organic carbon content of cloud water,precipitation and aerosols, Atmos. Res., 64, 100–119, 2002.
Beddows, D. C. S. and Telle, H. H.: Prospects of real-time single-particle biological aerosol analysis: A comparison between laser-induced breakdown spectroscopy and aerosol time-of-flight massspectrometry, Spectrochim. Acta B, 60(7–8), 1040–1059, 2005.
Bent, S. J., Pierson, J. D., and Forney, L. J.: Measuring species rich-ness based on microbial community fingerprints: the emperorhas no clothes, Appl. Environ. Microb., 73, 2399–2401, 2007.
Birenzvige, A., Eversole, J., Seaver, M., Francesconi, S., Valdes,E., and Kulaga, H.: Aerosol characteristics in a subway environ-ment, Aerosol Sci. Tech., 37, 210–220, 2003.
www.biogeosciences.net/6/721/2009/ Biogeosciences, 6, 721–737, 2009

734 D. G. Georgakopoulos et al.: Bioaerosol characterization
Blando, J. D., Porcja, R. J., Li, T. H., Bowman, D., Lioy, P. J., andTurpin, B. J.: Secondary formation and Smokey Mountain or-ganic aerosol: an examination of aerosol polarity and functionalgroup composition during SEAVS, Environ. Sci. Technol., 32,604–613, 1998.
Brodie, E. L., DeSantis, T. Z., Parker, J. P. M., Zubietta, I. X., Pi-ceno, Y. M., and Andersen, G. L.: Urban aerosols harbor diverseand dynamic bacterial populations, Proc. Natl. Acad. Sci. USA,104, 299–304, 2007.
Burge, H. A.: Bioaerosol investigations, in: Bioaerosols, edited by:Burge, H. A., CRC Press, Boca Raton, FL, USA, 1–23, 1995.
Castrillo, L. A., Lee, Jr. R. E., Lee, M. R., and Rutherford, S. T.:Identification of ice-nucleating activePseudomonas fluorescensstrains for biological control of overwintering Colorado potatobeetles (Coleoptera: Chrysomelidae), J. Econ. Entomol., 226–233, 2000.
Chapman, M. D.: Analytical methods: immunoassays, in:Bioaerosols, edited by: Burge, H. A., CRC Press, Boca Raton,FL, USA, 235–248, 1995.
Chen, Y. Z., Shah, N., Huggins, F. E., and Huffman, G. P.: Charac-terization of ambient airborne particles by energy-filtered trans-mission electron microscopy, Aerosol Sci. Tech., 39(6), 509–518, 2005.
Chi, M.-C. and Li, C.-S.: Fluorochrome and Fluorescent In SituHybridization to monitor bioaerosols in swine buildings, AerosolSci. Tech., 39, 1101–1110, 2005.
Christner, B. C., Cai, R., Morris, C. E., Mc Carter, K. S., Foreman,C. M., Skidmore, M. L., Montross, S. N., and Sands, D. C.: Ge-ographic, seasonal, and precipitation chemistry influence on theabundance and activity of biological ice nucleators in rain andsnow, Proc. Natl. Acad. Sci. USA, 105, 18854–18859, 2008.
Christner, B. C., Morris, C. E., Foreman, C. M., Cai, R., and Sands,D. C.: Ubiquity of biological ice nucleators in snowfall, Science,319, 1214, 2008.
Christner, B. C., Mosley-Thompson, E., Thompson, L. G., andReeve, J. N.: Isolation of bacteria and 16S rDNAs from LakeVostok accretion ice, Environ. Microb., 3, 570–577, 2001.
Cole, S. T. and Girons, I. S.: Bacterial genomics, FEMS Microbiol.Rev., 14, 139–160, 1994.
Cote, V., Kos, G., Mortazavi, A., and Ariya, P. A.: Microbial and“de novo” transformation of dicarboxylic acids by three airbornefungi, Sci. Total Environ. 390(2–3), 530–537, 2008.
Danovaro, R., Luna, G. M., Dell’Anno, A., and Pietrangeli, B.:Comparison of two fingerprinting techniques, Terminal Restric-tion Fragment Length Polymorphism and Automated RibosomalIntergenic Spacer Analysis, for determination of bacterial diver-sity in aquatic environments, Appl. Environ. Microb., 72, 5982–5989, 2006.
de Hoog, J., Osan, J., Szaloki, I., Eyckmans, K., Worobiec, A.,Ro, C. U., and Van Grieken, R.: Thin-window electron probe X-ray microanalysis of individual atmospheric particles above theNorth Sea, Atmos. Environ. 39(18), 3231–3242, 2005
Decesari, S., Facchini, M. C., Fuzzi, S., and Tagliavini, E.: Charac-terization of Water-Soluble Organic Compounds in AtmosphericAerosol: A New Approach, J. Geophys. Res.-Atmos., 105(D1),1481–1489, 2000.
Decesari, S., Facchini, M. C., Matta, E., Lettini, F., Mircea, M.,Fuzzi, S., Tagliavini, E., and Putaud, J. P.: Chemical featuresand seasonal trend of water soluble organic compounds in the Po
Valley fine aerosol, Atmos. Environ., 35, 3691–3699, 2001.Decesari, S., Mircea, M., Cavalli, F., Fuzzi, S., Moretti, F., Tagli-avini, E., and Facchini, M. C. : Source Attribution of Water-Soluble Organic Aerosol by Nuclear Magnetic Resonance Spec-troscopy, Environ. Sci. Tech., 41, 2479–2484, 2007.
Despres, V. R., Nowoisky, J. F., Klose, M., Conrad, R., Andreae, M.O., and Poschl, U.: Characterization of primary biogenic aerosolparticles in urban, rural, and high-alpine air by DNA sequenceand restriction fragment analysis of ribosomal RNA genes, Bio-geosciences, 4, 1127–1141, 2007,http://www.biogeosciences.net/4/1127/2007/.
Dimos, D., Kallimanis, A., Perisynakis, A., Chatziloukas, E., andDrainas, C.: A contribution to the analysis of the genetic diver-sity of bacterial ice nucleation genes in Hellenic niches, HSBMBNewsletter, 53, 66–67, 2006.
Ebert, M., Inerle-Hof, M., and Weinbruch, S.: Environmental scan-ning electron microscopy as a new technique to determine the hy-groscopic behaviour of individual aerosol particles, Atmos. Env-iron., 36(39–40), 5909–5916, 2002.
Ebert, M., Weinbruch, S., Hoffmann, P., and Ortner, H. M. Thechemical composition and complex refractive index of rural andurban influenced aerosols determined by individual particle anal-ysis, Atmos. Environ., 38(38), 6531–6545, 2004.
Fogel, G., Collins, C., Li, J., and Brunk, C.: Prokaryotic genomesize and SSU rDNA copy number: estimation of relative abun-dance from a mixed population, Microbial Ecol., 38, 93–113,1999.
Friedbacher, G., Grasserbauer, M., Meslmani, Y., Klaus, N., andHigatsberger, M. J.: Investigation of environmental aerosol byatomic force microscopy, Anal. Chem., 67, 1749–1754, 1995.
Gilardoni, S., Russell, L. M., Sorooshian, A., Flagan, R. C., Se-infeld, J. H., Bates, T. S., Quinn, P. K., Allan, J. D., Williams,B., Goldstein, A. H., Onasch, T. B., and Worsnop, D. R.: Re-gional variation of organic functional groups in aerosol particleson four US east coast platforms during the International Con-sortium for Atmospheric Research on Transport and Transfor-mation 2004 campaign, J. Geophys. Res.-Atmos., 112, D10S27,doi:10.1029/2006JD007737, 2007.
Gruntzig, V. Nold, S. C., Zhou, Z., and Tiedje, J. M.:Pseudomonasstutzerinitrite reductase gene abundance in environmental sam-ples measured by real-time PCR, Appl. Environ. Microb., 67,760–768, 2001.
Guilbaud, C., Ahern, H., Dominguez, H., Glaux C., Moffett, B.,Hill, T., and Morris, C.: Detecting ice nucleating bacteria in en-vironmental samples using PCR of the gene conferring ice nucle-ation activity. Paper presented at the IUGG’s Earth: Our Chang-ing Planet Symposium, Perugia, Italy, July, 2007.
Jaenicke, R.: Abundance of cellular material and proteins in theatmosphere, Science, 308, 73, 2005.
Jansson, J. and Leser, T: Quantitative PCR of environmental sam-ples, in: Molecular Microbiology Manual, 2nd Edition, KluwerAcademic Publishers, The Netherlands, 445–464, 2004.
Kaegi, R. and Holzer, L.: Transfer of a single particle for combinedESEM and TEM analyses, Atmos. Environ., 37(31), 4353–4359,2003.
Katrinak, K. A., Rez, P., and Buseck, P. R.: Structural variations inindividual carbonaceous particles from an urban aerosol, Envi-ron. Sci. Tech., 26, 1967–1976, 1992.
Kellogg, C. A. and Griffin, D. W.: Aerobiology and the global trans-
Biogeosciences, 6, 721–737, 2009 www.biogeosciences.net/6/721/2009/

D. G. Georgakopoulos et al.: Bioaerosol characterization 735
port of desert dust, Trends Ecol. Evol., 21, 638–644, 2006.Kemp, B. M., Monroe, C., and Smith, D. G.: Repeat silica extrac-
tion: a simple technique for the removal of PCR inhibitors fromDNA extracts, J. Archaeol. Sci., 33, 1680–1689, 2006.
Kis, V. K., Posfai, M., and Labar, J. L.: Nanostructure of at-mospheric soot particles, Atmos. Environ., 40(29), 5533–5542,2006.
Knut, R., Moen, B., Drømtorp, S. M., and Holck, A. L.: Use ofethidium monoazide and PCR in combination for quantificationof viable and dead cells in complex samples, Appl. Environ. Mi-crob., 71, 1018–1024, 2004.
Kollensperger, G., Friedbacher, G., Kotzick, R., Niessner, R., andGrasserbauer, M.: In-situ atomic force microscopy investiga-tion of aerosols exposed to different humidities, Fresen. J. Anal.Chem., 364, 296–304, 1999.
Krueger, B. J., Grassian, V. H., Iedema, M. J., Cowin, J. P., andLaskin, A.: Probing heterogeneous chemistry of individual atmo-spheric particles using scanning electron microscopy and energy-dispersive X-ray analysis, Anal. Chem., 75(19), 5170–5179,2003.
Laskin, A., Cowin, J.P., and Iedema, M.J.: Analysis of individualenvironmental particles using modern methods of electron mi-croscopy and X-ray microanalysis. J. Electron Spectrosc., 150(2-3), 260-274, 2006.
Liu, X. D., Zhu, J., Van Espen, P., Adams, F., Xiao, R., Dong, S. P.,Li, Y. W.: Single particle characterization of spring and summeraerosols in Beijing: Formation of composite sulfate of calciumand potassium, Atmos. Environ., 39(36), 6909–6918, 2005.
Lighthart, B.: The ecology of bacteria in the alfresco atmosphere,FEMS Microbiol. Ecol., 23, 263–274, 1997.
Lundheim, R.: Physiological and ecological significance of biolog-ical ice nucleators, Phil. Trans. R. Soc. Lond. B, 357, 937–943,2002.
Margulies, M., Egholm, M., Altman, W. E., Attiya, S., Bader, J. S.,Bemben, L. A., Berka, J., Braverman, M. S., Chen, Y.-J., Chen,Z., Dewell, S. B., Du, L., Fierro, J. M., Gomes, X. V., Godwin,B. C., He, W., Helgesen, S., Ho, C.H., Irzyk, G. P., Jando, S.C., Alenquer, M. L. I., Jarvie, T. P., Jirage, K. B., Kim, J.-B.,Knight, J. R., Lanza, J. R., Leamon, J. H., Lefkowitz, S.M., Lei,M., Li, J., Lohman, K. L., Lu, H., Makhijani, V. B., McDade,K. E., McKenna, M. P., Myers, E. W., Nickerson, E., Nobile,J. R., Plant, R., Puc, B. P., Ronan, M. T., Roth, G. T., Sarkis,G.J., Simons, J. F., Simpson, J. W., Srinivasan, M., Tartaro, K.R., Tomasz, A., Vogt, K. A., Volkmer, G. A., Wang, S. H., Wang,Y., Weiner, M. P., Yu, P., Begley, R. F., and Rothberg, J. M..:Genome sequencing in microfabricated high-density picolitre re-actors, Nature, 437, 376–380, 2005.
Maria, S. F., Russell, L. M., Turpin, B. J., Porcja, R. J., Campos, T.L., Weber, R. J., and Huebert, B. J.: Source Signatures of Car-bon Monoxide and Organic Functional Groups in Asian PacificRegional Aerosol Characterization Experiment (ACE-Asia) Sub-micron Aerosol Types, J. Geophys. Res.-Atmos., 108, 2003.
Maria, S. F., Russell, L. M., Turpin, B. J., and Porcja, R. J.: FTIRmeasurements of functional groups and organic mass in aerosolsamples over the Caribbean, Atmos. Environ., 36, 5185–5196,2002.
Marie, D., Brussaard, C. P. D., Thyrhaug, R., Bratbak, G., andVaulot, D.: Enumeration of marine viruses in culture and naturalsamples by flow cytometry, Appl. Environ. Microb., 65, 45–52,
1999.Maron, P., Lejon, D., Carvalho, E., Bizet, K., Lemanceau, P. Ran-
jard, L., and Mougel, C.: Assessing genetic structure and di-versity of airborne bacterial communities by DNA fingerprintingand 16S rDNA clone library, Atmos. Env., 39, 3687–3695, 2005.
Matthias-Maser, S. and Jaenicke, R.: Examination of atmosphericbioaerosol particles with radii>0.2µm. J. Aerosol Sci., 25,1605–1613, 1994.
Maynard, A. D.: The application of electron-energy-loss spec-troscopy to the analysis of ultrafine aerosol-particles, J. AerosolSci., 26(5), 757–777, 1995.
Maynard, A. D., Ito, Y., Arslan, I., Zimmer, A. T., Browning, N.,and Nicholls, A.: Examining elemental surface enrichment inultrafine aerosol particles using analytical scanning transmissionelectron microscopy, Aerosol Sci. Tech., 38(4), 365–381, 2004.
Moffett, B. F., Nicholson, F. A., Uwakwe, N. C., Chambers, B. J.,Harris, J. A., and Hill, T. C. J.: Zinc contamination decreases thebacterial diversity of agricultural soil, FEMS Microbiol. Ecol.43, 13–19, 2003.
Moyer C. L., Tiedje J. M. Dobbs, F. C., and. Karl D. M.: Acomputer-simulated restriction fragment length polymorphismanalysis of bacterial small-subunit rRNA genes: efficacy of se-lected tetrameric restriction enzymes for studies of microbial di-versity in nature, Appl. Environ. Microb., 62, 2501–2507, 1996.
Murphy, D. M., Cziczo, D. J., Froyd, K. D., Hudson, P. K., Matthew,B. M., Middlebrook, A. M., Peltier, R. E., Sullivan, A., Thomson,D. S., and Weber, R. J.: Single-particle mass spectrometry of tro-pospheric aerosol particles, J. Geophys. Res.-Atmos., 111(D23),D23S32, doi:10.1029/2006JD007340, 2006.
Muyzer G. and Smalla, K.: Application of denaturing gradient gelelectrophoresis and temperature gradient gel electrophoresis inmicrobial molecular ecology, A. Van Leeuw., J. Microb., 73,127–141, 1998.
Myers, M. R., Fischer, S. G., Maniatis, T., and Lerman, L. S.: Mod-ification of the melting properties of duplex DNA by attachmentof a GC-rich DNA sequence as determined by denaturing gradi-ent gel electrophoresis, Nucl. Acid. Res., 13, 3111–3129, 1985.
Nemecek-Marshall, M., Laduca, R., and Fall, R.: High level expres-sion of ice nuclei inPseudomonas syringaestrain is induced bynutrient limitation and low temperature, J. Bacteriol., 175, 4062–4070, 1993.
Niemi, J. V., Saarikoski, S., Tervahattu, H., Makela, T., Hillamo,R., Vehkamaki, H., Sogacheva, L., and Kulmala, M.: Changes inbackground aerosol composition in Finland during polluted andclean periods studied by TEM/EDX individual particle analysis,Atmos. Chem. Phys., 6, 5049–5066, 2006,http://www.atmos-chem-phys.net/6/5049/2006/.
Noble, R. T., and Fuhrman, J. A.: Use of SYBR Green I for rapidepifluorescence counts of marine viruses and bacteria, Aquat.Microb. Ecol., 14, 113–118, 1998.
Nocker, A., Cheung, C.-Y., and Camper A. K.: Comparison of pro-pidium monoazide with ethidium monoazide for differentiationof live vs. dead bacteria by selective removal of DNA from deadcells, J. Microbiol. Methods, 67, 310–320, 2006.
O’Brien, R. D. and Lindow, S. E.: Effect of plant species and envi-ronmental conditions on ice nucleation activity ofPseudomonassyringae on leaves, Appl. Environ. Microb., 54, 2281–2286,1988.
Osan, J., Szaloki, I., Ro, C. U., and Van Grieken, R.: Light element
www.biogeosciences.net/6/721/2009/ Biogeosciences, 6, 721–737, 2009
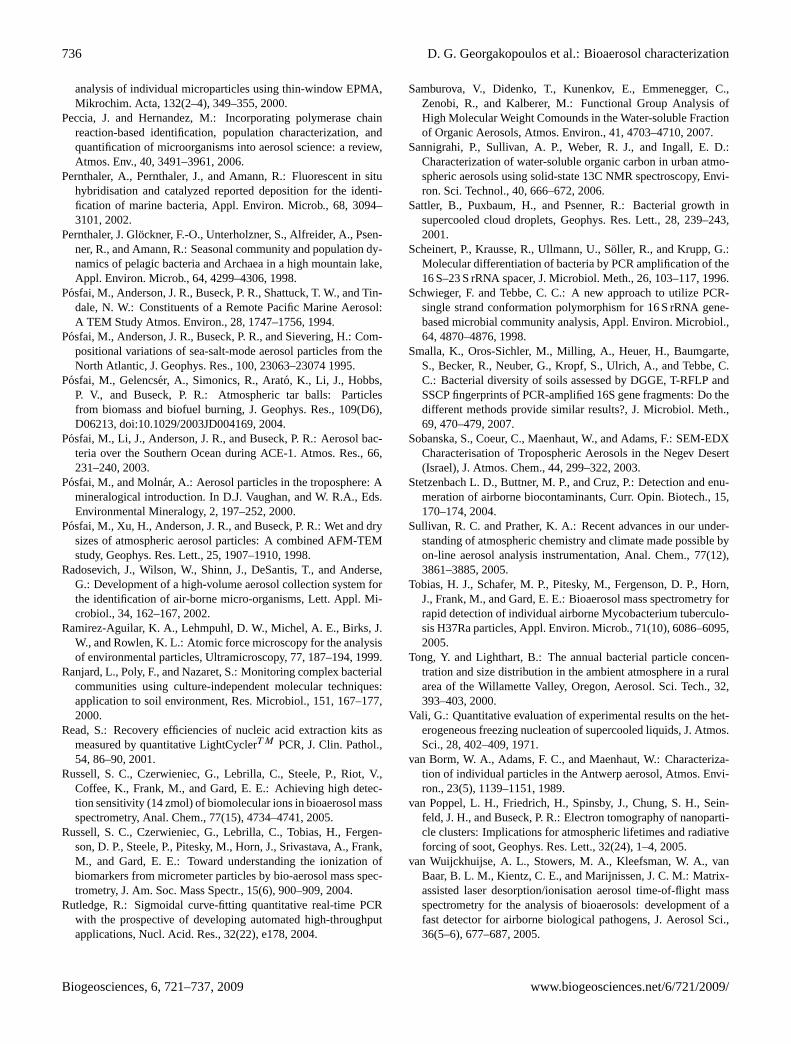
736 D. G. Georgakopoulos et al.: Bioaerosol characterization
analysis of individual microparticles using thin-window EPMA,Mikrochim. Acta, 132(2–4), 349–355, 2000.
Peccia, J. and Hernandez, M.: Incorporating polymerase chainreaction-based identification, population characterization, andquantification of microorganisms into aerosol science: a review,Atmos. Env., 40, 3491–3961, 2006.
Pernthaler, A., Pernthaler, J., and Amann, R.: Fluorescent in situhybridisation and catalyzed reported deposition for the identi-fication of marine bacteria, Appl. Environ. Microb., 68, 3094–3101, 2002.
Pernthaler, J. Glockner, F.-O., Unterholzner, S., Alfreider, A., Psen-ner, R., and Amann, R.: Seasonal community and population dy-namics of pelagic bacteria and Archaea in a high mountain lake,Appl. Environ. Microb., 64, 4299–4306, 1998.
Posfai, M., Anderson, J. R., Buseck, P. R., Shattuck, T. W., and Tin-dale, N. W.: Constituents of a Remote Pacific Marine Aerosol:A TEM Study Atmos. Environ., 28, 1747–1756, 1994.
Posfai, M., Anderson, J. R., Buseck, P. R., and Sievering, H.: Com-positional variations of sea-salt-mode aerosol particles from theNorth Atlantic, J. Geophys. Res., 100, 23063–23074 1995.
Posfai, M., Gelencser, A., Simonics, R., Arato, K., Li, J., Hobbs,P. V., and Buseck, P. R.: Atmospheric tar balls: Particlesfrom biomass and biofuel burning, J. Geophys. Res., 109(D6),D06213, doi:10.1029/2003JD004169, 2004.
Posfai, M., Li, J., Anderson, J. R., and Buseck, P. R.: Aerosol bac-teria over the Southern Ocean during ACE-1. Atmos. Res., 66,231–240, 2003.
Posfai, M., and Molnar, A.: Aerosol particles in the troposphere: Amineralogical introduction. In D.J. Vaughan, and W. R.A., Eds.Environmental Mineralogy, 2, 197–252, 2000.
Posfai, M., Xu, H., Anderson, J. R., and Buseck, P. R.: Wet and drysizes of atmospheric aerosol particles: A combined AFM-TEMstudy, Geophys. Res. Lett., 25, 1907–1910, 1998.
Radosevich, J., Wilson, W., Shinn, J., DeSantis, T., and Anderse,G.: Development of a high-volume aerosol collection system forthe identification of air-borne micro-organisms, Lett. Appl. Mi-crobiol., 34, 162–167, 2002.
Ramirez-Aguilar, K. A., Lehmpuhl, D. W., Michel, A. E., Birks, J.W., and Rowlen, K. L.: Atomic force microscopy for the analysisof environmental particles, Ultramicroscopy, 77, 187–194, 1999.
Ranjard, L., Poly, F., and Nazaret, S.: Monitoring complex bacterialcommunities using culture-independent molecular techniques:application to soil environment, Res. Microbiol., 151, 167–177,2000.
Read, S.: Recovery efficiencies of nucleic acid extraction kits asmeasured by quantitative LightCyclerT M PCR, J. Clin. Pathol.,54, 86–90, 2001.
Russell, S. C., Czerwieniec, G., Lebrilla, C., Steele, P., Riot, V.,Coffee, K., Frank, M., and Gard, E. E.: Achieving high detec-tion sensitivity (14 zmol) of biomolecular ions in bioaerosol massspectrometry, Anal. Chem., 77(15), 4734–4741, 2005.
Russell, S. C., Czerwieniec, G., Lebrilla, C., Tobias, H., Fergen-son, D. P., Steele, P., Pitesky, M., Horn, J., Srivastava, A., Frank,M., and Gard, E. E.: Toward understanding the ionization ofbiomarkers from micrometer particles by bio-aerosol mass spec-trometry, J. Am. Soc. Mass Spectr., 15(6), 900–909, 2004.
Rutledge, R.: Sigmoidal curve-fitting quantitative real-time PCRwith the prospective of developing automated high-throughputapplications, Nucl. Acid. Res., 32(22), e178, 2004.
Samburova, V., Didenko, T., Kunenkov, E., Emmenegger, C.,Zenobi, R., and Kalberer, M.: Functional Group Analysis ofHigh Molecular Weight Comounds in the Water-soluble Fractionof Organic Aerosols, Atmos. Environ., 41, 4703–4710, 2007.
Sannigrahi, P., Sullivan, A. P., Weber, R. J., and Ingall, E. D.:Characterization of water-soluble organic carbon in urban atmo-spheric aerosols using solid-state 13C NMR spectroscopy, Envi-ron. Sci. Technol., 40, 666–672, 2006.
Sattler, B., Puxbaum, H., and Psenner, R.: Bacterial growth insupercooled cloud droplets, Geophys. Res. Lett., 28, 239–243,2001.
Scheinert, P., Krausse, R., Ullmann, U., Soller, R., and Krupp, G.:Molecular differentiation of bacteria by PCR amplification of the16 S–23 S rRNA spacer, J. Microbiol. Meth., 26, 103–117, 1996.
Schwieger, F. and Tebbe, C. C.: A new approach to utilize PCR-single strand conformation polymorphism for 16 S rRNA gene-based microbial community analysis, Appl. Environ. Microbiol.,64, 4870–4876, 1998.
Smalla, K., Oros-Sichler, M., Milling, A., Heuer, H., Baumgarte,S., Becker, R., Neuber, G., Kropf, S., Ulrich, A., and Tebbe, C.C.: Bacterial diversity of soils assessed by DGGE, T-RFLP andSSCP fingerprints of PCR-amplified 16S gene fragments: Do thedifferent methods provide similar results?, J. Microbiol. Meth.,69, 470–479, 2007.
Sobanska, S., Coeur, C., Maenhaut, W., and Adams, F.: SEM-EDXCharacterisation of Tropospheric Aerosols in the Negev Desert(Israel), J. Atmos. Chem., 44, 299–322, 2003.
Stetzenbach L. D., Buttner, M. P., and Cruz, P.: Detection and enu-meration of airborne biocontaminants, Curr. Opin. Biotech., 15,170–174, 2004.
Sullivan, R. C. and Prather, K. A.: Recent advances in our under-standing of atmospheric chemistry and climate made possible byon-line aerosol analysis instrumentation, Anal. Chem., 77(12),3861–3885, 2005.
Tobias, H. J., Schafer, M. P., Pitesky, M., Fergenson, D. P., Horn,J., Frank, M., and Gard, E. E.: Bioaerosol mass spectrometry forrapid detection of individual airborne Mycobacterium tuberculo-sis H37Ra particles, Appl. Environ. Microb., 71(10), 6086–6095,2005.
Tong, Y. and Lighthart, B.: The annual bacterial particle concen-tration and size distribution in the ambient atmosphere in a ruralarea of the Willamette Valley, Oregon, Aerosol. Sci. Tech., 32,393–403, 2000.
Vali, G.: Quantitative evaluation of experimental results on the het-erogeneous freezing nucleation of supercooled liquids, J. Atmos.Sci., 28, 402–409, 1971.
van Borm, W. A., Adams, F. C., and Maenhaut, W.: Characteriza-tion of individual particles in the Antwerp aerosol, Atmos. Envi-ron., 23(5), 1139–1151, 1989.
van Poppel, L. H., Friedrich, H., Spinsby, J., Chung, S. H., Sein-feld, J. H., and Buseck, P. R.: Electron tomography of nanoparti-cle clusters: Implications for atmospheric lifetimes and radiativeforcing of soot, Geophys. Res. Lett., 32(24), 1–4, 2005.
van Wuijckhuijse, A. L., Stowers, M. A., Kleefsman, W. A., vanBaar, B. L. M., Kientz, C. E., and Marijnissen, J. C. M.: Matrix-assisted laser desorption/ionisation aerosol time-of-flight massspectrometry for the analysis of bioaerosols: development of afast detector for airborne biological pathogens, J. Aerosol Sci.,36(5–6), 677–687, 2005.
Biogeosciences, 6, 721–737, 2009 www.biogeosciences.net/6/721/2009/
D. G. Georgakopoulos et al.: Bioaerosol characterization 737
von Wintzingerode, F., Gobel, U. B., and Stackebrandt, E.: Deter-mination of microbial diversity in environmental samples: pit-falls of PCR-based rRNA analysis, FEMS Microbiol. Rev., 21,213–229, 1997.
Walter, J.: Size distribution characteristics of aerosols, in: Aerosolmeasurements: Principles, techniques, and applications, 2ndEdition, edited by: Baron, P. A, and Willeke, K., John Wileyand Sons, Inc., New York, NY, USA, 99–116, 2001.
Warren, G. J.: Identification and analysis of ina genes and proteins,in: Biological Ice Nucleation and its Applications, edited by: LeeJr., R. E., Warren, G. J. and Gusta, L. V., APS Press, St. Paul,MN, USA, 85–100, 1995.
Warren, G., Corotto, L., and Wolber, P.: Conserved repeats in di-verged ice nucleation structural genes from two species ofPseu-domonas, Nucl. Acids Res., 14, 8047–8060, 1986.
Wilson, K. H., Wilson, W. J., Radosevich, J. L., Desantis, T.Z., Viswanathan, V. S., Kuczmarski, T. A., and Andersen, G.L.: High-density micro-array of small subunit ribosomal DNAprobes, Appl. Environ. Microbiol., 68, 2535–2541, 2002.
Wise, M. E., Biskos, G., Martin, S. T., Russell, L. M., and Buseck, P.R.: Phase transitions of single salt particles studied using a trans-mission electron microscope with an environmental cell, AerosolSci. Tech., 39(9), 849–856, 2005.
Worobiec, A., de Hoog, J., Osan, J., Szaloki, I., Ro, C. U., and VanGrieken, R.: Thermal stability of beam sensitive atmosphericaerosol particles in electron probe microanalysis at liquid nitro-gen temperature, Spectrochim. Acta B, 58(3), 479–496, 2003.
Yamamoto, S., Kasai, H., Arnold, D., Jackson, R., Vivian, A.,and Harayama, S.: Phylogeny of the genusPseudomonas: in-trageneric structure reconstructed from the nucleotide sequencesof gyrBandrpoD genes, Microbiology, 146, 2385–2394, 2000.
Zappoli, S., Andracchio, A., Fuzzi, S., Facchini, M. C., Gelencser,A., Kiss, G., Krivacsy, Z., Molnar, A., Meszaros, E., Hansson, H.C., Rosman, K., and Zebuhr, Y.: Inorganic, organic and macro-molecular components of fine aerosol in different areas of Europein relation to their water solubility, Atmos. Environ., 33, 2733–2743, 1999.
Zeng, Q.-Y., Westermark, S.-O., Rasmuson-Lestander,A., andWang, X.-R.: Detection and quantification ofWallemia sebiinaerosols by real-time PCR, conventional PCR and cultivation,Appl. Environ. Microbiol., 70, 7295–7302, 2004.
www.biogeosciences.net/6/721/2009/ Biogeosciences, 6, 721–737, 2009