microarrays and their uses brad windle, ph.d. 628-1956 [email protected]
TRANSCRIPT

Profile
A set of data or characteristics pertaining to an item
Profiles are sometimes referred to as Signatures or Fingerprints
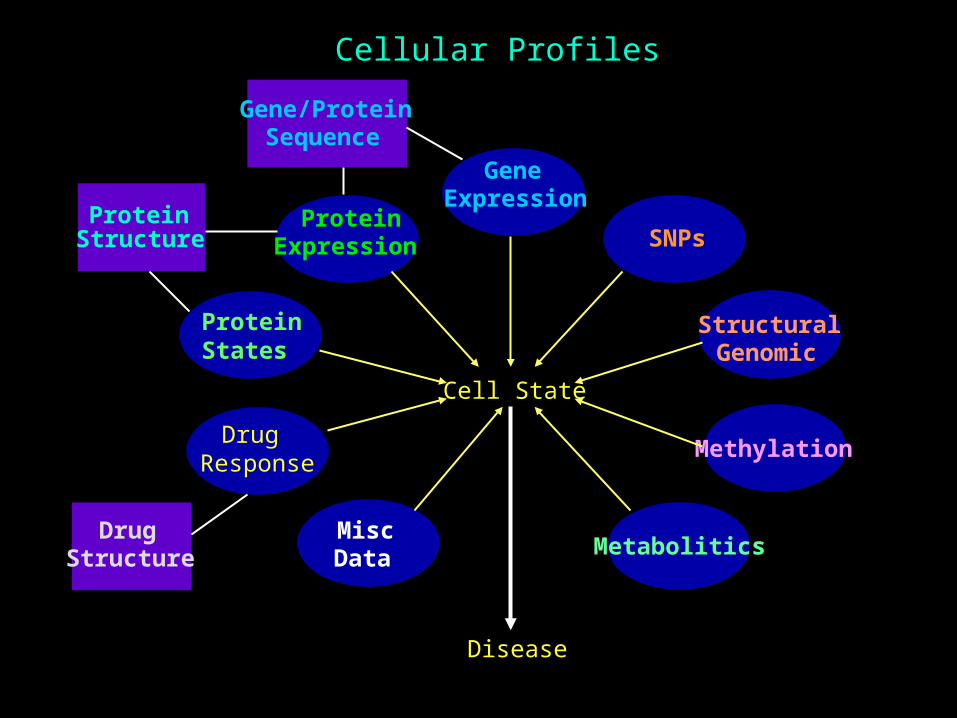
Cellular Profiles
GeneExpression
ProteinExpression
MiscData
SNPs
Methylation
Cell State
Drug Response
Metabolitics
StructuralGenomic
ProteinStates
Disease
Gene/ProteinSequence
ProteinStructure
DrugStructure
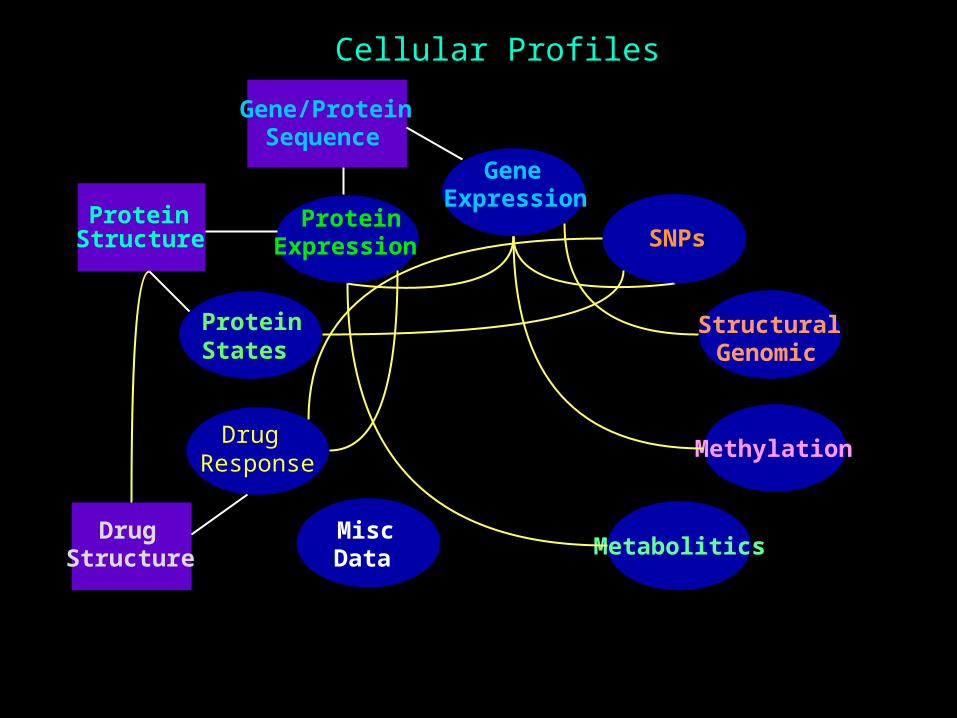
Cellular Profiles
GeneExpression
ProteinExpression
MiscData
SNPs
MethylationDrug
Response
Metabolitics
StructuralGenomic
ProteinStates
Gene/ProteinSequence
ProteinStructure
DrugStructure

Profiles Have Two Sides
Genes / Samples Sample 1 Sample 2 Sample 3 Sample 4
Gene 1 1 2 3 32
Gene 2 5 3 17 22
Gene 3 23 65 21 23
Gene 4 2 1 3 3
Genes / Samples Sample 1 Sample 2 Sample 3 Sample 4
Gene 1 1 2 3 32
Gene 2 5 3 17 22
Gene 3 23 65 21 23
Gene 4 2 1 3 3
A gene profile across samplesand a sample profile across genes
Microarraysand
Gene Expression Profiling
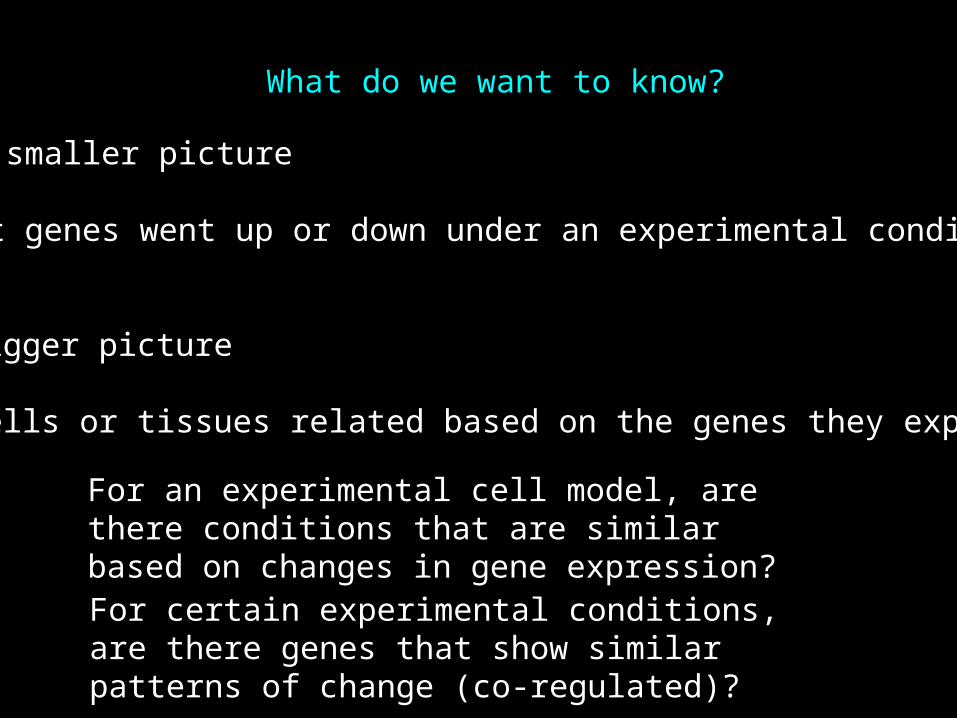
What do we want to know?
The bigger picture
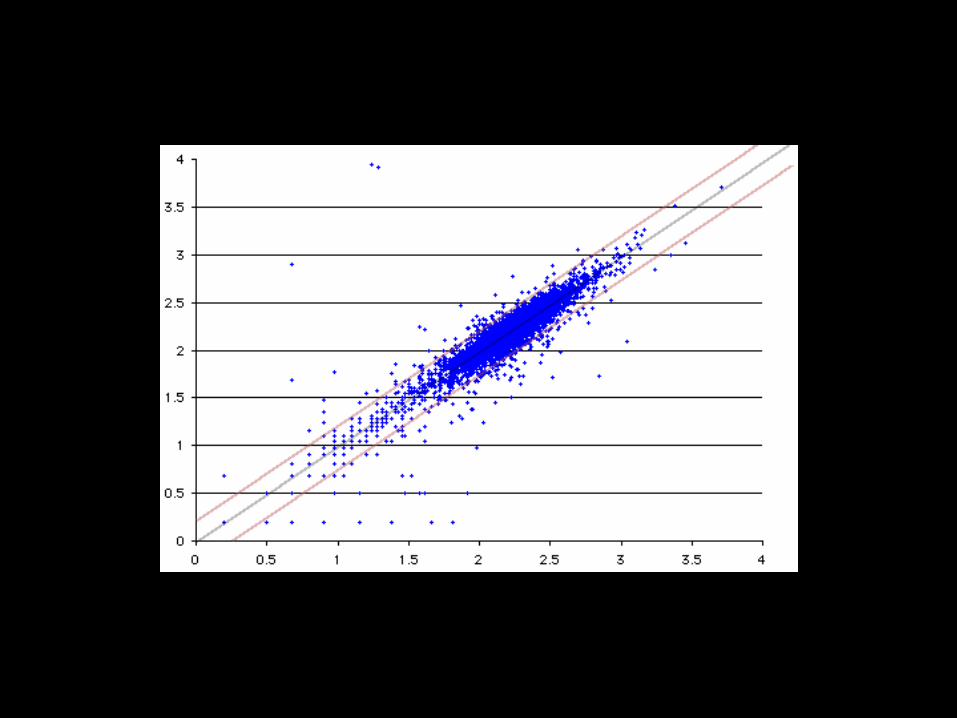
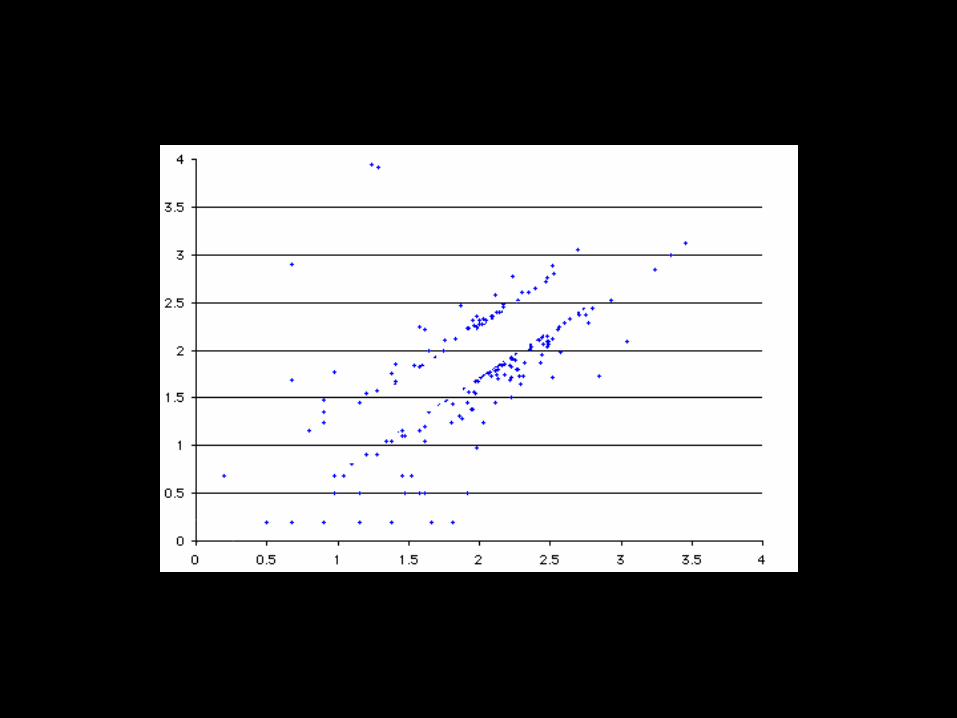
Are cells or tissues related based on the genes they express?
For an experimental cell model, are there conditions that are similar based on changes in gene expression?
For certain experimental conditions, are there genes that show similar patterns of change (co-regulated)?
The smaller picture
What genes went up or down under an experimental condition?
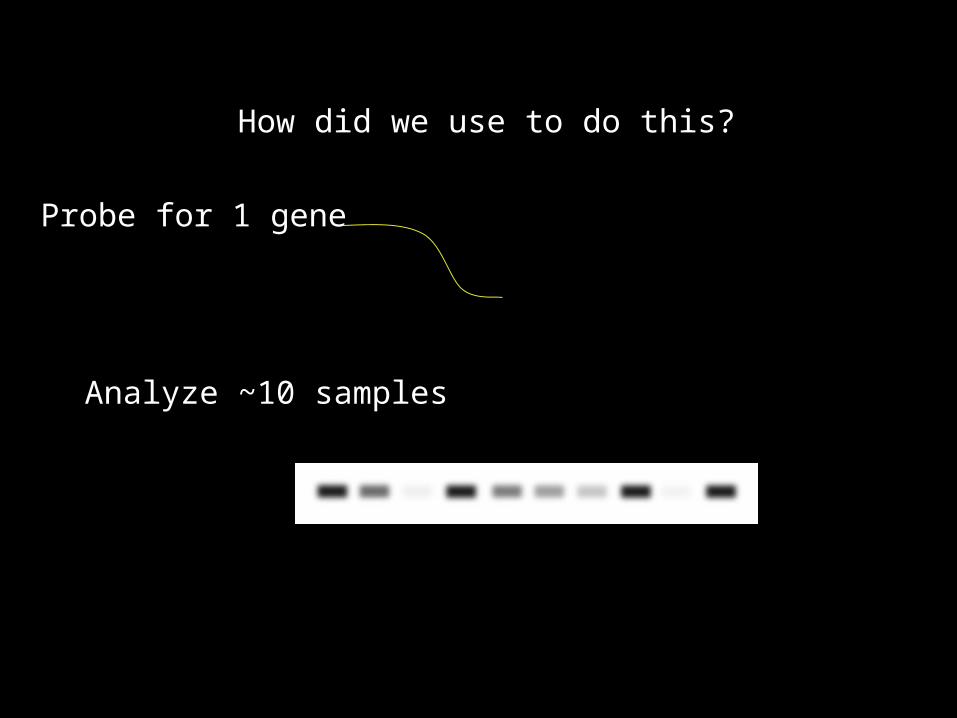
How did we use to do this?
Probe for 1 gene
Analyze ~10 samples
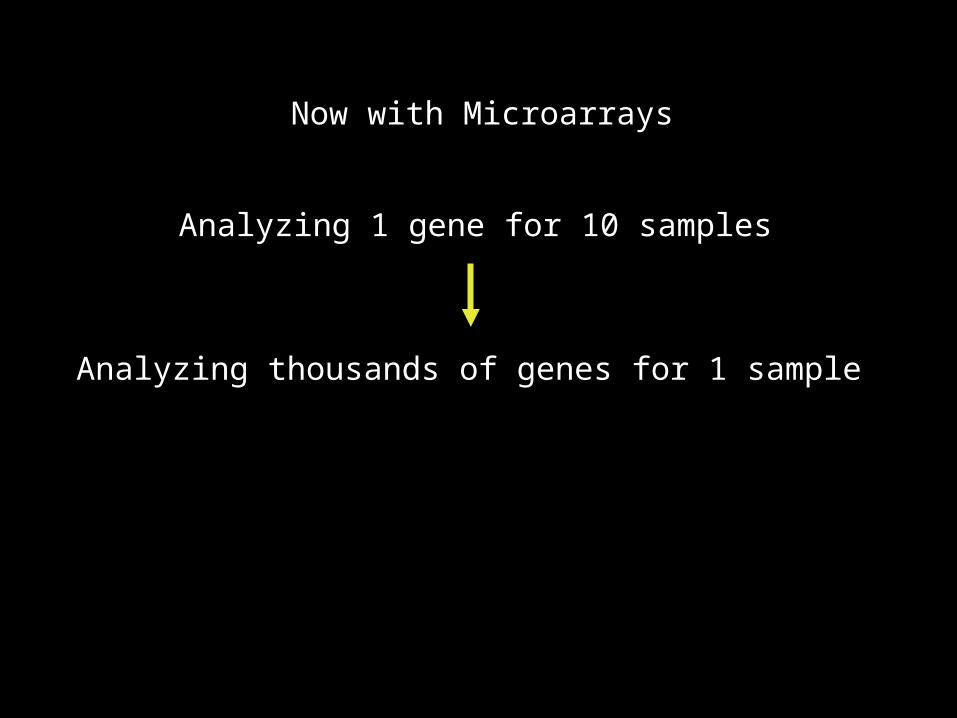
Analyzing 1 gene for 10 samples
Analyzing thousands of genes for 1 sample
Now with Microarrays
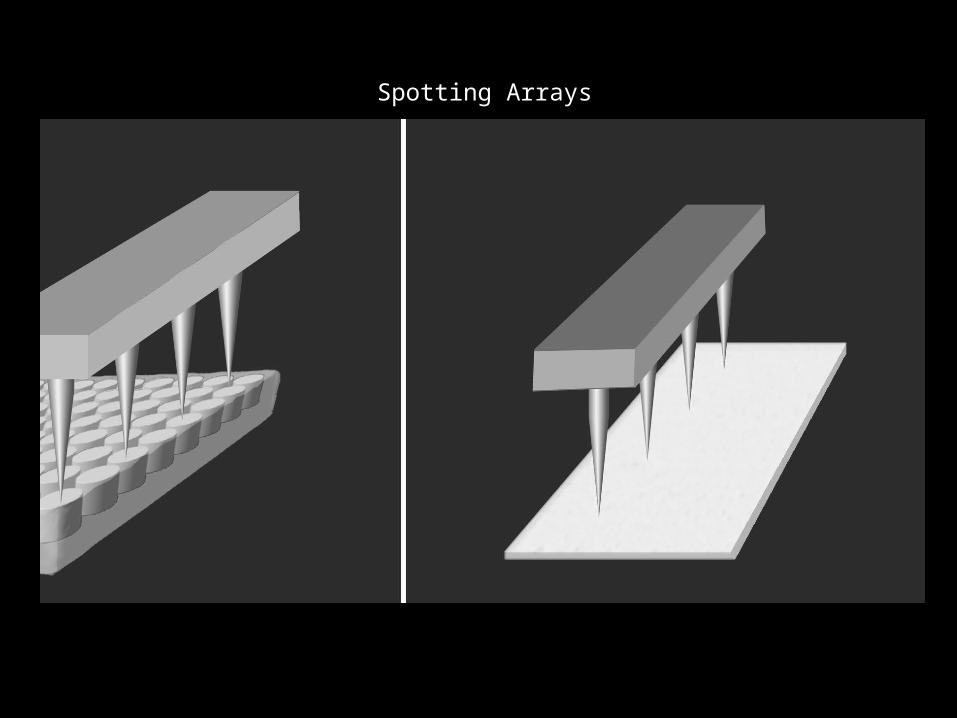
Spotting Arrays
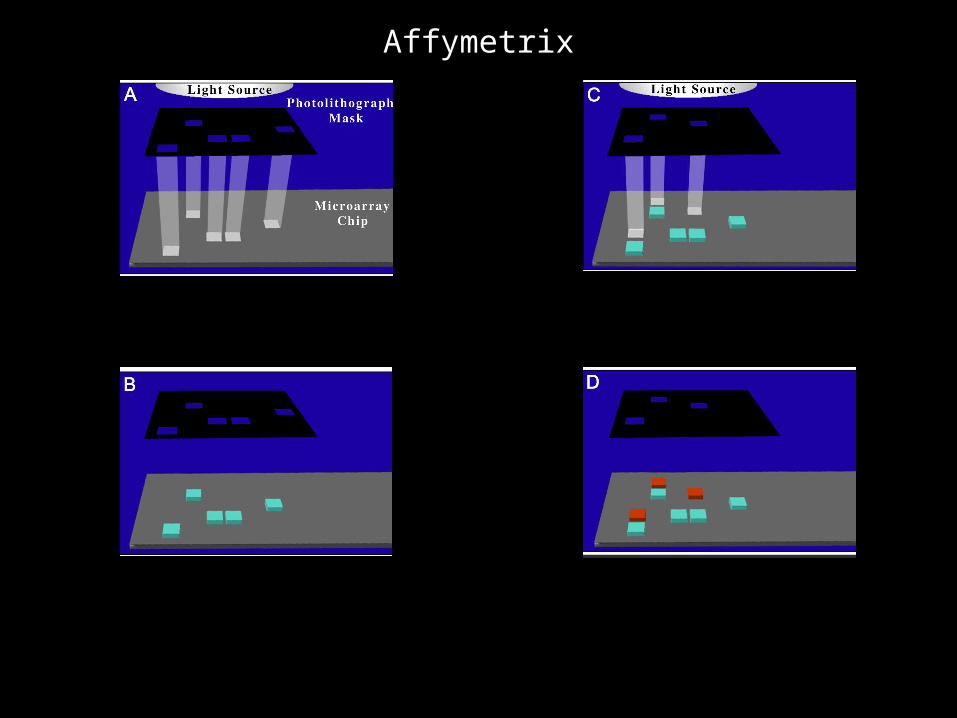
Affymetrix
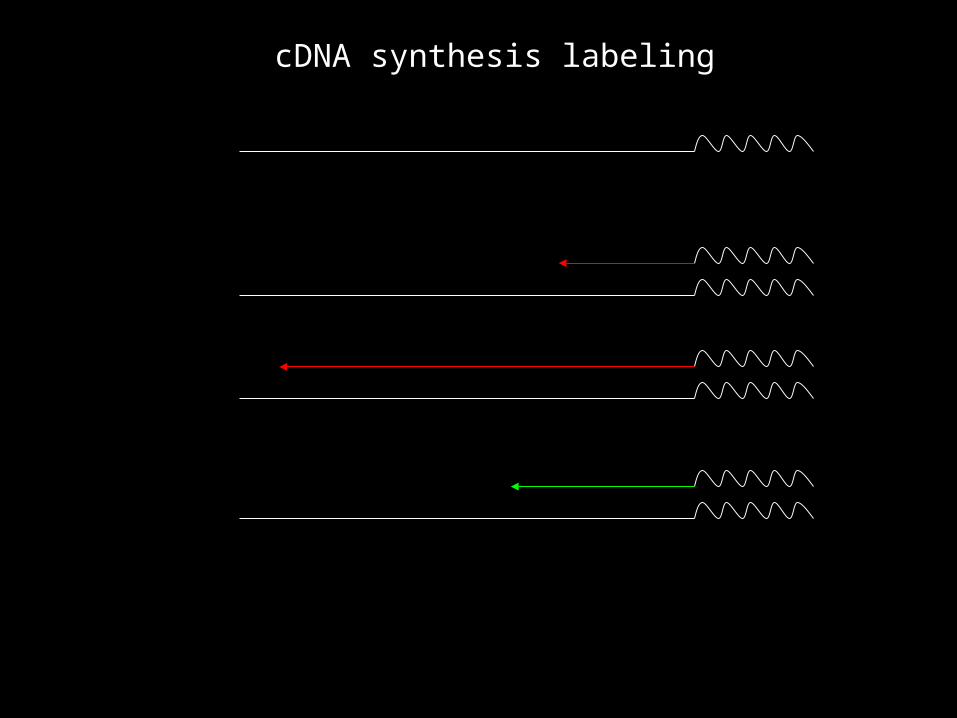
cDNA synthesis labeling

cell or conditionof interest
control or reference cell
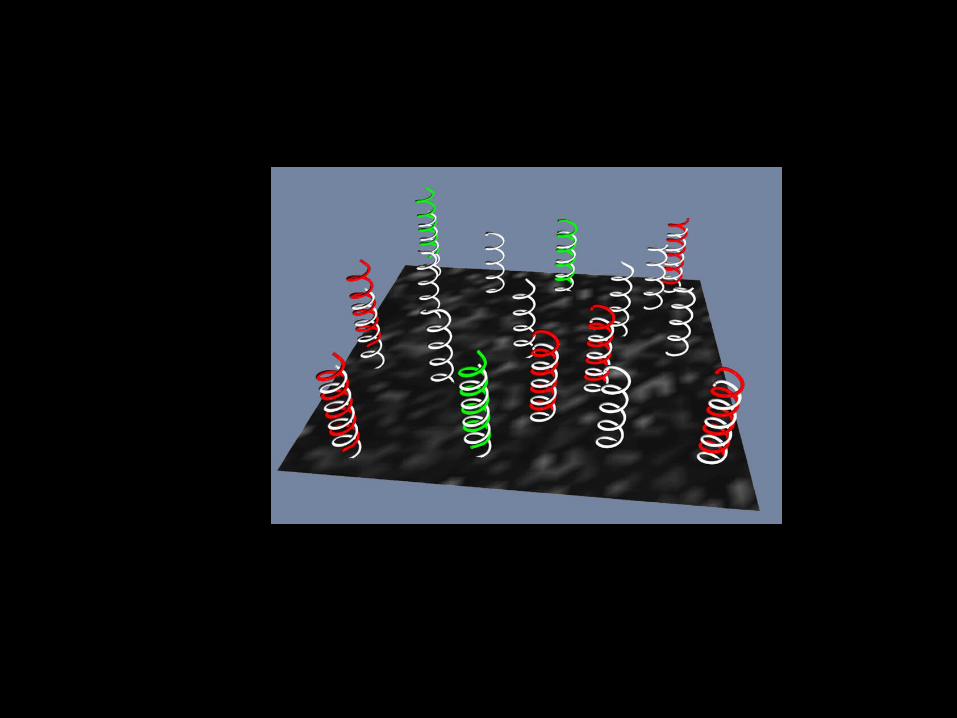
hybridize to microarray
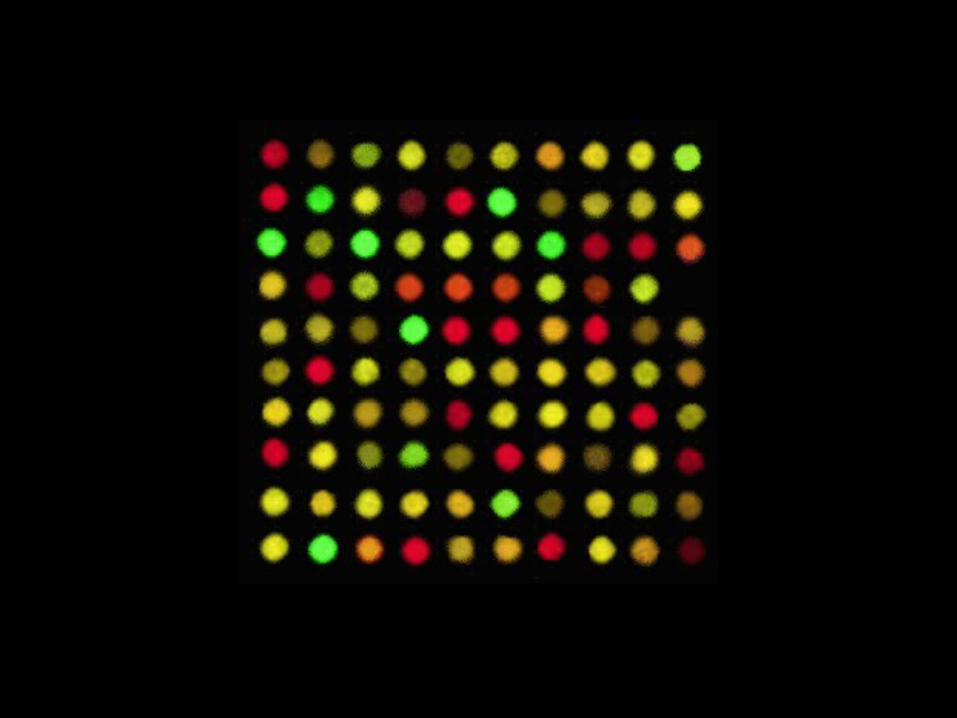
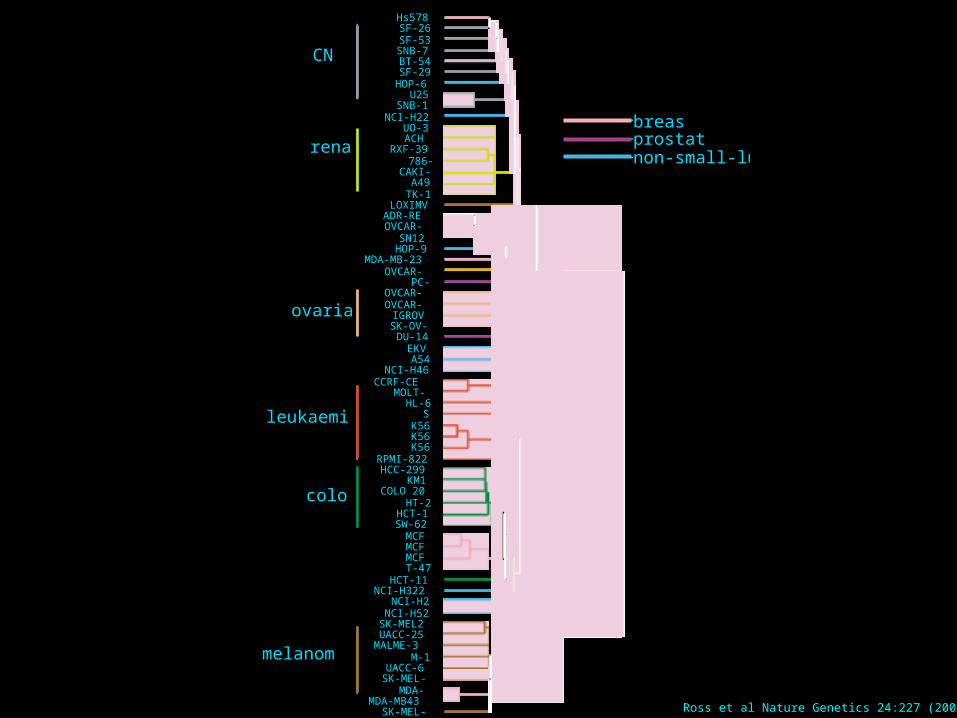
Gene Expression Profiling
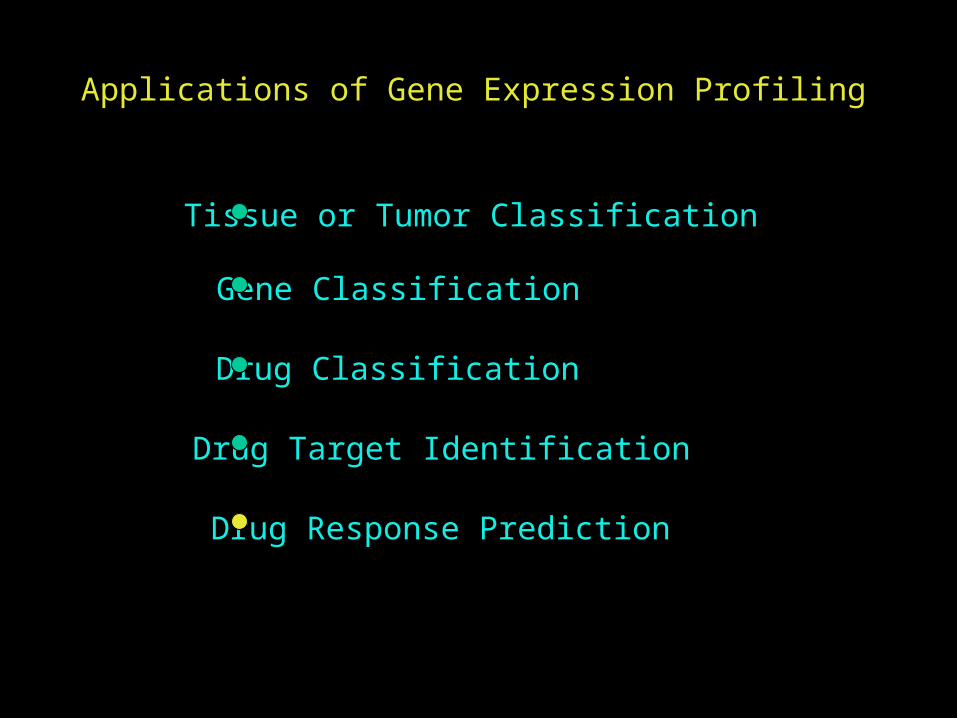
Applications of Gene Expression Profiling
Tissue or Tumor Classification
Gene Classification
Drug Classification
Drug Target Identification
Drug Response Prediction
breasprostatnon-small-lun
leukaemi
colo
melanom
CN
rena
ovaria
NCI-H2NCI-H52
SK-MEL2UACC-25
MALME-3M-1
UACC-6SK-MEL-
MDA-MDA-MB43
SK-MEL-
OVCAR-PC-
OVCAR-OVCAR-
IGROVSK-OV-
DU-14EKVA54
NCI-H46
Hs578SF-26SF-53SNB-7BT-54SF-29
HOP-6U25
SNB-1NCI-H22
UO-3ACH
RXF-39786-
CAKI-A49
TK-1LOXIMV
ADR-REOVCAR-
SN12HOP-9
MDA-MB-23
HCC-299KM1
COLO 20HT-2
HCT-1SW-62
MCFMCFMCFT-47
HCT-11NCI-H322
CCRF-CEMOLT-
HL-6S
K56K56K56
RPMI-822
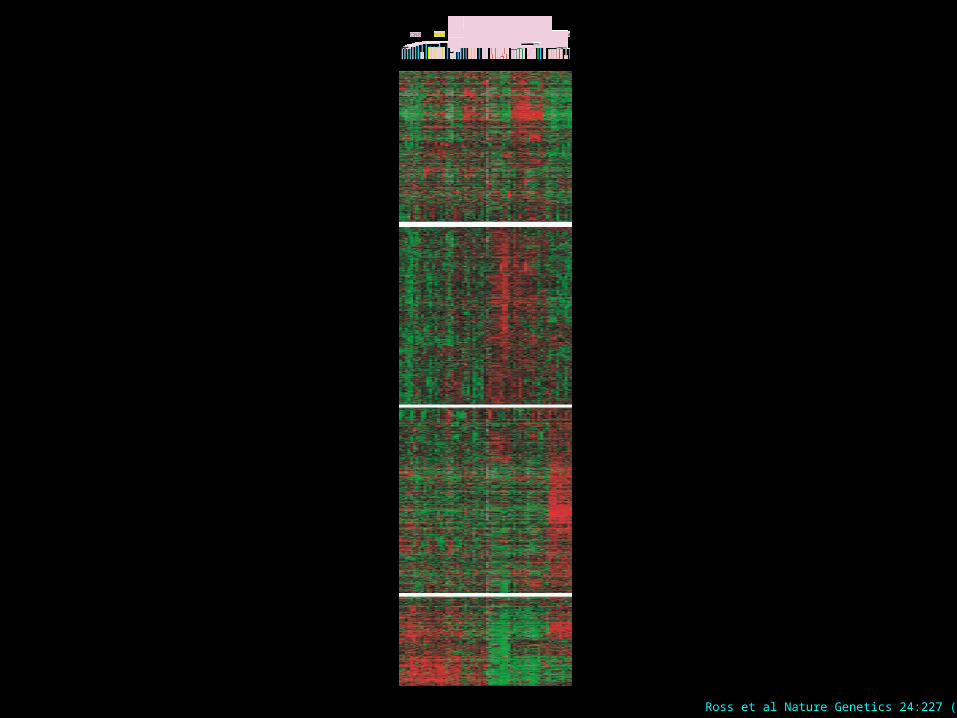
Ross et al Nature Genetics 24:227 (2000)
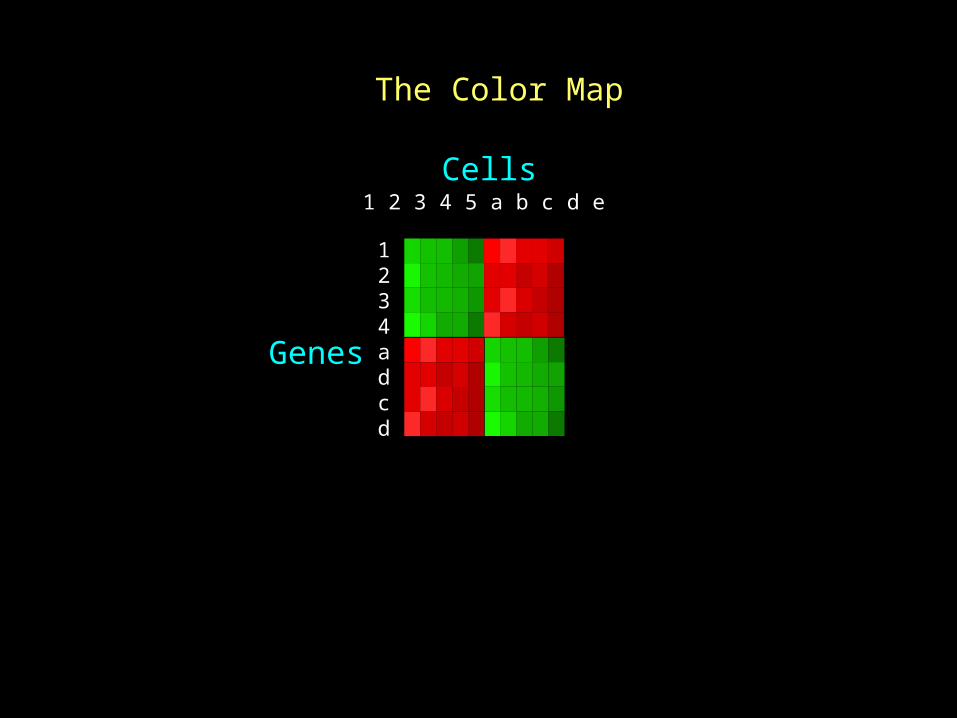
The Color Map
Cells
Genes
1 2 3 4 5 a b c d e
1234adcd
Ross et al Nature Genetics 24:227 (2000)
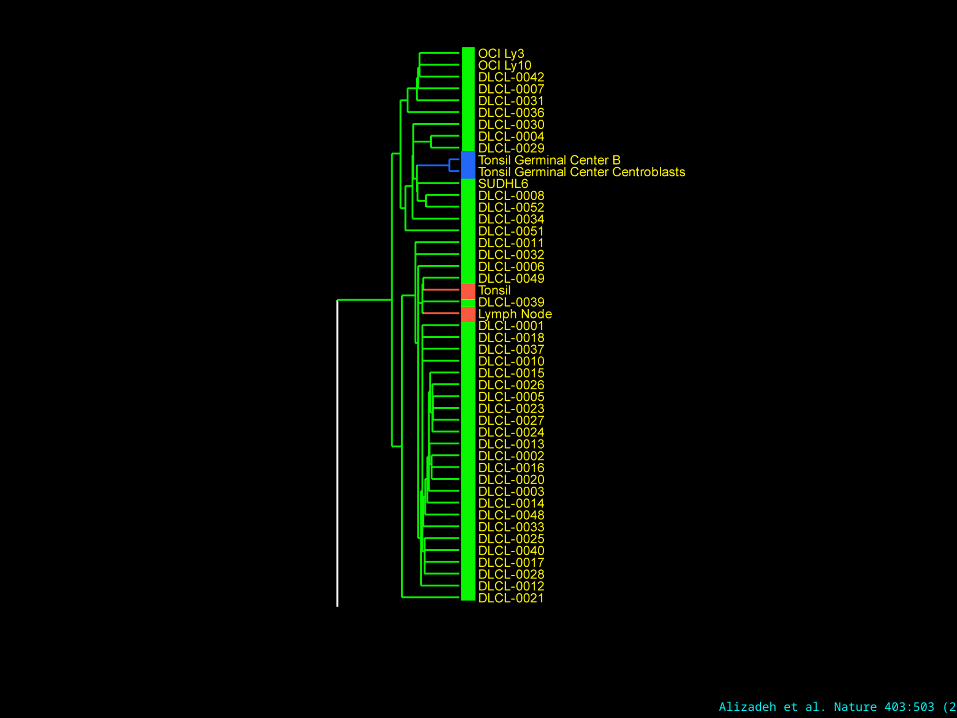
Alizadeh et al. Nature 403:503 (2000)
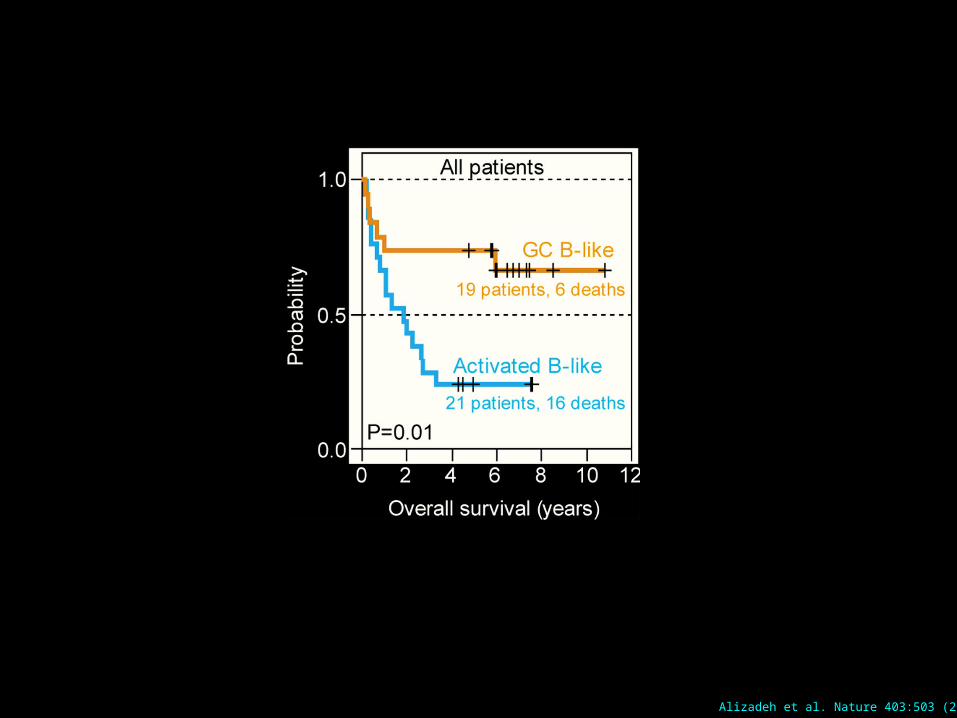
Alizadeh et al. Nature 403:503 (2000)
Gene Expression ArrayGenomic Content Array Methylation Array (Chromatin Array)Replication ArraySNP Array

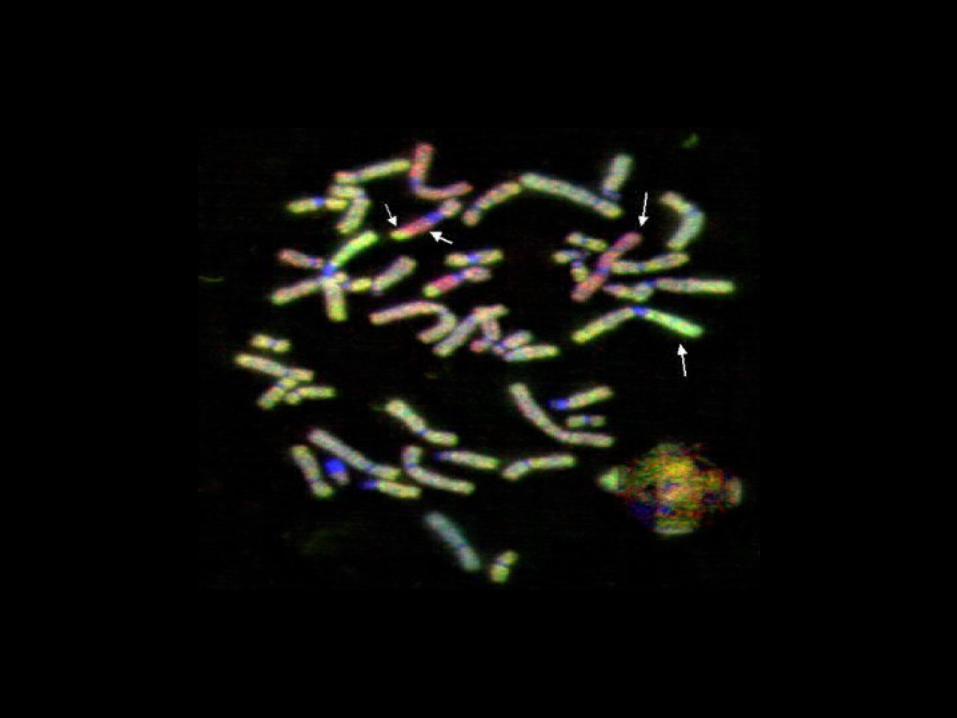
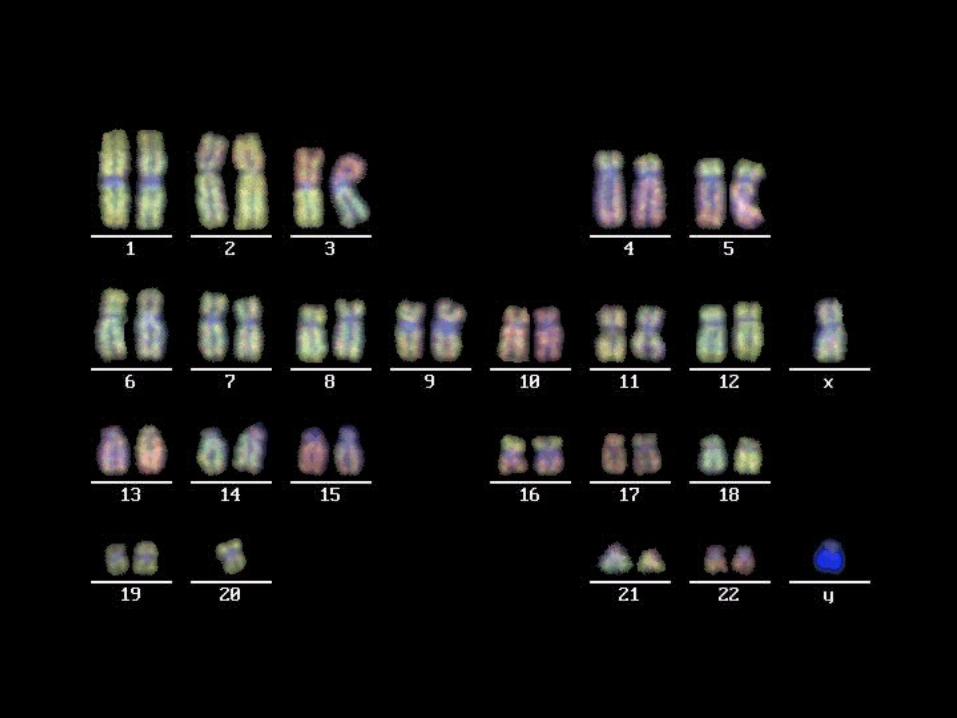
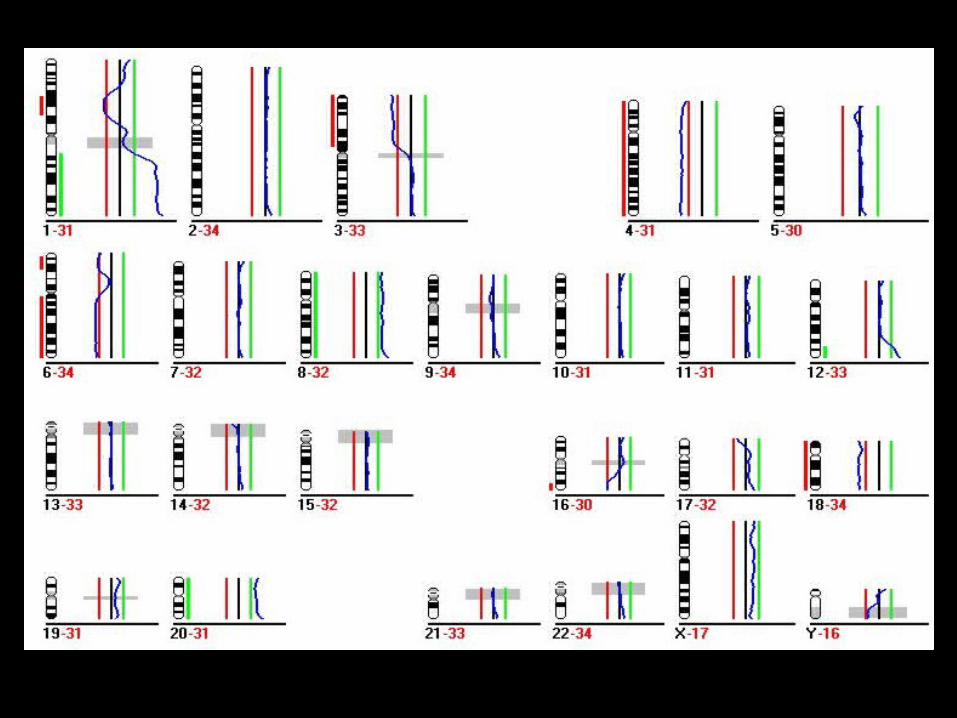
Comparative Genomic Hybridization (CGH)
Structural Genomic Profiling
cell with losses or gains normal cell
hybridize to metaphase chromosomes

BAC or Oligo Array
Normal Cancer
Label DNA Label DNA
Genome Representation Profiling Using Arrays

Detection mainly for cancer and inherited deletions
Tumor suppressor genes are deleted
Oncogenes are amplified
CGH
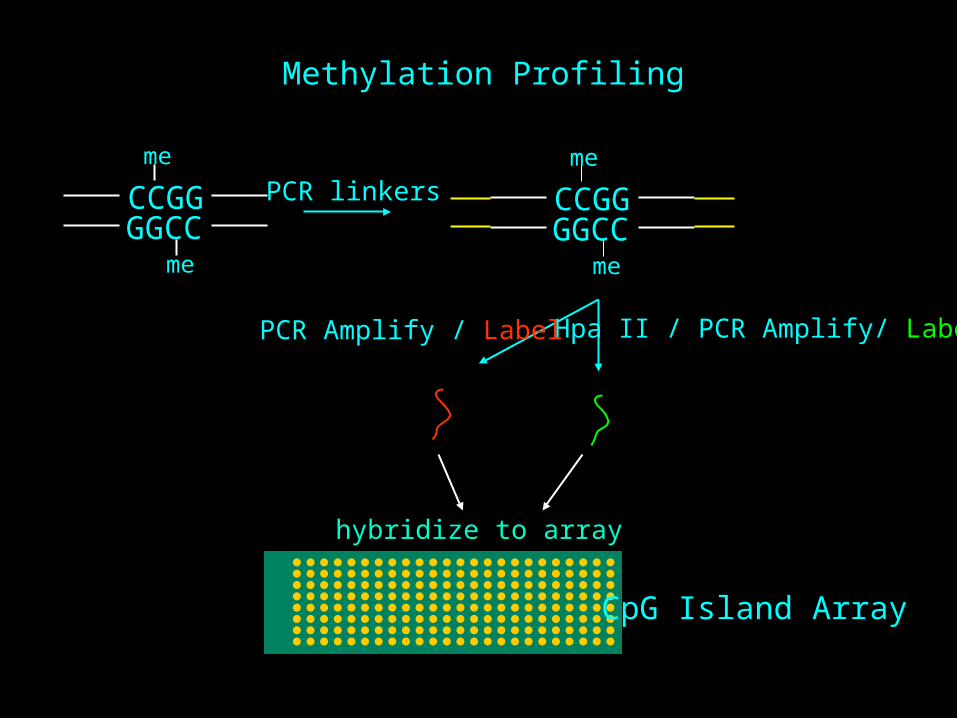
Methylation Profiling
CCGGGGCC
me
me
CCGGGGCC
me
me
PCR linkers
Hpa II / PCR Amplify/ LabelPCR Amplify / Label
CpG Island Array
hybridize to array
Profile cells based on methylation statecell-type profiles
Differences in the methylated state of cancers
Compare methylation profiles to gene expression profiles

Synchronized cells in G1/S
BrdULabeling
time
Replication Profiling
cDNA or BAC Array
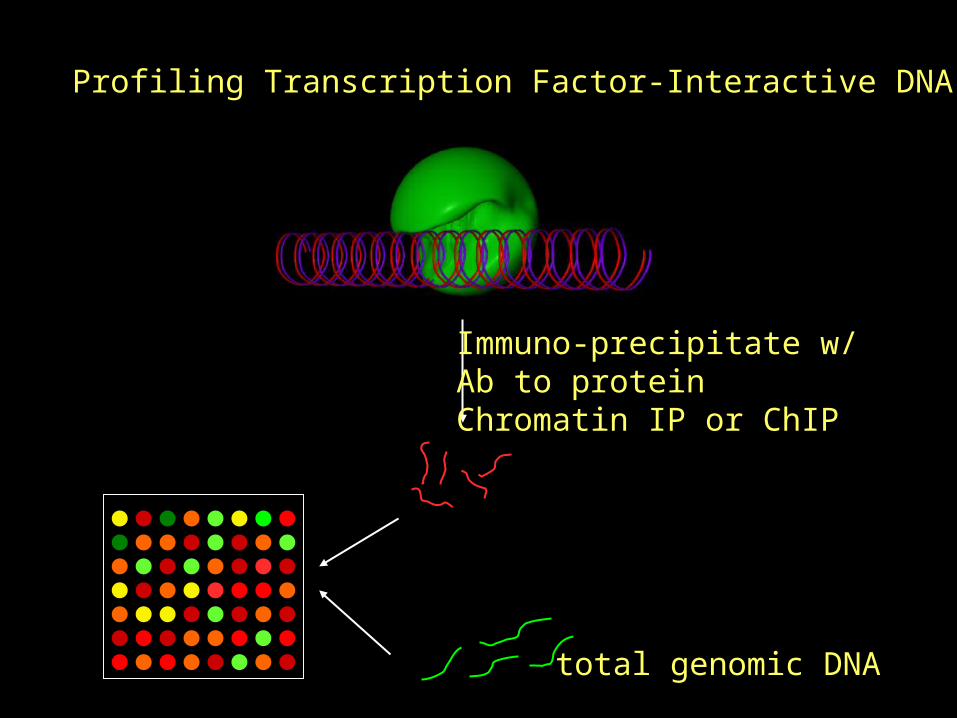
Profiling Transcription Factor-Interactive DNA
Immuno-precipitate w/Ab to protein Chromatin IP or ChIP
total genomic DNA
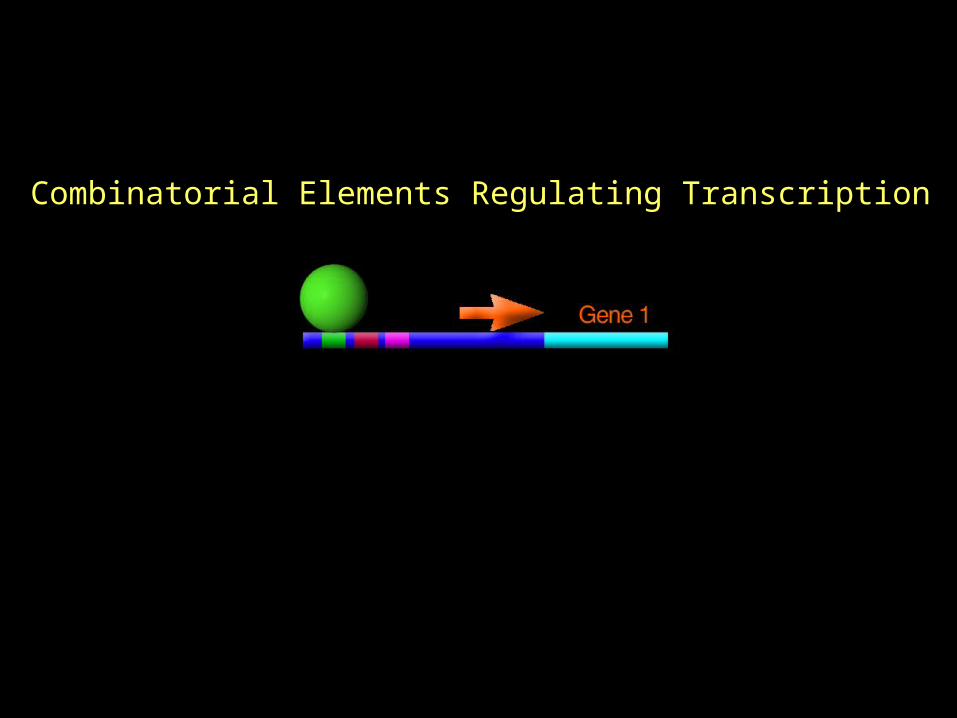
Combinatorial Elements Regulating Transcription
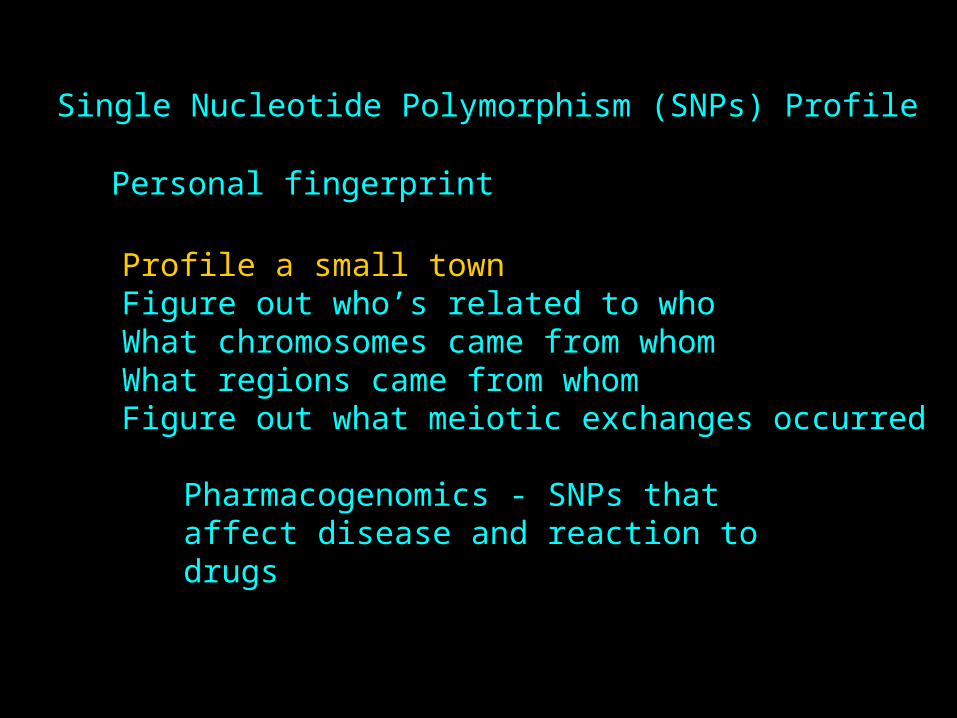
Single Nucleotide Polymorphism (SNPs) Profile
Personal fingerprint
Profile a small townFigure out who’s related to whoWhat chromosomes came from whomWhat regions came from whomFigure out what meiotic exchanges occurred
Pharmacogenomics - SNPs that affect disease and reaction to drugs
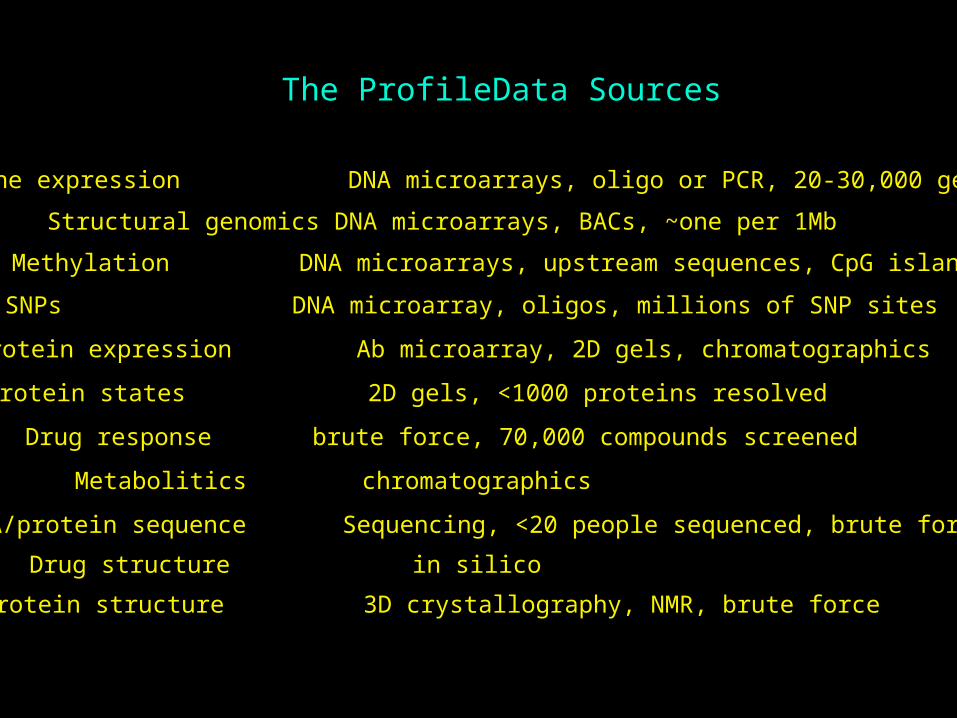
The ProfileData Sources
SNPs DNA microarray, oligos, millions of SNP sites
Protein expression Ab microarray, 2D gels, chromatographics
Protein states 2D gels, <1000 proteins resolved
Drug response brute force, 70,000 compounds screened
Metabolitics chromatographics
DNA/protein sequence Sequencing, <20 people sequenced, brute force
Drug structure in silico
Protein structure 3D crystallography, NMR, brute force
Gene expression DNA microarrays, oligo or PCR, 20-30,000 genes
Structural genomics DNA microarrays, BACs, ~one per 1Mb
Methylation DNA microarrays, upstream sequences, CpG islands

Questions?