microalgae and zinc source supplementation of …
TRANSCRIPT

University of Kentucky University of Kentucky
UKnowledge UKnowledge
Theses and Dissertations--Animal and Food Sciences Animal and Food Sciences
2019
MICROALGAE AND ZINC SOURCE SUPPLEMENTATION OF MICROALGAE AND ZINC SOURCE SUPPLEMENTATION OF
BROILER BREEDER DIETS AFFECTS BROILER BREEDER SKELETAL BROILER BREEDER DIETS AFFECTS BROILER BREEDER SKELETAL
DEVELOPMENT AND REPRODUCTION WITH DEVELOPMENT AND REPRODUCTION WITH
TRANSGENERATIONAL IMPACTS ON OFFSPRING TRANSGENERATIONAL IMPACTS ON OFFSPRING
PERFORMANCE AND SKELETAL CHARACTERISTICS PERFORMANCE AND SKELETAL CHARACTERISTICS
Marquisha A. Paul University of Kentucky, [email protected] Author ORCID Identifier:
https://orcid.org/0000-0003-4440-7956 Digital Object Identifier: https://doi.org/10.13023/etd.2019.462
Right click to open a feedback form in a new tab to let us know how this document benefits you. Right click to open a feedback form in a new tab to let us know how this document benefits you.
Recommended Citation Recommended Citation Paul, Marquisha A., "MICROALGAE AND ZINC SOURCE SUPPLEMENTATION OF BROILER BREEDER DIETS AFFECTS BROILER BREEDER SKELETAL DEVELOPMENT AND REPRODUCTION WITH TRANSGENERATIONAL IMPACTS ON OFFSPRING PERFORMANCE AND SKELETAL CHARACTERISTICS" (2019). Theses and Dissertations--Animal and Food Sciences. 114. https://uknowledge.uky.edu/animalsci_etds/114
This Doctoral Dissertation is brought to you for free and open access by the Animal and Food Sciences at UKnowledge. It has been accepted for inclusion in Theses and Dissertations--Animal and Food Sciences by an authorized administrator of UKnowledge. For more information, please contact [email protected].

STUDENT AGREEMENT: STUDENT AGREEMENT:
I represent that my thesis or dissertation and abstract are my original work. Proper attribution
has been given to all outside sources. I understand that I am solely responsible for obtaining
any needed copyright permissions. I have obtained needed written permission statement(s)
from the owner(s) of each third-party copyrighted matter to be included in my work, allowing
electronic distribution (if such use is not permitted by the fair use doctrine) which will be
submitted to UKnowledge as Additional File.
I hereby grant to The University of Kentucky and its agents the irrevocable, non-exclusive, and
royalty-free license to archive and make accessible my work in whole or in part in all forms of
media, now or hereafter known. I agree that the document mentioned above may be made
available immediately for worldwide access unless an embargo applies.
I retain all other ownership rights to the copyright of my work. I also retain the right to use in
future works (such as articles or books) all or part of my work. I understand that I am free to
register the copyright to my work.
REVIEW, APPROVAL AND ACCEPTANCE REVIEW, APPROVAL AND ACCEPTANCE
The document mentioned above has been reviewed and accepted by the student’s advisor, on
behalf of the advisory committee, and by the Director of Graduate Studies (DGS), on behalf of
the program; we verify that this is the final, approved version of the student’s thesis including all
changes required by the advisory committee. The undersigned agree to abide by the statements
above.
Marquisha A. Paul, Student
Dr. Anthony Pescatore, Major Professor
Dr. David Harmon, Director of Graduate Studies

TITLE PAGE
MICROALGAE AND ZINC SOURCE SUPPLEMENTATION OF BROILER
BREEDER DIETS AFFECTS BROILER BREEDER SKELETAL DEVELOPMENT
AND REPRODUCTION WITH TRANSGENERATIONAL IMPACTS ON OFFSPRING
PERFORMANCE AND SKELETAL CHARACTERISTICS
________________________________________
DISSERTATION
________________________________________
A dissertation submitted in partial fulfillment of the
requirements for the degree of Doctor of Philosophy in the
College of Agriculture, Food and Environment
at the University of Kentucky
By
Marquisha A. Paul
Lexington, Kentucky
Director: Dr. Anthony Pescatore, Associate Chair and Extension Professor of Animal and
Food Sciences
Lexington, Kentucky
2019
Copyright © Marquisha A. Paul 2019
https://orcid.org/0000-0003-4440-7956

ABSTRACT OF DISSERTATION
MICROALGAE AND ZINC SOURCE SUPPLEMENTATION OF BROILER
BREEDER DIETS AFFECTS BROILER BREEDER SKELETAL DEVELOPMENT
AND REPRODUCTION WITH TRANSGENERATIONAL IMPACTS ON
OFFSPRING PERFORMANCE AND SKELETAL CHARACTERISTICS
Leg problems and disorders are of major concern for the poultry industry and animal
welfare. Previous studies suggest that it may be possible to improve skeletal characteristics
through nutrition. Omega-3 fatty acids, including Docosahexaenoic acid (DHA), are
essential nutrients and are known to play an important role in bone tissue development.
FORPLUS™ (Alltech, Inc.) is an unextracted, whole-cell microalgae (Aurantiochytrium
limacinum CCAP 4087/2) that contains 64% fat and 16% DHA. Zinc (Zn) is a trace
element and essential nutrient for growth and skeletal development. Bioplex® Zn (Alltech,
Inc.) is a Zn proteinate that has been shown to be more bioavailable to broiler chickens
compared to inorganic sources of Zn. One objective of this research was to investigate the
effects of 2 dietary levels of FORPLUS™ (0% vs. 2%) and 2 dietary Zn sources (ZnO vs.
Bioplex® Zn) on skeletal characteristics and reproduction of broiler breeders. Breeders
were maintained on these diets throughout the entire pullet and layer phases. Subsequent
studies were conducted to evaluate the effect of breeder diet and offspring dietary Zn
sources (ZnO vs. Bioplex® Zn) and microalgae supplementation (0% vs. 1%) on offspring
performance and skeletal characteristics. During the broiler breeder pullet phase, dietary
supplementation of 2% FORPLUS™ increased (P<0.05) femur ash content and length.
Pullet uniformity was in increased (P<0.05) by Bioplex® Zn vs ZnO when microalgae was
not included in the diet. Hen day production (HDP) was increased (P<0.05) by ZnO vs.
Bioplex® Zn supplementation during post-peak lay. During post-peak lay, hatchability and
hatch of fertile eggs were improved (P<0.05) by dietary supplementation of 2%
FORPLUS™ or Bioplex® Zn in breeder diets, however egg weight, egg yolk weight,
offspring hatch weight, and offspring body weight gain (BWG) significantly were
decreased (P<0.05) by 2% FORPLUS™. Bioplex® Zn in breeder diets increased (P<0.05)
growth plate zone heights, bone-specific alkaline phosphatase enzyme activity, and
dimensions of offspring bones at hatch. At 3 weeks of age, offspring from breeders fed
Bioplex® Zn during peak-lay had greater (P<0.05) Zn content in tibia ash and bone
dimensions, while offspring from breeders fed 2% FORPLUS™ vs. 0% FORPLUS™ had
longer (P<0.05) femurs. No interaction effect of breeder diet and offspring diet on early

performance was observed. Offspring fed diets containing Bioplex® Zn vs. ZnO had
greater (P<0.05) body weight (BW) and tibia dimensions at 3 wk of age. Offspring fed
diets containing 1% FORPLUS™ had decreased feed conversion (feed intake: BWG), but
no main effects were observed on skeletal characteristics. Overall, dietary microalgae
supplementation in broiler breeder diets improved early bone development in broiler
breeders, early bone development in broiler breeder offspring, and hatchability of offspring
during post-peak lay, while Bioplex® Zn supplementation in broiler breeder diets improved
broiler breeder pullet uniformity, offspring hatchability during post-peak lay, embryonic
skeletal development of offspring, and offspring bone quality. Bioplex® Zn in offspring
diets also improved offspring early growth performance and leg bone morphology.
KEYWORDS: Microalgae, Zinc, Broiler Breeder, Skeletal Characteristics, Performance
Marquisha A. Paul
(Name of Student)
12/18/2019
Date

MICROALGAE AND ZINC SOURCE SUPPLEMENTATION OF BROILER
BREEDER DIETS AFFECTS BROILER BREEDER SKELETAL DEVELOPMENT
AND REPRODUCTION WITH TRANSGENERATIONAL IMPACTS ON
OFFSPRING PERFORMANCE AND SKELETAL CHARACTERISTICS
By
Marquisha A. Paul
Dr. Anthony Pescatore
Director of Dissertation
Dr. David Harmon
Director of Graduate Studies
12/18/2019
Date

DEDICATION
To my beloved grandmother, Nelva Jean Paul and in memory of Thaddeus Frederick
Paul, Lou Emma Kirkland, and Cheryl Anita Paul

iii
ACKNOWLEDGMENTS
First, I would like to thank God for making all things possible. Second, I would
like to express gratitude to my graduate advisor, Dr. Anthony Pescatore, for guiding me
through my graduate experience and investing in my success. I appreciate the time,
knowledge, patience, and kindness he has shared with me over the years. I would like to
thank Dr. Tuoying Ao for his dedication to my professional advancement and support as
a member of my graduate committee. I would like to thank committee members, Dr.
Debra Aaron and Dr. Geza Bruckner, for their time and encouragement through this
process. I would also like to thank Dr. Barbara Nikolajczyk for accepting the appointment
of outside examiner for this research.
I am humbled to have received the generous financial support of Dr. Mark Lyons
and the late Dr. Pearse Lyons of Alltech, Inc. I would like to thank them for encouraging
my curiosity in research. I would like to give thanks to Dr. Karl Dawson and Dr. Ronan
Power for their unwavering support of my professional development. I am also grateful
to Dr. Lizza Macalintal for her mentorship and friendship throughout my graduate
experience.
I greatly appreciate the labor and efforts of Mr. Mike Ford, Mr. Ryan Lakarosky,
and Mr. Joseph Hawkins during each research trial. I am thankful for the assistance of
Dr. Jacquie Jacob, Dr. Sunday Adedokun, Mr. David Gillespie, Ms. Phyllis Glenney, Mr.
W. D. King, Ms. Carrie Johnson, Ms. Jenna Fenwick, Ms. Janna Norton, Ms. Opeyemi
Olojede, Mr. Kun Dong, Mrs. Alma True, Ms. Szamare Crowder, Mrs. Hui Zhao, and
Mr. Cody Duhram. I would like to extend special thanks to Dr. Lauren Nolan and Dr.

iv
Rebecca Delles for being wonderful friends and thoughtful supporters through this
journey.
I am blessed to have dear friends and colleagues who constantly inspire and
encourage me. I thank you all. I would like to thank my extended family near and far
for your love, support, and prayers. I deeply appreciate my parents, Mark and Denise
Paul, and my sisters, Chamara and Aliyah Paul, for believing in me. I thank my husband,
Gustavo Cruz, for his help at home and encouragement. To my son, Malcolm Paul, I am
extremely thankful for your support and your love. I will cherish you always.

v
TABLE OF CONTENTS
ACKNOWLEDGMENTS ................................................................................................... iii
TABLE OF CONTENTS ..................................................................................................... v
LIST OF TABLES .............................................................................................................. ix
LIST OF FIGURES ........................................................................................................... xiii
LIST OF ABBREVIATIONS ........................................................................................... xiv
OVERVIEW OF RESEARCH ....................................................................................... xvii CHAPTER 1. LITERATURE REVIEW ............................................................................ 1
1.1 Introduction: Leg problems in the broiler industry .................................................. 1
1.2 Skeletal leg development in broilers ......................................................................... 5
1.3 Broiler skeletal leg disorders and deformities ........................................................ 10
1.3.1 Bacterial chondronecrosis with osteomyelitis ................................................. 10
1.3.2 Tibia dyschondroplasia .................................................................................... 11
1.3.3 Valgus varus deformation and twisted leg ....................................................... 12
1.3.4 Rickets .............................................................................................................. 13
1.3.5 Chondrodystrophy ............................................................................................ 14
1.4 Management strategies to improve broiler leg health ............................................ 14
1.4.1 Exercise and enrichment .................................................................................. 14
1.4.2 Lighting, litter quality, and stocking density ................................................... 15
1.4.3 Control of toxins .............................................................................................. 16
1.4.4 Incubation settings ........................................................................................... 16
1.5 Breeding strategies to improve broiler leg health .................................................. 17
1.6 Nutritional strategies to improve broiler leg health ............................................... 19
1.6.1 Crude protein and amino acids......................................................................... 19
1.6.2 Lipids and fatty acids ....................................................................................... 20
1.6.3 Vitamin D, calcium and phosphorus ................................................................ 23
1.6.4 Minerals and electrolytes ................................................................................. 26
1.6.5 Vitamins ........................................................................................................... 27
1.6.6 Feed additives .................................................................................................. 29
1.6.7 Breeder and prenatal nutrition ......................................................................... 32
1.7 Omega-3 polyunsaturated fatty acids and skeletal development ............................ 35
1.8 Zinc and skeletal development ................................................................................ 39

vi
1.9 Organization of the broiler industry ....................................................................... 42
CHAPTER 2. Effects of Microalgae Level and Zn Source Supplementation in Broiler
Breeder diets on Broiler Breeder Pullet Growth, Uniformity, and Leg Bone Quality ..... 43
2.1 Introduction............................................................................................................. 45
2.2 Materials and Methods ........................................................................................... 46
2.2.1 Experimental Design ........................................................................................ 46
2.2.2 Early Growth Performance Measurements ...................................................... 47
2.2.3 Body Weight Uniformity ................................................................................. 47
2.2.4 Bone Length, Mechanical Testing, Ash Determination, and Mineral Analysis
................................................................................................................................... 47
2.2.5 Statistical Analysis ........................................................................................... 48
2.3 Results and Discussion ........................................................................................... 49
2.3.1 Early Growth Performance .............................................................................. 49
2.3.2 Pullet BW and BW Uniformity ........................................................................ 50
2.3.3 Bone Length, Mechanical Testing, Ash Determination, and Mineral Analysis
................................................................................................................................... 52
2.4 Summary and Conclusions ...................................................................................... 55
2.5 Figures and Tables ................................................................................................. 56
CHAPTER 3. Effects of Dietary Microalgae Level and Zn Source Supplementation on
Broiler Breeder Egg Quality, Production, Fertility, and Hatchability of Offspring ......... 73
3.1 Introduction............................................................................................................. 75
3.2 Materials and Methods ........................................................................................... 76
3.2.1 Experimental Design ........................................................................................ 76
3.2.2 Egg Quality ...................................................................................................... 77
3.2.3 Hen Day Production ......................................................................................... 78
3.3.4 Fertility and Hatchability ................................................................................. 78
3.3.5 Statistical Analysis ........................................................................................... 79
3.3 Results and Discussion ........................................................................................... 79
3.3.1 Egg Quality ...................................................................................................... 79
3.3.2 Hen Day Production ......................................................................................... 81
3.3.3 Fertility and Hatch of Offspring....................................................................... 82
3.Summary and Conclusions ......................................................................................... 83
3.5 Figures and Tables ................................................................................................. 84
CHAPTER 4. Effects of Broiler Breeder Dietary Microalgae Level and Zn Source on
Offspring Skeletal Leg Development at Hatch ................................................................. 97
4.1 Introduction............................................................................................................. 99

vii
4.2 Materials and Methods ......................................................................................... 100
4.2.1 Experimental Design ...................................................................................... 101
4.2.2 Skeletal Leg Bone Gross Morphology ........................................................... 102
4.2.3 Skeletal Leg Growth Plate Morphology ........................................................ 102
4.2.4 Bone-specific Alkaline Phosphatase Assay ................................................... 103
4.2.5 Statistical Analysis ......................................................................................... 103
4.3 Results and Discussion ......................................................................................... 104
4.3.1 Skeletal Leg Bone Gross Morphology ........................................................... 104
4.3.2 Skeletal Leg Bone Growth Plate Morphology ............................................... 106
4.3.3 Bone-specific Alkaline Phosphatase .............................................................. 107
4.4 Summary and Conclusions .................................................................................... 108
4.5 Tables .................................................................................................................... 109
CHAPTER 5. Effects of Broiler Breeder Dietary Microalgae Level and Zn Source on
Offspring Early Growth Performance and Skeletal Leg Quality .................................... 118
5.1 Introduction........................................................................................................... 120
5.2 Materials and Methods ......................................................................................... 122
5.2.1 Experimental Design ...................................................................................... 122
5.2.2 Early growth performance ............................................................................. 123
5.2.3 Leg Bone Quality Measurements ................................................................... 123
5.2.4 Statistical Analysis ......................................................................................... 124
5.3 Results and Discussions ........................................................................................ 125
5.3.1 Early Growth Performance ............................................................................ 125
5.3.2 Leg Bone Quality ........................................................................................... 125
5.4 Summary and Conclusions .................................................................................... 127
5.5 Tables .................................................................................................................... 128
CHAPTER 6. Effects of Broiler Breeder Dietary Microalgae Level, Zn Source, and
Offspring Zn Source on Offspring Early Growth Performance and Skeletal Leg
Quality……..................................................................................................................... 133
6.1 Introduction........................................................................................................... 135
6.2 Materials and Methods ......................................................................................... 137
6.2.1 Experimental Design ...................................................................................... 137
6.2.2 Early growth performance ............................................................................. 138
6.2.3 Leg Bone Quality Measurements ................................................................... 139
6.2.4 Statistical Analysis ......................................................................................... 140
6.3 Results and Discussions ........................................................................................ 140
6.3.1 Early Growth Performance ............................................................................ 140
6.3.2 Leg Bone Quality ........................................................................................... 141

viii
6.4 Summary and Conclusions .................................................................................... 142
6.5 Tables .................................................................................................................... 143
CHAPTER 7. Effects of Broiler Breeder Dietary Microalgae Level, Zn Source, and
Offspring Microalgae Supplementation on Offspring Early Growth Performance and
Skeletal Leg Quality ....................................................................................................... 150
7.1 Introduction........................................................................................................... 152
7.2 Materials and Methods ......................................................................................... 154
7.2.1 Experimental Design ...................................................................................... 154
7.2.2 Early growth performance ............................................................................. 155
7.2.3 Leg Bone Quality Measurements ................................................................... 156
7.2.4 Statistical Analysis ......................................................................................... 157
7.3 Results and Discussions ........................................................................................ 157
7.3.1 Early Growth Performance ............................................................................ 157
7.3.2 Leg Bone Quality ........................................................................................... 158
7.4 Summary and Conclusions .................................................................................... 159
7.5 Tables .................................................................................................................... 160
CHAPTER 8. Summary and Conclusions ...................................................................... 167
BIBLIOGRAPHY ........................................................................................................... 174
VITA ............................................................................................................................... 191

ix
LIST OF TABLES
Table 1.1 The Bristol Gait Scoring System ........................................................................ 2
Table 1.2 Incidence of lameness in European commercial broiler flocks .......................... 4
Table 1.3 Fatty acid profile of dietary fats and oils .......................................................... 21
Table 1.4 Embryonic skeletal disorders associated with broiler breeder nutrient
deficiencies ............................................................................................................. 34
Table 2.1 Diet and nutrient composition of broiler breeder starter diets .......................... 56
Table 2.2 Diet and nutrient composition of broiler breeder grower diets ......................... 57
Table 2.3 Diet and nutrient composition of broiler breeder pre-lay diets ......................... 58
Table 2.4 Dietary effects of FORPLUS™ level and Zn source on broiler breeder pullet
early growth performance through 3 wk of age ..................................................... 59
Table 2.5 Effects of dietary FORPLUS™ level and supplemental Zn source on broiler
breeder BW uniformity from 3-20 wk of age ......................................................... 62
Table 2.6 Effects of dietary FORPLUS™ level and supplemental Zn source on broiler
breeder pullet leg bone length, breaking strength, and ash percentage at 3 wk of
age .......................................................................................................................... 63
Table 2.7 Effects of dietary FORPLUS™ level and supplemental Zn source on broiler
breeder pullet tibia ash mineral content at 3 wk of age .......................................... 64
Table 2.8 Effects of dietary FORPLUS™ level and supplemental Zn source on broiler
breeder pullet femur ash mineral content at 3 wk of age ....................................... 65
Table 2.9 Effects of dietary FORPLUS™ level and supplemental Zn source on broiler
breeder pullet leg bone length, breaking strength, and ash percentage at 6 wk of
age .......................................................................................................................... 66
Table 2.10 Effects of dietary FORPLUS™ level and supplemental Zn source on broiler
breeder pullet tibia ash mineral content at 6 wk of age .......................................... 67
Table 2.11 Effects of dietary FORPLUS™ level and supplemental Zn source on broiler
breeder pullet femur ash mineral content at 6 wk of age ....................................... 68
Table 2.12 Effects of dietary FORPLUS™ level and supplemental Zn source on broiler
breeder pullet leg bone breaking strength and ash percentage at 16 wk of age ..... 69

x
Table 2.13 Effects of dietary FORPLUS™ level and supplemental Zn source on broiler
breeder pullet tibia ash mineral content at 16 wk of age ........................................ 70
Table 2.14 Effects of dietary FORPLUS™ level and supplemental Zn source on broiler
breeder pullet femur ash mineral content at 16 wk of age ..................................... 71
Table 2.15 Effects of dietary FORPLUS™ level and supplemental Zn source on broiler
breeder pullet bone breaking strength at 20 wk of age ........................................... 72
Table 3.1 Diet and nutrient composition of broiler breeder peak lay diets....................... 84
Table 3.2 Diet and nutrient composition of broiler breeder post-peak lay diets............... 85
Table 3.3 Dietary effects of FORPLUS™ level and Zn source on broiler breeder egg
quality at 24 weeks of lay ....................................................................................... 86
Table 3.4 Dietary effects of FORPLUS™ level and Zn source on broiler breeder egg
quality at 32 weeks of lay ....................................................................................... 87
Table 3.5 Dietary effects of FORPLUS™ level and Zn source on broiler breeder egg
quality at 36 weeks of lay ....................................................................................... 88
Table 3.6 Dietary effects of FORPLUS™ level and Zn source on broiler breeder egg
mineral content at 25 weeks of lay ......................................................................... 89
Table 3.7 Dietary effects of FORPLUS™ level and Zn source on broiler breeder egg
mineral content at 32 weeks of lay ......................................................................... 90
Table 3.8 Dietary effects of FORPLUS™ level and Zn source on broiler breeder hen day
production ............................................................................................................... 92
Table 3.9 Dietary effects of FORPLUS™ level and Zn source on broiler breeder fertility
and offspring hatch at 19-20 weeks of lay ............................................................. 93
Table 3.10 Dietary effects of FORPLUS™ level and Zn source on broiler breeder fertility
and offspring hatch at 30-31 weeks of lay ............................................................. 94
Table 3.11 Dietary effects of FORPLUS™ level and Zn source on broiler breeder fertility
and offspring hatch at 35-37 weeks of lay ............................................................. 95
Table 3.12 Dietary effects of FORPLUS™ level and Zn source on broiler breeder fertility
and offspring hatch at 41-43 weeks of lay ............................................................. 96
Table 4.1 Diet and nutrient composition of broiler breeder peak lay diets..................... 109
Table 4.2 Diet and nutrient composition of broiler breeder post-peak lay diets............. 110
xi
Table 4.3 Effects of broiler breeder dietary FORPLUS™ level and Zn source at 19-20
weeks of lay on offspring skeletal leg morphology at hatch ................................ 111
Table 4.4 Effects of broiler breeder dietary FORPLUS™ level and Zn source at 30-31
weeks of lay on offspring skeletal leg morphology ............................................. 112
Table 4.5 Effects of broiler breeder dietary FORPLUS™ level and Zn source at 41-43
weeks of lay on offspring skeletal leg morphology ............................................. 113
Table 4.6 Effects of broiler breeder dietary FORPLUS™ level and Zn source at 19-20
weeks of lay on offspring growth plate morphology ........................................... 114
Table 4.7 Effects of broiler breeder dietary FORPLUS™ level and Zn source at 30-31
weeks of lay on offspring growth plate morphology ........................................... 115
Table 4.8 Effects of broiler breeder dietary FORPLUS™ level and Zn source at 41-43
weeks of lay on offspring growth plate morphology ........................................... 116
Table 4.9 Effects of broiler breeder dietary FORPLUS™ level and Zn source on
offspring bone-specific alkaline phosphatase in serum ........................................ 117
Table 5.1 Diet and nutrient composition of broiler breeder layer and broiler starter diets
.............................................................................................................................. 128
Table 5.2 Effects of broiler breeder dietary FORPLUS™ level and Zn source on
offspring early growth performance through 3 weeks of age .............................. 129
Table 5.3 Effects of broiler breeder dietary FORPLUS™ level and Zn source on
offspring skeletal leg morphology at 3 weeks of age ........................................... 130
Table 5.4 Effects of broiler breeder dietary FORPLUS™ level and Zn source on
offspring bone breaking strength at 3 weeks of age ............................................. 131
Table 5.5 Effects of broiler breeder dietary FORPLUS™ level and Zn source on
offspring tibia ash percentage and mineral content at 3 weeks of age ................. 132
Table 6.1 Diet and nutrient composition of broiler breeder diets fed during post-peak lay
(28-45 wk of lay) .................................................................................................. 143
Table 6.2 Diet and nutrient composition of offspring starter diets ................................. 144
Table 6.3 Effect of broiler breeder dietary FORPLUS™ level and Zn source at 30-31
weeks of lay on offspring hatch weight ................................................................ 145
Table 6.4 Effects of broiler breeder diet and offspring dietary Zn source on offspring
growth performance through 3 weeks of age ....................................................... 146

xii
Table 6.5 Effects of broiler breeder diet and offspring dietary Zn source on offspring
bone breaking strength at 3 weeks of age ............................................................. 147
Table 6.6 Effects of broiler breeder diet and offspring dietary Zn source on offspring tibia
morphology at 3 weeks of age .............................................................................. 148
Table 6.7 Effects of broiler breeder diet and offspring dietary Zn source on offspring tibia
ash percentage and mineral content at 3 weeks of age ......................................... 149
Table 7.1 Diet and nutrient composition of broiler breeder diets fed during post-peak lay
(28-45 wk of lay) .................................................................................................. 160
Table 7.2 Diet and nutrient composition of broiler breeder offspring diets ................... 161
Table 7.3 Effect of broiler breeder dietary FORPLUS™ level and Zn source at 41-43
weeks of lay on offspring hatch weight ................................................................ 162
Table 7.4 Effects of broiler breeder diet and offspring dietary FORPLUS™ level on
offspring growth performance through 3 weeks of age ....................................... 163
Table 7.5 Effects of broiler breeder diet and offspring dietary FORPLUS™ level on
offspring bone breaking strength at 3 weeks of age ............................................. 164
Table 7.6 Effects of broiler breeder diet and offspring dietary FORPLUS™ level on
offspring tibia morphology at 3 weeks of age ...................................................... 165
Table 7.7 Effects of broiler breeder diet and offspring dietary FORPLUS™ level on
offspring tibia ash percentage and mineral content at 3 weeks of age ................. 166

xiii
LIST OF FIGURES
Figure 1.1 Structure of long bones ...................................................................................... 6
Figure 1.2 Epiphyseal growth plate zones of one day old broiler chick ............................. 9
Figure 1.3 Vitamin D3 metabolism and regulation of calcium and phosphorus
homeostasis and bone remodeling ........................................................................ 25
Figure 1.4 Vertical Integration of Poultry Firm ................................................................ 42
Figure 2.1 Main effect of dietary FORPLUS™ level on broiler breeder pullet body
weight .................................................................................................................... 60
Figure 2.2 Main effect of supplemental Zn source on broiler breeder pullet BW ............ 61
Figure 3.1 Main effect of dietary Zn source on hen day production ................................ 91

xiv
LIST OF ABBREVIATIONS
α alpha
°C degrees Celsius
AA amino acid(s)
ALP alkaline phosphatase
avail.P available phosphorus
BALP bone-specific alkaline phosphatase
BCO Bacterial Chondronecrosis with Osteomyelitis
BW body weight(s)
BWG body weight gain
Ca calcium
CFU colony-forming unit
Cl chloride
cm centimeter (s)
CP crude protein
Cu copper
cu. cubic
COX cyclooxygenase
d day(s)
DHA docosahexaenoic acid
DON Deoxynivalenol
DPA docosapentaenoic acid
EPA eicosapentaenoic acid
EDTA ethylenediaminetetraacetic acid
EFSA European Food Safety Authority
ELISA enzyme-linked immunosorbent assay
F fluoride
FAO Food and Agricultural Organization of the United Nations
FC feed conversion
Fe iron

xv
FHN Femur Head Necrosis
g gram(s)
g/b grams/bird
h hour(s)
HDP hen day production
IGF insulin-like growth factor
IL interleukin
K potassium
kg kilogram(s)
mg milligram(s)
Mg magnesium
min minute(s)
µm micrometer(s) or micron(s)
mm millimeter(s)
ng nanogram(s)
Mn manganese
MUFA monounsaturated fatty acids
n-3 omega-3
n-6 omega-6
n-9 omega-9
Na sodium
OECD Organisation for Economic Co-operation and Development
P phosphorus
PGE2 prostaglandin E2
PTH parathyroid hormone
PUFA polyunsaturated fatty acid(s)
rcf relative centrifugal force, g-force
SFA saturated fatty acids
Se selenium
sq. square
TD Tibia Dyschondroplasia

xvi
thiram Tetramethyl thiuram disulfide
TMP Tetramethylpyrazine
TNFα Tumor necrosis factor-α
USDA United States Department of Agriculture
v/v volume/volume
VEGF vascular endothelial growth factor
VLDL very low density lipid proteins
w/w weight/weight
wk week(s)
WNT4 wingless type member 4
VVD Valgus Varus Deformation
Zn zinc
ZnO zinc oxide

xvii
OVERVIEW OF RESEARCH
1
CHAPTER 1. LITERATURE REVIEW
1.1 Introduction: Leg problems in the broiler industry
Leg weakness and lameness as a result of skeletal leg disorders and deformities are
issues that cause concern for animal welfare and negatively affect the poultry industry.
According to the European Food Safety Authority (EFSA) (2010), leg weakness is ‘a
condition where the legs (including joints, bones, muscles, tendons etc.) are affected and
may predispose to lameness’, whereas lameness is defined as ‘an abnormal gait [that] may
or may not involve pain’. Previous reviewers of leg weakness and lameness in broiler
chickens (Butterworth, 1999; Bradshaw et al., 2002) have also distinguished that leg
weakness is a broad term that describes impaired walking ability and lameness is a true
disability or defect in a limb. Both conditions can be caused by an infectious origin or a
non-infectious origin such as developmental and degenerative disorders. Non-infectious
developmental and degenerative disorders result from a variety of causes, but the most
common causes are genetic selection, metabolic disorders with a nutritional basis, living
environment, exercise, and toxins (Cook, 2000; Bradshaw et al., 2002). Examples of
common skeletal leg disorders and deformities in broilers include, but are not limited to,
bacterial chondronecrosis with osteomyelitis (BCO), tibia dyschondroplasia (TD), valgus
varus deformation (VVD), twisted leg, rickets, and chondrodystrophy.
Skeletal leg disorders and deformities pose a welfare concern because they may
cause pain and impair a bird’s ability to walk, thereby disrupting normal eating and
drinking habits and behaviors (Kestin et al., 1992; Bradshaw et al., 2002; Dinev, 2009;
Nääs et al., 2009). Broilers that are lame may have their well-being further compromised
by developing contact dermatitis, e.g. hock burn, from prolonged exposure to poor quality
litter (Kestin et al., 1992; Bassler et al., 2013; Gocsik et al., 2017; Granquist et al., 2019).
Gait scoring is a method commonly used to measure broiler welfare, evaluate the walking
capacity of broilers, and measure lameness (FAO, 2014). Modeled after a gait scoring
method for turkeys and developed by Kestin and colleagues (1992), the Bristol Gait
Scoring System is a six-point, subjective scale for measuring lameness in broilers (Table
1.1). Using Kestin’s six-point scale of 0 to 5 (normal to immobile), broilers with gait scores
≥ 3 are generally classified as lame with scores of 3 indicating moderate lameness and

2
scores of 4-5 indicating severe lameness. The European Food Safety Authority Panel on
Animal Health and Welfare and the Royal Society for the Prevention of Cruelty for
Animals recognizes broilers with a gait score of 4 or 5 are more likely to experience pain
and should be humanely euthanized (EFSA Panel on Animal Health Welfare, 2010; FAO,
2014). Although the Bristol Gait Scoring System can be used to classify the severity of
lameness in broilers, it cannot be used to identify the cause of the lameness.
Table 1.1 The Bristol Gait Scoring System (Kestin et al., 1992)
Gait score 0 The bird walked normally without detectable abnormality; it was
dexterous and agile.
Gait score 1 The bird had a slightly defective (uneven) gait that may preclude its
use for breeding; it may take unduly large strides.
Gait score 2 The bird had a definitive, defective gait, but was still able to move
and compete for resources; it may be lame in one leg that results in a
rolling gait.
Maneuverability, acceleration, speed not seriously compromised
Gait score 3 The bird had an obvious gait defect that affected its ability to move
freely; it may limp, walk with a jerk or unsteady strut, have a severe
splaying of one leg.
The bird prefers to squat when not coerced to move.
Maneuverability, acceleration, speed affected
Gait score 4 The bird had a severe gait defect; it can walk with difficulty only
when strongly motivated.
The bird prefers to squat given the opportunity.
Maneuverability, acceleration, speed severely affected
Gait score 5 The bird was incapable of sustained walking; may be able to stand,
but locomotion was only achieved by crawling on shanks or
assistance of wings.
Leg weakness and lameness has a negative economic impact on the broiler industry.
Based on a brief literature review of incidence of lameness in European commercial broiler
flocks during the past decade, it is estimated that lameness affects an average of 21.4% of
broiler flocks and approximately 3.0% of broilers may need to be culled due to severe
lameness (Table 1.2). Consequences of moderate to severe lameness in broilers are lower
growth rates, culling, processing downgrades, and ultimately profit losses (Bradshaw et al.,
2002; Knowles et al., 2008; Dinev, 2009; Gocsik et al., 2017; Wijesurendra et al., 2017).

3
In the United States there is a lack of recent, comprehensive studies on the incidence of
lameness in broilers, although it has been claimed that up to 6% of broilers have obvious
skeletal abnormalities or leg problems and 2% of broiler flocks suffer losses due to
lameness (Dunkley, 2007; Mitchell, 2014). Discrete binary analysis of leg problems in
U.S. commercial broiler flocks revealed roughly 33-50% of all broilers suffer some sort of
leg problem whether subclinical or severe (Rekaya et al., 2013; González-Cerón et al.,
2015). Over two decades ago, the estimated annual loss to the U.S. broiler industry due to
skeletal problems was $80-120 million (Sullivan, 1994; Cook, 2000; Bradshaw et al.,
2002). However, the extent of the present worldwide economic impact is difficult to
estimate due the sparsity of recent comprehensive studies on incidence of lameness in
broilers and wide variation of leg problems reported by different sources (Knowles et al.,
2008; Kapell et al., 2012; Bassler et al., 2013; Marchewka et al., 2013; Rekaya et al., 2013;
Mitchell, 2014; González-Cerón et al., 2015; Gocsik et al., 2017). Nonetheless, reducing
skeletal leg problems in broilers has been noted as a high priority by the U.S. Poultry &
Egg Association (2018), the European Food Safety Authority, and the International
Finance Corporation (FAO, 2014).
Poultry meat is relatively inexpensive, highly produced, and the most consumed
animal protein worldwide (OECD/FAO, 2019). Over the years, the global broiler industry
has expanded in production and vertical integration in response to consumer demand.
Broiler production has also become more efficient due to genetic selection for improved
growth rate, feed conversion (FC), meat yields and feed formulation (Havenstein et al.,
2003; Zuidhof et al., 2014). Statistics on U.S. broiler performance from the National
Chicken Council (2019a) indicate that market weight of broilers continues to increase over
time, which supports a previous report highlighting a shift towards the production of
heavier broilers (USDA, 2012).

4
Table 1.2 Incidence of lameness in European commercial broiler flocks
Evaluation
period Location
No. of
flocks
evaluated
Head/flock
No. of
birds
evaluated
1Incidence of
lameness, %
2Incidence of
severe
lameness, %
BW at
evaluation, kg
Age at
evaluation,
days
Reference
2007 – 2009 France,
United
Kingdom,
Netherlands,
Italy
89 20,100 22,250
(250/flock)
15.6 Not reported 1.93 39 Bassler et
al., 2013
April – May,
2012
Northern
Spain
6 13,220 –
27,540
150
(25/flock)
24.2 4.22 1.85 (estimated) 31-35 Marchewka
et al., 2013
18 months Norway 59 16,566 5,900
(100/flock)
24.9 2.15 1.25
(carcass weight)
29 Kittlesen et
al., 2017
January
2014 –
October
2015
2 northern, 2
southern
European
countries
(undisclosed)
18 Not
reported
Not
reported
23.3 Not reported Not reported 21, 28, 35 Tullo et al.,
2017
January –
March, 2015
Norway 50 17,391 7,500
(150/flock)
19.0 3.00 1.86 29 Granquist
et al., 2019
1Incidence of lameness was determined using the Bristol Gait Scoring System (Kestin et al., 1992) with lameness indicated by gait score ≥ 3, except for
results referenced by Marchewka et al., (2013) where lameness was indicated by gait score ≥ 2. 2Incidence of severe lameness was determined using the Bristol Gait Scoring System (Kestin et al., 1992) with severe lameness indicated by gait scores of 4
and 5, except for results referenced by Marchewka et al., (2013) where severe lameness was indicated by immobility.

5
Some researchers have indicated that broiler skeletal leg disorders are a
consequence of genetic selection towards rapid growth and greater meat yields (Havenstein
et al., 1994; Lilburn, 1994; Rath et al., 2000; Kestin et al., 2001; Zuidhof et al., 2014). One
explanation of the impact of genetic selection on skeletal disorders is that the leg bones do
not develop at the same pace as the broiler accrues body weight (BW) and cannot support
the weight the broiler has been bred to gain (Kestin et al., 2001). Research by Paxton et
al. (2014) determined that in broilers the tibia grows isometrically with body mass while
the femur has slightly negative allometric growth with regard to body mass. They also
observed a shift of whole body center of mass from a caudodorsal position to a craniodorsal
position, which is a direct reflection of pectoral muscle mass accumulation. Hindlimb
development, especially in the thigh and foot, appeared to accommodate for this shift in
mass. Other research has demonstrated that although modern broiler strains have improved
BW, FC, and breast yields they have significantly lower leg yields compared to broiler
strains that remained unselected for such attributes (Zuidhof et al., 2014). In fact, leg
problems are more commonly observed in modern, fast-growing broiler strains compared
to slower-growing broiler strains of the past (Havenstein et al., 1994; Kestin et al., 2001;
Waldenstedt, 2006; Shim et al., 2012).
1.2 Skeletal leg development in broilers
The skeleton provides structural support for the body, locomotion, protection of
organs, a source of mineral and triglyceride storage, and is the site of hematopoiesis
(Tortora and Petti, 2002). In avian species bones can be classified as pneumatic or
medullary. Pneumatic bone refers to bone that has reduced amount of bone marrow and
are connected to the respiratory system. Pneumatic bone is lighter and aids in flight. This
includes the bones of the pelvic girdle, the keel, some bones of the wing, and vertebrae.
Medullary bones have more bone marrow and have larger reserves of nutrients. These
bones include the ribs, ulna, scapula, as well as bones in the legs and feet (Jacob and
Pescatore, 2013).
The femur and tibia are medullary bones found in the leg and considered part of the
appendicular skeleton. They are also considered as long bones because they are longer

6
than they are wide. They are hard and dense and have common structural parts (Figure
1.1) (Tortora and Petti, 2002). The epiphyses are the widened ends of the bone. The
diaphysis is the shaft of the bone. The metaphysis is located between the epiphysis and
diaphysis and it contains the epiphyseal growth plate. The medullary cavity located in the
diaphysis is where bone marrow exists. The epiphysis and metaphysis contains more
trabecular bone which is more porous and has higher resistance to strain than cortical bone
found in the diaphysis (Howlett, 1980; Xu et al., 1995; Villemure and Stokes, 2009; Hart
et al., 2017).
Figure 1.1 Structure of long bones
Copyright © Marquisha A. Paul 2019
During broiler chick embryonic development, osteogenesis for the femur and tibia
begins in the egg around embryonic day 5 (Bellairs and Osmond, 2005). These bones form
through a process called endochondral ossification. Endochondral ossification is the

7
replacement of cartilage by bone. All connective tissue, including cartilage, comes from
embryonic mesenchyme. During embryonic growth, mesenchymal cells come together
and then differentiate into cartilage cells called chondroblasts. The chondroblasts produce
a collagen matrix and form a hyaline cartilage model of bone that will be formed. Once
embedded deeply into the cartilage matrix the chondroblasts are referred to as chondrocytes
(Tortora and Petti, 2002).
Perichondrium, a membrane, forms around the around the cartilage model where it
is not already covered by articular cartilage. The hyaline cartilage model grows through
interstitial and appositional growth. In interstitial growth the cartilage model grows in
length through chondrocyte proliferation. In appositional growth the cartilage model
grows in width through chondroblast deposition of cartilage matrix. Chondrocytes then
differentiate into hypertrophic cells and calcification of the cartilage matrix begins (Tortora
and Petti, 2002).
A primary center of ossification forms through a series of events occurring in the
hyaline cartilage model. Vascularization of the perichondrium at the midregion of the
cartilage model induces the transition of the perichondrium to periosteum, dense irregular
connective tissue. During vascularization of the perichondrium, the osteogenic cells
produced there differentiate into osteoblasts. Osteoblasts are the cells that form bone
through bone matrix synthesis and secretion and by inducing calcification. They create a
subperiosteal bone collar. The periosteum prevents nutrients from reaching the
chondrocytes at the midregion of the hyaline cartilage causing them to die and degenerate
(Gartner and Hiatt, 2001; Tortora and Petti, 2002).
Osteoclasts are large cells derived from white blood cells that release enzymes
and acids capable of digesting the protein and mineral component of bone matrix.
Osteoclasts breakdown the subperiosteal collar and allow capillaries, other osteocytes
osteoblasts, osteogenic cells, and red bone marrow cells to infiltrate the hyaline cartilage.
The collection of capillaries and associated cells are known as the periosteal bud. The
periosteal bud begins infiltrating openings left by degenerated chondrocytes in the hyaline
cartilage and becomes the site of primary ossification. Osteoblasts at the primary
ossification center secrete bone matrix over the calcified cartilage to form spongy bone
trabecula that grows towards the epiphysis. As the bone collar and trabecula grow,

8
osteoclasts break down trabecula to form the bone marrow cavity. The cavity then fills
with red bone marrow (Gartner and Hiatt, 2001; Tortora and Petti, 2002).
A secondary ossification center develops when capillaries invade the epiphysis of
the bone. Osteoblasts form spongy bone trabecula at the epiphysis but there is no formation
of a bone collar or bone marrow cavity at this site. Hyaline cartilage covering the epiphysis
becomes articular cartilage and other remaining hyaline cartilage between the epiphysis
and diaphysis forms the epiphyseal growth plate (Gartner and Hiatt, 2001; Tortora and
Petti, 2002).
The epiphyseal growth plates drive long bone elongation during embryonic and
post-hatch growth. In birds, the proximal end of the leg bones elongates faster and have
thicker growth plates than the distal end. The avian growth plate is also known to have
higher cell turnover and is thicker than the mammalian growth plate (Pines and Hurwitz,
1991; Wideman and Prisby, 2013). The rate of long bone elongation depends on the rate
of chondrocyte proliferation, rate of hypertrophy, and rate matrix synthesis and degradation
in the epiphyseal growth plate (Pines and Hurwitz, 1991; Villemure and Stokes, 2009).
Chondrocytes also synthesize the collagen and proteoglycan matrix of cartilage which
provides elasticity and mechanical loading support for bone tissue (Viguet-Carrin et al.,
2006).
The epiphyseal growth plate can be organized into zones depending on chondrocyte
morphology and activity (Figure 1.2). At the top of the epiphyseal growth plate is a layer
of small, quiescent progenitor chondrocytes that form the resting zone. When stimulated
they differentiate into highly proliferating, flattened stacks of chondrocytes and form the
proliferative zone. The proliferative chondrocytes differentiate into larger, hypertrophic
cells which secrete more collagen and extracellular matrix products than their progenitors.
These cells make up the hypertrophic zone. At the end of the hypertrophic zone the
chondrocytes undergo apoptosis and become calcified (Pines and Hurwitz, 1991;
Villemure and Stokes, 2009). The calcified cartilage is removed by osteoclasts and
replaced with bone matrix by osteoblasts as part of endochondral ossification (Tortora and
Petti, 2002).

9
Figure 1.2 Epiphyseal growth plate zones of one day old broiler chick
Copyright © Marquisha A. Paul 2019
The bone grows in width through appositional growth. In this process osteoblasts
form new bone matrix along the periosteum of the diaphysis. The osteoblasts form a ridge
around a periosteal capillary and eventually form a layer of bone tissue around the
capillary. This enclosed capillary has an inner membrane lining called endosteum. A thin
concentric layer, or lamellae, of bone tissue is added by osteoblasts between the endosteum
and capillary forming an osteon. Bone width increases as osteoblasts create new osteons.
The osteoblasts differentiate into osteocytes, which are the mature bone cells that become
lodged in the bone matrix and no long secrete bone matrix molecules. Osteoblasts that
mature and become lodged in bone matrix become osteocytes (Tortora and Petti, 2002).

10
Bone is continually remodeled during growth and after. Bone remodeling involves
the replacement of old bone tissue with new bone tissue in response to mechanical stress,
injury, cell death, and need for nutrient reserves. Osteoclasts are the cells that drive bone
resorption through the breakdown of bone matrix and release of minerals, while the
osteoblasts form new bone matrix and deposit minerals (Tortora and Petti, 2002). Nutrition
and hormone signaling play large roles in bone growth and bone remodeling. Insulin,
growth hormone, and estrogen are three major systemic hormones that regulate bone
formation, while Vitamin D3, parathyroid hormone (PTH), thyroid hormone, and
glucocorticoids regulate bone resorption (Pines and Hurwitz, 1991; Watkins et al., 2001a).
1.3 Broiler skeletal leg disorders and deformities
Many of the skeletal leg disorders and deformities that occur in broilers originate
in the growth plates of the bones. The disorders or deformities are commonly observed at
hatch and during the growing and finisher phase. However, most skeletal leg disorders and
deformities most likely develop during early life (Thorp, 1994; Bradshaw et al., 2002;
Angel, 2007; Yalcin et al., 2007; Kittelsen et al., 2015; Wijesurendra et al., 2017).
1.3.1 Bacterial chondronecrosis with osteomyelitis
Research indicates that Bacterial chondronecrosis with osteomyelitis (BCO) is the
most common cause of lameness and leg pathologies in broilers (Butterworth, 1999;
Walker, 2001; Bradshaw et al., 2002; Dinev, 2009; Wideman and Pevzner, 2012; Wideman
and Prisby, 2013; Kittelsen et al., 2015; Wijesurendra et al., 2017). Molecular surveys of
infectious BCO indicates it is mainly caused by Staphylococcus agnetis (Al-Rubaye et al.,
2015; Jiang et al., 2015) and can spread horizontally (Al-Rubaye et al., 2016). Other
research has revealed BCO can also be caused by Enterococcus cecorum (Stalker et al.,
2010) and Escherichia coli (Bradshaw et al., 2002; Dinev, 2009; Wijesurendra et al., 2017).
BCO is sometimes referred to as Femoral Head Necrosis (FHN) due to gross lesions
detectable on the proximal femur caused by localized bacterial chondronecrosis in the
growth plate (Butterworth, 1999; Bradshaw et al., 2002). The lesions can also occur on

11
the proximal tibia making FHN an inappropriate term (Butterworth, 1999). Other clinical
signs of BCO are bacterial infection of the metaphysis (osteomyelitis), detached epiphyses,
detached articular cartilage, fracture in the femoral neck, or femur head degeneration
(Thorp, 1994; Bradshaw et al., 2002; Wideman, 2016). BCO has also been shown to be
exasperated by mechanical stress (Wideman, 2016). FHN can also have a non-infectious
etiology due to poor bone mineralization (Cook, 2000), although most cases are due to
bacterial infection (Butterworth, 1999). Clinical signs of non-infectious FHN are
lameness, poor calcification of the proximal femur or a completely eroded femur head
(Cook, 2000). FHN can also be preceded by osteochondrosis, a degeneration of the growth
plate and epiphysis (Bradshaw et al., 2002; Wideman and Prisby, 2013). Osteochondrosis
can also occur in response to trauma to the growth plate. In osteochondrosis localized
thickening of the growth plate with pre-hypertrophic chondrocytes or clefts in the growth
plate are observed. However, most cases of osteochondrosis are subclinical.
1.3.2 Tibia dyschondroplasia
In broilers, Tibia dyschondroplasia (TD) is recognized as a developmental disorder
or deformity. It can be caused by a variety of reasons including improper nutrition (Angel,
2007; Leach and Monsonego-Ornan, 2007), exposure to certain mycotoxins or pesticides
(Butterworth, 1999; Leach and Monsonego-Ornan, 2007; Rath et al., 2007), genetics
(Cook, 2000; Bradshaw et al., 2002), or biomechanical stress (Thorp, 1994). This
pathology is described by an accumulation of avascular cartilage in the growth plate (Leach
and Monsonego-Ornan, 2007) that takes on the appearance of a white plug. This disorder
commonly occurs in the proximal tibia due to failure of pre-hypertrophic chondrocytes in
the growth plate to differentiate and undergo normal hypertrophy, insufficient vascular
development of the growth plate, or damage to the growth plate due to biomechanical
forces (Thorp, 1994; Bradshaw et al., 2002; Huang et al., 2018). As a result, the pre-
hypertrophic chondrocytes become apoptotic or even necrotic in severe cases. Other signs
of TD in broilers are fractures in the growth plate, poorly mineralized growth plate, an
abnormal tibia plateau angle, and angular deformities of the bone (Bradshaw et al., 2002).
Depending on the severity of TD in broilers, they may experience leg weakness or become
lame.

12
1.3.3 Valgus varus deformation and twisted leg
Common long bone angular deformities and distortions in broilers leg bones are
Valgus varus deformation (VVD) and twisted leg, respectively (Cook, 2000; Angel, 2007).
Genetics, exercise, growth rate, and nutrition have been implicated as factors that
contribute to VVD and twisted leg (Butterworth, 1999), although these deformations are
still observed in broiler flocks provided proper nutrition (Cook, 2000; Angel, 2007).
Ossification of the bone may appear normal despite distortion in bone shape or structure
(Bradshaw et al., 2002).
As reviewed by Bradshaw et al. (2002), VVD is commonly observed in the distal
tibiotarsus, but can also occur in the proximal tarsometatarsus. Angular deformities have
also been observed in the femur (Thorp, 1994). In VVD the long bones in the legs may
deviate laterally or medially at an abnormal angle of 10-20 degrees or greater (Bradshaw
et al., 2002; Rekaya et al., 2013; González-Cerón et al., 2015). Other signs of VVD include
bone fracture, separation of condyle from the bone shaft, displaced tendons, and dislocated
intertarsal joint (Bradshaw et al., 2002). This angulation may be caused by pressure on the
growth plate that interferes with metaphyseal blood supply to the growth plate and
chondrocyte maturation or disproportionate hypertrophy of chondrocytes on one side of
the growth plate in response to biomechanical forces. VVD may also be due to some defect
in appositional bone modelling (Thorp, 1994; Bradshaw et al., 2002). Other research
indicates VVD may be genetically associated with TD (Kapell et al., 2012; González-
Cerón et al., 2015), and has been speculated to be a consequence of TD in some cases
(Bradshaw et al., 2002).
If the distal tibiotarsus has an abnormal lateral deviation or the tarsometatarsus has
an abnormal medial deviation it is referred to as a valgus deformation. This type of angular
deformation results in a “knock-kneed” appearance. If the distal tibiotarsus has an
abnormal medial deviation or the proximal tarsometatarsus has a lateral deviation it is
referred to as a varus deformation that may have a “bow-legged” appearance (Randall and
Mills, 1981; Cook, 2000; Bradshaw et al., 2002; Rekaya et al., 2013). The right leg has
been cited as more susceptible to VVD with higher incidences of valgus deformities
observed than varus deformities (Thorp, 1994; Cook, 2000; Bradshaw et al., 2002;

13
González-Cerón et al., 2015). It has been speculated that incidence of VVD in the right
leg is linked to limb dominance but that relationship has not been established (Shim et al.,
2012).
Twisted leg is a developmental issue also referred to as rotated tibia. This deformity
is characterized by abnormal rotation of the bone shaft. This may be evident as a 90 degree
external rotation of the bone shaft or a 180 degree rotation in which the foot faces
backwards (Bradshaw et al., 2002). This long bone distortion may have a genetic or
metabolic origin. Unlike VVD, there is no apparent angulation of the bone, but there is
deformation of the growth plate which may be worsened by biomechanical forces
(Bradshaw et al., 2002). Both VVD and twisted leg can affect broiler gait and lead to
lameness in severe cases (Cook, 2000; Bradshaw et al., 2002; Angel, 2007).
1.3.4 Rickets
Rickets is largely a metabolic disorder that is caused when the organic bone matrix
fails to mineralize properly although a genetic factor and feed mycotoxin contamination
have also been cited (Thorp, 1994; Bradshaw et al., 2002). Deficiencies in Ca, P, or vitamin
D3 or imbalances of Ca and P are major causes of rickets (Cook, 2000; Angel, 2007).
Broilers with rickets have weak bones due to poor mineralization. Other signs of rickets
include thick and poorly mineralized growth plates. Rickets can be identified as either
hypercalcemic or hypophosphataemic based on pathology. In hypercalcemic rickets the
growth plate has an accumulation of proliferating chondrocytes, whereas in
hypophosphataemic rickets the growth plate has an accumulation of hypertrophic
chondrocytes (Thorp, 1994; Bradshaw et al., 2002). Unlike TD, the growth plate in
hypophosphataemic rickets still has normal vasculature. Furthermore, rickets and TD may
be observed in the same broiler or even be the underlying cause of TD in some cases
(Bradshaw et al., 2002). This disorder contributes to leg weakness in broilers and causes
lameness in severe cases.

14
1.3.5 Chondrodystrophy
Chondrodystrophy is caused by a growth plate disorder in the bone that results in
short, thickened, mis-shaped bones (Thorp, 1994; Bradshaw et al., 2002). Bones affected
by chondrodystrophy may still exhibit normal mineralization and appositional growth. In
chondrodystrophy growth plate chondrocyte proliferation is impaired, specifically in the
proliferative zone and in the hypertrophic zone. This disorder can be caused by nutrient
deficiencies of trace minerals and certain vitamins. Due to the advancement of mineral
and vitamin nutrition in broilers, chondrodystrophy is not regarded as a major problem in
modern broiler production.
1.4 Management strategies to improve broiler leg health
1.4.1 Exercise and enrichment
Various studies have shown that it is possible to mediate skeletal leg problems in
broilers using different strategies. One way to reduce skeletal leg problems is through
exercise. When muscles contract or are exercised they secrete peptides known as myokines
which greatly influence bone metabolism, specifically bone formation, mineralization, and
resorption (Hart et al., 2017). Furthermore, both muscle and bone co-adapt in size, density
and strength in response to external stimuli or stress. It has been recommended that
stimulating broilers to increase activity early in life may improve leg health (Nääs et al.,
2009; Vasdal et al., 2019).
Several studies have been conducted to evaluate the effect of enriched broiler
houses on leg health. Enrichment of broiler houses with perches, platforms, or lasers to
encourage movement did not improve leg bone mineral density (Bailie et al., 2018; Meyer
et al., 2019), bone mineralization (Kaukonen et al., 2017; Meyer et al., 2019), or bone
breaking strength (Meyer et al., 2019). However, perches were found to reduce the
percentage of broilers scored as lame (gait score of 3; 30% to 23%) and reduce the
incidence of tibia dyschondroplasia (2.3% to ~1.2%) in market age broilers (Kaukonen et
al., 2017). Activity levels of broilers were found to decline with age, with as much as a
47% of decline in activity from 2 to 4 weeks (wk) of age regardless of environmental

15
stimulation (Sherlock et al., 2010), which may explain some limitations of broiler house
enrichment on leg health.
1.4.2 Lighting, litter quality, and stocking density
Apart from enrichment of broiler houses, management of the living environment
may also impact skeletal leg problems. This includes the lighting schedule, litter quality,
and stocking density. It is widely recognized that darkness is a natural requirement for
chickens and promotes rest, energy conservation, natural behavior, growth and
development, reduced mortality, and reduces skeletal defects (Cobb-Vantress, 2012;
Aviagen, 2018). Bassler et al. (2013) found that increasing the dark period from 0 to 6.5
hours (h) may be associated with a reduction of lameness (16.9% to 7.4%) in broilers.
These findings compliment commercial broiler management guides which recommend 4
to 6 h of darkness each day and longer periods of darkness for heavier broilers.
Litter type and quality may also play a role in broiler leg health. Wood shavings
and dried hemp waste were found to improve moderate lameness scores as well as foot pad
burn compared to wheat straw (Su et al., 2000). Poor litter quality, such as wet litter or
dirty litter, has been associated with leg problems in broilers. Several studies have shown
that wet litter is associated with lameness (de Jong et al., 2014; Tullo et al., 2017; Granquist
et al., 2019), while it has been hypothesized that dirty litter may expose broilers to bacterial
pathogens known to cause BCO in leg bones (Wideman, 2016). Litter management is
important for leg health, although adding fresh litter to wet litter or turning over the litter
was not shown to be effective in reducing leg problems (Su et al., 2000). This indicates
litter type should be carefully considered before broiler chicks are placed and that once
litter quality deteriorates there may be greater risk for skeletal leg problems.
Another environmental risk factor associated with lameness in broilers is stocking
density. High stocking densities in broiler houses may induce stress in broilers (Estevez,
2007; Ventura et al., 2010; Najafi et al., 2015) that may negatively impact bone metabolism
(Dibner et al., 2007) and leg strength (Buijs et al., 2009). High stocking densities may also
create conditions that lead to poor litter quality due to overloading of the litter with
ammonia and moisture, thus leading to leg problems (Knowles et al., 2008). The
consequence of reducing broiler stocking density is decreased profitability and this strategy

16
is less effective in controlling skeletal leg problems compared to other strategies such as
lighting programs, genetic selection, and changes to broiler diets based on modelling the
relationship between gait scoring and risk factors for leg disorders (Knowles et al., 2008).
1.4.3 Control of toxins
Toxins in broiler feed can be have detrimental effects on the growth plate of broiler
leg bones and result in dyschondroplasia. Mycotoxins, such as fusarochromanone,
produced by Fusarium moniliforme can induce this disorder if consumed by broilers in
sufficient amounts (Butterworth, 1999; Leach and Monsonego-Ornan, 2007). Other
mycotoxins can interfere with nutrient metabolism and growth plate development.
Aflatoxin in broiler diets can cause lameness (Okoye et al., 1988) or rickets (Kierończyk
et al., 2017) in broilers, while deoxynivalenol (DON) and ochratoxin can have negative
effects on bone mineralization and strength, respectively (Raju and Devegowda, 2000;
Kierończyk et al., 2017; Keci et al., 2019).
Tetramethyl thiuram disulfide (thiram) is a pesticide commonly used to prevent
fungal diseases in crops, e.g. soybean. Contamination of feed ingredients or litter with
thiram can also induce TD in broilers (Rath et al., 2007; Kierończyk et al., 2017; Zhang et
al., 2018a). Other ingredients in carbamate and thiocarbamate pesticides that are known
to cause TD in broilers include ferbam (ferric dimethyldithiocarbamate), ziram (zinc
bis[dimethyldithiocarbamate]), sodium metam (methyldithiocarbamate sodium), and
disulfiram (tetraethyl thiuram sulfate) (Rath et al., 2007). These pesticides have two or
more disulfide groups, which seems to be a common factor in their role of inducing TD.
Therefore, screening of feed ingredients for toxins, use of mycotoxin binders in feed when
appropriate, and cautionary use of pesticides near broiler houses has a role in the prevention
of skeletal leg problems in broilers.
1.4.4 Incubation settings
As noted by Hart et al. (2017), bone size and shape are established during ontogeny.
For broilers this means that bone size and shape are established during incubation. From
conception, a broiler may spend nearly 50% of its life as an embryo in the egg. This fact

17
highlights the relevance of incubation on skeletal development. Temperature, humidity,
gas exchange, and egg turning are settings that can be controlled by commercial broiler
hatcheries during incubation. While temperature and gas exchange settings have been
shown to influence embryonic bone development, incubation temperature has direct effects
on development of TD and prevalence of other leg deformities (Kierończyk et al., 2017).
According to Yalcin et al. (2007), The first 8 days of embryonic development was
most sensitive to temperature regarding development of TD later in life. Embryos exposed
to cool (36.9°C) or hot (39.6°C) temperatures for 6 hours a day during the first 8 days of
incubation went on to have a significantly higher incidence of TD (12.8-14.4% vs. 5.0%)
at 49 d of age compared to embryos incubated at the at a constant, typical temperature of
37.8°C. Other research indicates embryos set in single-stage incubators had a lower
incidence of crooked toes at 56 d of age compared to embryos set in multi-stage incubators
(Oviedo-Rondón et al., 2009), which may be due to differences in temperature control.
Minimizing temperature fluctuations and using recommended incubation temperatures
during incubation may help to limit development of skeletal leg problems in broilers.
1.5 Breeding strategies to improve broiler leg health
As previously mentioned, skeletal leg disorders and deformities in broilers may be
a result of genetic selection towards rapid growth and greater meat yields (Havenstein et
al., 1994; Lilburn, 1994; Rath et al., 2000; Kestin et al., 2001; Zuidhof et al., 2014). In
Bradshaw et al.’s (2002) review of etiology and pathology of leg weakness and broilers, it
was noted that growth rate was correlated with VVD and TD. Yair et al. (2017) noted that
during embryonic skeletal development, offspring from fast growing breeders had inferior
bone mechanical properties, low mineralization rate, smaller bone dimensions relative to
body weight, and may be at higher risk for bone pathologies compared to offspring from
slow growing breeders. Furthermore, males which have a greater growth rate than females
may exhibit more leg problems (Kapell et al., 2012). Although leg problems are heritable
to a certain extent, targeted breeding programs may aid in reducing them.
Several research studies chronicle the effectiveness of broiler breeding on reducing
skeletal leg problems. Kapell et al. (2012) analyzed the effects of genetic selection on the

18
occurrence of VVD, crooked toes, and TD in 3 purebred commercial broiler lines in the
Aviagen United Kingdom breeding program over the course of 25 years. From 1986 to
1996, they found that VVD decreased by 1.4 -1.6% each year and crooked toes decreased
by 1.2-2.3% each year for all purebred commercial broiler lines. Beyond 1996, VVD
continued to decrease at a rate of 0.7-1.2% each year while prevalence of crooked toes
stabilized at low levels for all lines. From 1990 to 2006, TD decreased by 0.6-1.8% each
year for all lines. At the end of the study VVD was found to still occur in 8.6-12.9% of
purebred commercial broilers, while TD occurred in 4.6-8.0% of broilers. The heritability
of leg disorders in this breeding program were found to be low and their genetic correlation
to BW was low to moderate despite improvements in growth rate and FC over the years.
A separate study was conducted to evaluate the heritability of skeletal leg
deformities and disorders in a United States Cobb-Vantress fully pedigreed commercial
broiler line (Rekaya et al., 2013). In 2013, researchers found that incidence of VVD and
twisted leg were 27% and 23% respectively, while TD occurred in 4% of broilers. The
genetic correlation between BW, breast yield, and body conformation with skeletal leg
disorders was found to be negative or low. Gonzales et al. (2015) reported a 30% incidence
of VVD and 2% incidence of TD in an unselected, random mating broiler control
population. Similar to findings reported by Rekaya et al. (2013), the genetic correlation of
growth and skeletal leg problems was low.
In a more recent publication by Siegel et al. (2019), heritability of VVD, twisted
leg, TD, and FHN were tracked in 3 pedigree pure broiler for 11 to 14 years. Researchers
found that heritability of VVD, twisted leg, and TD was low to moderate over time. On
the other hand, FHN was nearly 2 times more heritable than the aforementioned skeletal
leg problems and slightly increased over 14 years of genetic selection. These findings on
heritability of VVD and TD are in agreement with previous reports (Rekaya et al., 2013;
González-Cerón et al., 2015). This study also highlights the lack of selection criteria
against FHN, a skeletal leg disorder that may have an infectious origin and is typically only
identified post-mortem. Overall, genetic selection against skeletal leg problems in broilers
is a slow process and some researchers have indicated that changes to management of the
broiler’s nutrition and living environment may be more effective (Angel, 2007; Knowles
et al., 2008; Rekaya et al., 2013; Mitchell, 2014; González-Cerón et al., 2015).

19
1.6 Nutritional strategies to improve broiler leg health
Broiler nutrition also impacts broiler leg health. Nutrients found to impact skeletal
leg problems in broilers include protein, amino acids, lipids, vitamins and minerals,
especially cholecalciferol (vitamin D), calcium (Ca) and phosphorus (P). Feed additives
such as phytase, organic acids, probiotics, prebiotics, flavors, and flavonoids also have a
role in reducing skeletal leg problems in broilers.
1.6.1 Crude protein and amino acids
Crude protein (CP) is normally formulated into broiler diets to support normal
growth and development. The major protein in bone is collagen, with other components
of the organic bone matrix also made of protein (Palacios, 2006; Kierończyk et al., 2017).
Broilers need approximately 16-23% CP in their diet depending on their growth phase; 20-
22% during the starter phase, 18-20% during the grower phase; 16-18% during the finisher
phase (Leeson and Summers, 2001). Hulan et al. (1980) found that broilers fed diets with
high CP content had a greater incidence of leg abnormalities than broilers fed diets with
low CP content. Broilers fed a higher level of dietary CP also had greater mortality due to
leg problems. High dietary protein may also interfere with retinol (vitamin A) metabolism,
pyridoxine (vitamin B6) metabolism, folic acid metabolism, indirectly influence zinc (Zn)
homeostasis subsequently affecting bone health (Oviedo-Rondón et al., 2006; Waldenstedt,
2006). The high protein diets in this study were formulated with greater percentages of
soybean meal and fishmeal, which are sources of the sulfur amino acids cystine and
cysteine.
Previous research indicates excessive supplementation of the sulfur containing
amino acids (AA) cysteine, cystine, and homocysteine in broiler diets increases the
incidence and severity of TD in broilers at 3 weeks of age (Orth et al., 1992). Dietary
excess of these amino acids may disrupt metabolism of folic acid needed for normal bone
formation as well as vitamin B6, and vitamin A metabolism (Leeson and Summers, 2005;
Oviedo-Rondón et al., 2006). The authors of this research previously excluded methionine

20
as an inducer of TD in a turkey trial. Homocysteine is a precursor to cysteine and was
more effective in increasing the incidence and severity of TD than cysteine. Feathermeal
is a source of cysteine but is not formulated into broiler diets in sufficient amounts to induce
TD (Orth et al., 1992; Leeson and Summers, 2005). Cystine may be added to broiler diets,
but recommended levels are well below amounts reported to induce TD (NRC, 1994).
Additionally, homocysteine is not commonly added to broiler diets (Leeson and Summers,
2005), therefore the risk of inducing TD with these amino acids under commercial settings
is extremely low when using appropriate levels of CP.
1.6.2 Lipids and fatty acids
Fats and oils, collectively known as lipids, are added to broiler diets to supply
energy. Some fats and oils used in broiler diets are tallow, poultry fat, fish oil, soybean
oil, corn oil, coconut oil, palm oil, and restaurant grease (Leeson and Summers, 2001;
Leeson and Summers, 2005). These lipids vary in composition of fatty acids as shown in
Table 1.3 (Korver et al., 1997; Crespo and Esteve-Garcia, 2001; Farhoomand and
Checaniazer, 2009). Fatty acids are commonly found in triglycerides, phospholipids,
cholesterol, and cholesterol esters of lipids (Brody, 1994). Fatty acids are digested and
absorbed based the length of the fatty acid, the number of double bonds it has, form (part
of a triglyceride, free from, with or without ester linkages), its position on a triglyceride,
ratio of unsaturated to saturated fatty acids, amount and type of fatty acids, intestinal
microflora, and age of the broiler (Leeson and Summers, 2001).

21
Table 1.3 Fatty acid profile of dietary fats and oils1
Fatty acid Shorthand
notation2
Tallow,
%
Poultry Fat,
%
Corn oil,
%
Fish oil,
%
Myristic acid C14:0 2.27 4.43 0.04 7.33
Palmitic acid C16:0 20.7 25.1 11.3 19.61
Stearic acid C18:0 14.1 8.36 2.05 5.36
Palmitoleic acid C16:1n-7 2.30 5.31 0.09 7.76
Oleic acid C18:1n-9 31.4 26.84 23.91 18.95
cis-Vaccenic acid C18:1n-7 1.64 8.01 0.85 0.17
Linoleic acid C18:2n-6 9.13 17.7 59.0 3.41
Arachidonic acid C20:4n-6 0.26 0.40 ND3 0.79
α-Linolenic acid C18:3n-3 0.71 1.70 1.50 9.93
Eicosapentaenoic acid C20:5n-3 NR4 0.00 ND3 11.5
Docosapentaenoic acid C22:5n-3 NR4 0.00 ND3 2.21
Docosahexaenoic acid C22:6n-3 NR4 0.00 ND3 8.30
Total n-3 fatty acids 3.71 1.70 1.50 29.9
Total n-6 fatty acids 9.59 18.1 59.0 4.2
Ratio of n-6: n-3 2.58 10.6 39.3 0.14
Total MUFA 37.9 40.4 25.1 27.3
Total PUFA 10.3 19.8 60.9 34.1
Total SFA 37.1 37.9 14.0 35.8 1References (Korver et al., 1997; Crespo and Esteve-Garcia, 2001; Farhoomand and
Checaniazer, 2009) 2Number of carbons: number of double bonds and location 3ND: not detected 4NR: not recorded
Saturated fatty acids (SFA) do not have double bonds in their chemical structure,
have a solid consistency at room temperature, and are found in animal fats, palm oil, and
coconut oil. Unsaturated fatty acids have one or more double bonds in their chemical
structure, are liquid at room temperature, and are found in soybean oil and corn oil.
Unsaturated fats can be grouped as monounsaturated or polyunsaturated. Monounsaturated

22
fatty acids (MUFA) have one double bond in the chemical structure whereas
polyunsaturated fatty acids (PUFA) have two or more double bonds.
The PUFA can be further categorized as omega-3 (n-3), omega-6 (n-6), and omega-
9 (n-9) which corresponds to the double bond location on the respective third, sixth, and
ninth carbon from the methyl end of the fatty acid (Brody, 1994). The only fatty acid
recognized as essential for broilers is linoleic acid (LA), an 18 carbon, n-6 PUFA, which
has a minimum requirement of 1.0% in broiler diets (NRC, 1994; Leeson and Summers,
2001). It is the precursor for other long-chain, metabolically important n-6 PUFA such as
arachidonic acid. Similarly, α-linolenic acid (ALA) is the 18 carbon precursor for long
chain n-3 fatty acids such as eicosapentaenoic acid (EPA) and docosahexaenoic acid
(DHA) and has been indicated as an important nutritional factor of poultry diets in recent
years (Cherian, 2013, 2015; Alagawany et al., 2019; Head et al., 2019).
It is possible for dietary lipids to form soaps with certain minerals during digestion,
making them unavailable for absorption (Leeson and Summers, 2005; Alagawany et al.,
2019). Although, once digested n-6 and n-3 fatty acids have been shown to affect broiler
bone health, largely due to their role in eicosanoid synthesis. Eicosanoids such as
prostaglandins, thromboxanes, leukotrienes, and other functional metabolites derived from
20 carbon, n-3 and n-6 PUFA are involved in regulation of inflammation (Calder, 2001,
2006a, b; Kruger et al., 2010) and bone metabolism (Watkins et al., 1997a; Watkins, 1998;
Watkins et al., 2001d; Fleming, 2008; Kruger et al., 2010). In general, dietary n-6 PUFA
are associated with contributing to prostaglandin E2 (PGE2) synthesis which has a role in
normal bone formation. However, dietary excess of n-6 PUFA are associated with
overproduction of PGE2 which leads to inflammation and bone pathology (Norrdin et al.,
1990; Watkins, 1998). In contrast, n-3 PUFA have been shown to reduce PGE2 (Watkins
et al., 1996a; Watkins et al., 2003; Bautista-Ortega et al., 2009; Cherian et al., 2009), reduce
production of proinflammatory eicosanoids (Hall et al., 2007) and may also have anti-
inflammatory effects (Calder, 2001, 2006a, b; Kohli and Levy, 2009). Broilers fed diets
with supplemental n-3 PUFA had reduced tissue levels of PGE2 (Watkins et al., 1997b).
Reductions of PGE2 and proinflammatory eicosanoids have also been observed in tissues
of broilers whose parents were fed diets high in n-3 PUFA (Hall et al., 2007; Bautista-
Ortega et al., 2009; Cherian et al., 2009). Furthermore, enzymes responsible for

23
desaturation of 18 carbon fatty acids have an affinity for ALA over LA (Kruger et al.,
2010), meaning feed ingredients high in ALA acid promote the production of long chain
n-3 fatty acids rather than n-6 fatty acids. This has been demonstrated in broilers fed diets
supplemented with linseed oil (Poureslami et al., 2010) and flaxseed (Head et al., 2019).
A study conducted feeding broilers a source of saturated fat (hydrogenated soybean
oil) resulted in increased incidence and severity of TD as well as reduced tibia length
(Watkins et al., 1991). The n-6 PUFA tissue concentrations were also reduced, elucidating
the negative effect of excess saturated fatty acids on n-6 PUFA digestion, absorption, and
role in normal bone formation. In another study linseed oil and soybean oil in broiler diets
increased the Ca and P content in the tibia compared to palm oil, with linseed oil having
the greatest effect overall (Abdulla et al., 2017). The effects of different dietary ratios of
n-3 PUFA to n-6 PUFA on tibia characteristics were investigated using varying
formulations of maize oil and salmon oil (Fleming, 2008). Diets that had at higher n-3
PUFA: n-6 PUFA due to salmon oil resulted in improved breaking strength and ash
percentage of tibias in broiler chicks. Apart from broilers, dietary n-3 PUFA have
beneficial effects on bone strength in layers (Tarlton et al., 2013) and bone mineralization
and strength in Japanese quail (Liu et al., 2003). Results from a study where rats were fed
varying ratios of dietary n-3 and n-6 PUFA indicate dietary PUFA can also influence Ca
absorption, excretion, and femur content (Claassen et al., 1995).
1.6.3 Vitamin D, calcium and phosphorus
Other nutrients of major concern for broiler leg health are cholecalciferol (vitamin
D3), Ca and P. These nutrients are essential for broilers and must be supplemented in the
diet in balanced proportions. They are also highly interconnected in bone metabolism.
Vitamin D3 metabolites promote Ca and P homeostasis, intestinal Ca and P absorption,
bone formation, and mineral resorption of bones (Leeson and Summers, 2001; Oviedo-
Rondón et al., 2006). Calcium phosphate is the major matrix component of mineralized
bone, providing both strength and structure. The recommended level of vitamin D3 in
broiler diets is 200 IU/kg of diet (NRC, 1994), although it is often supplemented in excess
in commercial diets in anticipation of a greater requirement under stressful conditions and
loss of activity during storage (Waldenstedt, 2006). Phosphorus in cereal and vegetable

24
proteins are not readily available for digestion compared to P in animal protein because it
is bound by phytic acid and broilers do not produce enough phytase enzyme to free P from
the phytic acid bonds (Leeson and Summers, 2001; Woyengo and Nyachoti, 2011).
Therefore, available phosphorus (avail. P) in feed ingredients must be considered when
balancing Ca and P in broiler diets. The typical dietary ratio of Ca: avail.P in broiler diets
ranges from 2:1 to 2.6:1 (Waldenstedt, 2006; Kierończyk et al., 2017).

25
Figure 1.3 Vitamin D3 metabolism and regulation of calcium and phosphorus homeostasis
and bone remodeling
Adapted from Holick (2007)
Rickets and TD can be caused by deficiencies in vitamin D3, Ca, and P, or by
imbalances of dietary Ca: avail.P (Leeson and Summers, 2001; Waldenstedt, 2006).
Vitamin D deficiency can also cause VVD in broilers (Summers et al., 1984).
Supplementing diets with high concentrations of vitamin D (125-250 IU/kg of diet) when
paired with balanced calcium to phosphorus ratios in the diet drastically reduced the

26
incidence and severity of TD and improved tibia strength of 2 week old broiler chicks
(Whitehead et al., 2004). Other work has shown that imbalanced diets with a low Ca:
avail.P formulation resulted in rickets and TD broilers, but differential supplementation of
vitamin D3 supplementation could prevent both disorders (Rennie et al., 1993).
Many of the cereal grains and vegetable sources used in poultry diet formulations
contain phytic acid, which is a storage form of phosphorus. Phytase is an enzyme that can
cleave phytic acid bonds and release P as well as Ca and some trace minerals (Leeson and
Summers, 2005; Woyengo and Nyachoti, 2011). Once the nutrients are released from the
phytic acid bonds they become available for digestion and absorption. Adding phytase to
poultry diets can improve Ca and P mineral absorption thereby playing a role in broiler leg
health (Havenstein et al., 2003).
1.6.4 Minerals and electrolytes
Other minerals besides Ca and P are required as cofactors for bone cell metabolic
processes, directly involved in bone tissue synthesis, and help regulate Ca homeostasis
(Thorp, 1994; Palacios, 2006). Manganese (Mn) is required for biosynthesis of
mucopolysaccharides of the bone matrix (Palacios, 2006). Zinc (Zn) is required for bone
cell activity, collagen synthesis, bone enzyme activity (Palacios, 2006) and can be become
part of the bone inorganic matrix in place of calcium depending upon metabolic conditions
(Waldenstedt, 2006). Copper (Cu) has a role in bone formation, mineralization and
collagen cross linking in bone tissue (Oviedo-Rondón et al., 2006; Palacios, 2006). Iron
(Fe) is a co-factor for the enzyme that transforms Vitamin D in the kidney and is necessary
for collagen matrix synthesis (Palacios, 2006). Selenium (Se) helps regulate reactive
oxygen species during bone cell proliferation and differentiation (Zeng et al., 2013).
Deficiency of Mn and Zn in broiler diets is known to cause chondrodystrophy
(Thorp, 1994; Bradshaw et al., 2002), while Cu deficiency can result in TD or TD type
lesions (Wu et al., 1993; Orth and Cook, 1994; Bradshaw et al., 2002; Kierończyk et al.,
2017). Adding extra Cu and Zn (200 ppm) to broiler diets can help alleviate the incidence
of TD for broilers exposed to the mycotoxin fusarochromanone (Wu et al., 1993).
Additional, dietary Cu can also help reduce TD in broilers exposed to thiram (Wu et al.,

27
1993). However, dietary Se has not been shown to influence incidence of TD in broilers
(Walser et al., 1988).
Electrolyte imbalance may also increase incidence of TD, particularly in a state of
metabolic acidosis. Metabolic acidosis is when the body has produced too much acid and
creates an acidic environment. It can be induced by a dietary imbalance of cations to anions
ratio or by stress, e.g. heat stress. High amounts of dietary chloride (Cl), and other anions
such as phosphate and sulfate can induce TD in broilers (Orth and Cook, 1994; Thorp,
1994). The electrolyte imbalance can disrupt kidney function, specifically its ability to
metabolize Vitamin D3 into its active form which is responsible for regulation of Ca
absorption and mobilization. However, metabolic acidosis can be ameliorated by
providing cations such as magnesium (Mg), sodium (Na), and potassium (K) to broiler
diets to offset anions consumed or produced during stress (Orth and Cook, 1994; Leeson
and Summers, 2005; Palacios, 2006). Magnesium affects bone quality via hydroxyapatite
crystal size in the bone, affects Ca metabolism, and affects bone cell activity (Palacios,
2006). Similar to Zn, Mg may also be incorporated in the bone formation process in lieu
of Ca depending on metabolic conditions (Waldenstedt, 2006). Fluoride (F) may replace
hydroxyl groups in bone hydroxyapatite crystals, influence bone brittleness, and stimulate
bone cell activity (Oviedo-Rondón et al., 2006; Palacios, 2006). Dietary supplementation
of F increased bone density and breaking strength in chickens (Oviedo-Rondón et al.,
2006).
1.6.5 Vitamins
Dietary vitamins can have a major influence on broiler leg health, particularly
during a state of nutritional deficiency or extreme excess. Vitamin A is required for the
remodeling process of bone formation and resorption (Palacios, 2006; Conaway et al.,
2013). In broilers, vitamin A deficiency is rare since it is normally added in excess to
broiler diets (Waldenstedt, 2006; Li et al., 2008), but can increase the incidence of leg
deformities such as VVD or twisted leg (Summers et al., 1984). Vitamin A overdosing can
cause rickets (Kierończyk et al., 2017) and induce TD (Waldenstedt, 2006; Li et al., 2008)
in broilers, although it is not practical in commercial broiler production.

28
Similar to minerals, various vitamins are co-factors for bone related hormones and
enzymes, as well as stimulators of bone cell activity (Palacios, 2006). Deficiency in certain
vitamins can be devastating to broiler leg health. Riboflavin (vitamin B2) is needed for
oxidation-reduction reactions in all tissues (Leeson and Summers, 2001) and may play a
role in Fe metabolism and absorption (Powers, 2003). However, the influence of vitamin
B2, thiamin (vitamin B1), and niacin (vitamin B3) on bone health may be indirect (Palacios,
2006). Vitamin B2 deficiency induces VVD or twisted leg and greatly increases incidence
of lameness in broilers (Summers et al., 1984). Choline is involved with cell membrane
signaling and homocysteine reduction (Zeisel and Da Costa, 2009). Choline deficiency
results in VVD or twisted leg (Summers et al., 1984), chondrodystrophy (Thorp, 1994),
and TD (Waldenstedt, 2006) in broilers.
Alpha-tocopherol (vitamin E) has been shown to scavenge free radicals produced
by bone cells during bone resorption and influence collagen synthesis in an avian
chondrocyte, cell culture model (Ahmadieh and Arabi, 2011). Other research indicates
supplementation of Vitamin E in broiler diets can alter growth plate morphology and
mineral apposition rate (Xu et al., 1995). Folic acid plays a role in directly regulating
plasma homocysteine levels and perhaps collagen synthesis indirectly (Clarke et al., 2014).
Vitamin E, folic acid, and vitamin B3, deficiencies causes VVD or twisted leg (Summers
et al., 1984) and chondrodystrophy (Thorp, 1994).
Vitamin K is a co-factor for osteocalcin, the most abundant non-collagenous protein
in the bone matrix involved in bone turnover (Palacios, 2006; Fleming, 2008), and low
level supplementation in broiler diets increased bone breaking strength, bone flexibility,
and bone ash percentage (Zhang et al., 2003). Biotin is a coenzyme for carbohydrate, fat
and protein metabolism (Leeson and Summers, 2005) and supplementation in broiler diets
can influence bone mineral content and bone mineral density (Quarantelli et al., 2007).
Pantothenic acid (vitamin B5) is a co-factor for nutrient metabolism (Leeson and Summers,
2001), while vitamin B6 is a co-factor for bone cell enzymes involved in energy metabolism
(Palacios, 2006) and involved in regulation of homocysteine metabolism (Ahmadieh and
Arabi, 2011). It has been shown to Vitamin K, biotin, vitamin B5, and vitamin B6
deficiencies also cause leg bone deformities in broilers (Summers et al., 1984; Thorp,
1994). Cobalamin (vitamin B12) is a cofactor for bone cell enzymatic activity, regulates

29
homocysteine metabolism and is needed for Fe metabolism (Palacios, 2006; Ahmadieh and
Arabi, 2011). Deficiency of vitamin B12 in broiler diets may also have a negative impact
on leg health.
1.6.6 Feed additives
Despite improvements in broiler vitamin and mineral nutrition over the years,
skeletal leg problems remain a persistent problem in the commercial broiler industry. Feed
additives in the form of organic acids, probiotics, prebiotics, flavors and polyphenols
(flavonoids, phenolic acids, etc.) have been shown to be effective in reducing major leg
problems in broilers. Organic acids are effective aids in antimicrobial activity, gut health,
performance and nutrient digestibility. Lactic acid, for example, enhances vitamin D
absorption, which is known to regulate bone metabolism (Leeson and Summers, 2001).
During digestion it may be possible for organic acid anions to form complexes with the
cations of certain minerals such as Ca, P, Mg, and Zn, thereby making the minerals more
favorable for digestion by broilers (Boling et al., 2000; Khan and Iqbal, 2016). In cell
culture, butyrate is a known stimulator of bone cell enzyme activity association with bone
formation (Katono et al., 2008). Propionate and butyrate are also regulators of bone cell
metabolism and bone homeostasis (Lucas et al., 2018). Propionic acid in broiler diets has
been shown to improve tibia morphometric characteristics, mineralization, and strength
(Ziaie et al., 2011). Other research has shown that supplementation of citric acid, fumaric
acid, and Ethylenediaminetetraacetic acid (EDTA) in broiler diets that were deficient in P
had significantly reduced incidence of rickets and improved Ca, and P retention (Liem et
al., 2008).
Probiotics are living microorganisms, typically bacteria or yeast, that are beneficial
to the body by promoting a healthy community of microorganisms and producing
substances to improve bodily function and health. As reviewed by Collins et al. (2017),
probiotics produce enzymes to break down nondigestible polycarbohydrates and release
nutrients in the process. Short chain fatty acids, including some organic acids, are also
produced by probiotics. They enhance intestinal morphology of the gut via greater villus
height and surface area, which are conducive to increased nutrient absorption. Probiotics
30
also play a role in regulating inflammatory cytokines and hormones that influence bone
turnover via bioactive peptides and other secretory products.
Bacterial communities exist in the growth plate of broiler leg bones. A molecular
survey of bacterial communities in broiler leg bones afflicted with BCO revealed a large
association with pathogenic Staphylococcus species, particularly Staphylococcus agnetis,
compared to normal bones (Al-Rubaye et al., 2015; Jiang et al., 2015). Researchers
demonstrated that adding 105 CFU Staphylococcus agnetis/ml drinking water can induce
BCO and consequently lameness in broilers (Al-Rubaye et al., 2016). Furthermore, they
found that the pathogen was horizontally transmitted to unchallenged broilers living in the
same pen and caused lameness in those birds as well. Other microbes associated with BCO
and lameness include Enterococcus cecorum (Stalker et al., 2010), Escherichia coli (Dinev,
2009; Wijesurendra et al., 2017).
Plavnik and Scott demonstrated that adding brewer’s yeast to broiler diets
decreased the incidence of TD while increased bone breaking strength in broilers (Plavnik
and Scott, 1980). In a series of experiments conducted by Wideman et al. (2012; 2015),
broilers were raised on wire-flooring to induce lameness and provided probiotic as a
prophylactic. In the 2012 study, administration of the probiotics Enterococcus faecium,
Bifidobacterium animalis, Pediococcus acidilactici, and Lactobacillus reuteri resulted in a
reduction in lameness by approximately 50%. In the 2015 study, unvaccinated broilers
were provided a different probiotic, Bacillus subtilis, plus a prebiotic. Broilers that were
treated with the probiotic plus prebiotic had a lower incidence of lameness due to BCO
(24.0 vs 40.7%) compared to broilers that were untreated.
Other studies have shown the beneficial effects of adding probiotics to broiler diets
on bone health. Mutuş et al. (2006) added a mixture of Bacillus licheniformis and Bacillus
subtilis to broiler diets. After six weeks of feeding the probiotics to broilers they had
increased tibia mid-shaft cortical bone thickness, ash percentage, and phosphorus content
compared to broilers who were not fed probiotics. A separate study found that addition of
the probiotic Lactobacillus sporogenes increased tibia breaking strength and ash content in
broilers (Panda et al., 2006). Probiotics, Bacillus subtilis and Clostridium butyricum,
combined with low calcium diets have also been shown to increase broiler tibia length
compared to calcium adequate diets without probiotic (Houshmand et al., 2011). A blend

31
of Lactobacillus sp. and 5 other probiotics fed to broilers also increased tibia weight,
length, shaft cortical thickness, ash percentage, Ca and P content, and strength (Ziaie et al.,
2011).
Prebiotics are different from probiotics in that they are not living microorganisms,
but rather any substance used by microorganisms in the body that results in a health benefit.
Common prebiotics are nondigestible oligosaccharides of fructose, galactose, and
mannose. Prebiotics can be fermented by certain groups of microorganisms that are
considered healthy such as bifidobacteriae and lactobacilli. As reviewed by Scholz-Ahrens
et al. (2001), short chain fatty acids and other metabolites are produced during bacterial
fermentation of prebiotics, which can enhance mineral absorption, bone density, bone
mineral content, and bone structure.
The prebiotic inulin is a fructooligosaccharide derived from chicory root. The
addition of 5 g inulin/kg feed was able to increase bone ash and C content in broilers (Ortiz
et al., 2009). Mannanoligosaccharides added at 100 mg/kg feed also improved bone
morphometric characteristics, mineralization, and strength in broilers (Ziaie et al., 2011).
Similar to probiotics and prebiotics, antibiotics can also influence intestinal microflora and
mineral absorption. Antibiotics such as virginiamycin are also reported to improve broiler
bone characteristics, mineralization, and strength (Henry et al., 1987; Ziaie et al., 2011).
Other nutritional strategies to improve broiler leg health include the use of flavors
and polyphenols. In a study conducted by Ziaie et al. (2011), broilers were fed a diet
supplemented with 400 mg medicinal plants/kg feed. The medicinal plants were an herbal
blend of essential oils and functional flavors (Digestrom®). At 6 weeks of age, broilers fed
diets containing medicinal plants had increased tibia weight, length, shaft cortical
thickness, ash percentage, Ca and P content, and strength compared to broilers not fed diets
with medicinal plants.
Several recent studies highlight the use of extracts from traditional Chinese
medicines to treat thiram induced TD in broilers. Tetramethylpyrazine (TMP) is a
bioactive compound found in galbanum plant species and is used as a flavor in various
foods. Mehmood et al. (2018) induced TD in broiler chicks by feeding 50mg thiram/kg
feed from 4 to 7 days of age. From day 8 until day 18 of age, the broilers were provided
30 mg TMP/kg feed or no TMP. TMP was able to reduce the incidence and severity of TD

32
by 14 days of age. It also improved the tibia growth plate width and trabecular bone length
compared to the nontreated TD group.
Icariin is a natural flavonoid isolated from Epimedium sagittatum. In traditional
Chinese medicine it is used to treat bone disease. In a study performed by Zhang et al.
(2018b), TD was induced in broilers by feeding 50mg thiram/kg feed from days 3-7 of age.
From day 8 until day 18 of age broiler chicks were provided diets containing 10 mg
icariin/kg feed or no icariin. Researchers observed improvement in standing and walking
ability in the icariin treated broilers compared to the nontreated broilers. By the end of the
experiment lameness was reduced to levels observed in the control group that were not TD
induced. Icariin was also able to improve tibia length, width, weight and growth plate
width compared with the untreated, TD induced group.
Anacardic acid is a phenolic lipid produced in the seeds from the herb commonly
known as ginkgo biloba. Following the same model as the two previously mentioned
studies, Jiang et al. (2019) induced TD in broilers using thiram in broiler feed. After 4 days
of thiram challenge, broilers were provided diets containing 5 mg anacardic acid/kg diet
for the remainder of the experiment. Anacardic acid was shown to reduce incidence and
severity of TD in broilers.
In the icariin and anacardic acid studies, both compounds were able to counteract
the decreased wingless type member 4 (WNT4) gene expression (Zhang et al., 2018b; Jiang
et al., 2019) and protein levels (Zhang et al., 2018b) that was found to occur in thiram
induced TD. The researchers noted that WNT4 is expressed in bone tissue by osteoblasts
and abnormal levels may indicate occurrence of bone pathology. Thiram is reported to
cause chondrocyte death and have an anti-angiogenic effect on the growth plate in broilers
with TD (Rath et al., 2005). Vascular endothelial growth factor (VEGF) mediates
angiogenesis and regulates various aspects of bone metabolism. Both Icariin and TMP
were able to reduce VEGF gene expression (Mehmood et al., 2018; Zhang et al., 2018b)
and protein levels (Mehmood et al., 2018) that were heightened by thiram induced TD.
1.6.7 Breeder and prenatal nutrition
As reviewed by Torres and Korver (2018), broiler breeder nutrition and prenatal
nutrition impacts embryonic skeletal development and post-hatch leg health. During the

33
embryonic growth phase, the embryo’s sole nutrient source comes from the nutrients
deposited into the egg yolk, albumin, shell membrane and shell by the broiler hen
(Romanoff and Romanoff, 1967; Richards, 1997; Yair and Uni, 2011). The majority of
protein, fatty acids, minerals, and vitamins used for embryonic development are located in
the yolk (White, 1987; Richards, 1997; Angel, 2007; Cherian, 2008; Yair and Uni, 2011)
and eggshell in the case of Ca (Yair and Uni, 2011). Save for protein and amino acids,
many of the aforementioned nutrients in the egg are known to be affected by breeder diet
(Lunven et al., 1973; Naber, 1979; Mattila et al., 1999; Kidd, 2003; Cherian, 2008; Cherian
et al., 2009; Torres and Korver, 2018).
Increased dietary P in dwarf broiler breeder diets was found to increase egg P
content as well as improve offspring bone mechanical properties and ash content
(Triyuwanta and Nys, 1992). High levels of vitamin D in the diets of young broiler
breeders increased offspring tibia ash content and reduced the incidence of TD and
nutritionally induced rickets in offspring (Atencio et al., 2005). However, this effect was
not observed in offspring as broiler breeders aged. There is evidence suggesting that broiler
breeder age can affect nutrient transfer to eggs (Atencio et al., 2005; Yilmaz-Dikmen and
Sahan, 2009; Torres and Korver, 2018).
Mineral source in broiler breeder nutrition can also affect offspring skeletal
development. Breeders fed diets with a mixture of inorganic and organic Zn, Mn, and Cu
increased the Zn content in the yolk and albumen of eggs compared to breeders fed diets
containing inorganic sources of Zn, Mn and Cu (Favero et al., 2013). Tibia and femur
calcification in broiler embryos were increased at embryonic day 18 when organic minerals
were mixed with or added on-top of inorganic breeder diets. Tibias at day of hatch also
had improved biomechanical properties when organic minerals were included in breeder
diets. Kidd et al. (1992) also demonstrated that offspring from breeders fed diets
containing Zn-methionine had greater tibia weight at hatch compared to offspring from
breeders fed diets containing Zn oxide (ZnO), with Zn tibia content correlated to bone
weight and ash percentage.
Ascorbic acid (vitamin C) stimulates bone enzyme activity and cross-linking of
bone collagen fibrils (Palacios, 2006). Additional vitamin C in breeder diets was shown to
have negative effects on offspring that were induced with rickets by feeding diets deficient

34
in vitamin D3, Ca and P, or vitamin D3 alone. Supplemental vitamin C (20 or 40 mg/lb
diet) in breeder diets was shown to exacerbate growth plate pathology of rachitic offspring
(Thornton and Brownrigg, 1961). This effect may be due to an influence of vitamin C on
Ca deposition and resorption during abnormal bone development.
The effects of nutrient deficiencies in broiler breeder diets on offspring skeletal
deformities have been documented and summarized in Table 1.4. Many of the skeletal
defects in broilers as a consequence of broiler breeder nutrition are developmental in nature
and can be corrected with proper breeder diet formulation. Despite improvements in
breeder nutrition, it is known that embryos have access to a finite source of nutrients.
Table 1.4 Embryonic skeletal disorders associated with broiler breeder nutrient
deficiencies1
Breeder Nutrient Deficiency Embryonic skeletal disorder
Vitamin D Rickets
Biotin Chondrodystrophy, twisted leg
Folic Acid Bending of tibia (VVD)
Zinc Absence of limbs, leg weakness
Manganese Chondrodystrophy
Selenium Crooked toes
1References (Cravens et al., 1944; Couch et al., 1948; Sunde et al., 1950; Kidd,
2003; Chang et al., 2016)
Prenatal supplementation of nutrients via in ovo injections into embryos is another
strategy to enhance embryonic skeletal development. In ovo is a Latin term that means in
the egg. In the broiler industry certain vaccinations are administered in ovo to prevent
disease. Concerns have been expressed about the limited nutrients available to the
developing embryo in the yolk sac during the last few days of incubation and for
consumption and absorption of nutrients immediately post-hatch (Dibner et al., 2007; Yair
and Uni, 2011; Oliveira et al., 2015). Yair et al. (2012) observed decreased cross sectional
area in the tibia of broiler embryos from day 19 to 21 of incubation. They also observed a

35
decrease in femur stiffness and ultimate load capacity during the same time frame. These
observations in decreased embryonic bone shaft structure and mechanical properties during
the last few days of incubation may be due to a depletion of mineral reserves closer to hatch
(Yair and Uni, 2011; Yair et al., 2012).
Research has shown that embryos provided organic forms of Cu, Mn, Fe, and Zn
via in ovo injection into the amniotic fluid on day 17 of incubation had increased amounts
of those minerals in the yolk sac before hatch (Yair and Uni, 2011). Moreover, in ovo
supplementation of organic form of the trace minerals Cu, Mn, and Zn increased the yolk
sac content of those minerals compared the inorganic form (Yair et al., 2015). Organic Cu,
Mn, and Zn in ovo enrichment was found to increase bone ash percentage in broiler chicks
at hatch (Oliveira et al., 2015). In a separate study, in ovo administration of a mixture of
vitamins, organic minerals, and maltodextrin resulted in increased leg bone length and
weight up to 14 days post hatch (Yair et al., 2013). Bone mechanical properties and bone
Mn content was increased up to 7 days post hatch by in ovo enrichment. Additionally, long
lasting effects on bone mineralization and trabecular architecture 28 to 56 days post hatch
as a result of in ovo enrichment have been observed (Yair et al., 2013, 2015). Overall, in
ovo nutrient supplementation has positive effects on embryonic and post hatch skeletal
development and mineralization. However, despite these advances in ovo enrichment has
not yet had an effect on broiler leg problems as revealed in results from a latency to lie test
to assess leg weakness (Yair et al., 2015).
1.7 Omega-3 polyunsaturated fatty acids and skeletal development
Nutrition has a large influence on skeletal growth and development. This includes
long chain omega-3 (n-3) polyunsaturated fatty acids (PUFA) such as α-linolenic acid
(ALA), eicosapentaenoic acid (EPA), docosapentaenoic acid (DPA), and docosahexaenoic
acid (DHA). In broilers, the latter three fatty acids can be synthesized from ALA through
a process of carbon chain desaturation and elongation primarily in the liver (Noble and
Cocchi, 1990). Alternatively, they can be directly supplemented in the diet using fish oil,
microalgae or other fat sources.

36
As previously described, enzymes responsible for desaturation of 18 carbon fatty
acids have an affinity for ALA over linoleic acid (LA), thus elongation of n-3 PUFA are
preferred over elongation of n-6 PUFA (Kruger et al., 2010). Arachidonic acid (ARA) is
an n-6 PUFA that can be synthesized from LA or provided in the diet. ARA is the precursor
fatty acid for prostaglandin E2 (PGE2), a proinflammatory eicosanoid that is associated
with bone pathology when it is over produced (Norrdin et al., 1990; Watkins, 1998) or
sufficiently suppressed (Watkins et al., 2001a; Derakhshanfar et al., 2013). Prostaglandins
can be produced by a variety of tissues and cells, including bone cells, which can influence
skeletal formation and resorption (Kawaguchi et al., 1995; Watkins et al., 2001c; Kruger
et al., 2010).
As explained in several published reviews, PGE2 is the major prostaglandin
produced by skeletal tissue (Kawaguchi et al., 1995; Watkins et al., 2001a; Watkins et al.,
2001c, b). PGE2 is a mediator of the resorptive effects of Vitamin D3, hormones, certain
inflammatory cytokines and biological factors. PGE2 stimulates the production of
osteoclasts and mediates their differentiation. Vitamin D3 metabolism leads to parathyroid
hormone (PTH) production, which stimulates the mineral resorption of bones (Leeson and
Summers, 2001; Oviedo-Rondón et al., 2006). Inflammatory cytokines such as certain
interleukins (IL) and tumor necrosis factor-α (TNFα) are known to induce bone resorption
and inhibit chondrocyte proliferation (Watkins et al., 2001c). IL-1 and TNFα in particular
can induce the production of collagenases and proteases in chondrocytes which results in
the degradation of collagen and proteoglycans and ultimately the collagen matrix of the
bone (Arend and Dayer, 1990; Goldring, 2000).
PGE2 is also the mediator of growth factors and cytokines involved in bone
formation. PGE2 can modulate proteins involved with osteoblast differentiation and at low
levels improve alkaline phosphatase (ALP) activity, a bone formation biomarker (Watkins
et al., 2001c). PGE2 was shown to stimulate insulin-like growth factor (IGF)- I (McCarthy
et al., 1991), a hormone signaling molecule that induces osteoblast differentiation,
mineralization, and proliferation (Zhang et al., 2012). However, at high levels PGE2 was
shown to have negative effects on collagen synthesis in rat bones (Raisz and Fall, 1990)
and bone formation in broiler chicks (Watkins et al., 1996a; Watkins et al., 1997b).
37
Dietary n-3 PUFA have been shown to reduce tissue levels of PGE2 in broilers
(Watkins et al., 2003; Bautista-Ortega et al., 2009; Cherian et al., 2009) and decrease the
production of inflammatory cytokines in broilers (Selvaraj et al., 2010) and other species
(Bhattacharya et al., 2007; Skuladottir et al., 2007). It has been demonstrated in
osteoblastic and chondrocyte cell culture that n-3 PUFA can reduce the activity of and
cyclooxygenase (COX) and other enzymes responsible for transforming ARA into PGE2
(Curtis et al., 2000; Watkins et al., 2003; Shen et al., 2008; Hutchins et al., 2011). Dietary
n-3 PUFA, specifically EPA, is known to reduce the content of arachidonic acid (ARA) by
competing for incorporation into lipid stores of phospholipid membranes, a major storage
site for long chain PUFA, (Kruger and Horrobin, 1997) and by competing with ARA for
eicosanoid transformation by COX and 5-lipoxygenase (Calder, 2001, 2006b).
Due to the similar structure of certain long chain n-6 and n-3 PUFA and the
antagonist nature of long chain n-3 on n-6 uptake and metabolism, dietary n-3 PUFA can
influence the lipid profile of tissues and cellular membranes. Watkins et al. (1996a)
compared the effects of dietary safflower oil verses menhaden oil on the fatty acid profile
of the proximal tibia cortical bone tissue in broilers. They found that after 19 days of
feeding menhaden oil to broilers EPA, DPA, DHA, and total n-3 PUFA was significantly
increased in the bone tissue. They also observed a decrease in LA, ARA, total n-6 PUFA,
and PGE2 in bone tissues. Furthermore, the broilers fed menhaden oil had greater
trabecular bone volume and bone formation rate. In a separate study, broiler chicks fed a
blend of corn and menhaden oil had increased tibia concentrations of EPA, DPA, DHA,
and total n-3 PUFA and decreased concentrations of LA, ARA, and total n-6 PUFA
compared to broilers fed soybean oil, a blend of corn oil and butter, or a blend of corn oil
and margarine (Watkins et al., 1997b). In this study, dietary n-3 PUFA were also shown
to raise IGF-I levels broiler cortical bone and cartilage. Dietary fish oil when used as a
source of n-3 PUFA was also shown to alter the fatty acid profile of tibia cortical bone in
quail. The fish oil also increase tibia ash percentage, tibia mineral content, tibia calcium
content, and tibia phosphorus content, tibia biomechanical properties, tibia cortical
thickness at the diaphysis and distal end, and tibia cortical density at the proximal end
diaphysis (Liu et al., 2003). As reviewed by Lau et al. (2013), dietary n-3 PUFA has the

38
ability to alter the bone fatty acid prolife and improve bone mineral density and
biomechanical strength across various species.
The femur may be even more sensitive to changes in dietary n-3 PUFA based on
results published by Li et al. (2010). Researchers found that when they fed n-3 fatty acid
deficient, rats’ milk and pellets with supplemental ALA the femur periosteum and bone
marrow accumulated higher levels of DHA compared to EPA. When rat diets were
supplemented with DHA verses ALA, the DHA level in the polar lipid fraction increased
nearly 10-fold in the femur periosteum and 2-fold in the femur marrow. These results
indicate DHA may be a preferred n-3 PUFA at these sites. This is biologically significant
since osteogenic cells differentiation at these sites and the polar fraction represents the
phospholipid layer that is a source for eicosanoids and other fatty acid derived, biologically
active molecules.
The chondrocytes of the epiphyseal growth plates of broilers are responsible for
bone elongation and production of collagen matrix of bone. The avian chondrocyte cell,
chondrocyte cell membrane, and matrix vesicles produced by chondrocytes contain many
fatty acids (Wuthier, 1975; Xu et al., 1994; Abdallah et al., 2014). During osteogenesis of
the broiler leg bones, matrix vesicles are released by hypertrophic chondrocytes help to
initiate mineralization. Based on the research of Abdallah et al. (2014) using an avian
model, the matrix vesicles originate from the microvilli of the chondrocyte plasma
membrane. The microvilli and matrix vesicle fatty acid profile are very similar and
indicated to be selective in incorporation of long chain PUFA, particularly n-6 and n-9
PUFA despite the higher content of ALA and other n-3 PUFA in chondrocyte membranes.
A separate study has shown that avian epiphyseal growth plate chondrocytes are sensitive
to n-6 PUFA and exhibit decreased collagen synthesis when cultured with excess LA
(Watkins et al., 1996b). Exposure to dietary n-3 early in life resulted in thicker chondrocyte
proliferative and hypertrophic zones in mice growth plates (Koren et al., 2014).
Similar to osteocytes, the fatty acid profile and function of chondrocytes are
sensitive to changes in dietary PUFA. Broiler chicks fed diets with a blend of menhaden
oil and corn oil from hatch had increased DPA, DHA, and total n-3 PUFA in the proximal
tibia growth plate cartilage at 3 weeks of age compared to broiler chicks fed diets with
soybean oil, especially in the polar lipid fraction (Xu et al., 1994). By 6 weeks of ages

39
broilers fed diets with menhaden plus corn oil had significantly more EPA, DPA, DHA,
total n-3 PUFA and less ARA and total b-6 PUFA in the tibia growth plate cartilage than
broilers fed diets with soybean oil. Many of these changes were observed in polar and
neutral lipid fractions. When chicks were 8 weeks of age, the chondrocytes and matrix
vesicles of the proximal tibia growth plate had greater amounts of EPA, DPA, and total n-
3 PUFA and lowered amounts of ARA and total n-6 PUFA by feeding a blend of menhaden
oil and corn oil versus soybean oil. The same changes were also observed in the articular
cartilage.
1.8 Zinc and skeletal development
It is well known that zinc (Zn), an essential trace element and nutrient, is an integral
component of numerous enzymes and proteins. These Zn-dependent molecules have
important roles in numerous biochemical and metabolic functions such as cell growth and
proliferation, cell differentiation, gene expression, and immunity (Vallee and Falchuk,
1993; Plum et al., 2010; Haase and Rink, 2014a, b). Zn is also essential for skeletal
development, specifically due to its role in stimulating the synthesis of collagen and
chondroitin for bone matrix and structure formation (Brandao-Neto et al., 1995) as well as
its role in osteoblast proliferation and activity (Seo et al., 2010). Although the National
Research Council (NRC, 1994) recommends broiler diets to contain approximately 40 mg
Zn/ kg diet, research has linked higher levels of dietary Zn and organic forms of
supplemental Zn to greater tissue Zn retention (Ao et al., 2006; Sunder et al., 2008; Ao et
al., 2011).
The epiphyseal growth plate of broiler chicks needs Zn for bone elongation and
calcification. Wang et al. (2002) conducted a study to evaluate the effects of Zn deficiency
in young broilers on the epiphyseal growth plate. After hatch, broiler chicks were either
fed Zn deficient diets or Zn adequate diets for 7 days. In Zn deficient broiler chicks, the
proliferating chondrocytes of the growth plate exhibited abnormal morphology. The
columnar morphology of the proliferative zone was disrupted and lesions in the growth
plate became evident. DNA synthesis in the chondrocyte proliferative zone and
hypertrophic zones was drastically reduced by 75% after 3 days of feeding Zn deficient

40
diets compared to Zn adequate diets as evidenced by Bromodeoxyuridine (BrdU) labeling
of cells. After 7 days of feeding Zn deficient diets DNA synthesis in the growth plate
barely progressed beyond the levels observed at 3 days of age. Zn deficiency severely
limited chondrocyte proliferation and induced apoptosis in the broiler epiphyseal growth
plate indicating Zn is essential for long bone elongation.
Apart from chondrocytes in the growth plate, zinc is known to have a role in
osteoblast proliferation and activity. Mouse osteoblastic cells (MC3T3-E1 cells) were
cultured with and treated with increasing concentrations of Zn (0-25 µM) to study the
effects of Zn on osteoblast proliferation, enzyme activity, and collagen synthesis (Seo et
al., 2010). After 5 days of treating the osteoblast cells with Zn, cell proliferation increased
in a dose dependent manner. This observation persisted 10 days after Zn treatment.
Enzyme activity related to bone formation in the osteoblast itself and secreted by the
osteoblasts into the cell culture medium also increased in a dose dependent matter. The
researchers of this study also found that collagen synthesis and Ca deposition into
extracellular matrix was increased with Zn treatment of osteoblast cells, indicating the
stimulating role of Zn on bone mineralization.
Young, weanling rats were fed increasing concentrations of Zn sulfate to determine
the effects of dietary Zn supplementation on zinc, DNA synthesis, collagen and calcium,
and enzyme activity in the femoral diaphysis (Yamaguchi and Takahashi, 1984). Similar
to results obtained in osteoblast cell culture (Seo et al., 2010), Zn sulfate increased Zn
content, DNA synthesis, collagen synthesis, Ca content, and enzyme activity in rat femur
diaphysis in a dose dependent manner. Many of these results were observed after 1 or 3
days after feeding supplemental Zn to rats. Other trace minerals are known to impact
skeletal development, but Zn is especially important for bone formation. A separate study
by Yamaguchi et al. (1986) fed 3 week old rats increasing concentrations of Zn, cobalt
(Co), Cu, Mn, or nickel (Ni) and evaluated their effects on bone formation enzyme activity
and DNA content as an indicator of DNA synthesis. The researchers found that all trace
minerals increased bone formation enzyme activity, but Co, Cu, Mn, and Ni decreased
DNA content in the rat femur. When Zn was combined with the other trace minerals DNA
content was improved. These results demonstrate that out of other trace minerals Zn is
especially important for bone cell growth and proliferation.

41
Alkaline phosphatase (ALP) appearance in the growth plate is an indicator of
chondrocyte hypertrophy and calcification (Pines and Hurwitz, 1991). It is also an
important biomarker of bone formation as a measure of osteoblast proliferation and
differentiation (Seo et al., 2010). Zn has been indicated as a cofactor for ALP (Wang et
al., 2002; Palacios, 2006). Zn deficiency reduces ALP activity in osteoblastic cell culture
(Kwun et al., 2010), whereas Zn supplementation increases ALP activity in osteoblastic
cell culture (Seo et al., 2010), growth plate chondrocyte cell culture (Litchfield et al., 1998),
and rat femur in vivo (Yamaguchi and Takahashi, 1984; Yamaguchi and Yamaguchi,
1986). There are other enzymes produced during skeletal growth and development, but
ALP was shown to be particularly sensitive to Zn compared to some other bone tissue
enzymes. Yamaguchi and Yamaguchi (1986) fed 1.0 mg Zn /100 g body weight to
weanling rats. After only one day of feeding supplementation Zn, ALP activity was
significantly increased (P<0.05) compared to rats not fed supplemental Zn. The enzymes
in femur bone tissue succinate dehydrogenase, 5’-nucleotidase, ATPase, pyrophosphatase,
and β-N-acetylglucosaminidase remained unchanged with Zn supplementation.
In addition to Zn supplementation, Zn source can affect bone metabolism. In 2004,
Yamaguchi et al. reported that dietary supplementation of organic Zn vs ZnO increased
ALP activity in rat femur diaphysis after 1 week of feeding (Yamaguchi et al., 2004). In
the same study, organic Zn increased the Ca content of rat femur diaphysis and metaphysis
and serum Zn content over ZnO (Yamaguchi et al., 2004). These results indicate organic
Zn was more bioavailable and had a greater impact on leg bone development than inorganic
Zn.
In broilers, the tibia is especially sensitive to dietary Zn level and source (Sandoval
et al., 1998; Ao et al., 2006; Sunder et al., 2008; Ao et al., 2011). In regards to breeder
trace mineral source, a blend of organic and inorganic Cu, Mn and Zn supplementation in
broiler breeder diets improved offspring tibia and femur diaphysis width at 14 days of
embryonic development compared to inorganic trace mineral supplementation alone
(Favero et al., 2013). Kidd et al. (1992) found that tibia dry weight was greater in offspring
from breeders fed organic Zn vs inorganic Zn. Ash content remained the same between
the two groups. Dry weight accounts for the organic and inorganic components of bone
whereas ash accounts mainly for the inorganic portion of bone. Their results indicate that

42
dietary breeder Zn source may have affected the organic portion of offspring bone which
contains collagen, protein, enzymes, etc.
1.9 Organization of the broiler industry
The U.S. broiler industry has a highly, vertically integrated structure, meaning that
a poultry firm typically owns or controls the feed ingredients used to mix rations, the feed
mill, the hatchery, processing plant, and post-processing systems. In this structure the
poultry firm contracts growers to manage breeder or broiler houses and works with allied
partners that may either supply primary breeders, rendering services, or have some role in
the distribution, export and sale of chicken products from the processing plant/post-
processing facilities (MacDonald, 2014; National Chicken Council, 2019b). The
organization of a vertically integrated U.S. poultry firm is depicted in Figure 1.4.
Figure 1.4 Vertical Integration of Poultry Firm
Adapted from National Chicken Council (2019b) and MacDonald (2014)

43
CHAPTER 2. Effects of Microalgae Level and Zn Source Supplementation in Broiler
Breeder diets on Broiler Breeder Pullet Growth, Uniformity, and Leg Bone Quality
ABSTRACT
Dietary omega-3 (n-3) polyunsaturated fatty acids (PUFA) and zinc (Zn) are known to
improve bone quality in poultry species. FORPLUS™ (Alltech, Inc.) is an unextracted,
whole-cell microalgae (Aurantiochytrium limacinum CCAP 4087/2) source of n-3 PUFA
and DHA in particular. Bioplex® Zn (Alltech, Inc.) is a Zn-proteinate product that is more
bioavailable to poultry than some other sources of inorganic Zn. A 2x2 factorial,
randomized complete block study was designed to evaluate the dietary effects of
FORPLUS™ level (0% vs 2%) and Zn source (Bioplex® Zn vs ZnO) on growth
performance, BW uniformity and leg bone quality of broiler breeder pullets. A total of
440, one day old Cobb 500™ broiler breeder pullet chicks were randomly assigned to 4
dietary treatments. The pullets were divided into 5 replicate floor pen groups per dietary
treatment with 22 pullets per group. The 4 dietary treatments were 1) corn-soybean meal
based diet + 40 mg ZnO/kg diet, 2) diet 1 + 2% FORPLUS™, 3) corn-soybean meal based
diet + 40 mg Bioplex® Zn/kg diet, 4) Diet 3 + 2% FORPLUS™. At 3 wk of age, pullet
body weight gain (BWG), feed intake (FI), FI: BWG (FC) was measured. Bi-weekly BW
and BW uniformity were obtained from 3-20 wk of age. Tibias and femurs were collected
for length, breaking strength, ash %, and ash mineral content measurements at 3 and 6 wk
of age. At 16 wk of age tibias and femurs were analyzed for breaking strength, ash %, and
ash mineral content. At 20 wk of age tibias and femurs were analyzed for bone breaking
strength. At 3 wk of age pullets fed diets with 2% FORPLUS™ had lower (P≤0.05) BWG
and FI compared to pullets fed diets without FORPLUS™. At 5 wk of age pullets had
lower (P≤0.05) BW when fed 2% vs 0% FORPLUS™. When pullets were 19 and 20 wk
of age BW was increased (P≤0.05) by 2% vs 0% FORPLUS™ or Bioplex® Zn vs ZnO.
An interaction effect of breeder dietary factors was observed for pullet BW uniformity
during 3-20 wk of age. Pullets fed 0% FORPLUS™ + Bioplex® Zn had improved (P≤0.05)
BW uniformity over pullets fed 0% FORPLUS™ + ZnO. At 3 wk of age, pullets fed diets
with 2% FORPLUS™ had greater (P≤0.05) femur length, femur ash %, tibia ash Mn

44
content. However, 2% FORPLUS™ also reduced (P≤0.05) tibia ash Cu and Zn content as
well as femur ash Zn content. Pullets fed diets with Bioplex® Zn had less (P≤0.05) femur
ash Cu compared to pullets fed ZnO. At 6 wk of age, pullets fed diets with 0%
FORPLUS™ + Bioplex® Zn had increased (P≤0.05) femur ash percentage and Ca content
in femur ash, but decreased tibia and femur ash Fe content compared to all other treatments,
except for 2% FORPLUS™ + ZnO in the case of femur ash Ca content. Pullets fed diets
containing 2% vs 0% FORPLUS™ had decreased tibia breaking strength and tibia ash Zn
content. At 16 wk of age, only main effects of dietary Zn source were observed on femur
breaking strength and ash Cu content. Bioplex® Zn vs ZnO reduced femur breaking
strength and ash Cu content. Based these results FORPLUS™ improved femur quality
while reducing growth performance early in life. As pullets aged FORPLUS™ or Bioplex®
Zn improved BW, while Bioplex® Zn supplementation without FORPLUS™ had the most
positive impact on BW uniformity.

45
2.1 Introduction
Leg weakness and lameness as a result of skeletal leg disorders and deformities are
issues that cause concern for animal welfare and negatively affect the poultry industry.
Skeletal leg disorders and deformities pose a welfare concern because they may cause pain
and impair a bird’s ability to walk, thereby disrupting normal eating and drinking habits
and behaviors (Kestin et al., 1992; Bradshaw et al., 2002; Dinev, 2009; Nääs et al., 2009).
Consequences of moderate to severe lameness in broilers are lower growth rates, culling,
processing downgrades, and ultimately profit losses (Bradshaw et al., 2002; Knowles et
al., 2008; Dinev, 2009; Gocsik et al., 2017; Wijesurendra et al., 2017). It is estimated that
lameness affects an average of 21.4% of European broiler flocks and approximately 3.0%
of broilers may need to be culled due to severe lameness (Bassler et al., 2013; Marchewka
et al., 2013; Kittelsen et al., 2015; Tullo et al., 2017; Granquist et al., 2019). In the United
States there is a lack of recent, comprehensive studies on the incidence of lameness in
broilers, although it has been claimed that up to 6% of broilers have obvious skeletal
abnormalities or leg problems and 2% of broiler flocks suffer losses due to lameness
(Dunkley, 2007; Mitchell, 2014). Leg weakness and disorders are not commonly observed
in feed restricted broiler breeder flocks, however very little is known about the prevalence
of leg weakness in broiler breeder flocks (EFSA, 2010). Even less is known about the leg
quality of broiler breeders during pullet rearing and growth.
Dietary omega-3 (n-3) polyunsaturated fatty acids (PUFA) are known to improve
bone quality in poultry species (Watkins et al., 1996a; Watkins et al., 1997b; Liu et al.,
2003; Fleming, 2008). FORPLUS™ (Alltech, Inc.) is an unextracted, whole-cell
microalgae (Aurantiochytrium limacinum CCAP 4087/2) source of n-3 PUFA. It is a high
fat yielding microalgae that contains 64% fat with 16% of that fat as docosahexaenoic acid
(DHA). Microalgae rich in n-3 PUFA may be considered as a sustainable, alternative to
fish oil which is a common source of n-3 PUFA in poultry diets. It is well known that zinc
(Zn), an essential trace element and nutrient, is an integral component of numerous
enzymes and proteins. These Zn-dependent molecules have important roles in numerous
biochemical and metabolic functions such as cell growth and proliferation, cell
differentiation, gene expression, and immunity (Vallee and Falchuk, 1993; Plum et al.,
2010; Haase and Rink, 2014a, b). Zn is also essential for skeletal development, specifically

46
due to its role in stimulating the synthesis of collagen and chondroitin for bone matrix and
structure formation (Brandao-Neto et al., 1995) as well as its role in osteoblast proliferation
and activity (Seo et al., 2010). Bioplex® Zn (Alltech, Inc.) is a Zn-proteinate product that
is more bioavailable to poultry than some other sources of inorganic Zn (Ao et al., 2006;
Ao et al., 2011). The objective of this study was to evaluate two levels of dietary
FORPLUS™ and two sources of Zn on broiler breeder pullet growth, uniformity, and leg
bone quality.
2.2 Materials and Methods
The following study was conducted in compliance with protocols approved by the
University of Kentucky Institutional Animal Care and Use Committee.
2.2.1 Experimental Design
The experimental design used for this study was a completely randomized block
design with a 2x2 factorial treatment arrangement consisting of 2 levels of FORPLUS™
supplementation (0 vs 2%) and two sources of supplemental Zn (ZnO vs Bioplex® Zn). A
total of 440, one day old Cobb 500™ broiler breeder pullet chicks were obtained from a
local hatchery (Cobb-Vantress, Monticello, KY) and randomly assigned to four dietary
treatments. The broiler breeder pullets were divided into 5 replicate floor pen groups per
dietary treatment with 22 pullets per group. The four dietary treatments were 1) corn-
soybean meal based diet + 40 mg ZnO/kg diet, 2) diet 1 + 2% FORPLUS™, 3) corn-
soybean meal based diet + 40 mg Bioplex® Zn/kg diet, 4) Diet 3 + 2% FORPLUS™. The
diets were formulated to meet or exceed nutrient requirements as recommended by the
National Research Council (1994). The broiler breeder pullets remained on these dietary
treatments throughout the starter (0-8 weeks of age), grower (8-19 weeks of age), and pre-
lay (19-20 weeks of age) phases (Table 2.1, Table 2.2, Table 2.3). Broiler breeder pullets
were given ad libitum access to feed and water via a hanging feeder and hanging nipple
drinkers for the first three weeks after placement. Afterwards they were switched to a
restricted feeding regimen as per the Cobb® Breeder Management Guide (Cobb-Vantress,
2012). Feed allotment was then provided daily in a feeding trough.

47
The broiler breeder pullets were housed in floor pen units that measured
approximately 1.22 x 1.83 sq. meters. Pen location served as the blocking factor for this
study. The litter for each pen was 100% large flake, pine wood shavings supplied at
approximately 3.66 cu. meters per pen and was changed as needed. Broiler breeders were
raised in an ambient temperature range of 18.3 to 29.4 °C. Photostimulation was provided
at 8 hours of light and 16 hours of darkness soon after placement until 18 weeks of age, 10
hours of light and 14 hours of darkness from 18-19 weeks of age, 11 hours of light and 13
hours of darkness from 19-20 weeks of age, and 13 hours of light and 11 hours of darkness
from 20-21 weeks of age.
2.2.2 Early Growth Performance Measurements
Early growth performance from placement to 3 weeks of age was measured while
broiler breeder pullets were given ad libitum access to feed. Body weight (BW) by pen
was recorded at placement and measured weekly thereafter to calculate average body
weight gain (BWG). The average feed intake (FI) by pen was measured each week and
used to calculate feed conversion (FC) represented by the ratio of FI to BWG. All
measurements of BWG, FI, and FC were corrected for mortality.
2.2.3 Body Weight Uniformity
Starting at 3 weeks of age, BW uniformity was measured every other week by
collecting the individual body weight of each pullet. Individual BW were recorded and
mean BW of each pen was calculated. BW uniformity was expressed as a percentage of
the number of broiler breeder pullets whose BW was outside ± 20% mean pen BW out of
the total number of broiler breeder pullets in each pen.
2.2.4 Bone Length, Mechanical Testing, Ash Determination, and Mineral
Analysis
When broiler breeder pullets were 3 weeks of age, 1 broiler breeder pullet per pen
was randomly selected and euthanized by argon gas asphyxiation followed by cervical
dislocation. Tibias and femurs were collected for bone length measurements, mechanical

48
testing, ash determination, and mineral analysis. Bone length measurements were obtained
using digital calipers. The tibias and femurs were cleaned of flesh and then subjected to a
three-point bending mechanical analysis (Instron Testing Instrument, model 4301) to
obtain peak breaking strength. The midshaft of tibias and femurs were positioned
perpendicular to a steel wedge probe with the anterior side of the bone facing probe. A
load force of 100 kg was applied to the midshaft of the bone at 40mm/min until peak
breaking strength was determined.
For ash determination, tibias and femurs were boiled for 15 minutes in deionized
water to aid in removal of flesh. Excess flesh and cartilage caps were removed from the
bones. They were then oven dried at 60°C for 72 hours. Afterwards, bones were soaked
in 100% petroleum ether until fat residues were removed. The bones were then oven dried
overnight at 105°C in porcelain crucibles to obtain the dry weight. After drying, bones
were ashed in a muffle furnace at 600°C for 6 hours (Ao et al., 2006). Ash percentage of
each bone was calculated and expressed as a percentage of dry weight.
Ashed bones were homogenized and used for mineral analysis. Approximately 0.2
grams of bone ash was microwave digested in 8 ml concentrated nitric acid (TraceMetal™
Grade, Fisher Scientific), 2 ml concentrated hydrochloric acid (TraceMetal™ Grade,
Fisher Scientific), and 10 ml of deionized water using CEM Microwave Accelerated
Reaction System 6 VessExpress program. Acid digested samples were then diluted to with
deionized water for trace mineral, Ca, and P analysis using inductively coupled plasma-
optical emission spectrum (Agilent Technologies Inc ICP-OES, model 5110).
Using the procedures described above, tibia and femur were collected at 6 weeks
of age for bone length, peak breaking strength, ash determination, and mineral analysis. At
16 weeks of age bone peak breaking strength, ash determination and mineral analysis were
obtained. At 20 weeks of age bone breaking strength was also obtained.
2.2.5 Statistical Analysis
Early growth performance and bone measurement data were subjected to a two-
way analysis of variance using the general linear model procedures of SAS® Software,
version 9.4 (SAS, 2016). The model included the fixed effect of block by experimental
unit (floor pen) location, the main effect of dietary FORPLUS™ level, the main effect of

49
supplemental Zn source and the interaction effect of those two factors. Repeated measures
of BW and BW uniformity over time were analyzed using GLIMMIX procedures of SAS®
Software, version 9.4 (SAS, 2016). The model included the main effect of dietary
FORPLUS™ level, the main effect of supplemental Zn source, the main effect of time, the
interaction effect of dietary FORPLUS™ level and supplemental Zn source, the interaction
effect of dietary FORPLUS™ level and time, the interaction effect of supplemental Zn
source and time, and the interaction effect of dietary FORPLUS™ level, supplemental Zn
source and time. The variance of the data was weighted using the Satterthwaite
Approximation. Time was treated as a random effect and the data was determined to have
a first-order autoregressive covariance structure. For all post hoc analyses, mean values
were separated and compared using Fisher’s protected least significant difference test.
Mean values were declared significantly different for P values ≤ 0.05.
2.3 Results and Discussion
2.3.1 Early Growth Performance
Three weeks after placement, a main effect of dietary FORPLUS™ level was
observed on pullet early growth performance (Table 2.4). The pullets who had ad libitum
access to diets supplemented with 2% FORPLUS™ had significantly lower (P≤0.05) BWG
(577 vs 604 g/b) and FI (974 vs 1048 g/b) compared to pullets who consumed diets not
supplemented with FORPLUS™. Broiler chicks who were fed a diets enriched with n-3
PUFA with redfish meal exhibited lower live weight at 21 days compared to broiler chicks
fed diets without redfish meal (Hulan et al., 1989). Reduced feed consumption was
observed in broilers fed diets with redfish meal. Similar findings were observed on early
growth performance when broilers were fed n-3 PUFA enriched diets via fish oil
supplementation (Hulan et al., 1988; Schreiner et al., 2005; Maroufyan et al., 2012). The
authors cited reduced palatability or insufficient vitamin and mineral antioxidant capacity
in the diet to protect the long chain fatty acids from degradation. Increased dietary PUFA
in humans has been liked to increased oxidative stress due to lipid peroxidation (Jenkinson
et al., 1999). Based on the results in a human clinical trial, it was recommended when
dietary PUFA is increased to also increase dietary vitamin E to protect against oxidative

50
stress. Palatability of the microalgae used in this study was also not evaluated therefore it
is unknown if microalgae inclusion affected FI and consequently BWG due to palatability.
Due to proportionate FI to BWG, no difference in FC was detected. No interaction between
dietary FORPLUS™ level and Zn source was observed for pullet early growth
performance.
2.3.2 Pullet BW and BW Uniformity
No interaction between dietary FORPLUS™ level and Zn source was observed for
pullet BW from 3-20 weeks of age, although a main effect of dietary FORPLUS™ level
was observed (Figure 2.1). When pullets were 5 weeks of age, BW was decreased (P≤0.05)
by dietary supplementation of 2% FORPLUS™ (849 vs 894 g). Diets enriched with n-3
PUFA have been shown to depress BW and FI in broilers during the first 6 weeks of life
(Hulan et al., 1988; Hulan et al., 1989; Schreiner et al., 2005; Maroufyan et al., 2012). In
Abdelnour et al.’s review of the use of microalgae Chlorella spp. in broiler feeds, inclusion
rates of up to 10% did not adversely affect growth performance (Abdelnour et al., 2019).
Microalgae vary in fat content and composition. The Chlorella spp. was cited as containing
12.8% fat (Kang et al., 2013) whereas Aurantiochytrium limacinum contains 64% or more
fat. One study using Aurantiochytrium limacinum in broiler diets did not detect any
negative affects broiler BWG or FI through 42 days of age (Moran et al., 2018), suggesting
a tolerance of up to 5% supplementation. In contrast, 1% supplementation of
Aurantiochytrium limacinum in broiler diets decreased broiler BW and FI at 21 and 42 days
of age (Keegan et al., 2019). In Moran et al.’s study (2018), fat comprised approximately
5.0-5.7% of the broiler diet while in Teegan et al.’s study (2019) broiler diets contained
6.5-6.9% fat. Although both studies supplemented diets with vitamins and minerals, it is
unclear if differences in basal diet composition (corn/soybean meal based diet in the Moran
study vs corn/wheat/soybean meal based diet in the Keegan study) affected endogenous
sources of vitamins and minerals and nutrient availability and consequently their
antioxidant capacity. In the current study vitamin supplementation levels remained the
same for all dietary treatments throughout the starter, grower, and pre-lay phases and daily
controlled feeding began after 3 weeks of age. In the starter and grower phases, Fe
supplementation was increased but Mn supplementation was reduced compared to the pre-

51
lay phase. Wheat middlings were added to the starter and grower diets to control BW but
it was removed in the pre-lay phase. Wheat middlings are by products of the wheat flour
milling industry and contain nonstarch polysaccharides, such as arabinoxylan. Diets with
supplementation of wheat middlings have been shown to lower nutrient digestion, such as
Ca, in laying hens compared to diets without wheat middlings (Jaroni et al., 1999), however
Ca digestion did improve after 10 weeks. In a pig model, diets supplemented with a soluble
wheat arabinoxylan rich fraction slowed down the digestion of triglycerides and absorption
of free fatty acids (Gunness et al., 2016). Nonstarch polysaccharides have also been noted
to reduce lipid digestibility in chickens (Annison, 1993). For this study, it may be possible
that basal diet nutrient composition in the starter and grower phases interfered with nutrient
and lipid digestibility and absorption however that cannot be confirmed since those
variables were not tested in this study.
Current management practices support the controlled growth of broiler breeder
pullets early on in life because BW is closely linked with future reproductive performance
(Cobb-Vantress, 2012). Growth rate is negatively correlated with reproductive
performance and pullets that become overweight during the growing phase may experience
reduced egg production and higher mortality later on in life (Leeson and Summers, 2010;
Kleyn, 2013). By 7 weeks of age there was no longer a detectable difference in pullet BW.
However, during the pre-lay phase at 19 and 20 weeks of age 2% FORPLUS™
significantly increased (P≤0.05) pullet BW to 2018 and 2189 g, respectively. The pullets
fed 2% FORPLUS™ reached BW closer to Cobb-Vantress (2012) recommendations for
19 and 20 weeks of age (2090 and 2250 g, respectively) compared pullets fed diets with
0% FORPLUS™ who at 19 and 20 weeks of age reached BW of 1969 and 2132 g,
respectively. As pullets mature and prepare for lay they experience an acceleration of BW
(Cobb-Vantress, 2012). Previous research indicates that pullet BW at 20 weeks old can
influence reproductive performance later on in life, with lighter pullets underperforming in
terms of broken eggs, fertility, and number of chicks produced per hen (Robinson et al.,
1995).
During pullet growth from 3-20 weeks of age, a main effect of dietary Zn source
on BW was also observed (Figure 2.2). During the pre-lay phase, dietary supplementation
of Bioplex® Zn increased (P≤0.05) pullet BW vs ZnO at 19 and 20 weeks of age (2015 vs

52
1971 g at 19 weeks and 2192 vs 2129 g at 20 weeks). The pullets fed diets supplemented
with Bioplex® Zn had BW closer to Cobb-Vantress (2012) recommendations (2090 g at 19
weeks of age and 2250 g at 20 weeks of age) than pullets fed diets with ZnO. As previously
discussed, pullets that were under BW target for 20 weeks of age were found to have lower
reproductive performance later on in life (Robinson et al., 1995). Elemental Zn is an
integral component of numerous enzymes and proteins involved in growth (Vallee and
Falchuk, 1993; Brandao-Neto et al., 1995). Previous broiler studies have demonstrated
that Bioplex® Zn has a higher bioavailability than other forms of inorganic Zn and can
improve growth performance variables such as BW (Ao et al., 2006; Sahraei et al., 2012).
In a short amount of time broilers undergo rapid growth and require Zn to support that
growth. Similarly, during the pre-lay phase pullets experience accelerated growth to
prepare for sexual maturity (Leeson and Summers, 2010; Kleyn, 2013). These results
indicate that Zn source impacts growth rate in preparation for lay.
An interaction between dietary FORPLUS™ level and Zn source was observed for
pullet BW Uniformity from 3-20 weeks of age (Table 2.5). BW uniformity was
significantly improved (P≤0.05) in pullets fed diets with Bioplex® Zn than ZnO (85.5 vs
78.3%) when combined with 0% FORPLUS™. Pullet BW uniformity in feed restricted
pullets determines the reproductive performance through peak egg production and beyond.
Higher pullet BW uniformity has been implicated in improved hen egg production (Abbas
et al., 2010).
2.3.3 Bone Length, Mechanical Testing, Ash Determination, and Mineral
Analysis
When pullets were 3 weeks of age no dietary effects on tibia length, tibia and femur
breaking strength, or tibia ash percentage were observed. Main effects of dietary
FORPLUS™ level were observed on pullet femur length and femur ash percentage (Table
2.6). Broiler breeder pullets fed diets supplemented with 2% FORPLUS™ had greater
(P≤0.05) femur length and femur ash percentage and tended (P=0.08) to have greater tibia
ash percentage compared to pullets fed diets without FORPLUS™. Exposure to dietary n-
3 PUFA at a young age accelerated bone growth and improved bone quality in mice (Koren
et al., 2014). The femur may be even more sensitive to changes in dietary n-3 PUFA,

53
especially DHA, based on results from Li et al. (2010). Supplementation of DHA in rat
diets increased bone mineral content in rat femurs (Li et al., 2010). Moreover, DHA is
critical for osteoblastogenesis and bone formation during bone modelling in young animals
(Watkins et al., 2003). It also activates free fatty acid receptor 4 in mature osteoblasts and
osteoclasts to stimulate bone formation and decrease resorption, respectively (Ahn et al.,
2016). Dietary supplementation of n-3 PUFA with fish oil has been shown to increase
bone ash percentage in quail (Liu et al., 2003) and increase tibia bone breaking strength
and ash percentage in broilers (Fleming, 2008). Bone strength is a response to the
mechanical load environment, endocrine system, trabecular and cortical bone makeup,
organic and inorganic properties, and structural properties (Hart et al., 2017). Therefore,
this measure of bone quality may not always coincide with bone ash percentage, a measure
of inorganic content of bone.
Main effects of dietary FORPLUS™ level were observed on pullet tibia ash mineral
content (Table 2.7) and femur ash mineral content (Table 2.8) when pullets were 3 weeks
of age. FORPLUS™ supplemented at 2% vs 0% in pullet diets increased Mn content in
tibia ash while reducing Cu and Zn content. Similar to the tibia ash, femur ash tended
(P=0.06) to have an increase in Mn content and had a significant decrease in Zn content.
Dietary FORPLUS™ at the 2% level may enhance Mn bone mineral retention at the
expense of Cu and Zn. Mn, Cu and Zn absorption can be influenced by dietary lipid source.
Rats fed diets enriched with PUFA by safflower oil had greater Mn absorption and
retention in tissues compared to rats fed diets enriched with saturated fat via stearate
(Finley and Davis, 2001). However increased dietary PUFA has been linked to decreased
Cu and Zn absorption and retention in animals and humans (Lukaski et al., 2001; Chow,
2007).
A main effect of dietary Zn source was also observed on femur ash mineral content
when pullets were 3 weeks of age (Table 2.8). Pullets fed diets with Bioplex® Zn had
reduced copper content in femur ash compared to pullets fed diets with ZnO. This may be
due to trace mineral antagonisms. Research with quail has demonstrated antagonism of
dietary Zn on Cu, Fe, and Mn even when supplied at practical levels (Hamilton et al., 1979).
Breeders fed organic Zn produced eggs with lower Cu content giving evidence that trace
mineral antagonisms exist despite mineral form (Sun et al., 2012). Organic Mn antagonism

54
of Zn and Cu retention in tibia and liver tissues have also been reported in broilers (Sunder
et al., 2013).
At 6 weeks of age no effects of diet was observed on tibia length, tibia ash
percentage, femur length, or femur breaking strength (Table 2.9), but an interaction of
dietary FORPLUS™ level and Zn sources was observed for femur ash percentage (Table
2.9), tibia ash Fe content (Table 2.10), femur ash Fe content (Table 2.11), and femur ash
Ca content (Table 2.11). Pullets fed diets with 0% FORPLUS™ + Bioplex® Zn had
increased femur ash percentage, increased Ca content in femur ash, but decreased tibia and
femur ash Fe content compared to all other treatments, except for 2% FORPLUS™ + ZnO
in the case of femur ash Ca content. When dietary n-3 PUFA are elevated it results in
enhanced bone Ca content in quail (Liu et al., 2003) and rats (Claassen et al., 1995). Zinc
is known to have a role in osteoblast proliferation and activity (Seo et al., 2010) and bone
formation (Yamaguchi and Takahashi, 1984; Yamaguchi et al., 1986; Yamaguchi and
Yamaguchi, 1986; Yamaguchi, 1998). In young rats, supplemental Zn sulfate increased
the Ca content in femurs in a dose-dependent manner (Yamaguchi and Takahashi, 1984).
In a later study, organic Zn was found to increase the calcium content of rat femur diaphysis
and metaphysis over ZnO (Yamaguchi et al., 2004). Based on these results, Bioplex® Zn
may aid in inorganic bone formation and calcification. However, as previously discussed
and as reported in other studies, it also may be antagonistic to other trace minerals such as
Cu, Fe, and Mn (Hamilton et al., 1979; Sun et al., 2012; Sunder et al., 2013).
At 6 weeks of age main effects of dietary FORPLUS™ level were observed on tibia
breaking strength (Table 2.9) and tibia ash Zn content (Table 2.10). Pullets fed diets
containing 2% FORPLUS™ had decreased tibia breaking strength and tibia ash Zn content
compared to pullets fed diets without FORPLUS™. The Femur ash Zn content also tended
(P = 0.06) to decrease for pullets fed 2% FORPLUS™. The reduced tibia breaking strength
may be a direct result of lowered Zn content in the bone. As previously mentioned, dietary
lipids can be antagonistic towards trace minerals absorption and retention including Zn
(Lukaski et al., 2001; Chow, 2007).
At 16 weeks of age no effects of pullet diet were observed for tibia breaking
strength, tibia ash percentage, femur ash, or tibia ash mineral content (Table 2.12, Table
2.13). A main effect of dietary Zn source was observed for femur breaking strength (Table

55
2.12) and femur ash Cu content (Table 2.14). Pullets fed diets with Bioplex® Zn had
decreased femur breaking strength and femur ash Cu content compared to pullets fed diets
ZnO. The reduced breaking strength may be a direct consequence of insufficient Cu
content in the bone to support collagen cross linking and consequently bone elasticity
(Oviedo-Rondón et al., 2006; Palacios, 2006; Hart et al., 2017). A main effect of dietary
FORPLUS™ level was also observed on femur ash P content when pullets were 16 weeks
of age (Table 2.14). 2% FORPLUS™ increased femur ash P content compared to 0%
FORPLUS™. These findings are similar to those of Liu et al. (2003), who found increased
P content in quail tibia with dietary n-3 PUFA enhancement with fish oil.
When pullets were 20 weeks of age, diet was not found to affect tibia or femur bone
breaking strength (Table 2.15).
2.4 Summary and Conclusions
Supplementation of dietary FORPLUS™ in broiler breeder pullet diets reduced
early growth performance during the first 5 weeks after hatch but increased skeletal leg
bone length and ash percentage. FORPLUS™ influenced trace mineral content of the bone
by increasing Mn content and decreasing Cu and Zn content. As broiler breeder pullets
entered the growth stage Zn content in the bone continued to be reduced by FORPLUS™
most likely causing a reduction in bone breaking strength. However, as broiler breeders
entered pre-lay phase FORPLUS™ did not affect bone breaking strength and pre-lay BW
was increased.
Bioplex® Zn did not impact growth performance in the starter and grower phase of
broiler breeder pullet rearing. When pullets reached the pre-lay phase, Bioplex® Zn
supplementation increased BW. Bioplex® Zn without FORPLUS™ supplementation
resulted in the best BW Uniformity. It also increased bone ash and bone Ca content early
in the grower phase, however later in the grower phase Bioplex® Zn became antagonist
towards Cu and resulted in reduced bone breaking strength.
The results from this study indicate FORPLUS™ or Bioplex® Zn supplementation
had positive effects on early life bone quality and pre-lay BW, however both products
exhibited trace mineral antagonisms during growth.

56
2.5 Figures and Tables
Table 2.1 Diet and nutrient composition of broiler breeder starter diets
Diet Composition, % Diet 1 Diet 2 Diet 3 Diet 4
Corn 60.1 54.8 60.1 54.8
Soybean meal (48% CP) 25.0 24.0 25.0 24.0
Wheat middlings 11.0 15.4 11.0 15.4
FORPLUS™ - 2.00 - 2.00
Limestone (38% Ca) 1.25 1.25 1.25 1.25
Dicalcium Phosphate 1.72 1.67 1.72 1.67
Salt, iodized 0.38 0.38 0.38 0.38
Vitamin premix1 0.25 0.25 0.25 0.25
ZnO mineral premix2 0.10 0.10 - -
Bioplex® Zn mineral premix3 - - 0.10 0.10
DL-Methionine 0.21 0.22 0.21 0.22
Total 100 100 100 100
Nutrient Composition
AMEn, kcal/kg 2862 2862 2862 2862
Protein, %4 16.0 17.9 19.3 18.8
Ca, %4 0.97 0.97 0.96 0.97
Avail. P, % 0.45 0.45 0.45 0.45
TSAA, %4 0.78 0.77 0.77 0.78
Lysine, %4 1.00 1.02 0.97 1.00
Na, % 0.20 0.20 0.20 0.20
Total Zn, mg/kg4 73.1 77.9 95.5 88.2
Crude Fat, %4 4.83 4.94 4.49 4.82
DHA, %4 0.00 0.33 0.00 0.33
Total n-3 PUFA, %4 0.14 0.45 0.14 0.45
Total n-6 PUFA, %4 2.60 1.97 2.38 1.89
n-6: n-3 PUFA 19.2 4.33 16.9 4.18 1Supplied per kg of diet: 9921 IU of vitamin A, 2756 ICU of vitamin D3, 33 IU
vitamin E, 22.0 µg of vitamin B12, 0.11 mg of biotin, 1.98 mg of vitamin K (as
menadione), 1.98 mg of thiamine, 6.6 mg of riboflavin, 11 mg of d-pantothenic acid,
3.97 mg of vitamin B6, 44 mg of niacin, 1.32 mg of folic acid, 496 mg of choline
2Supplied per kg diet: 0.3mg Se as Ne2SO3, 6mg Cu as CuSO4.H2O, 30mg Fe as
FeSO4.H2O, 60mg Mn as MnSO4.H2O, 40mg Zn as ZnO, 0.5mg I as KIO3 3Supplied per kg diet: 0.3mg Se as Ne2SO3, 6mg Cu as CuSO4.H2O, 30mg Fe as
FeSO4.H2O, 60mg Mn as MnSO4.H2O, 40mg Zn as Bioplex® Zn, 0.5mg I as KIO3 4Analyzed value

57
Table 2.2 Diet and nutrient composition of broiler breeder grower diets
Diet Composition, % Diet 1 Diet 2 Diet 3 Diet 4
Corn 62.1 56.8 62.1 56.8
Soybean meal (48% CP) 17.7 16.7 17.7 16.7
Wheat middlings 16.5 20.8 16.5 20.8
FORPLUS™ - 2.00 - 2.00
Limestone (38% Ca) 1.32 1.32 1.32 1.32
Dicalcium Phosphate 1.45 1.43 1.45 1.43
Salt, iodized 0.38 0.38 0.38 0.38
Vitamin premix1 0.25 0.25 0.25 0.25
ZnO mineral premix2 0.10 0.10 - -
Bioplex® Zn mineral premix3 - - 0.10 0.10
DL-Methionine 0.14 0.14 0.14 0.14
L-Lysine 0.10 0.10 0.10 0.10
Total 100 100 100 100
Nutrient Composition
AMEn, kcal/kg 2865 2865 2865 2865
Protein, %4 17.1 16.2 17.0 17.1
Ca, %4 1.09 1.25 1.12 1.38
Avail. P, % 0.40 0.40 0.40 0.40
TSAA, %4 0.51 0.55 0.66 0.59
Lysine, %4 0.85 0.83 0.94 0.90
Na, % 0.18 0.18 0.18 0.18
Total Zn, mg/kg4 72.8 75.6 84.3 91.9
Crude Fat, %4 5.24 6.98 6.12 7.60
DHA, %4 0.00 0.42 0.01 0.40
Total n-3 PUFA, %4 0.14 0.58 0.16 0.60
Total n-6 PUFA, %4 2.72 2.98 3.22 3.40
n-6: n-3 PUFA 19.7 5.10 20.2 5.65 1Supplied per kg of diet: 9921 IU of vitamin A, 2756 ICU of vitamin D3, 33 IU
vitamin E, 22.0 µg of vitamin B12, 0.11 mg of biotin, 1.98 mg of vitamin K (as
menadione), 1.98 mg of thiamine, 6.6 mg of riboflavin, 11 mg of d-pantothenic acid,
3.97 mg of vitamin B6, 44 mg of niacin, 1.32 mg of folic acid, 496 mg of choline
2Supplied per kg diet: 0.3mg Se as Ne2SO3, 6mg Cu as CuSO4.H2O, 30mg Fe as
FeSO4.H2O, 60mg Mn as MnSO4.H2O, 40mg Zn as ZnO, 0.5mg I as KIO3 3Supplied per kg diet: 0.3mg Se as Ne2SO3, 6mg Cu as CuSO4.H2O, 30mg Fe as
FeSO4.H2O, 60mg Mn as MnSO4.H2O, 40mg Zn as Bioplex® Zn, 0.5mg I as KIO3 4Analyzed value

58
Table 2.3 Diet and nutrient composition of broiler breeder pre-lay diets
Diet Composition, % Diet 1 Diet 2 Diet 3 Diet 4
Corn 68.7 64.9 68.7 64.9
Soybean meal (48% CP) 20.8 20.2 20.8 20.2
Alfalfa meal (17% CP) 3.28 5.76 3.28 5.76
Oyster shell 3.00 3.00 3.00 3.00
FORPLUS™ - 2.00 - 2.00
Limestone (38% Ca) 1.63 1.53 1.63 1.53
Dicalcium Phosphate 1.68 1.68 1.68 1.68
Salt, iodized 0.38 0.38 0.38 0.38
Vitamin premix1 0.25 0.25 0.25 0.25
ZnO mineral premix2 0.25 0.25 - -
Bioplex® Zn mineral premix3 - - 0.25 0.25
DL-Methionine 0.10 0.10 0.10 0.10
Total 100 100 100 100
Nutrient Composition
AMEn, kcal/kg 2850 2850 2850 2850
Protein, %4 16.1 17.4 15.5 16.6
Ca, %4 2.75 2.62 2.09 3.06
Avail. P, % 0.38 0.38 0.38 0.38
TSAA, %4 0.56 0.59 0.51 0.57
Lysine, %4 0.85 0.81 0.71 0.90
Na, % 0.18 0.18 0.18 0.18
Total Zn, mg/kg4 113 113 164 168
Crude Fat, %4 3.44 6.52 6.13 6.85
DHA, %4 0.00 0.35 0.01 0.36
Total n-3 PUFA, %4 0.10 0.52 0.16 0.53
Total n-6 PUFA, %4 1.76 2.72 3.20 3.07
n-6: n-3 PUFA 17.6 5.23 19.8 5.83 1Supplied per kg of diet: 9921 IU of vitamin A, 2756 ICU of vitamin D3, 33 IU
vitamin E, 22.0 µg of vitamin B12, 0.11 mg of biotin, 1.98 mg of vitamin K (as
menadione), 1.98 mg of thiamine, 6.6 mg of riboflavin, 11 mg of d-pantothenic acid,
3.97 mg of vitamin B6, 44 mg of niacin, 1.32 mg of folic acid, 496 mg of choline
2Supplied per kg diet: 0.3mg Se as Ne2SO3, 5mg Cu as CuSO4.H2O, 20mg Fe as
FeSO4.H2O, 75mg Mn as MnSO4.H2O, 40mg Zn as ZnO, 1.5mg I as KIO3 3Supplied per kg diet: 0.3mg Se as Ne2SO3, 5mg Cu as CuSO4.H2O, 20mg Fe as
FeSO4.H2O, 75mg Mn as MnSO4.H2O, 40mg Zn as Bioplex® Zn, 1.5mg I as KIO3 4Analyzed value

59
Table 2.4 Dietary effects of FORPLUS™ level and Zn source on broiler breeder pullet early
growth performance through 3 wk of age
BWG, g/b FI, g/b FC
Main Effect of FORPLUS™ 0% FORPLUS™ 604a 1048a 1.74
2% FORPLUS™ 577b 974b 1.69
SEM 5.37 13.6 0.02
P-value <0.01 <0.01 0.13 Main Effect of Zn Source ZnO 589 1020 1.73
Bioplex® Zn 592 1002 1.69
SEM 5.37 13.6 0.02
P-value 0.78 0.35 0.19 Interaction Effects 0% FORPLUS™ + ZnO 605 1058 1.75
2% FORPLUS™ + ZnO 574 983 1.72
0% FORPLUS™ + Bioplex® Zn 603 1038 1.72
2% FORPLUS™ + Bioplex® Zn 580 965 1.67
SEM 7.59 19.2 0.03
P-value 0.59 0.98 0.65 a,bFor each group of main effects and interaction effects, means within the
same column without common letters are significantly different (P≤0.05)

60
Figure 2.1 Main effect of dietary FORPLUS™ level on broiler breeder pullet body weight
*
*
**
500
750
1000
1250
1500
1750
2000
2250
2500
0 2 4 6 8 10 12 14 16 18 20
BW
, g
Age, Weeks
0% FORPLUS™ 2% FORPLUS™ *P ≤ 0.05**P ≤ 0.01

61
Figure 2.2 Main effect of supplemental Zn source on broiler breeder pullet BW
*
**
500
750
1000
1250
1500
1750
2000
2250
2500
0 2 4 6 8 10 12 14 16 18 20
BW
, g
Age, Weeks
Bioplex® Zn ZnO*P ≤ 0.05
**P ≤ 0.01

62
Table 2.5 Effects of dietary FORPLUS™ level and supplemental Zn source on broiler
breeder BW uniformity from 3-20 wk of age
BW Uniformity, %
Main Effect of FORPLUS™
0% FORPLUS™ 81.9
2% FORPLUS™ 81.6
SEM 1.94
P-value 0.92
Maine Effect of Zn Source
ZnO 81.0
Bioplex® Zn 82.5
SEM 1.94
P-value 0.61
Interaction Effect
0% FORPLUS™ + ZnO 78.3b
2% FORPLUS™ + ZnO 83.8ab
0% FORPLUS™ + Bioplex® Zn 85.5a
2% FORPLUS™ + Bioplex® Zn 79.4ab
SEM 2.18
P-value 0.05 a,bMeans within the same column without common letters
are significantly different (P≤0.05)

63
Table 2.6 Effects of dietary FORPLUS™ level and supplemental Zn source on broiler breeder pullet leg bone length, breaking strength,
and ash percentage at 3 wk of age
Tibia Femur
Length,
mm
Breaking
Strength,
kg force
Ash, %
Length,
mm
Breaking
Strength,
kg force
Ash, %
Main Effect of FORPLUS™
0% FORPLUS™ 65.2 17.1 54.3 48.9b 10.5 53.1b
2% FORPLUS™ 65.6 17.1 55.2 50.0a 11.9 54.5a
SEM 0.48 1.37 0.33 0.25 1.05 0.29
P-value 0.53 0.77 0.08 <0.01 0.35 <0.01
Main Effect of Zn Source
ZnO 65.4 16.5 54.7 49.6 10.0 53.6
Bioplex® Zn 65.4 18.2 54.9 49.3 12.4 54.1
SEM 0.48 1.37 0.33 0.25 1.05 0.29
P-value 0.92 0.41 0.56 0.33 0.13 0.26
Interaction Effects
0% FORPLUS™ + ZnO 65.0 15.1 54.1 48.8 9.30 52.7
2% FORPLUS™ + ZnO 65.8 18.0 55.3 50.5 10.7 54.5
0% FORPLUS™ + Bioplex® Zn 65.3 19.1 54.6 49.0 11.7 53.5
2% FORPLUS™ + Bioplex® Zn 65.4 17.4 55.3 49.5 13.2 54.6
SEM 0.67 1.94 0.47 0.35 1.49 0.41
P-value 0.64 0.26 0.78 0.09 1.00 0.35 a,bFor each group of main effects and interaction effects, means within the same column without common letters are
significantly different (P≤0.05)

64
Table 2.7 Effects of dietary FORPLUS™ level and supplemental Zn source on broiler
breeder pullet tibia ash mineral content at 3 wk of age
Cu,
ppm
Fe,
ppm
Mn,
ppm
Zn,
ppm
Ca,
%
P,
%
Main Effect of FORPLUS™
0% FORPLUS™ 8.65a 334 7.38b 454a 37.8 18.6
2% FORPLUS™ 8.26b 372 8.38a 420b 37.9 18.6
SEM 0.13 17.0 0.18 9.71 0.12 0.06
P-value 0.05 0.14 <0.01 0.03 0.61 0.54
Main Effect of Zn Source
ZnO 8.59 356 7.89 432 37.7 18.6
Bioplex® Zn 8.32 349 7.87 442 37.9 18.6
SEM 0.13 17.0 0.18 9.71 0.12 0.06
P-value 0.15 0.77 0.96 0.49 0.18 0.37
Interaction Effects
0% FORPLUS™ + ZnO 8.82 327 7.29 446 37.7 18.6
2% FORPLUS™ + ZnO 8.36 386 8.49 419 37.7 18.6
0% FORPLUS™ + Bioplex® Zn 8.47 341 7.47 463 37.9 18.6
2% FORPLUS™ + Bioplex® Zn 8.17 357 8.28 421 38.0 18.5
SEM 0.18 24.1 0.25 13.7 0.17 0.08
P-value 0.67 0.39 0.45 0.60 0.86 0.43 a,bFor each group of main effects and interaction effects, means within the same column
without common letters are significantly different (P≤0.05)

65
Table 2.8 Effects of dietary FORPLUS™ level and supplemental Zn source on broiler
breeder pullet femur ash mineral content at 3 wk of age
Cu,
ppm
Fe,
ppm
Mn,
ppm
Zn,
ppm
Ca,
%
P,
%
Main Effect of FORPLUS™
0% FORPLUS™ 8.60 399 7.97 474a 37.7 18.5
2% FORPLUS™ 8.37 399 8.71 438b 37.9 18.5
SEM 0.12 19.9 0.26 9.51 0.09 0.04
P-value 0.21 1.00 0.06 0.02 0.14 0.50
Main Effect of Zn Source
ZnO 8.67a 410 8.55 453 37.7 18.5
Bioplex® Zn 8.30b 389 8.14 459 37.9 18.5
SEM 0.12 19.9 0.26 9.51 0.09 0.04
P-value 0.05 0.47 0.28 0.67 0.19 0.62
Interaction Effects
0% FORPLUS™ + ZnO 8.78 418 8.32 468 37.6 18.5
2% FORPLUS™ + ZnO 8.56 402 8.77 438 37.8 18.5
0% FORPLUS™ + Bioplex® Zn 8.41 381 7.62 480 37.8 18.5
2% FORPLUS™ + Bioplex® Zn 8.19 397 8.65 438 38.0 18.6
SEM 0.17 28.1 0.36 13.5 0.13 0.05
P-value 0.98 0.57 0.44 0.65 0.77 0.81
a,bFor each group of main effects and interaction effects, means within the same column
without common letters are significantly different (P≤0.05)

66
Table 2.9 Effects of dietary FORPLUS™ level and supplemental Zn source on broiler breeder pullet leg bone length, breaking strength,
and ash percentage at 6 wk of age
Tibia Femur
Length,
mm
Breaking
Strength,
kg force
Ash, %
Length,
mm
Breaking
Strength,
kg force
Ash, %
Main Effect of FORPLUS™
0% FORPLUS™ 88.7 17.9a 55.6 67.8 16.0 53.5
2% FORPLUS™ 87.7 15.7b 55.2 64.0 14.8 53.6
SEM 0.75 0.66 0.30 2.23 0.79 0.39
P-value 0.34 0.04 0.42 0.26 0.30 0.84
Main Effect of Zn Source
ZnO 87.7 16.5 55.5 67.2 16.2 53.3
Bioplex® Zn 88.7 17.0 55.4 64.6 14.7 53.8
SEM 0.75 0.66 0.30 2.23 0.79 0.39
P-value 0.35 0.59 0.78 0.43 0.19 0.43
Interaction Effects
0% FORPLUS™ + ZnO 88.0 17.1 55.3 67.6 16.1 52.5b
2% FORPLUS™ + ZnO 87.4 18.6 55.7 15.9 66.7 54.1ab
0% FORPLUS™ + Bioplex® Zn 89.5 15.9 55.9 18.6 67.9 54.4a
2% FORPLUS™ + Bioplex® Zn 88.0 15.5 54.8 67.4 13.4 53.1ab
SEM 1.06 0.93 0.42 0.52 1.11 0.55
P-value 0.69 0.34 0.09 0.71 0.22 0.02 a,bFor each group of main effects and interaction effects, means within the same column without common letters are
significantly different (P≤0.05)

67
Table 2.10 Effects of dietary FORPLUS™ level and supplemental Zn source on broiler
breeder pullet tibia ash mineral content at 6 wk of age
Cu,
ppm
Fe,
ppm
Mn,
ppm
Zn,
ppm
Ca,
%
P,
%
Main Effect of FORPLUS™
0% FORPLUS™ 9.81 322 10.8 382a 38.3 19.2
2% FORPLUS™ 9.70 339 10.3 362b 38.2 19.2
SEM 0.19 19.5 0.36 6.43 0.11 0.05
P-value 0.70 0.54 0.32 0.05 0.67 0.28
Main Effect of Zn Source
ZnO 9.63 336 10.4 363 38.3 19.3
Bioplex® Zn 9.88 325 10.6 381 38.1 19.1
SEM 0.19 19.5 0.36 6.43 0.11 0.05
P-value 0.37 0.70 0.69 0.08 0.19 0.06
Interaction Effects
0% FORPLUS™ + ZnO 9.66 367a 10.5 379 38.3 19.3
2% FORPLUS™ + ZnO 9.59 305ab 10.3 348 38.3 19.2
0% FORPLUS™ + Bioplex® Zn 9.95 276b 11.1 385 38.2 19.2
2% FORPLUS™ + Bioplex® Zn 9.81 374a 10.2 376 38.0 19.1
SEM 0.27 27.6 0.50 9.09 0.15 0.08
P-value 0.90 0.01 0.52 0.26 0.66 0.80 a,bFor each group of main effects and interaction effects, means within the same column
without common letters are significantly different (P≤0.05)

68
Table 2.11 Effects of dietary FORPLUS™ level and supplemental Zn source on broiler
breeder pullet femur ash mineral content at 6 wk of age
Cu,
ppm
Fe,
ppm
Mn,
ppm
Zn,
ppm
Ca,
%
P,
%
Main Effect of FORPLUS™
0% FORPLUS™ 10.1 439 10.3 396 37.8 19.0
2% FORPLUS™ 9.91 436 10.6 381 37.9 19.0
SEM 0.13 21.8 0.24 5.17 0.08 0.04
P-value 0.37 0.93 0.30 0.06 0.48 0.85
Main Effect of Zn Source
ZnO 9.95 446 10.3 382 37.9 19.0
Bioplex® Zn 10.1 429 10.6 394 37.8 19.0
SEM 0.13 21.8 0.24 5.17 0.08 0.04
P-value 0.56 0.60 0.50 0.12 0.95 0.54
Interaction Effects
0% FORPLUS™ + ZnO 9.97 487a 10.4 391 37.6b 19.1
2% FORPLUS™ + ZnO 9.92 404ab 10.3 373 38.1a 19.0
0% FORPLUS™ + Bioplex® Zn 10.2 390b 10.1 401 38.0a 18.9
2% FORPLUS™ + Bioplex® Zn 9.90 468ab 11.0 388 37.7b 19.0
SEM 0.19 29.7 0.33 7.31 0.11 0.06
P-value 0.50 0.03 0.17 0.76 <0.01 0.19
a,bFor each group of main effects and interaction effects, means within the same column
without common letters are significantly different (P≤0.05)
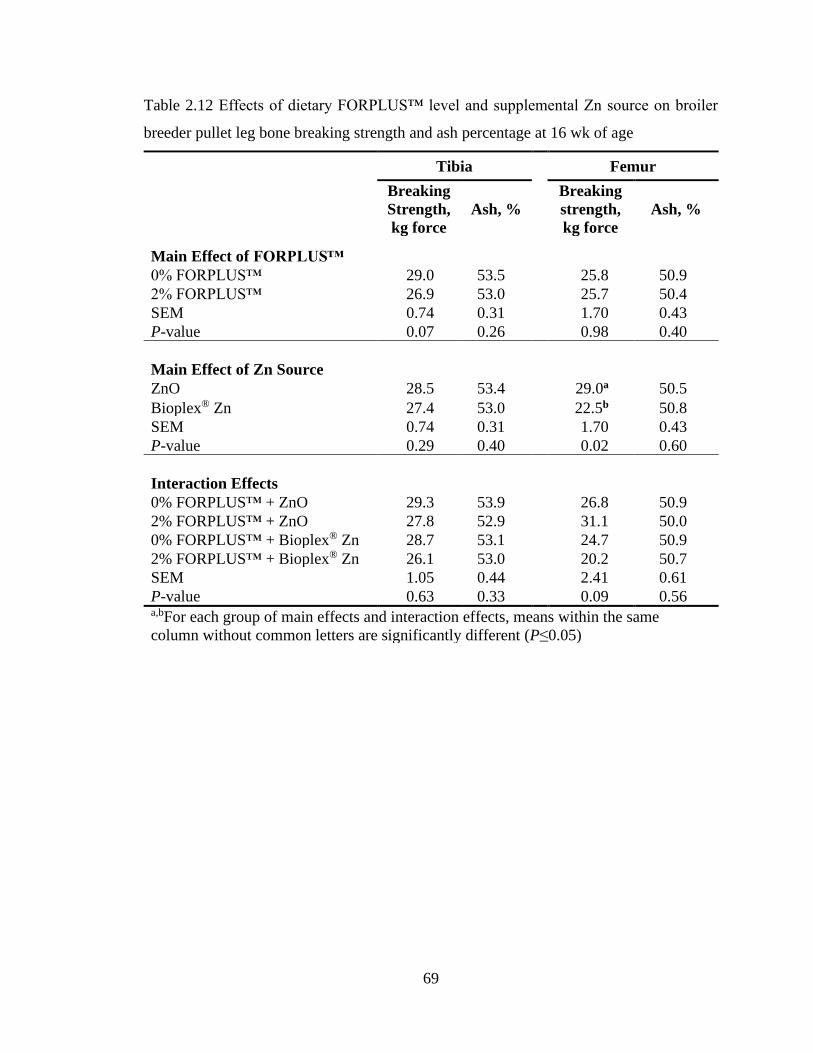
69
Table 2.12 Effects of dietary FORPLUS™ level and supplemental Zn source on broiler
breeder pullet leg bone breaking strength and ash percentage at 16 wk of age
Tibia Femur
Breaking
Strength,
kg force
Ash, %
Breaking
strength,
kg force
Ash, %
Main Effect of FORPLUS™
0% FORPLUS™ 29.0 53.5 25.8 50.9
2% FORPLUS™ 26.9 53.0 25.7 50.4
SEM 0.74 0.31 1.70 0.43
P-value 0.07 0.26 0.98 0.40
Main Effect of Zn Source
ZnO 28.5 53.4 29.0a 50.5
Bioplex® Zn 27.4 53.0 22.5b 50.8
SEM 0.74 0.31 1.70 0.43
P-value 0.29 0.40 0.02 0.60
Interaction Effects
0% FORPLUS™ + ZnO 29.3 53.9 26.8 50.9
2% FORPLUS™ + ZnO 27.8 52.9 31.1 50.0
0% FORPLUS™ + Bioplex® Zn 28.7 53.1 24.7 50.9
2% FORPLUS™ + Bioplex® Zn 26.1 53.0 20.2 50.7
SEM 1.05 0.44 2.41 0.61
P-value 0.63 0.33 0.09 0.56 a,bFor each group of main effects and interaction effects, means within the same
column without common letters are significantly different (P≤0.05)

70
Table 2.13 Effects of dietary FORPLUS™ level and supplemental Zn source on broiler
breeder pullet tibia ash mineral content at 16 wk of age
Cu,
ppm
Fe,
ppm
Mn,
ppm
Zn,
ppm
Ca,
%
P,
%
Main Effect of FORPLUS™
0% FORPLUS™ 8.88 256 5.74 267 39.0 18.5
2% FORPLUS™ 8.81 281 5.82 277 39.2 18.7
SEM 0.23 18.0 0.21 8.91 0.20 0.10
P-value 0.84 0.34 0.79 0.44 0.60 0.36
Main Effect of Zn Source
ZnO 9.00 282 5.84 271 39.2 18.7
Bioplex® Zn 8.70 255 5.72 273 39.0 18.5
SEM 0.23 18.0 0.21 8.91 0.20 0.10
P-value 0.38 0.31 0.69 0.87 0.64 0.13
Interaction Effects
0% FORPLUS™ + ZnO 9.02 252 5.86 267 39.0 18.6
2% FORPLUS™ + ZnO 8.97 313 5.83 274 39.4 18.8
0% FORPLUS™ + Bioplex® Zn 8.74 260 5.63 266 39.1 18.5
2% FORPLUS™ + Bioplex® Zn 8.66 250 5.82 279 39.0 18.5
SEM 0.33 25.4 0.29 12.6 0.29 0.14
P-value 0.98 0.19 0.73 0.80 0.47 0.34

71
Table 2.14 Effects of dietary FORPLUS™ level and supplemental Zn source on broiler
breeder pullet femur ash mineral content at 16 wk of age
Cu,
ppm
Fe,
ppm
Mn,
ppm
Zn,
ppm
Ca,
%
P,
%
Main Effect of FORPLUS™
0% FORPLUS™ 7.58 308 5.72 263 39.0 18.3b
2% FORPLUS™ 7.58 348 5.90 269 39.0 18.4a
SEM 0.08 16.5 0.26 8.86 0.16 0.05
P-value 0.96 0.11 0.64 0.62 0.99 0.05
Main Effect of Zn Source
ZnO 7.70a 350 5.98 265 39.1 18.4
Bioplex® Zn 7.45b 307 5.63 268 38.9 18.3
SEM 0.08 16.5 0.26 8.86 0.16 0.05
P-value 0.05 0.10 0.36 0.78 0.54 0.20
Interaction Effects
0% FORPLUS™ + ZnO 7.64 314 5.84 267 39.1 18.3
2% FORPLUS™ + ZnO 7.77 385 6.12 262 39.0 18.5
0% FORPLUS™ + Bioplex® Zn 7.52 303 5.60 259 38.9 18.3
2% FORPLUS™ + Bioplex® Zn 7.38 312 5.67 277 38.9 18.3
SEM 0.11 23.4 0.36 12.5 0.22 0.07
P-value 0.27 0.22 0.78 0.35 0.75 0.43 a,bFor each group of main effects and interaction effects, means within the same column
without common letters are significantly different (P≤0.05)

72
Table 2.15 Effects of dietary FORPLUS™ level and supplemental Zn source on broiler
breeder pullet bone breaking strength at 20 wk of age
Tibia breaking
strength, kg force
Femur breaking
strength, kg force
Main Effect of FORPLUS™ 0% FORPLUS™ 37.5 31.3
2% FORPLUS™ 36.5 29.6
SEM 2.26 2.82
P-value 0.76 0.68
Main Effect of Zn Source
ZnO 39.3 31.0
Bioplex® Zn 34.7 29.9
SEM 2.26 2.82
P-value 0.18 0.80
Interaction Effects
0% FORPLUS™ + ZnO 39.9 32.8
2% FORPLUS™ + ZnO 38.6 29.2
0% FORPLUS™ + Bioplex® Zn 35.0 29.8
2% FORPLUS™ + Bioplex® Zn 34.3 30.0
SEM 3.20 3.99
P-value 0.92 0.65

73
CHAPTER 3. Effects of Dietary Microalgae Level and Zn Source Supplementation on
Broiler Breeder Egg Quality, Production, Fertility, and Hatchability of Offspring
ABSTRACT
Supplemental omega-3 (n-3) polyunsaturated fatty acids (PUFA) and zinc (Zn) are known
to beneficial for broiler egg production and offspring development. However, there is
limited information is available on the effects of dietary n-3 PUFA supplementation and
Zn source on broiler breeder egg quality and reproduction. FORPLUS™ (Alltech, Inc.) is
an unextracted, whole-cell microalgae (Aurantiochytrium limacinum CCAP 4087/2)
source of n-3 PUFA and DHA in particular. Bioplex® Zn (Alltech, Inc.) is a Zn-proteinate
product that is more bioavailable to poultry than some other sources of inorganic Zn. A
2x2 factorial, randomized complete block study was designed to evaluate the dietary effects
of FORPLUS™ level (0% vs 2%) and Zn source (Bioplex® Zn vs ZnO) on broiler breeder
egg quality, egg production, fertility and hatchability of offspring. The 4 dietary treatments
were 1) corn-soybean meal based diet + 40 mg ZnO/kg diet, 2) diet 1 + 2% FORPLUS™,
3) corn-soybean meal based diet + 40 mg Bioplex® Zn/kg diet, 4) Diet 3 + 2%
FORPLUS™. A total of 240 Cobb 500™ broiler breeder hens and 20 roosters were
randomly assigned to each dietary treatment resulting in 5 replicate floor pen groups of 12
broiler breeder hens plus 1 broiler breeder rooster. Egg quality variables were measured
at 24, 32, and 36 wk of lay. Whole egg mineral content was measured at 24 and 32 wk of
lay. Hen day production (HDP) was monitored throughout lay. Fertility and hatchability
were determined when broiler breeders were 19-20, 30-31, 35-37, and 41-43 wk of lay. At
24 wk of lay interaction effects and main effects of broiler breeder dietary factors were
observed on egg quality. Breeder hens fed diets containing 2% FORPLUS™ + ZnO
produced eggs with the lowest (P≤0.05) egg weight (wt.) and yolk wt. compared to breeder
hens fed other diets. However, breeder hens fed diets with 2% vs 0% FORPLUS™ had
increased (P≤0.05) eggshell % and eggshell breaking strength. Main effects of dietary
FORPLUS™ level were observed on egg quality when breeders were at 32 and 36 weeks
of lay. Breeder hens fed diets with 2% vs 0% FORPLUS™ produced eggs with lower
(P≤0.05) egg wt. and yolk wt., but greater (P≤0.05) eggshell %. Main effects of dietary

74
FORPLUS™ level or Zn source were observed on breeder egg mineral content at 25 and
32 wk of age. At 25 wk of age 2% vs 0% FORPLUS™ increased (P≤0.05) egg Mn content,
but by 32 wk of age egg Cu, Zn, Se, Ca, and P contents were significantly reduced (P≤0.05)
by 2% FORPLUS™. Bioplex® Zn also reduced (P≤0.05) egg Cu content at 25 wk of age.
ZnO had the main effect of increased (P≤0.05) HDP during post-peak lay. Breeder diet
did not affect offspring fertility or hatchability variables during 19-20 wk of lay. Diets
with FORPLUS™ reduced (P≤0.05) hatchability at 30-31 of lay. Diets with 0%
FORPLUS™ + ZnO had the lowest (P≤0.05) hatch of fertile and highest (P≤0.05) no pip
% compared to other breeder diets at 35-37 and 41-43 wk of lay. In summary, dietary
FORPLUS™ supplementation and Zn source had the greatest effect on broiler breeder
reproduction during post-peak lay. Broiler breeder FORPLUS™ supplementation
negatively affected egg size and egg mineral contents, while supplementation with 2%
FORPLUS™ or Bioplex® Zn improved hatchability of offspring during post-peak lay.
Furthermore, ZnO supplementation may be beneficial for post-peak HDP.

75
3.1 Introduction
During the embryonic growth a broiler’s sole nutrient source comes from the
nutrients deposited into the egg yolk, albumin, shell membrane and shell by the broiler
breeder hen (Romanoff and Romanoff, 1967; Richards, 1997; Yair and Uni, 2011). The
majority of energy, protein, fatty acids, minerals, and vitamins used for embryonic
development are located in the yolk (White, 1987; Noble and Cocchi, 1990; Richards,
1997; Speake et al., 1998; Angel, 2007; Cherian, 2008; Yair and Uni, 2011) and eggshell
(Yair and Uni, 2011). Many of the aforementioned nutrients in the egg are known to be
affected by breeder diet (Lunven et al., 1973; Naber, 1979; Mattila et al., 1999; Kidd, 2003;
Cherian, 2008; Cherian et al., 2009; Torres and Korver, 2018). Previous research has
demonstrated that the fatty acid profile of egg yolk and offspring tissues can be changed
by altering the dietary polyunsaturated fatty acids (PUFA) content in broiler breeder diets
(Lin et al., 1991; Pappas et al., 2006; Hall et al., 2007; Cherian, 2008; Bautista-Ortega et
al., 2009; Cherian et al., 2009; Koppenol et al., 2014; Koppenol et al., 2015a). Several
studies have reported the effects of omega-3 (n-3) PUFA on breeder egg quality (Pappas
et al., 2005; Cherian, 2008; Koppenol et al., 2014), fertility and hatchability (Koppenol et
al., 2015c). However, there is very little information on the effects of alternative sources
of n-3 PUFA such as microalgae on egg quality, fertility, and hatchability. Furthermore,
there is limited research on long-term effects of dietary n-3 PUFA on hen production.
FORPLUS™ (Alltech, Inc.) is an unextracted, whole-cell microalgae (Aurantiochytrium
limacinum CCAP 4087/2) source of n-3 PUFA. It contains 64% fat with 16% of that fat
as docosahexaenoic acid (DHA). Microalgae rich in n-3 PUFA may be considered as a
sustainable, alternative to fish oil which is a common source of n-3 PUFA in poultry diets.
Zinc (Zn) is an essential trace element and nutrient that has important roles in
numerous biochemical and metabolic functions such as cell growth and proliferation, cell
differentiation, gene expression, and immunity (Vallee and Falchuk, 1993; Plum et al.,
2010; Haase and Rink, 2014a, b). Research indicates that Zn deposition into eggs increases
as hens age (Sun et al., 2010), but eventually peaks and then declines (Favero et al., 2013).
A short-term supplementation of organic vs inorganic Zn source did not affect broiler
breeder fertility or offspring hatchability (Kidd et al., 1992). In contrast, long-term
supplementation of organic Zn in breeder diets resulted in improved reproductive

76
performance over inorganic Zn (Hudson et al., 2004), but the supplemental Zn levels were
also different in the short-term and long-term studies. Regardless, there is still a lack of
long-term studies evaluating effects of Zn supplementation and Zn source on broiler
breeder reproductive performance (Salim et al., 2008). Bioplex® Zn (Alltech, Inc.) is a Zn-
proteinate product that is more bioavailable to poultry than some other sources of inorganic
Zn (Ao et al., 2006; Ao et al., 2011). The objective of this study was to evaluate two levels
of dietary FORPLUS™ and two sources of Zn on broiler breeder egg quality, egg
production, fertility, and hatchability.
3.2 Materials and Methods
This study was conducted in accordance with the University of Kentucky
Institutional Animal Care and Use Committee protocols.
3.2.1 Experimental Design
A complete randomized block design with a 2x2 factorial treatment arrangement
consisting of 2 levels of microalgae supplementation (0% vs 2% FORPLUS™) and two
sources of supplemental Zn (ZnO vs Bioplex® Zn) was used for this study. A total of 440,
one day old Cobb 500™ broiler breeder pullet chicks and 70, one day old Cobb 500™
broiler breeder male chicks were obtained from a local hatchery (Cobb-Vantress,
Monticello, KY) and randomly assigned to four dietary treatments. The pullet chicks were
divided into 5 replicate floor pen groups per dietary treatment with 22 pullets per group.
Initially, the male broiler breeder chicks were housed separately with 1 group per dietary
treatment consisting of 17 or 18 chicks. Before the onset of lay, the number of pullets was
reduced to 240 and 1 broiler breeder male was randomly assigned to a pen of breeder pullets
with respect to dietary treatment. This resulted in 5 replicate floor pen groups of 12 broiler
breeder hens plus 1 broiler breeder rooster per dietary treatment.
The four dietary treatments were 1) corn-soybean meal based diet + 40 mg ZnO/kg
diet, 2) diet 1 + 2% FORPLUS™, 3) corn-soybean meal based diet + 40 mg Bioplex®
Zn/kg diet, 4) Diet 3 + 2% FORPLUS™. Dietary treatments were formulated to meet or
exceed the energy and nutrient requirements (NRC, 1994) before lay, during peak lay (1-

77
27 weeks of lay), and during post-peak lay (27-45 weeks of lay) (Table 3.1 and Table 3.2).
Broiler breeders were provided ad libitum access to feed and water via a hanging feeder
and hanging nipple drinkers for the first three weeks after placement. Afterwards a daily
feeding regimen was implemented as per the Cobb® Breeder Management Guide (Cobb-
Vantress, 2012). Feed allotment was then provided daily in a feeding trough.
The broiler breeders were housed in floor pen units that measured approximately
1.22 x 1.83 sq. meters. The litter for each pen was 100% large flake, pine wood shavings
supplied at approximately 3.66 cu. meters per pen and refreshed as needed. Broiler
breeders were raised in an ambient temperature range of 18.3 to 29.4 °C. At 20 weeks of
age, a two-tier nest box that could accommodate up to four birds at a time was added to
each pen. From 19-23 weeks of age (pre-lay to onset of lay), daily photostimulation was
gradually increased from 9 hours of light to 15 hours of light. Photostimulation was then
maintained at 15 hours of light and 9 hours of darkness for the remainder of the study.
3.2.2 Egg Quality
When broiler breeder hens were at peak lay (24 weeks of lay) and post-peak lay (32
and 36 weeks of lay) 6 eggs from each floor pen were collected for egg quality analysis.
Individual egg quality measurements were obtained and then averaged by pen. At each
collection, egg weights were recorded. Eggshell breaking strength for was obtained using
an Egg Forcer Reader™ (Orka Food Technology, Ltd.). Eggs were then opened and
transferred to a flat, level surface to measure albumin height with a TSS QCD Ranger Super
System (Technical Services and Supplies, York, England). Albumen heights and egg
weights were used for the calculation of the Haugh Unit, a measure of egg freshness. Egg
yolks were then separated from the albumen to obtain the yolk weight. Eggshells were
cleared of albumin residues by rinsing in lukewarm tap water and allowed to dry at room
temperature. Afterwards, eggshell weight was recorded for the calculation of eggshell
percentage, which was expressed as a percentage of the egg weight.
Egg mineral analysis was obtained when hens were at peak lay (24 weeks of lay)
and post-peak lay (32 weeks of lay). Contents from 2 eggs per breeder floor pen were
homogenized. Approximately 1 gram of egg homogenate was microwave digested (CEM
Microwave Accelerated Reaction System 6) in 55 ml Teflon digestion tubes containing 10

78
ml concentrated, nitric acid (Optima™ grade, Fisher Scientific), 2 ml 30% (w/w) hydrogen
peroxide (Supelco, Inc., Bellefonte, PA), and 10 ml of deionized water. Acid digested
samples were then diluted to with deionized water for trace mineral analysis via inductively
coupled plasma-mass spectrophotometer (Agilent Technologies Inc., ICP-MS, model
7700x), whereas Ca, and P were analyzed via using inductively coupled plasma-optical
emission spectrum (Agilent Technologies Inc., ICP-OES, model 5110).
3.2.3 Hen Day Production
A daily log of eggs laid by broiler breeder hens was kept from 1-45 weeks of lay
(21-65 weeks of age). The total number of eggs laid within a four-week period by breeder
pen was calculated. Hen day production (HDP) was calculated and expressed as a
percentage of total eggs laid by the number of hens in each floor pen within the four-week
period and corrected for mortality. Hen day production was also calculated for peak (1-27
weeks of lay), post-peak (28-45 weeks of lay), and overall (1-45 weeks of lay) lay with
corrections for mortality.
3.3.4 Fertility and Hatchability
Eggs were collected from each breeder pen during 19-20 weeks of lay (peak lay),
30-31 weeks of lay (post-peak lay), 35-37 weeks of lay (post-peak lay), and 41-43 weeks
of lay (post-peak lay). When breeders were at 20-21 weeks of lay, a total of 45 eggs were
collected from each pen. When breeders were 30-31 and 35-37 weeks of lay, a total of 60
eggs were collected from each pen. When breeders were 41-43 weeks of lay, a total of 50
eggs were collected from each pen. At each collection time point, the eggs were set in a
Nature Form Incubator (model 4680). Eggs were incubated by pen by using a separate
incubator trays. The incubator temperature was set to 37.5°C and relative humidity was
set to 60%. On embryonic day 18, eggs were transferred to a Nature Form Hatcher (model
45) where the temperature was set to 36.9°C and relative humidity was set to 64%. Eggs
were grouped and labeled by pen using wooden dividers in hatcher trays.
The number of fertile eggs was determined on embryonic day 10 by candling.
Fertility was calculated and expressed as percentage of total eggs set. The number of dead

79
embryos was determined by candling on embryonic day 10 and embryonic day 18. For
eggs collected when breeders were 35-37 weeks of lay, the number of dead embryos was
determined by candling on embryonic day 10 only. Embryo mortality was calculated and
expressed as a percentage of the number of eggs set. After 21 days of incubation
hatchability was determined by counting the number of chicks hatched and expressing it
as a percentage of total eggs set. Hatch of fertile eggs was calculated and expressed as a
percentage of chicks hatched from the number of fertile eggs. The percentage of chicks
that did not pip (no pip), pipped but died before emerging from the eggshell (pip dead),
and pipped and were still alive (pip alive) were determined and expressed as a percentage
of the number of fertile eggs.
3.3.5 Statistical Analysis
All data for this study were subjected to a two-way analysis of variance using the
general linear model procedures of SAS® Software, version 9.4 (SAS, 2016). The model
assumed the fixed effect of block by experimental unit (floor pen) location for egg quality
and hen day production data or the fixed effect of block by incubator tray location for
fertility and hatchability data. The model also included the main effect of dietary
FORPLUS™ level, the main effect of supplemental Zn source and the interaction effect of
both factors. Mean values were separated and compared using Fisher’s protected least
significant difference test. Mean values were declared significantly different for P values
≤ 0.05.
3.3 Results and Discussion
3.3.1 Egg Quality
When broiler breeder hens were at 24 weeks of lay (peak lay) interaction effects of
dietary FORPLUS™ level and Zn source were observed for egg weight and yolk weight
(Table 3.3). Breeder hens fed diets containing 2% FORPLUS™ + ZnO produced eggs
with the lowest egg weight and yolk weight compared to breeder hens fed other diets,
indicating that the eggs they produced were smaller. Highest egg weight and yolk weight
were observed in hens fed diets containing 0% FORPLUS™ + ZnO while the other dietary

80
treatments containing Bioplex® Zn resulted in intermediate egg weight and yolk weight.
These results are in agreeance with published reports of hens fed diets enriched with n-3
PUFA or DHA had reduced egg weight and yolk weight during lay (Pappas et al., 2005;
Cherian, 2008; Koppenol et al., 2014). This phenomenon may be explained in part by the
effect of increased n-3 PUFA in the diet and its effect on yolk lipid synthesis. Increased
dietary n-3 PUFA has been cited to interfere with the liver production of very low density
lipid proteins (VLDL) (Vance and Vance, 1990), which are then secreted in large amounts
during lay and become a major component of egg yolks (Noble and Cocchi, 1990; Speake
et al., 1998). If VLDL synthesis is decreased this may result in less yolk deposition which
may explain the lower yolk weight and egg weights observed in the previous studies and
the current study.
At 24 weeks of lay main effects of dietary FORPLUS™ level were also observed
on eggshell percentage and eggshell breaking strength (Table 3.3). Broiler breeder hens
fed diets with 2% FORPLUS™ produced eggs with increased eggshell percentage and
eggshell breaking strength compared hens fed diets without FORPLUS™. In laying hens,
n-3 enriched eggs have been shown to have greater eggshell percentage compared to eggs
not enriched with n-3 PUFA (Samman et al., 2009), although dietary lipid source has been
reported to have variable influence on eggshell quality (Ahmad et al., 2012). The eggshell
is mainly comprised of Ca, but has inorganic and organic layers that provides stiffness and
elasticity (Solomon, 2010). It is possible that dietary FORPLUS™ altered the eggshell
ultrastructure formation in a way that was conducive to bear greater load forces.
Main effects of dietary FORPLUS™ were observed on egg weight, yolk, weight
and eggshell percentage during post-peak lay when breeders were at 32 and 36 weeks of
lay (Table 3.4 and Table 3.5) . Breeder hens fed diets with 2% FORPLUS™ continued to
produce eggs with lower egg weight, lower yolk weight, but greater eggshell percentage
compared to hens fed diets without FORPLUS™. As previously mentioned, this may be
due to reduced egg yolk formation from suppression of VLDL synthesis by dietary n-3
PUFA (Vance and Vance, 1990) and effects of dietary n-3 PUFA on eggshell formation
and ultrastructure.
Main effects of dietary FORPLUS™ level and Zn source were observed on whole
egg mineral content during peak lay when or when hens were at 25 weeks of lay (Table
81
3.6). Breeder hens fed diets with Bioplex® Zn had lower egg copper content compared to
hens fed diets with ZnO. Organic Zn in breeder diets have been reported to lower Cu
content in eggs (Sun et al., 2012) indicating a trace mineral antagonism exists. Breeder
hens fed diets with 2% FORPLUS™ produced eggs with a higher Mn content compared
to breeder hens fed diets without FORPLUS™. Dietary PUFA was demonstrated to
enhance Mn absorption and retention in rat tissues (Finley and Davis, 2001). In Chapter
2, 2% FORPLUS™ also increased Mn retention in the broiler breeder femur during the
pullet rearing phase. Increased Mn retention in broiler breeder tissues may lead to
increased Mn deposition into eggs produced.
By 32 weeks of lay (post-peak lay) only main effects of FORPLUS™ were
observed on whole egg mineral content (Table 3.7). Dietary inclusion of 2% vs 0%
FORPLUS™ in breeder diets significantly reduced (P≤0.05) Cu, Zn, Se, Ca, and P egg
content. Increased dietary PUFA has been linked to decreased Cu and Zn absorption and
retention in animals and humans (Lukaski et al., 2001; Chow, 2007). Mineral content of
laying hen eggs was also shown to be altered due to manipulation of dietary n-3 PUFA
(Aydin et al., 2001). It is also possible that the combination of high Ca content and
increased PUFA in the broiler breeder post-peak layer diet formed a soap during digestion
rendering nutrients, including certain minerals unavailable for absorption and
incorporation into egg yolks.
3.3.2 Hen Day Production
During post-peak lay a main effect of dietary Zn source was observed on HDP. As
depicted in Figure 3.1, broiler breeder hens fed diets with ZnO had greater (P≤0.05) HDP
during 25-28 weeks of lay (57.0 vs 52.8%) and greater (P≤0.01) HDP during 37-40 weeks
of lay. This effect of ZnO on HDP production was only observed during the post-peak lay
and during peak lay. Diets containing ZnO also had an elevated level of Ca possibly due
to a feed mixing error. Increased Ca to P ratios in broiler breeder diets can improve HDP
(Wilson et al., 1980). The additional Ca in the ZnO diets may have contributed to improved
HDP. Throughout the entire laying period, broiler breeder dietary treatment did not affect
HDP.

82
3.3.3 Fertility and Hatch of Offspring
During peak lay, specifically at 19-20 weeks of lay, no effects of broiler breeder
dietary treatment on fertility, embryo mortality, hatchability, hatch of fertile eggs, or
pipping were observed (Table 3.9).
During post-peak lay broiler breeder diet affected offspring hatchability variables.
At 30-31 weeks of lay a main effect of dietary FORPLUS™ level was observed on the
hatchability of offspring (Table 3.10). Breeders who were fed diets containing 2%
FORPLUS™ had significantly increased (P≤0.05) hatchability of offspring (74.0 vs 66.1
%) compared to breeders fed diets without FORPLUS™. At 35-37 weeks of lay and at 41-
43 weeks of lay interaction effects of dietary FORPLUS™ level and Zn source occurred.
When breeders were at 35-37 weeks of lay, breeders fed diets with 0% FORPLUS™ +
ZnO had the lowest hatch of fertile and highest percentage of chicks that did not pip
compared to all other dietary treatments (Table 3.11). When breeders were at 41-43 weeks
of lay broiler breeders fed diets containing 0% FORPLUS™ + ZnO had the lowest hatch
of fertile compared to other diets except 2% FORPLUS™ + Bioplex® Zn (Table 3.12).
The percentage of chicks that did not pip was found to correspond to the hatch of fertile at
35-37 and 41-43 weeks of lay.
The n-3 PUFA profile of breeder eggs reflects the dietary n-3 PUFA content (Lin
et al., 1991; Hall et al., 2007; Cherian, 2008; Koppenol et al., 2014). Altering the egg yolk
fatty acid profile via diet can impact hatchability (Aydin et al., 2001; Aydin and Cook,
2004). Over 90% of the energy the growing embryo utilizes comes from the β-oxidation
of fatty acids in the yolk (Noble and Cocchi, 1990; Speake et al., 1998). DHA was
previously found to be preferred for absorption from the yolk by the developing embryo
(Lin et al., 1991). Acetyl coenzyme A (acetyl-CoA) is produced as fatty acid carbon chains
are being broken down during β-oxidation. Longer chained PUFA have the capacity to
create more acetyl-CoA during the β-oxidation process. Acetyl-CoA can go on to be
metabolized into carbon dioxide (CO2) in the tricarboxylic acid cycle. The CO2 produced
by embryonic β-oxidation of fatty acids increases the air space between the egg. Prior to
hatching, the level of CO2 in the air space increases substantially and becomes a stimulant
for pipping and hatching (Noble and Cocchi, 1990). Although hatchability declines with
breeder age, increased Zn concentration in the egg is linked to increased hatchability (Salim

83
et al., 2008). An organic Zn source was also found to improve hatchability in breeders
over an inorganic Zn source (Hudson et al., 2004). Hatchability was increased with modest
Bioplex® Zn supplementation in quail (El-Samee et al., 2012). It is possible that Bioplex®
Zn improved Zn deposition in the egg as observed in the Hudson et al. (2004) study and
consequently hatch of fertile, however Zn egg content was not evaluated for this study at
the time points when hatch of fertile was improved by Bioplex® Zn.
3.Summary and Conclusions
Throughout lay broiler breeder pullet diets with 2% FORPLUS™ decreased egg
weight and yolk weight but increased eggshell percentage. During peak lay mineral
antagonism was present between Bioplex® Zn and Cu, however that antagonism was not
observed in post-peak lay when Zn deposition into the egg by the hen is greater. ZnO
increased HDP over Bioplex® Zn during post-peak lay. In post-peak lay 2% FORPLUS™
reduced trace mineral, Ca, and P in the egg. In post-peak lay Bioplex® Zn or 2%
FORPLUS™ improved hatchability. Based on these results, FORPLUS™
supplementation in broiler breeder diets negatively impacted egg quality throughout lay,
but improved offspring hatchability in post-peak lay. Bioplex® Zn also improved post-
peak hatchability, but ZnO supplementation was best for post-peak HDP.

84
3.5 Figures and Tables
Table 3.1 Diet and nutrient composition of broiler breeder peak lay diets
Diet Composition, % Diet 1 Diet 2 Diet 3 Diet 4
Corn 67.3 65.0 67.3 65.0
Soybean meal (48% CP) 22.0 21.5 22.0 21.5
Alfalfa meal (17% CP) 0.78 2.02 0.78 2.02
Oyster shell 3.00 3.00 3.00 3.00
FORPLUS™ - 2.00 - 2.00
Soybean oil 0.52 0.08 0.52 0.08
Limestone (38% Ca) 3.80 3.75 3.80 3.75
Dicalcium Phosphate 1.65 1.65 1.65 1.65
Salt, iodized 0.40 0.39 0.40 0.39
Vitamin premix1 0.25 0.25 0.25 0.25
ZnO mineral premix2 0.25 0.25 - -
Bioplex® Zn mineral premix3 - - 0.25 0.25
DL-Methionine 0.10 0.10 0.10 0.10
Total 100 100 100 100
Nutrient Composition
AMEn, kcal/kg 2850 2850 2850 2850
Protein, %4 16.1 15.9 16.1 16.5
Ca, %4 3.72 3.61 3.77 4.07
Avail. P, % 0.41 0.41 0.41 0.41
TSAA, %4 0.52 0.55 0.55 0.56
Lysine, %4 0.90 0.88 0.91 0.90
Na, % 0.18 0.18 0.18 0.18
Total Zn, mg/kg4 84.5 79.4 89.9 94.3
Crude Fat, %4 3.27 4.98 2.69 6.13
DHA, %4 0.00 0.34 0.01 0.39
Total n-3 PUFA, %4 0.09 0.44 0.09 0.51
Total n-6 PUFA, %4 1.63 1.87 1.40 2.34
n-6: n-3 PUFA 17.6 4.24 16.4 4.55 1Supplied per kg of diet: 9921 IU of vitamin A, 2756 ICU of vitamin D3, 33 IU
vitamin E, 22.0 µg of vitamin B12, 0.11 mg of biotin, 1.98 mg of vitamin K (as
menadione), 1.98 mg of thiamine, 6.6 mg of riboflavin, 11 mg of d-pantothenic acid,
3.97 mg of vitamin B6, 44 mg of niacin, 1.32 mg of folic acid, 496 mg of choline
2Supplied per kg diet: 0.3mg Se as Ne2SO3, 5mg Cu as CuSO4.H2O, 20mg Fe as
FeSO4.H2O, 75mg Mn as MnSO4.H2O, 40mg Zn as ZnO, 1.5mg I as KIO3 3Supplied per kg diet: 0.3mg Se as Ne2SO3, 5mg Cu as CuSO4.H2O, 20mg Fe as
FeSO4.H2O, 75mg Mn as MnSO4.H2O, 40mg Zn as Bioplex® Zn, 1.5mg I as KIO3 4Analyzed value

85
Table 3.2 Diet and nutrient composition of broiler breeder post-peak lay diets
Diet Composition, % Diet 1 Diet 2 Diet 3 Diet 4
Corn 69.7 67.0 69.7 67.0
Soybean meal (48% CP) 19.4 18.9 19.4 18.9
Alfalfa meal (17% CP) 0.76 2.34 0.76 2.34
Oyster shell 3.00 3.00 3.00 3.00
FORPLUS™ - 2.00 - 2.00
Soybean oil 0.34 - 0.34 -
Limestone (38% Ca) 4.34 4.28 4.34 4.28
Dicalcium Phosphate 1.50 1.50 1.50 1.50
Salt, iodized 0.40 0.39 0.40 0.39
Vitamin premix1 0.25 0.25 0.25 0.25
ZnO mineral premix2 0.25 0.25 - -
Bioplex® Zn mineral premix3 - - 0.25 0.25
DL-Methionine 0.10 0.10 0.10 0.10
Total 100 100 100 100
Nutrient Composition
AMEn, kcal/kg 2850 2850 2850 2850
Protein, %4 15.7 15.0 14.4 14.2
Ca, %4 4.26 4.30 3.78 3.47
Avail. P, % 0.38 0.38 0.38 0.38
TSAA, %4 0.47 0.52 0.55 0.49
Lysine, %4 0.82 0.83 0.82 0.83
Na, % 0.18 0.18 0.18 0.18
Total Zn, mg/kg4 80.7 78.9 88.9 84.7
Crude Fat, %4 2.75 4.46 2.64 5.37
DHA, %4 0.00 0.30 0.02 0.42
Total n-3 PUFA, %4 0.07 0.38 0.07 0.53
Total n-6 PUFA, %4 1.44 1.67 1.41 1.93
n-6: n-3 PUFA 20.17 4.41 19.1 3.68 1Supplied per kg of diet: 9921 IU of vitamin A, 2756 ICU of vitamin D3, 33 IU
vitamin E, 22.0 µg of vitamin B12, 0.11 mg of biotin, 1.98 mg of vitamin K (as
menadione), 1.98 mg of thiamine, 6.6 mg of riboflavin, 11 mg of d-pantothenic acid,
3.97 mg of vitamin B6, 44 mg of niacin, 1.32 mg of folic acid, 496 mg of choline
2Supplied per kg diet: 0.3mg Se as Ne2SO3, 5mg Cu as CuSO4.H2O, 20mg Fe as
FeSO4.H2O, 75mg Mn as MnSO4.H2O, 40mg Zn as ZnO, 1.5mg I as KIO3 3Supplied per kg diet: 0.3mg Se as Ne2SO3, 5mg Cu as CuSO4.H2O, 20mg Fe as
FeSO4.H2O, 75mg Mn as MnSO4.H2O, 40mg Zn as Bioplex® Zn, 1.5mg I as KIO3 4Analyzed value

86
Table 3.3 Dietary effects of FORPLUS™ level and Zn source on broiler breeder egg quality at 24 weeks of lay
Eggshell breaking
strength, kg force Egg wt., g Yolk wt., g Haugh Unit Eggshell, %
Main Effect of FORPLUS™
0% FORPLUS™ 4.14b 69.2a 21.3a 78.1 9.06b
2% FORPLUS™ 4.43a 66.6b 20.6b 80.9 9.34a
SEM 0.09 0.33 0.21 1.52 0.09
P-value 0.05 <0.01 0.03 0.21 0.04
Main Effect of Zn Source
ZnO 4.23 67.8 21.0 79.6 9.29
Bioplex® Zn 4.35 68.0 20.9 79.4 9.11
SEM 0.09 0.33 0.21 1.52 0.09
P-value 0.40 0.67 0.78 0.95 0.17
Interaction Effects
0% FORPLUS™ + ZnO 3.99 70.0a 21.9a 78.5 9.08
2% FORPLUS™ + ZnO 4.48 65.6c 20.1c 80.6 9.50
0% FORPLUS™ + Bioplex® Zn 4.30 68.4b 20.7bc 77.7 9.04
2% FORPLUS™ + Bioplex® Zn 4.39 67.6b 21.1ab 81.2 9.18
SEM 0.13 0.47 0.29 2.15 0.12
P-value 0.15 0.03 <0.01 0.76 0.27 a,b,cFor each group of main effects and interaction effects, means within the same column without common letters are
significantly different (P≤0.05)

87
Table 3.4 Dietary effects of FORPLUS™ level and Zn source on broiler breeder egg quality at 32 weeks of lay
Eggshell breaking
strength, kg force Egg wt., g Yolk wt., g Haugh Unit Eggshell, %
Main Effect of FORPLUS™
0% FORPLUS™ 4.34 71.5a 23.7a 67.6 9.26b
2% FORPLUS™ 4.28 68.2b 22.3b 71.1 9.48a
SEM 0.07 0.44 0.26 1.39 0.07
P-value 0.58 <0.01 <0.01 0.10 0.05
Main Effect of Zn Source
ZnO 4.32 69.8 23.2 68.7 9.42
Bioplex® Zn 4.31 69.9 22.8 70.0 9.32
SEM 0.07 0.44 0.26 1.39 0.07
P-value 0.89 0.91 0.27 0.51 0.38
Interaction Effects
0% FORPLUS™ + ZnO 4.32 71.3 23.9 67.3 9.27
2% FORPLUS™ + ZnO 4.32 68.3 22.5 70.1 9.56
0% FORPLUS™ + Bioplex® Zn 4.36 71.7 23.5 68.0 9.25
2% FORPLUS™ + Bioplex® Zn 4.25 68.1 22.1 72.1 9.39
SEM 0.10 0.62 0.37 1.97 0.10
P-value 0.64 0.67 0.95 0.74 0.47 a,bFor each group of main effects and interaction effects, means within the same column without common letters are significantly
different (P≤0.05)

88
Table 3.5 Dietary effects of FORPLUS™ level and Zn source on broiler breeder egg quality at 36 weeks of lay
Eggshell breaking
strength, kg force Egg wt., g Yolk wt., g Haugh Unit Eggshell, %
Main Effect of FORPLUS™
0% FORPLUS™ 3.82 71.8a 24.9a 60.8 9.18b
2% FORPLUS™ 3.85 68.4b 23.3b 60.7 9.51a
SEM 0.10 0.48 0.44 1.24 0.10
P-value 0.83 <0.01 0.03 0.96 0.05
Main Effect of Zn Source
ZnO 3.90 70.7 24.5 62.5 9.30
Bioplex® Zn 3.77 69.4 23.8 58.9 9.38
SEM 0.10 0.48 0.44 1.24 0.10
P-value 0.37 0.10 0.30 0.07 0.61
Interaction Effects
0% FORPLUS™ + ZnO 3.86 73.0 25.5 61.4 9.06
2% FORPLUS™ + ZnO 3.97 68.4 23.4 63.6 9.55
0% FORPLUS™ + Bioplex® Zn 3.78 70.6 24.3 60.1 9.29
2% FORPLUS™ + Bioplex® Zn 3.76 68.3 23.3 57.8 9.46
SEM 0.13 0.66 0.61 1.71 0.14
P-value 0.68 0.14 0.40 0.24 0.30 a,bFor each group of main effects and interaction effects, means within the same column without common letters are significantly
different (P≤0.05)

89
Table 3.6 Dietary effects of FORPLUS™ level and Zn source on broiler breeder egg mineral content at 25 weeks of lay
Cu, ppb Fe, ppm Mn, ppb Zn, ppm Se, ppb Ca, ppm P, ppm
Main Effect of FORPLUS™
0% FORPLUS™ 514 25.6 337b 16.9 390 541 2233
2% FORPLUS™ 548 26.8 427a 16.4 401 538 2138
SEM 23.7 1.88 28.6 0.51 14.8 13.5 75.1
P-value 0.38 0.67 0.05 0.47 0.60 0.91 0.15
Main Effect of Zn Source
ZnO 588a 27.7 409 16.9 407 553 2270
Bioplex® Zn 474b 24.6 354 16.4 383 526 2102
SEM 24.0 1.88 28.6 0.51 14.8 13.5 75.1
P-value 0.01 0.26 0.21 0.47 0.28 0.18 0.39
Interaction Effects
0% FORPLUS™ + ZnO 589 27.5 379 17.2 408 546 2310
2% FORPLUS™ + ZnO 586 28.0 438 16.7 406 560 2230
0% FORPLUS™ + Bioplex® Zn 439 23.6 294 16.7 371 535 2157
2% FORPLUS™ + Bioplex® Zn 509 25.5 415 16.1 396 516 2046
SEM 33.1 2.65 40.3 0.71 20.9 19.0 106
P-value 0.29 0.79 0.46 1.00 0.55 0.41 0.89 a,bFor each group of main effects and interaction effects, means within the same column without common letters are significantly
different (P≤0.05)

90
Table 3.7 Dietary effects of FORPLUS™ level and Zn source on broiler breeder egg mineral content at 32 weeks of lay
Cu, ppb Fe, ppm Mn, ppb Zn, ppm Se, ppb Ca, ppm P, ppm
Main Effect of FORPLUS™
0% FORPLUS™ 518a 24.9 274 16.3a 369a 541a 2234a
2% FORPLUS™ 361b 20.9 308 12.0b 331b 418b 1628b
SEM 34.5 1.59 25.7 0.72 11.4 20.7 103
P-value 0.01 0.10 0.38 <0.01 0.04 <0.01 <0.01
Main Effect of Zn Source
ZnO 434 21.6 268 13.6 348 468 1851
Bioplex® Zn 445 24.1 314 14.6 352 490 2011
SEM 34.5 1.59 25.7 0.72 11.4 20.7 103
P-value 0.83 0.29 0.23 0.35 0.81 0.46 0.29
Interaction Effects
0% FORPLUS™ + ZnO 518 24.3 250 16.3 374 555 2294
2% FORPLUS™ + ZnO 350 19.0 285 10.9 322 381 1408
0% FORPLUS™ + Bioplex® Zn 519 25.5 298 16.2 364 526 2175
2% FORPLUS™ + Bioplex® Zn 371 22.7 330 13.0 340 454 1847
SEM 48.8 2.25 36.3 1.01 16.1 29.3 146
P-value 0.84 0.60 0.97 0.32 0.41 0.11 0.08 a,bFor each group of main effects and interaction effects, means within the same column without common letters are significantly
different (P≤0.05)

91
Figure 3.1 Main effect of dietary Zn source on hen day production
0
10
20
30
40
50
60
70
80
5-8 9-12 13-16 17-20 21-24 25-28 29-32 33-36 37-40 41-45
HD
P, %
Weeks of Lay
ZnO Bioplex® Zn
*
**
*P ≤ 0.05**P ≤ 0.01

92
Table 3.8 Dietary effects of FORPLUS™ level and Zn source on broiler breeder hen day
production
Peak HDP, % Post-Peak HDP, % Overall
HDP, %
(1-27 wk of lay) (28-45 wk of lay) (1-45 wk of lay)
Main Effect of FORPLUS™ 0% FORPLUS™ 53.3 46.2 51.4
2% FORPLUS™ 56.4 47.7 53.5
SEM 1.33 1.21 1.19
P-value 0.13 0.38 0.23
Main Effect of Zn Source
ZnO 55.1 49.0a 53.6
Bioplex® Zn 54.7 44.9b 51.3
SEM 1.33 1.21 1.19
P-value 0.85 0.03 0.20
Interaction Effects
0% FORPLUS™ + ZnO 53.3 47.4 51.9
2% FORPLUS™ + ZnO 56.8 50.6 55.2
0% FORPLUS™ + Bioplex® Zn 53.3 44.9 50.8
2% FORPLUS™ + Bioplex® Zn 56.0 44.8 51.8
SEM 1.89 1.71 1.69
P-value 0.85 0.35 0.50 a,bFor each group of main effects and interaction effects, means within the same
column without common letters are significantly different (P≤0.05)
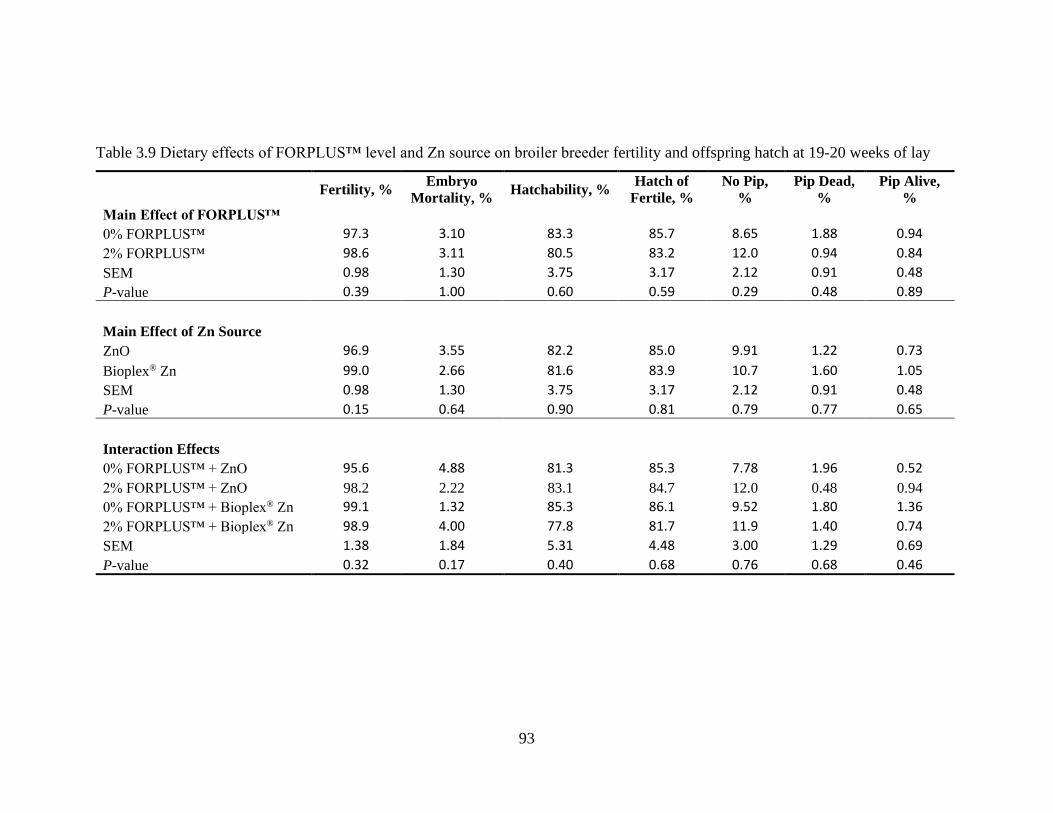
93
Table 3.9 Dietary effects of FORPLUS™ level and Zn source on broiler breeder fertility and offspring hatch at 19-20 weeks of lay
Fertility, %
Embryo
Mortality, % Hatchability, %
Hatch of
Fertile, %
No Pip,
%
Pip Dead,
%
Pip Alive,
%
Main Effect of FORPLUS™
0% FORPLUS™ 97.3 3.10 83.3 85.7 8.65 1.88 0.94
2% FORPLUS™ 98.6 3.11 80.5 83.2 12.0 0.94 0.84
SEM 0.98 1.30 3.75 3.17 2.12 0.91 0.48
P-value 0.39 1.00 0.60 0.59 0.29 0.48 0.89
Main Effect of Zn Source
ZnO 96.9 3.55 82.2 85.0 9.91 1.22 0.73
Bioplex® Zn 99.0 2.66 81.6 83.9 10.7 1.60 1.05
SEM 0.98 1.30 3.75 3.17 2.12 0.91 0.48
P-value 0.15 0.64 0.90 0.81 0.79 0.77 0.65
Interaction Effects
0% FORPLUS™ + ZnO 95.6 4.88 81.3 85.3 7.78 1.96 0.52
2% FORPLUS™ + ZnO 98.2 2.22 83.1 84.7 12.0 0.48 0.94
0% FORPLUS™ + Bioplex® Zn 99.1 1.32 85.3 86.1 9.52 1.80 1.36
2% FORPLUS™ + Bioplex® Zn 98.9 4.00 77.8 81.7 11.9 1.40 0.74
SEM 1.38 1.84 5.31 4.48 3.00 1.29 0.69
P-value 0.32 0.17 0.40 0.68 0.76 0.68 0.46

94
Table 3.10 Dietary effects of FORPLUS™ level and Zn source on broiler breeder fertility and offspring hatch at 30-31 weeks of lay
Fertility, %
Embryo
Mortality, % Hatchability, %
Hatch of
Fertile, %
No Pip,
%
Pip Dead,
%
Pip Alive,
%
Main Effect of FORPLUS™
0% FORPLUS™ 87.9 7.08 66.1b 75.8 12.8 1.86 2.96
2% FORPLUS™ 92.3 6.84 74.0a 80.2 10.3 1.79 1.22
SEM 2.91 1.07 1.65 2.33 2.36 0.41 0.76
P-value 0.31 0.88 0.01 0.21 0.46 0.91 0.14
Main Effect of Zn Source
ZnO 90.8 6.42 70.3 77.80 12.3 2.41 1.63
Bioplex® Zn 89.5 7.50 69.8 78.17 10.8 1.24 2.55
SEM 2.91 1.07 1.65 2.33 2.36 0.41 0.76
P-value 0.76 0.49 0.84 0.91 0.67 0.07 0.41
Interaction Effects
0% FORPLUS™ + ZnO 90.5 6.83 66.6 74.3 15.5 1.98 2.40
2% FORPLUS™ + ZnO 91.0 6.00 74.0 81.3 9.06 2.84 0.86
0% FORPLUS™ + Bioplex® Zn 85.3 7.32 65.7 77.3 10.2 1.74 3.52
2% FORPLUS™ + Bioplex® Zn 93.7 7.68 74.0 79.0 11.4 0.74 1.58
SEM 4.11 1.51 2.33 3.29 3.33 0.58 1.08
P-value 0.36 0.70 0.84 0.44 0.28 0.14 0.86 a,bFor each group of main effects and interaction effects, means within the same column without common letters are significantly
different P≤0.05)

95
Table 3.11 Dietary effects of FORPLUS™ level and Zn source on broiler breeder fertility and offspring hatch at 35-37 weeks of lay
Fertility, %
Embryo
Mortality, % Hatchability, %
Hatch of
Fertile, %
No Pip,
%
Pip Dead,
%
Pip Alive,
%
Main Effect of FORPLUS™
0% FORPLUS™ 87.4 3.97 59.5 73.3 18.4 2.97 0.44
2% FORPLUS™ 85.6 3.47 66.5 82.9 11.6 1.10 0.47
SEM 3.77 1.02 5.41 3.24 2.43 0.75 0.29
P-value 0.74 0.74 0.39 0.06 0.07 0.11 0.94
Main Effect of Zn Source
ZnO 88.8 3.79 62.8 75.7 17.1 2.60 0.23
Bioplex® Zn 84.1 3.65 63.2 80.4 13.0 1.47 0.68
SEM 3.77 1.02 5.41 3.24 2.43 0.75 0.29
P-value 0.39 0.92 0.96 0.34 0.26 0.31 0.30
Interaction Effects
0% FORPLUS™ + ZnO 94.1 4.97 52.4 63.7b 26.4a 3.37 0.45
2% FORPLUS™ + ZnO 83.5 2.62 73.2 87.8a 7.68b 1.82 0.00
0% FORPLUS™ + Bioplex® Zn 80.7 2.98 66.7 82.9a 10.5b 2.56 0.42
2% FORPLUS™ + Bioplex® Zn 87.6 4.32 59.7 77.9a 15.5b 0.38 0.94
SEM 5.16 1.44 7.61 4.56 3.42 1.05 0.41
P-value 0.14 0.23 0.10 0.01 0.01 0.77 0.27 a,bFor each group of main effects and interaction effects, means within the same column without common letters are significantly
different P≤0.05)

96
Table 3.12 Dietary effects of FORPLUS™ level and Zn source on broiler breeder fertility and offspring hatch at 41-43 weeks of lay
Fertility, %
Embryo
Mortality, % Hatchability, %
Hatch of
Fertile, %
No Pip,
%
Pip Dead,
%
Pip Alive,
%
Main Effect of FORPLUS™
0% FORPLUS™ 83.6 4.86 70.6 85.6 13.1 0.73 0.56
2% FORPLUS™ 85.4 3.64 70.0 84.5 13.0 1.55 0.97
SEM 4.01 1.95 5.44 2.82 2.88 0.30 0.53
P-value 0.76 0.67 0.94 0.80 0.97 0.08 0.59
Main Effect of Zn Source
ZnO 86.5 4.08 72.8 83.3 14.8 0.89 1.03
Bioplex® Zn 82.5 4.42 67.8 86.8 11.4 1.39 0.50
SEM 4.02 1.95 5.45 2.82 2.88 0.30 0.53
P-value 0.48 0.90 0.52 0.41 0.42 0.27 0.49
Interaction Effects
0% FORPLUS™ + ZnO 88.2 6.79 71.3 77.9c 20.1a 0.81 1.11
2% FORPLUS™ + ZnO 84.8 1.36 74.4 88.7ab 9.42ab 0.96 0.94
0% FORPLUS™ + Bioplex® Zn 78.9 2.92 70.0 93.2a 6.16b 0.64 0.00
2% FORPLUS™ + Bioplex® Zn 86.0 5.92 65.6 80.3bc 16.6a 2.14 1.00
SEM 5.49 2.74 7.45 3.96 4.05 0.43 0.74
P-value 0.37 0.16 0.63 0.01 0.03 0.14 0.45 a,bFor each group of main effects and interaction effects, means within the same column without common letters are significantly
different P≤0.05)

97
CHAPTER 4. Effects of Broiler Breeder Dietary Microalgae Level and Zn Source on
Offspring Skeletal Leg Development at Hatch
ABSTRACT
Dietary omega-3 (n-3) polyunsaturated fatty acids (PUFA) and zinc (Zn) are known to
beneficial for broiler skeletal development, yet very little information exists on the effects
of dietary n-3 PUFA supplementation and Zn source on the skeletal development of broiler
breeder offspring. FORPLUS™ (Alltech, Inc.) is an unextracted, whole-cell microalgae
(Aurantiochytrium limacinum CCAP 4087/2) source of n-3 PUFA and DHA in particular.
Bioplex® Zn (Alltech, Inc.) is a Zn-proteinate product that is more bioavailable to poultry
than some other sources of inorganic Zn. A 2x2 factorial, randomized complete block
study was designed to evaluate the dietary effects of FORPLUS™ level (0% vs 2%) and
Zn source (Bioplex® Zn vs ZnO) on broiler breeder offspring skeletal leg bone
morphology, growth plate morphology, and bone-specific alkaline phosphatase activity
(BALP). The 4 breeder dietary treatments were 1) corn-soybean meal based diet + 40 mg
ZnO/kg diet, 2) diet 1 + 2% FORPLUS™, 3) corn-soybean meal based diet + 40 mg
Bioplex® Zn/kg diet, 4) Diet 3 + 2% FORPLUS™. A total of 240 Cobb 500™ broiler
breeder hens and 20 roosters were randomly assigned to each dietary treatment resulting in
5 replicate floor pen groups of 12 broiler breeder hens plus 1 broiler breeder rooster. Fertile
broiler breeder eggs were collected and set in 10-week intervals; during 19-20 weeks of
lay (peak lay), 30-31 weeks of lay (post-peak lay), and 41-43 weeks of lay (post-peak lay).
At each hatching period measurements of tibia and femur leg morphology, tibia and femur
proximal growth plate zone heights, and serum BALP were collected. Interaction effects
and main effects of breeder dietary factors were observed on offspring skeletal leg
morphology. At 19-20 wk of lay breeder diets containing Bioplex® Zn without
FORPLUS™ increased (P≤0.05) offspring tibia length compared to diets containing ZnO
without FORPLUS™. Femur epiphyseal widths were greater (P≤0.05) in offspring from
breeders fed 2% vs 0% FORPLUS™. In regard to Zn source, distal femur epiphyseal
widths were greater (P≤0.05) in offspring from breeders fed Bioplex® Zn vs ZnO. At 30-
31 wk of lay tibia lengths were reduced (P≤0.05) in offspring from breeders fed 0%

98
FORPLUS™ + ZnO compared to offspring from breeders fed other diets. Diaphysis width
was decreased (P≤0.05) in offspring from breeders fed diets with 2% FORPLUS™ +
Bioplex® Zn compared to other offspring from breeders fed other dietary treatments except
for 0% FORPLUS™ + ZnO. At 41-43 wk of lay offspring from breeders fed diets
supplemented with 0% + Bioplex® Zn vs 2% FORPLUS™ + Bioplex® Zn had greater
(P≤0.05) tibia proximal epiphyseal width and femur diaphysis width. Supplementation of
2% vs 0% FORPLUS™ reduced (P≤0.05) femur length and distal epiphyseal width. At
19-20 weeks of lay offspring from breeders fed diets with Bioplex® Zn vs ZnO had greater
(P≤0.05) proliferative zone height, hypertrophic zone height, and cumulative zone height.
At 30-31 wk of lay offspring from breeders fed diets with 0% FORPLUS™ + Bioplex® Zn
had increased (P≤0.05) hypertrophic zone height and cumulative zone height compared to
offspring from other breeders except the breeders fed 2% FORPLUS™ + ZnO. Offspring
from breeders fed diets with 2% vs 0% FORPLUS™ or Bioplex® Zn vs ZnO had increased
(P≤0.05) tibia hypertrophic zone height and cumulative zone height. At 19-20 wk of lay
offspring from breeders fed diets with Bioplex® Zn vs ZnO had greater (P≤0.05) serum
BALP. In summary, broiler breeder dietary supplementation with FORPLUS™ or
Bioplex® Zn improved offspring skeletal development, with Bioplex® Zn having the
greatest impact on broiler breeder offspring skeletal development during peak lay.

99
4.1 Introduction
Leg weakness and lameness as a result of skeletal leg disorders and deformities are
issues that cause concern for animal welfare and negatively affect the poultry industry.
Skeletal leg disorders and deformities pose a welfare concern because they may cause pain
and impair a bird’s ability to walk, thereby disrupting normal eating and drinking habits
and behaviors (Kestin et al., 1992; Bradshaw et al., 2002; Dinev, 2009; Nääs et al., 2009).
Consequences of moderate to severe lameness in broilers are lower growth rates, culling,
processing downgrades, and ultimately profit losses (Bradshaw et al., 2002; Knowles et
al., 2008; Dinev, 2009; Gocsik et al., 2017; Wijesurendra et al., 2017). It is estimated that
lameness affects an average of 21.4% of European broiler flocks and approximately 3.0%
of broilers may need to be culled due to severe lameness (Bassler et al., 2013; Marchewka
et al., 2013; Kittelsen et al., 2015; Tullo et al., 2017; Granquist et al., 2019). In the United
States there is a lack of recent, comprehensive studies on the incidence of lameness in
broilers, although it has been claimed that up to 6% of broilers have obvious skeletal
abnormalities or leg problems and 2% of broiler flocks suffer losses due to lameness
(Dunkley, 2007; Mitchell, 2014).
With regard to broiler breeding, genetic selection against skeletal leg problems in
broilers is a slow process and some researchers have indicated that changes to nutrition and
living environment may be more effective (Angel, 2007; Knowles et al., 2008; Rekaya et
al., 2013; Mitchell, 2014; González-Cerón et al., 2015). Management strategies to improve
broiler leg health have its limitations. Enrichment of broiler houses to induce exercise have
not been successful in limiting skeletal leg problems (Sherlock et al., 2010; Bailie et al.,
2018; Meyer et al., 2019). Litter choice is important for leg health, but if litter quality
deteriorates remedies to lessen its impact on leg health are very limited (Su et al., 2000).
Stocking density may improve leg health as it has consequences on litter quality, but
lowering stocking density to the extent of reducing leg problems would be very cost
prohibitive for many producers (Knowles et al., 2008). Longer periods of darkness (Cobb-
Vantress, 2012; Bassler et al., 2013; Aviagen, 2018) and control of toxin exposure can also
reduce or prevent skeletal disorders but have finite application in skeletal development and
health.

100
Dietary omega-3 (n-3) polyunsaturated fatty acids (PUFA) can be transferred from
broiler breeder diets to offspring tissues (Lin et al., 1991; Pappas et al., 2006; Hall et al.,
2007; Bautista-Ortega et al., 2009; Cherian et al., 2009; Koppenol et al., 2015a) and are
known to improve bone quality in poultry species (Watkins et al., 1996a; Watkins et al.,
1997b; Liu et al., 2003; Fleming, 2008). However, there is a lack of research on the effect
of broiler breeder dietary n-3 PUFA supplementation on offspring skeletal development.
FORPLUS™ (Alltech, Inc.) is an unextracted, whole-cell microalgae (Aurantiochytrium
limacinum CCAP 4087/2) source of n-3 PUFA. It contains 64% fat with 16% of that fat
as docosahexaenoic acid (DHA). Microalgae rich in n-3 PUFA may be considered as a
sustainable, alternative to fish oil which is a common source of n-3 PUFA in poultry diets.
It is well known that zinc (Zn), an essential trace element and nutrient, is an integral
component of numerous enzymes and proteins. These Zn-dependent molecules have
important roles in numerous biochemical and metabolic functions such as cell growth and
proliferation, cell differentiation, gene expression, and immunity (Vallee and Falchuk,
1993; Plum et al., 2010; Haase and Rink, 2014a, b). Zn is also essential for skeletal
development, specifically due to its role in stimulating the synthesis of collagen and
chondroitin for bone matrix and structure formation (Brandao-Neto et al., 1995) as well as
its role in osteoblast proliferation and activity (Seo et al., 2010). Supplementation of
organic Zn vs inorganic Zn in breeder diets resulted in reduced incidence of skeletal leg
abnormalities of offspring (Hudson et al., 2005), revealing the importance of Zn source in
offspring skeletal leg health. Blending organic trace minerals such as Cu, Mn, and Zn with
their inorganic counterparts in broiler breeder diets improved offspring bone calcification
rate, morphology, and biomechanical properties during the late embryonic development
(Favero et al., 2013). Bioplex® Zn (Alltech, Inc.) is a Zn-proteinate product that is more
bioavailable to broilers than some other sources of inorganic Zn (Ao et al., 2006; Ao et al.,
2011). The objective of this study was to evaluate two levels of dietary FORPLUS™ and
two sources of Zn in broiler breeder diets on offspring skeletal leg development at hatch.
4.2 Materials and Methods
These experiments were conducted in accordance with the University of Kentucky
Institutional Animal Care and Use Committee protocols.

101
4.2.1 Experimental Design
A complete randomized block design with a 2x2 factorial treatment arrangement
consisting of 2 levels of microalgae supplementation (0% vs 2% FOPRLUS™) and two
sources of supplemental Zn (ZnO vs Bioplex® Zn) was used for this study. A total of 240,
Cobb 500™ broiler breeder hens and 20 Cobb 500™ broiler breeder roosters were
randomly assigned to four dietary treatments. This resulted in 5 replicate floor pen groups
of 12 broiler breeder hens plus 1 broiler breeder rooster per dietary treatment. The four
dietary treatments were 1) corn-soybean meal based diet + 40 mg ZnO/kg diet, 2) diet 1 +
2% FORPLUS™, 3) corn-soybean meal based diet + 40 mg Bioplex® Zn/kg diet, 4) Diet
3 + 2% FORPLUS™. These diets were formulated to meet or exceed the energy and
nutrient requirements (NRC, 1994) before lay, during peak lay (1-27 weeks of lay), and
during post-peak lay (27-45 weeks of lay) (Table 4.1 and Table 4.2). Broiler breeders were
provided ad libitum access to water and supplied feed on a daily feeding regimen in a
feeding trough as per the Cobb® Breeder Management Guide (Cobb-Vantress, 2012).
The broiler breeders were housed in floor pen units that measured approximately
1.22 x 1.83 sq. meters. The litter for each pen was 100% large flake, pine wood shavings
supplied at approximately 3.66 cu. meters per pen and refreshed as needed. Broiler
breeders were raised in an ambient temperature range of 18.3 to 29.4 °C. Prior to the onset
of lay, a two-tier nest box that could accommodate up to four birds at a time was added to
each pen. Photostimulation was provided as 15 hours of light and 9 hours of darkness
throughout the entire laying period.
Fertile eggs were collected from each breeder pen at 10-week intervals during 19-
20 weeks of lay (peak lay), 30-31 weeks of lay (post-peak lay), and 41-43 weeks of lay
(post-peak lay) for evaluation of offspring skeletal development. At each collection time
point, the eggs were set in a Nature Form Incubator (model 4680). Eggs were separated
and incubated by pen using incubator trays. The incubator temperature and relative
humidity conditions were set to 37.5°C and 60%, respectively. On embryonic day 18, eggs
were transferred to a Nature Form Hatcher (model 45) where the temperature was
maintained at 36.9°C and relative humidity was set to 64%. Eggs were grouped and labeled

102
by pen using wooden dividers in hatcher trays. Newly hatched, straight-run broiler chicks
were removed from the hatcher after 21 days of incubation for sample collection.
4.2.2 Skeletal Leg Bone Gross Morphology
A total of five, newly hatched broiler chicks were randomly selected from each
broiler breeder dietary treatment were euthanized via argon gas asphyxiation and cervical
dislocation for collection of tibias and femurs. Bone length, diaphysis width, proximal
epiphyseal width, and distal epiphyseal width measurements on the left and right tibias
were obtained using digital calipers and averaged. The same measurements were obtained
on left and right femurs.
4.2.3 Skeletal Leg Growth Plate Morphology
The proximal epiphyseal growth plates from the tibia and femur were collected
from five, randomly selected newly hatched chicks per broiler breeder dietary treatment.
Growth plates were fixed in 10% neutral buffered formalin for a minimum of 48 hours.
After fixation the growth plate specimens were rinsed in slowly running tap water for a
minimum of 30 minutes. Growth plate specimens were then decalcified in 8% (v/v)
hydrochloric acid, 8% (v/v) formic acid solution. The decalcifying acid solution was
changed each day until decalcification was complete (approximately 72 hours) (Prophet et
al., 1992). Growth plate specimens were then rinsed in tap water for 1 hour before
dehydration in a graded series of ethanol, clearing with d-limonene (Fisherbrand™
CitriSolv™, Fisher Scientific International Inc.), and infiltration with paraffin wax
(Thermo Scientific™ STP 120 Spin Tissue Processor). Growth plates were then embedded
in paraffin wax (Thermo Scientific™ Microm HM EC 350 Modular Tissue Embedding
Center) and microscope slides were created at a 7 µm thickness (Thermo Scientific™
Microm HM 340E Electronic Microtome). Slides were stained with Harris’s hematoxylin
(Statlab®, McKinney, TX) and counterstained with eosin y plus phloxine solution (Sigma-
Aldrich™, St. Louis, MO) following procedure of Prophet et al. (1992) with slight
modification. Microscope slides were examined with a Nikon® Eclipse E400 light
microscope at 40x magnification. Microscopic images were captured with a SPOT Flex

103
camera. Captured images were used to measure proliferative chondrocyte zone height,
hypertrophic chondrocyte zone height with ImageJ (v1.50d, National Institute of Health)
java based image processing program. The cumulative proliferative zone and hypertrophic
zone heights (sum of zone heights) were calculated.
4.2.4 Bone-specific Alkaline Phosphatase Assay
Whole blood was collected via heart puncture from five, randomly selected newly
hatched chicks per broiler breeder dietary treatment and combined to form one replicate.
A total of five replicate samples were obtained for each broiler breeder dietary treatment.
Serum was collected from whole blood by centrifuging samples at 1200 rcf for 15 minutes
at room temperature. Serum that was not immediately analyzed was stored cryogenically
at -80°C. Following manufacture instructions, serum samples were diluted and prepared
in duplicate for analysis with a chicken bone-specific alkaline phosphatase (BALP)
competitive ELISA kit (MyBioSource Inc., San Diego, CA) and 96-well plate reader
(Gen5™, BioTek® Instruments, Inc.). SigmaPlot Software, version 13.0 (Systat Software,
Inc., San Jose, CA) was used to calculate a four-parameter logistic standard curve and
estimate serum BALP concentration.
4.2.5 Statistical Analysis
All data were subjected to a two-way analysis of variance using the general linear
model procedures of SAS® Software, version 9.4 (SAS, 2016). Broiler breeder floor pen
served as the experimental unit. The model included the fixed effect of block by incubator
hatching tray location, the main effect of dietary FORPLUS™ level, the main effect of
supplemental Zn source and the interaction effect of those two factors for all measured and
calculated variables. Mean values were separated and compared using Fisher’s protected
least significant difference test. Mean values were declared significantly different for P
values ≤ 0.05.

104
4.3 Results and Discussion
4.3.1 Skeletal Leg Bone Gross Morphology
An interaction effect of broiler breeder dietary FORPLUS™ level and Zn source
when breeders were at 19-20 weeks of lay was observed on newly hatched offspring tibia
length (Table 4.3). Offspring from breeders fed diets with 0% FORPLUS™ + Bioplex®
Zn had greater (P=0.01) tibia length (28.3 vs 27.0 mm) compared to offspring from
breeders fed diets with 0% FORPLUS™ + ZnO. Main effects of broiler breeder dietary
FORPLUS™ level and Zn source were also observed on femur gross morphology (Table
4.3). Offspring from breeders fed diets with 2% FORPLUS™ had greater femur proximal
epiphyseal width and distal epiphyseal width compared to offspring from breeders fed diets
without FORPLUS™. Offspring from breeders fed diets containing Bioplex® Zn had
greater femur distal epiphyseal width than offspring from breeders fed diets with ZnO.
Interaction effects of broiler breeder dietary FORPLUS™ level and Zn source when
breeders were at 30-31 weeks of lay were observed on offspring tibia length and diaphysis
width (Table 4.4). Offspring from breeders fed diets with 0% FORPLUS™ + ZnO had the
smallest tibia lengths compared to offspring from breeders fed any other diet. Tibia
diaphysis width was decreased in offspring from breeders fed diets with 2% FORPLUS™
+ Bioplex® Zn compared to other offspring from breeders fed other dietary treatments
except for 0% FORPLUS™ + ZnO. No effects of breeder diet at 30-31 weeks of lay were
observed on offspring gross femur morphology.
An interaction effect of broiler breeder dietary FORPLUS™ level and Zn source
when breeders were at 41-43 weeks of lay was observed on offspring tibia proximal
epiphyseal width and femur diaphysis width (Table 4.5). Offspring from breeders fed diets
with 0% FORPLUS™ + Bioplex® Zn had greater tibia proximal epiphyseal width and
femur diaphysis width compared to offspring from breeders fed diets with 2%
FORPLUS™ + Bioplex® Zn. A main effect of broiler breeder dietary FORPLUS™ level
was also observed on femur length and distal epiphyseal width. Offspring from breeders
fed diets with 2% FORPLUS™ had decreased femur length and distal epiphyseal width
compared to offspring from breeders fed diets not containing FORPLUS™. Offspring tibia
distal epiphyseal width also tended (P=0.06) to decrease due to 2% FORPLUS™ in breeder
diets.

105
Breeder dietary supplementation of Bioplex® Zn or FORPLUS™ during lay
improved bone morphology of offspring at hatch, with most changes observed in the bone
length and epiphysis width. The epiphysis and metaphysis contains more trabecular bone
which is more porous and has higher resistance to strain than cortical bone found in the
diaphysis (Howlett, 1980; Xu et al., 1995; Villemure and Stokes, 2009; Hart et al., 2017).
It is possible that both Bioplex® Zn and FORPLUS™ positively influenced trabecular bone
formation although further evaluation is needed to confirm this. Maternal fish oil
supplementation in quail was found to increase the bone n-3 PUFA content of their
offspring at hatch and up to one week after hatch compared to soybean oil supplementation
(Liu and Denbow, 2001). Female rats provided DHA during pregnancy and lactation
produced offspring with increased osteoblast density and trabecular bone formation (Fong
et al., 2012). Exposure to dietary n-3 PUFA at a young age accelerated bone growth and
improved bone quality in mice (Koren et al., 2014). DHA is especially critical for
osteoblastogenesis and bone formation during bone modelling in young animals (Watkins
et al., 2003) as it activates free fatty acid receptor 4 in mature osteoblasts and osteoclasts
to stimulate bone formation and decrease resorption, respectively (Ahn et al., 2016).
In regards to breeder trace mineral source, a blend of organic and inorganic Cu, Mn
and Zn supplementation in broiler breeder diets improved offspring tibia and femur
diaphysis width at 14 days of embryonic development compared to inorganic trace mineral
supplementation alone (Favero et al., 2013). Kidd et al. (1992) found that tibia dry weight
was greater in offspring from breeders fed organic Zn vs inorganic Zn. Ash content
remained the same between the two groups. Dry weight accounts for the organic and
inorganic components of bone whereas ash accounts mainly for the inorganic portion of
bone. Their results indicate that dietary breeder Zn source may have affected the organic
portion of offspring bone which contains collagen, protein, enzymes, etc. Zn is known to
control the initiation of mineralization in bones, influence osteoblast activity, and increase
growth plate chondrocyte protein and enzyme activity (Litchfield et al., 1998; Kirsch et al.,
2000; Kwun et al., 2010; Seo et al., 2010). In rats organic Zn has been shown to increase
the Zn content in bone as well as Ca content and enzyme activity related to bone formation
compared to inorganic Zn (Yamaguchi et al., 2004).
106
Later in lay, 2% FORPLUS™ began to negatively impact offspring skeletal
morphology and an antagonist relationship between 2% FORPLUS™ and Bioplex® Zn
appeared to have developed. It should be noted that 2% FORPLUS™ was also found to
significantly reduce (P<0.01) chick hatching weight by approximately 2 g or 4.3 % during
post-peak lay (data not shown) which may have contributed to reduced skeletal leg size.
Breeders fed diets supplemented with various sources of n-3 PUFA have resulted in smaller
eggs (Pappas et al., 2005; Cherian, 2008; Koppenol et al., 2014) and reduced chick weight
at hatch (Koppenol et al., 2015c).
4.3.2 Skeletal Leg Bone Growth Plate Morphology
Main effects of broiler breeder dietary Zn source during 19-20 weeks of lay on
offspring femur growth plate morphology were observed (Table 4.6). Offspring from
breeders fed diets with Bioplex® Zn had greater proliferative zone height, hypertrophic
zone height, and cumulative zone height compared to offspring from breeders fed ZnO.
Offspring from breeders fed diets with 0% FORPLUS™ + Bioplex® Zn tended to have
higher tibia hypertrophic zone height and cumulative zone height compared to offspring
from other breeders.
Interaction effects of broiler breeder dietary FORPLUS™ level and Zn source
during 30-31 weeks of lay on offspring femur growth plate morphology were observed
(Table 4.7). The offspring from breeders fed diets with 0% FORPLUS™ + Bioplex® Zn
had the increased hypertrophic zone height and cumulative zone height compared to
offspring from other breeders except the breeders fed 2% FORPLUS™ + ZnO. No effects
of breeder diet on offspring tibia growth plate morphology were detected.
Only main effects of breeder dietary FORPLUS™ level and Zn source during 41-
43 weeks of lay were detected on offspring tibia growth plate morphology (Table 4.8).
Chicks hatched from breeders fed diets with 2% FORPLUS™ had increased tibia
hypertrophic zone height and cumulative zone height compared to chicks hatched from
breeders fed diets without FORPLUS™. Chicks hatched from breeders fed diets with
Bioplex® Zn also had increased tibia hypertrophic zone height and cumulative zone height
compared to chicks hatched from breeders fed diets containing ZnO.

107
Based on these results, broiler breeder Bioplex® Zn supplementation was more
effective in altering offspring growth plate zone height throughout lay whereas
FORPLUS™ supplementation was most effective towards the end of lay. Zn needed for
growth plate chondrocyte proliferation (Wang et al., 2002) and is known to increase growth
plate chondrocyte protein production, enzyme activity and collagen content in bone
(Yamaguchi and Takahashi, 1984; Litchfield et al., 1998). In rats, organic sources of Zn
have been shown to be improve bone Zn content and bone formation compared to inorganic
Zn (Yamaguchi et al., 2004). The fatty acid profile and function of growth plate
chondrocytes are also sensitive to changes in dietary PUFA. Broiler chicks fed diets with
a blend of menhaden oil and corn oil from hatch had increased DPA, DHA, and total n-3
PUFA in the proximal tibia growth plate cartilage at 3 weeks of age compared to broiler
chicks fed diets with soybean oil (Xu et al., 1994). The avian epiphyseal growth plate
chondrocytes are sensitive to n-6 PUFA and exhibit decreased collagen synthesis when
cultured with excess LA (Watkins et al., 1996b). Exposure to dietary n-3 early in life
resulted in thicker chondrocyte proliferative and hypertrophic zones in mice growth plates
(Koren et al., 2014).
4.3.3 Bone-specific Alkaline Phosphatase
Results from Table 4.9 show that a main effect of broiler breeder dietary Zn source
during 19-20 weeks of lay (peak lay) was observed for offspring serum BALP activity.
Chicks hatched from breeders fed diets with Bioplex® Zn had greater (P<0.01) serum
BALP (11.4 vs 4.75 ng/ml) activity than chicks hatched from breeders fed diets with ZnO.
No effects of broiler breeder diet on offspring serum BALP were detected at any other time
points. Alkaline phosphatase (ALP) appearance in the growth plate is an indicator of
chondrocyte hypertrophy and calcification (Pines and Hurwitz, 1991). It is also an
important biomarker of bone formation as a measure of osteoblast proliferation and
differentiation (Seo et al., 2010). Zn deficiency reduces ALP activity in osteoblastic cell
culture (Kwun et al., 2010), whereas Zn supplementation increases ALP activity in
osteoblastic cell culture (Seo et al., 2010), growth plate chondrocyte cell culture (Litchfield
et al., 1998), and rat femur in vivo (Yamaguchi and Takahashi, 1984; Yamaguchi and
Yamaguchi, 1986). Similar to the results presented in this study, Yamaguchi reported that
108
dietary supplementation of organic Zn vs ZnO increased ALP activity in rat femur
diaphysis (Yamaguchi et al., 2004).
4.4 Summary and Conclusions
Bioplex® Zn supplementation in broiler breeder diets had positive impacts on
offspring skeletal leg morphology, growth plate morphology, and serum BALP activity
during peak lay. Bioplex® Zn continued to improve offspring skeletal leg morphology and
growth plate morphology into post-peak lay. In peak lay, 2% FORPLUS™ improved
offspring skeletal leg morphology. However, later in lay 2% FORPLUS™ negatively
impacted offspring skeletal leg morphology. These results indicate Bioplex® Zn
supplementation was very effective at improving offspring skeletal development especially
during peak lay.

109
4.5 Tables
Table 4.1 Diet and nutrient composition of broiler breeder peak lay diets
Diet Composition, % Diet 1 Diet 2 Diet 3 Diet 4
Corn 67.3 65.0 67.3 65.0
Soybean meal (48% CP) 22.0 21.5 22.0 21.5
Alfalfa meal (17% CP) 0.78 2.02 0.78 2.02
Oyster shell 3.00 3.00 3.00 3.00
FORPLUS™ - 2.00 - 2.00
Soybean oil 0.52 0.08 0.52 0.08
Limestone (38% Ca) 3.80 3.75 3.80 3.75
Dicalcium Phosphate 1.65 1.65 1.65 1.65
Salt, iodized 0.40 0.39 0.40 0.39
Vitamin premix1 0.25 0.25 0.25 0.25
ZnO mineral premix2 0.25 0.25 - -
Bioplex® Zn mineral premix3 - - 0.25 0.25
DL-Methionine 0.10 0.10 0.10 0.10
Total 100 100 100 100
Nutrient Composition
AMEn, kcal/kg 2850 2850 2850 2850
Protein, %4 16.1 15.9 16.1 16.5
Ca, %4 3.72 3.61 3.77 4.07
Avail. P, % 0.41 0.41 0.41 0.41
TSAA, %4 0.52 0.55 0.55 0.56
Lysine, %4 0.90 0.88 0.91 0.90
Na, % 0.18 0.18 0.18 0.18
Total Zn, mg/kg4 84.5 79.4 89.9 94.3
Crude Fat, %4 3.27 4.98 2.69 6.13
DHA, %4 0.00 0.34 0.01 0.39
Total n-3 PUFA, %4 0.09 0.44 0.09 0.51
Total n-6 PUFA, %4 1.63 1.87 1.40 2.34
n-6: n-3 PUFA 17.6 4.24 16.4 4.55 1Supplied per kg of diet: 9921 IU of vitamin A, 2756 ICU of vitamin D3, 33 IU
vitamin E, 22.0 µg of vitamin B12, 0.11 mg of biotin, 1.98 mg of vitamin K (as
menadione), 1.98 mg of thiamine, 6.6 mg of riboflavin, 11 mg of d-pantothenic acid,
3.97 mg of vitamin B6, 44 mg of niacin, 1.32 mg of folic acid, 496 mg of choline
2Supplied per kg diet: 0.3mg Se as Ne2SO3, 5mg Cu as CuSO4.H2O, 20mg Fe as
FeSO4.H2O, 75mg Mn as MnSO4.H2O, 40mg Zn as ZnO, 1.5mg I as KIO3 3Supplied per kg diet: 0.3mg Se as Ne2SO3, 5mg Cu as CuSO4.H2O, 20mg Fe as
FeSO4.H2O, 75mg Mn as MnSO4.H2O, 40mg Zn as Bioplex® Zn, 1.5mg I as KIO3 4Analyzed value

110
Table 4.2 Diet and nutrient composition of broiler breeder post-peak lay diets
Diet Composition, % Diet 1 Diet 2 Diet 3 Diet 4
Corn 69.7 67.0 69.7 67.0
Soybean meal (48% CP) 19.4 18.9 19.4 18.9
Alfalfa meal (17% CP) 0.76 2.34 0.76 2.34
Oyster shell 3.00 3.00 3.00 3.00
FORPLUS™ - 2.00 - 2.00
Soybean oil 0.34 - 0.34 -
Limestone (38% Ca) 4.34 4.28 4.34 4.28
Dicalcium Phosphate 1.50 1.50 1.50 1.50
Salt, iodized 0.40 0.39 0.40 0.39
Vitamin premix1 0.25 0.25 0.25 0.25
ZnO mineral premix2 0.25 0.25 - -
Bioplex® Zn mineral premix3 - - 0.25 0.25
DL-Methionine 0.10 0.10 0.10 0.10
Total 100 100 100 100
Nutrient Composition
AMEn, kcal/kg 2850 2850 2850 2850
Protein, %4 15.7 15.0 14.4 14.2
Ca, %4 4.26 4.30 3.78 3.47
Avail. P, % 0.38 0.38 0.38 0.38
TSAA, %4 0.47 0.52 0.55 0.49
Lysine, %4 0.82 0.83 0.82 0.83
Na, % 0.18 0.18 0.18 0.18
Total Zn, mg/kg4 80.7 78.9 88.9 84.7
Crude Fat, %4 2.75 4.46 2.64 5.37
DHA, %4 0.00 0.30 0.02 0.42
Total n-3 PUFA, %4 0.07 0.38 0.07 0.53
Total n-6 PUFA, %4 1.44 1.67 1.41 1.93
n-6: n-3 PUFA 20.17 4.41 19.1 3.68 1Supplied per kg of diet: 9921 IU of vitamin A, 2756 ICU of vitamin D3, 33 IU
vitamin E, 22.0 µg of vitamin B12, 0.11 mg of biotin, 1.98 mg of vitamin K (as
menadione), 1.98 mg of thiamine, 6.6 mg of riboflavin, 11 mg of d-pantothenic acid,
3.97 mg of vitamin B6, 44 mg of niacin, 1.32 mg of folic acid, 496 mg of choline
2Supplied per kg diet: 0.3mg Se as Ne2SO3, 5mg Cu as CuSO4.H2O, 20mg Fe as
FeSO4.H2O, 75mg Mn as MnSO4.H2O, 40mg Zn as ZnO, 1.5mg I as KIO3 3Supplied per kg diet: 0.3mg Se as Ne2SO3, 5mg Cu as CuSO4.H2O, 20mg Fe as
FeSO4.H2O, 75mg Mn as MnSO4.H2O, 40mg Zn as Bioplex® Zn, 1.5mg I as KIO3 4Analyzed value

111
Table 4.3 Effects of broiler breeder dietary FORPLUS™ level and Zn source at 19-20 weeks of lay on offspring skeletal leg morphology
at hatch
Tibia Femur
Length,
mm
Diaphysis
width, mm
Proximal
epiphyseal
width, mm
Distal
epiphyseal
width, mm
Length,
mm
Diaphysis
width, mm
Proximal
epiphyseal
width, mm
Distal
epiphyseal
width, mm
Main Effect of FORPLUS™
0% FORPLUS™ 27.7 1.81 4.78 4.38 23.5 1.68 4.65b 5.01b
2% FORPLUS™ 27.4 1.75 4.91 4.45 23.7 1.67 4.87a 5.22a
SEM 0.18 0.02 0.09 0.09 0.16 0.03 0.07 0.04
P-value 0.39 0.06 0.32 0.51 0.32 0.72 0.05 <0.01
Main Effect of Zn Source
ZnO 27.3 1.79 4.82 4.40 23.4 1.65 4.70 5.01b
Bioplex® Zn 27.8 1.77 4.87 4.43 23.8 1.69 4.81 5.22a
SEM 0.18 0.02 0.09 0.09 0.16 0.03 0.07 0.04
P-value 0.08 0.40 0.72 0.96 0.11 0.36 0.29 <0.01
Interaction Effects
0% FORPLUS™ + ZnO 27.0b 1.81 4.63 4.25 23.2 1.65 4.59 4.86
2% FORPLUS™ + ZnO 27.6ab 1.78 5.02 4.56 23.6 1.65 4.81 5.17
0% FORPLUS™ + Bioplex® Zn 28.3a 1.81 4.94 4.52 23.7 1.71 4.71 5.17
2% FORPLUS™ + Bioplex® Zn 27.3ab 1.72 4.81 4.34 23.8 1.68 4.92 5.27
SEM 0.26 0.03 0.13 0.12 0.23 0.04 0.10 0.05
P-value 0.01 0.34 0.06 0.07 0.44 0.71 0.96 0.07 a,bFor each group of main effects and interaction effects, means within the same column without common letters are significantly different (P≤0.05)

112
Table 4.4 Effects of broiler breeder dietary FORPLUS™ level and Zn source at 30-31 weeks of lay on offspring skeletal leg morphology
Tibia Femur
Length,
mm
Diaphysis
width, mm
Proximal
epiphyseal
width, mm
Distal
epiphyseal
width, mm
Length,
mm
Diaphysis
width, mm
Proximal
epiphyseal
width, mm
Distal
epiphyseal
width, mm
Main Effect of FORPLUS™
0% FORPLUS™ 31.3b 1.78a 6.08 4.98 23.6 1.66 4.66 5.05
2% FORPLUS™ 32.1a 1.68b 6.39 4.80 23.6 1.67 4.56 5.19
SEM 0.26 0.03 0.13 0.12 0.22 0.03 0.11 0.09
P-value 0.05 0.03 0.13 0.31 0.95 0.91 0.52 0.29
Main Effect of Zn Source
ZnO 31.4 1.74 6.36 4.78 23.5 1.63 4.58 5.15
Bioplex® Zn 31.9 1.72 6.11 5.00 23.7 1.70 4.65 5.08
SEM 0.26 0.03 0.13 0.12 0.22 0.03 0.11 0.09
P-value 0.21 0.57 0.21 0.23 0.64 0.14 0.65 0.59
Interaction Effects
0% FORPLUS™ + ZnO 30.5b 1.73ab 6.03 4.74 23.4 1.62 4.54 5.05
2% FORPLUS™ + ZnO 32.4a 1.76a 6.69 4.83 23.6 1.64 4.62 5.26
0% FORPLUS™ + Bioplex® Zn 32.1a 1.83a 6.14 5.22 23.7 1.71 4.79 5.05
2% FORPLUS™ + Bioplex® Zn 31.8a 1.61b 6.08 4.78 23.6 1.69 4.51 5.12
SEM 0.37 0.04 0.19 0.17 0.31 0.04 0.15 0.13
P-value 0.01 0.01 0.09 0.15 0.58 0.62 0.26 0.59 a,bFor each group of main effects and interaction effects, means within the same column without common letters are significantly different (P≤0.05)

113
Table 4.5 Effects of broiler breeder dietary FORPLUS™ level and Zn source at 41-43 weeks of lay on offspring skeletal leg morphology
Tibia Femur
Length,
mm
Diaphysis
width, mm
Proximal
epiphyseal
width, mm
Distal
epiphyseal
width, mm
Length,
mm
Diaphysis
width, mm
Proximal
epiphyseal
width, mm
Distal
epiphyseal
width, mm
Main Effect of FORPLUS™
0% FORPLUS™ 33.1 1.72 6.82a 5.70 24.3 1.94a 5.12 5.61a
2% FORPLUS™ 32.4 1.73 6.51b 5.32 23.8 1.71b 4.94 5.25b
SEM 0.29 0.02 0.06 0.13 0.16 0.02 0.07 0.07
P-value 0.09 0.68 0.01 0.06 0.05 <0.01 0.12 0.01
Main Effect of Zn Source
ZnO 32.8 1.75 6.67 5.54 24.3 1.86 5.06 5.48
Bioplex® Zn 32.7 1.70 6.66 5.49 23.9 1.80 5.01 5.38
SEM 0.29 0.02 0.06 0.13 0.16 0.02 0.07 0.07
P-value 0.89 0.17 0.97 0.81 0.09 0.08 0.64 0.39
Interaction Effects
0% FORPLUS™ + ZnO 33.0 1.74 6.72ab 5.65 24.5 1.94a 5.11 5.71
2% FORPLUS™ + ZnO 32.6 1.77 6.62bc 5.42 24.0 1.78b 5.00 5.25
0% FORPLUS™ + Bioplex® Zn 33.3 1.70 6.92a 5.76 24.1 1.95a 5.13 5.51
2% FORPLUS™ + Bioplex® Zn 32.1 1.70 6.41c 5.23 23.6 1.65c 4.89 5.26
SEM 0.41 0.03 0.09 0.19 0.23 0.03 0.11 0.10
P-value 0.39 0.64 0.04 0.43 0.96 0.04 0.54 0.33 a,b,cFor each group of main effects and interaction effects, means within the same column without common letters are significantly different (P≤0.05)
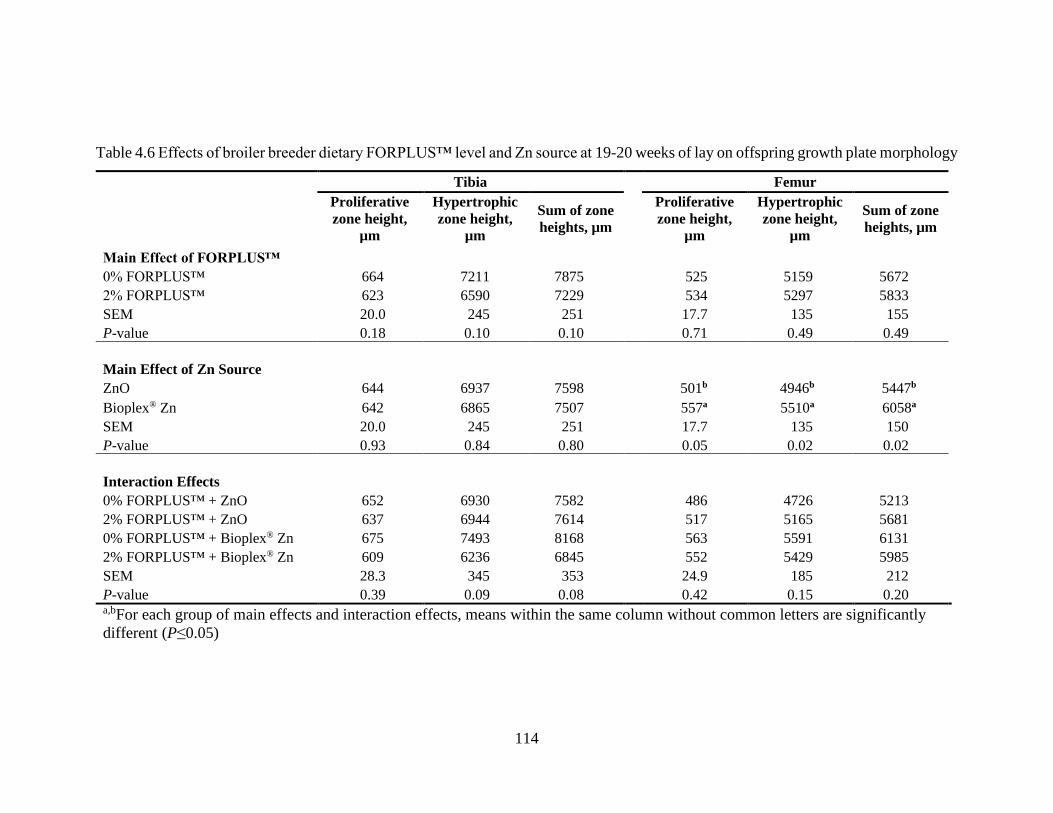
114
Table 4.6 Effects of broiler breeder dietary FORPLUS™ level and Zn source at 19-20 weeks of lay on offspring growth plate morphology
Tibia Femur
Proliferative
zone height,
µm
Hypertrophic
zone height,
µm
Sum of zone
heights, µm
Proliferative
zone height,
µm
Hypertrophic
zone height,
µm
Sum of zone
heights, µm
Main Effect of FORPLUS™
0% FORPLUS™ 664 7211 7875 525 5159 5672
2% FORPLUS™ 623 6590 7229 534 5297 5833
SEM 20.0 245 251 17.7 135 155
P-value 0.18 0.10 0.10 0.71 0.49 0.49
Main Effect of Zn Source
ZnO 644 6937 7598 501b 4946b 5447b
Bioplex® Zn 642 6865 7507 557a 5510a 6058a
SEM 20.0 245 251 17.7 135 150
P-value 0.93 0.84 0.80 0.05 0.02 0.02
Interaction Effects
0% FORPLUS™ + ZnO 652 6930 7582 486 4726 5213
2% FORPLUS™ + ZnO 637 6944 7614 517 5165 5681
0% FORPLUS™ + Bioplex® Zn 675 7493 8168 563 5591 6131
2% FORPLUS™ + Bioplex® Zn 609 6236 6845 552 5429 5985
SEM 28.3 345 353 24.9 185 212
P-value 0.39 0.09 0.08 0.42 0.15 0.20 a,bFor each group of main effects and interaction effects, means within the same column without common letters are significantly
different (P≤0.05)

115
Table 4.7 Effects of broiler breeder dietary FORPLUS™ level and Zn source at 30-31 weeks of lay on offspring growth plate morphology
Tibia Femur
Proliferative
zone height,
µm
Hypertrophic
zone height,
µm
Sum of zone
heights, µm
Proliferative
zone height,
µm
Hypertrophic
zone height,
µm
Sum of zone
heights, µm
Main Effect of FORPLUS™
0% FORPLUS™ 724 6882 7606 555 5148 5703
2% FORPLUS™ 691 7078 7769 570 5056 5625
SEM 20.7 339 331 23.1 181 172
P-value 0.28 0.69 0.73 0.66 0.72 0.75
Main Effect of Zn Source
ZnO 729 6695 7423 561 4927 5488
Bioplex® Zn 687 7265 7952 563 5277 5840
SEM 20.7 3389 331 23.1 181 172
P-value 0.18 0.26 0.28 0.94 0.20 0.17
Interaction Effects
0% FORPLUS™ + ZnO 726 6540 7266 536 4605b 5141b
2% FORPLUS™ + ZnO 731 6849 7580 586 5250ab 5836ab
0% FORPLUS™ + Bioplex® Zn 722 7224 7946 573 5692a 6266a
2% FORPLUS™ + Bioplex® Zn 651 7306 7958 554 4861b 5415b
SEM 29.2 479 468 32.6 256 243
P-value 0.22 0.82 0.75 0.31 0.01 0.01 a,bFor each group of main effects and interaction effects, means within the same column without common letters are significantly
different (P≤0.05)

116
Table 4.8 Effects of broiler breeder dietary FORPLUS™ level and Zn source at 41-43 weeks of lay on offspring growth plate morphology
Tibia Femur
Proliferative
zone height,
µm
Hypertrophic
zone height,
µm
Sum of zone
heights, µm
Proliferative
zone height,
µm
Hypertrophic
zone height,
µm
Sum of zone
heights, µm
Main Effect of FORPLUS™
0% FORPLUS™ 708 6576b 7284b 519 5026 5545
2% FORPLUS™ 697 7364a 8062a 546 5169 5716
SEM 20.9 246 240 16.9 151 153
P-value 0.73 0.04 0.04 0.28 0.52 0.45
Main Effect of Zn Source
ZnO 713 6434b 7147b 554 5179 5733
Bioplex® Zn 692 7506a 8199a 511 5017 5528
SEM 20.9 246 240 16.9 151 153
P-value 0.50 0.01 0.01 0.10 0.46 0.36
Interaction Effects
0% FORPLUS™ + ZnO 725 5847 6572 526 5165 5691
2% FORPLUS™ + ZnO 690 7305 7995 582 5192 5775
0% FORPLUS™ + Bioplex® Zn 700 7021 7722 512 4887 5399
2% FORPLUS™ + Bioplex® Zn 694 7708 8402 510 5147 5657
SEM 29.6 347 340 23.9 214 217
P-value 0.63 0.29 0.30 0.25 0.60 0.70 a,bFor each group of main effects and interaction effects, means within the same column without common letters are significantly
different (P≤0.05)

117
Table 4.9 Effects of broiler breeder dietary FORPLUS™ level and Zn source on offspring
bone-specific alkaline phosphatase in serum
Bone-specific alkaline phosphatase, ng/ml
19-20 wk of lay
(Peak lay)
30-31 wk of lay
(Post-peak lay)
41-43 wk of lay
(Post-peak lay)
Main Effect of FORPLUS™ 0% FORPLUS™ 7.57 5.12 5.66
2% FORPLUS™ 8.54 5.32 5.49
SEM 1.48 0.50 0.41
P-value 0.65 0.79 0.77
Main Effect of Zn Source ZnO 4.75b 5.50 5.67
Bioplex® Zn 11.4a 4.94 5.48
SEM 1.48 0.50 0.41
P-value <0.01 0.44 0.75
Interaction Effects 0% FORPLUS™ + ZnO 5.08 5.72 6.18
2% FORPLUS™ + ZnO 4.42 5.28 5.17
0% FORPLUS™ + Bioplex® Zn 10.1 4.52 5.15
2% FORPLUS™ + Bioplex® Zn 12.7 5.36 5.82
SEM 2.09 0.70 0.58
P-value 0.45 0.38 0.18 a,bFor each group of main effects and interaction effects, means within the same column
without common letters are significantly different (P≤0.05)

118
CHAPTER 5. Effects of Broiler Breeder Dietary Microalgae Level and Zn Source on
Offspring Early Growth Performance and Skeletal Leg Quality
ABSTRACT
Dietary omega-3 (n-3) polyunsaturated fatty acids (PUFA) are known to improve bone
quality in poultry species. FORPLUS™ (Alltech, Inc.) is an unextracted, whole-cell
microalgae (Aurantiochytrium limacinum CCAP 4087/2) source of n-3 PUFA, especially
DHA. Zinc (Zn) is a trace element and essential nutrient for growth and skeletal
development. Bioplex® Zn (Alltech, Inc.) is a Zn proteinate that has been shown to be
more bioavailable to chickens compared to inorganic sources of Zn. The purpose of this
study was to investigate the effects of two levels of FORPLUS™ (0 vs 2%) and two
supplemental Zn sources (ZnO vs. Bioplex® Zn) in broiler breeder diets on offspring early
growth performance and skeletal leg quality. A randomized complete block design was
used for this trial. A total of 240, Cobb 500™ broiler breeder hens and 20 Cobb 500™
broiler breeder roosters were randomly assigned to four dietary treatments. The four
dietary treatments were 1) corn-soybean meal based diet + 40 mg ZnO/kg diet, 2) diet 1 +
2% FORPLUS™, 3) corn-soybean meal based diet + 40 mg Bioplex® Zn/kg diet, 4) Diet
3 + 2% FORPLUS™. When breeders were 19-20 wk of lay, fertile eggs were collected
and incubated until hatch. At hatch, 90 straight-run broiler chicks hatched from each
breeder diet were randomly assigned to 10 cages (9 chicks/cage) and fed a corn-soybean
meal starter diet. Three wk after hatch, broiler chick early growth performance, tibia and
femur gross morphology, tibia and femur breaking strength, tibia ash %, and tibia ash
mineral content measurements were collected. Broiler chicks hatched from breeders fed
diets with 2% FORPLUS™ + ZnO vs 2% FORPLUS™ + Bioplex® Zn had lower (P≤0.05)
initial BW, but this effect did not persist after 3 weeks. Chicks from breeders fed diets
with 0% FORPLUS™ + Bioplex® Zn vs other diets had the greatest (P≤0.05) tibia proximal
epiphyseal width. Offspring femur diaphysis width was also greater (P≤0.05) than other
offspring except those from breeders fed 2% FORPLUS™ + ZnO. A main effect of breeder
FORPLUS™ level was also observed on offspring femur length. Chicks hatched from
breeders fed 2% vs 0% FORPLUS™ had increased (P≤0.05) femur length. Tibia ash Zn

119
content was also increased (P≤0.05) in chicks hatched from breeders fed Bioplex® Zn vs
ZnO. No effects of breeder diet were observed on offspring bone breaking strength.
Overall, broiler breeder dietary supplementation with FORPLUS™ or Bioplex® Zn had
positive impacts on offspring bone morphology up to 3 wk of age without affecting growth
performance.

120
5.1 Introduction
Leg weakness and lameness as a result of skeletal leg disorders and deformities are
issues that cause concern for animal welfare and negatively affect the poultry industry.
Skeletal leg disorders and deformities pose a welfare concern because they may cause pain
and impair a bird’s ability to walk, thereby disrupting normal eating and drinking habits
and behaviors (Kestin et al., 1992; Bradshaw et al., 2002; Dinev, 2009; Nääs et al., 2009).
Consequences of moderate to severe lameness in broilers are lower growth rates, culling,
processing downgrades, and ultimately profit losses (Bradshaw et al., 2002; Knowles et
al., 2008; Dinev, 2009; Gocsik et al., 2017; Wijesurendra et al., 2017). It is estimated that
lameness affects an average of 21.4% of European broiler flocks and approximately 3.0%
of broilers may need to be culled due to severe lameness (Bassler et al., 2013; Marchewka
et al., 2013; Kittelsen et al., 2015; Tullo et al., 2017; Granquist et al., 2019). In the United
States there is a lack of recent, comprehensive studies on the incidence of lameness in
broilers, although it has been claimed that up to 6% of broilers have obvious skeletal
abnormalities or leg problems and 2% of broiler flocks suffer losses due to lameness
(Dunkley, 2007; Mitchell, 2014).
With regard to broiler breeding, genetic selection against skeletal leg problems in
broilers is a slow process and some researchers have indicated that changes to nutrition and
living environment may be more effective (Angel, 2007; Knowles et al., 2008; Rekaya et
al., 2013; Mitchell, 2014; González-Cerón et al., 2015). Management strategies to improve
broiler leg health have its limitations. Enrichment of broiler houses to induce exercise have
not been successful in limiting skeletal leg problems (Sherlock et al., 2010; Bailie et al.,
2018; Meyer et al., 2019). Litter choice is important for leg health, but if litter quality
deteriorates remedies to lessen its impact on leg health are very limited (Su et al., 2000).
Stocking density may improve leg health as it has consequences on litter quality, but
lowering stocking density to the extent of reducing leg problems would be very cost
prohibitive for many producers (Knowles et al., 2008). Longer periods of darkness (Cobb-
Vantress, 2012; Bassler et al., 2013; Aviagen, 2018) and control of toxin exposure can also
reduce or prevent skeletal disorders but have finite application in skeletal development and
health.

121
Dietary omega-3 (n-3) polyunsaturated fatty acids (PUFA) can be transferred from
broiler breeder diets to offspring tissues (Lin et al., 1991; Pappas et al., 2006; Hall et al.,
2007; Bautista-Ortega et al., 2009; Cherian et al., 2009; Koppenol et al., 2015a) and are
known to improve bone quality in poultry species (Watkins et al., 1996a; Watkins et al.,
1997b; Liu et al., 2003; Fleming, 2008). However, there is a lack of research on the effect
of broiler breeder dietary n-3 PUFA supplementation on offspring skeletal development
and limited information is available on n-3 PUFA in broiler diets on offspring performance
(Koppenol et al., 2015c). FORPLUS™ (Alltech, Inc.) is an unextracted, whole-cell
microalgae (Aurantiochytrium limacinum CCAP 4087/2) source of n-3 PUFA. It contains
64% fat with 16% of that fat as docosahexaenoic acid (DHA). Microalgae rich in n-3
PUFA may be considered as a sustainable, alternative to fish oil which is a common source
of n-3 PUFA in poultry diets.
It is well known that zinc (Zn), an essential trace element and nutrient, is an integral
component of numerous enzymes and proteins. These Zn-dependent molecules have
important roles in numerous biochemical and metabolic functions such as cell growth and
proliferation, cell differentiation, gene expression, and immunity (Vallee and Falchuk,
1993; Plum et al., 2010; Haase and Rink, 2014a, b). Zn is also essential for skeletal
development, specifically due to its role in stimulating the synthesis of collagen and
chondroitin for bone matrix and structure formation (Brandao-Neto et al., 1995) as well as
its role in osteoblast proliferation and activity (Seo et al., 2010). Supplementation of
organic Zn vs inorganic Zn in breeder diets resulted in reduced incidence of skeletal leg
abnormalities of offspring (Hudson et al., 2005), revealing the importance of Zn source in
offspring skeletal leg health. Blending organic trace minerals such as Cu, Mn, and Zn with
their inorganic counterparts in broiler breeder diets improved offspring bone calcification
rate, morphology, and biomechanical properties during the late embryonic development
(Favero et al., 2013). However, there is a lack of information on the long-term Zn source
supplementation in broiler breeder diets on offspring skeletal development and growth
performance. Bioplex® Zn (Alltech, Inc.) is a Zn-proteinate product that is more
bioavailable to broilers than some other sources of inorganic Zn (Ao et al., 2006; Ao et al.,
2011). The objective of this study was to evaluate two levels of dietary FORPLUS™ and

122
two sources of Zn in broiler breeder diets on offspring early growth performance and bone
quality after hatch.
5.2 Materials and Methods
This study was conducted in compliance with the University of Kentucky
Institutional Animal Care and Use Committee protocols.
5.2.1 Experimental Design
A complete randomized block design with a 2x2 factorial treatment arrangement
consisting of 2 levels of microalgae supplementation (0% vs 2% FORPLUS™) and two
sources of supplemental Zn (ZnO vs Bioplex® Zn) was used for this study. A total of 240,
Cobb 500™ broiler breeder hens and 20 Cobb 500™ broiler breeder roosters were
randomly assigned to four dietary treatments. The four dietary treatments were 1) corn-
soybean meal based diet + 40 mg ZnO/kg diet, 2) diet 1 + 2% FORPLUS™, 3) corn-
soybean meal based diet + 40 mg Bioplex® Zn/kg diet, 4) Diet 3 + 2% FORPLUS™. Diets
were formulated to meet or exceed the energy and nutrient requirements (NRC, 1994)
before lay and during peak lay (1-27 weeks of lay). Broiler breeders were provided ad
libitum access to water and supplied feed on a daily feeding regimen in a feeding trough as
per the Cobb® Breeder Management Guide (Cobb-Vantress, 2012).
The broiler breeders were housed in floor pen units that measured approximately
1.22 x 1.83 sq. meters. The litter for each pen was 100% large flake, pine wood shavings
supplied at approximately 3.66 cu. meters per pen and refreshed as needed. Broiler
breeders were raised in an ambient temperature range of 18.3 to 29.4 °C. Prior to the onset
of lay, a two-tier nest box that could accommodate up to four birds at a time was added to
each pen. Photostimulation was provided as 15 hours of light and 9 hours of darkness
throughout the entire laying period.
Fertile eggs were collected from each breeder pen at 19-20 weeks of lay (peak lay),
The eggs were set in a Nature Form Incubator (model 4680). Eggs were separated and
incubated by pen using incubator trays. The incubator temperature and relative humidity
conditions were set to 37.5°C and 60%, respectively. On embryonic day 18, eggs were
123
transferred to a Nature Form Hatcher (model 45) where the temperature was maintained at
36.9°C and relative humidity was set to 64%. Eggs were grouped and labeled by pen using
wooden dividers in hatcher trays. Newly hatched, straight-run broiler chicks were removed
from the hatcher after 21 days of incubation.
A total of 90 straight-run, one-day old broiler chicks from each breeder dietary
group were randomly distributed to wire cages. This resulted in 10 replicate cage groups
of 9 broiler chicks per broiler breeder dietary treatment. Cage dimensions were
approximately 52 cm length x 61 cm width x 36 cm height. Broiler chicks were provided
ad libitum access to water via nipple drinkers and feed via hanging feeding troughs. All
broiler chicks were provided a corn-soybean meal based starter diet formulated to meet or
exceed energy and nutrient requirements (NRC, 1994). Temperature was set at 29.4°C for
the first seven days and then maintained at an ambient temperature between 18.3-29.4°C
for the remainder of the study. Exhaust fans provided ventilation and were used to control
moisture and humidity. Daily photostimulation was provided at 22 hours of light and 2
hours of darkness.
5.2.2 Early growth performance
Early growth performance of broiler chicks was measured from placement to 3
weeks of age. Cage body weight (BW) was recorded at placement and measured weekly
thereafter to calculate average body weight gain (BWG). Average feed intake (FI) of each
cage was measured weekly and used to calculate feed conversion (FC) represented by the
ratio of FI to BWG. All measurements of BWG, FI, and FC were corrected for chick
mortality.
5.2.3 Leg Bone Quality Measurements
At 3 weeks of age, two broiler chicks per cage were randomly selected and
euthanized by argon gas asphyxiation and cervical dislocation. Tibias and femurs were
collected from broilers for measurements of gross bone morphology and peak bone
breaking strength. Only tibias were used for bone ash percentage determination and
mineral content determination. Tibias and femurs from the first broiler were used to

124
analyze gross bone morphology and bone breaking strength, whereas tibias from the second
broiler were used to analyze ash percentage and ash mineral content.
The tibias and femurs were cleaned of excess cartilage and flesh prior to analysis.
Length, diaphysis width, proximal epiphyseal width, and distal epiphyseal width
measurements of tibias and femurs were obtained using digital calipers. Measurements
from the left and right tibias as well as the left and right femurs were averaged. The bones
were then subjected to a three-point bending mechanical analysis (Instron Testing
Instrument, model 4301) to obtain peak breaking strength. The midshaft of bones were
positioned perpendicular to a steel wedge probe with the anterior side of the bone facing
probe. A load force of 100 kg was applied to the midshaft of the bone at 40mm/min until
peak breaking strength was determined.
For ash determination, tibias were boiled for 15 minutes in deionized water to aid
in removal of flesh. Excess flesh and cartilage caps were removed from the bones. They
were then oven dried at 60°C for 72 hours. Afterwards, bones were soaked in 100%
petroleum ether until fat residues were removed. The bones were then oven dried overnight
at 105°C in porcelain crucibles to obtain the dry weight. After drying, bones were ashed
in a muffle furnace at 600°C for 6 hours (Ao et al., 2006). Ash percentage of each bone
was calculated and expressed as a percentage of dry weight.
Ashed tibias were then ground and homogenized for mineral analysis.
Approximately 0.2 grams of tibia ash was microwave digested in 8 ml concentrated nitric
acid (TraceMetal™ Grade, Fisher Scientific), 2 ml concentrated hydrochloric acid
(TraceMetal™ Grade, Fisher Scientific), and 10 ml of deionized water using CEM
Microwave Accelerated Reaction System 6 VessExpress program. Acid digested samples
were then diluted to with deionized water for trace mineral, Ca, and P analysis using
inductively coupled plasma-optical emission spectrum (Agilent Technologies Inc ICP-
OES, model 5110).
5.2.4 Statistical Analysis
All data were subjected to a two-way statistical analysis of variance using the
general linear model procedures of SAS® Software, version 9.4 (SAS, 2016). The model
included the fixed effect of block by experimental unit (cage) location, the main effect of

125
dietary FORPLUS™ level, the main effect of supplemental Zn source and the interaction
effect of those two factors for all measured and calculated variables. Mean values were
separated and compared using Fisher’s protected least significant difference test. Mean
values were declared significantly different for P values ≤ 0.05.
5.3 Results and Discussions
5.3.1 Early Growth Performance
An interaction effect of broiler breeder dietary FORPLUS™ level and Zn source
during 19-20 weeks of lay was observed on offspring hatch BW (Table 5.2). Broiler chicks
hatched from breeders fed diets with 2% FORPLUS™ + ZnO had lower hatch BW
compared to other chicks except those hatched form breeders fed 2% FORPLUS™ +
Bioplex® Zn. The depressed hatch weight can be attributed to the effect of 2%
FORPLUS™. However, early growth performance and final BW of offspring through 3
weeks of age was not affected by broiler breeder diet. In other studies broiler breeders fed
diets supplemented with various sources of n-3 PUFA produced smaller eggs (Pappas et
al., 2005; Cherian, 2008; Koppenol et al., 2014) and reduced chick weight at hatch
(Koppenol et al., 2015c). In contrast with results presented in this study, Koppenol et al.
(2015c) found that broiler chick BW and daily weight gain were reduced and FC was
poorer at 14 and 28 days of age due to breeder hen supplementation with n-3 PUFA.
Breeder hen Zn source was also reported not to affect early offspring performance through
17 days of age in a separate study (Hudson et al., 2005).
5.3.2 Leg Bone Quality
When offspring were 3 weeks of age, an interaction effect of breeder diet was
observed on tibia and femur morphology. Table 5.3 shows that offspring from breeders
fed diets with 0% FORPLUS™ + Bioplex® Zn had the greatest tibia proximal epiphyseal
width. Offspring femur diaphysis width was also increased compared to other offspring
except those from breeders fed 2% FORPLUS™ + ZnO. A main effect of breeder
FORPLUS™ level was also observed on offspring femur length. Chicks hatched from
breeders fed 2% vs 0% FORPLUS™ had increased (P≤0.05) femur length (47.5 vs 46.6

126
mm). No effects of breeder dietary treatment were evident for offspring bone breaking
strength when offspring were 3 weeks old (Table 5.4). However, a main effect of dietary
breeder Zn source was detected in offspring tibia ash Zn content (Table 5.5). Broiler chicks
from breeders fed diets with Bioplex® Zn during peak lay had increased tibia ash Zn content
compared to broiler chicks from breeders fed ZnO.
In Chapter 4, breeder dietary supplementation of Bioplex® Zn or FORPLUS™
during lay improved bone morphology of offspring, specifically bone length and
epiphyseal width, at hatch (Table 4.3). Improvements to bone morphology due to breeder
diet were observed in the proximal epiphysis, diaphysis, and length 3 weeks after hatch.
The epiphysis and metaphysis contains more trabecular bone which is more porous and has
higher resistance to strain than cortical bone found in the diaphysis (Howlett, 1980; Xu et
al., 1995; Villemure and Stokes, 2009; Hart et al., 2017). It is possible that both Bioplex®
Zn positively influenced trabecular bone formation in the tibia epiphysis, but further
evaluation is needed to confirm this. In previous research, a blend of organic and inorganic
Cu, Mn and Zn supplementation in broiler breeder diets improved offspring tibia and femur
diaphysis width at 14 days of embryonic development compared to inorganic trace mineral
supplementation alone (Favero et al., 2013). Kidd et al. (1992) found that tibia dry weight
was greater in offspring from breeders fed organic Zn vs inorganic Zn. Ash content
remained the same between the two groups. Dry weight accounts for the organic and
inorganic components of bone whereas ash accounts mainly for the inorganic portion of
bone. Their results indicate that dietary breeder Zn source may have affected the organic
portion of offspring bone which contains collagen, protein, enzymes, etc. Zn is known to
control the initiation of mineralization in bones, influence osteoblast activity, and increase
growth plate chondrocyte protein and enzyme activity (Litchfield et al., 1998; Kirsch et al.,
2000; Kwun et al., 2010; Seo et al., 2010). In rats organic Zn has been shown to increase
the Zn content in bone as well as Ca content and enzyme activity related to bone formation
compared to inorganic Zn (Yamaguchi et al., 2004).
Maternal fish oil supplementation in quail was found to increase the bone n-3 PUFA
content of their offspring at hatch and up to one week after hatch compared to soybean oil
supplementation (Liu and Denbow, 2001). Female rats provided DHA during pregnancy
and lactation produced offspring with increased osteoblast density and trabecular bone

127
formation (Fong et al., 2012). Exposure to dietary n-3 PUFA at a young age accelerated
bone growth and improved bone quality in mice (Koren et al., 2014). DHA is especially
critical for osteoblastogenesis and bone formation during bone modelling in young animals
(Watkins et al., 2003) as it activates free fatty acid receptor 4 in mature osteoblasts and
osteoclasts to stimulate bone formation and decrease resorption, respectively (Ahn et al.,
2016).
5.4 Summary and Conclusions
Dietary FORPLUS™ supplementation in broiler breeder diets during peak-lay
reduced chick hatch weight but did not have a lasting impact on offspring early growth
performance. Bioplex® Zn without FORPLUS™ supplementation improved bone
morphology and Zn content 3 weeks after hatch. FORPLUS™ supplementation in broiler
breeder diets also improved bone morphology 3 weeks after hatch. Based on these results,
supplementation of FORPLUS™ or Bioplex® Zn in broiler breeder diets positively
impacted offspring skeletal bone morphology even 3 weeks after hatch.

128
5.5 Tables
Table 5.1 Diet and nutrient composition of broiler breeder layer and broiler starter diets
Broiler Breeder Peak Layer Diets Broiler
Diet Composition, % Diet 1 Diet 2 Diet 3 Diet 4 Starter
Corn 67.3 65.0 67.3 65.0 57.0
Soybean meal (48% CP) 22.0 21.5 22.0 21.5 36.0
Alfalfa meal (17% CP) 0.78 2.02 0.78 2.02 -
Oyster shell 3.00 3.00 3.00 3.00 -
FORPLUS™ - 2.00 - 2.00 -
Vegetable oil 0.52 0.08 0.52 0.08 2.95
Limestone (38% Ca) 3.80 3.75 3.80 3.75 1.26
Dicalcium Phosphate 1.65 1.65 1.65 1.65 1.75
Salt, iodized 0.40 0.39 0.40 0.39 0.45
Vitamin premix1 0.25 0.25 0.25 0.25 -
ZnO mineral premix2 0.25 0.25 - - -
Bioplex® Zn mineral
premix3 - - 0.25 0.25 -
Vitamin-mineral premix4 - - - - 0.25
DL-Methionine 0.10 0.10 0.10 0.10 0.26
Total 100 100 100 100 100
Nutrient Composition
AMEn, kcal/kg 2850 2850 2850 2850 3050
Protein, %5 16.1 15.9 16.1 16.5 22.0
Ca, %5 3.72 3.61 3.77 4.07 1.00
Avail. P, % 0.41 0.41 0.41 0.41 0.45
TSAA, %5 0.52 0.55 0.55 0.56 0.95
Lysine, %5 0.90 0.88 0.91 0.90 1.30
Na, % 0.18 0.18 0.18 0.18 0.20
Total Zn, mg/kg5 84.5 79.4 89.9 94.3 -
Crude Fat, %5 3.27 4.98 2.69 6.13 -
DHA, %5 0.00 0.34 0.01 0.39 -
Total n-3 PUFA, %5 0.09 0.44 0.09 0.51 -
Total n-6 PUFA, %5 1.63 1.87 1.40 2.34 -
n-6: n-3 PUFA 17.6 4.24 16.4 4.55 - 1Supplied per kg of diet: 9921 IU of vitamin A, 2756 ICU of vitamin D3, 33 IU vitamin E, 22.0 µg of vitamin
B12, 0.11 mg of biotin, 1.98 mg of vitamin K (as menadione), 1.98 mg of thiamine, 6.6 mg of riboflavin, 11 mg
of d-pantothenic acid, 3.97 mg of vitamin B6, 44 mg of niacin, 1.32 mg of folic acid, 496 mg of choline
2Supplied per kg diet: 0.3mg Se as Ne2SO3, 5mg Cu as CuSO4.H2O, 20mg Fe as FeSO4.H2O, 75mg Mn as
MnSO4.H2O, 40mg Zn as ZnO, 1.5mg I as KIO3
3Supplied per kg diet: 0.3mg Se as Ne2SO3, 5mg Cu as CuSO4.H2O, 20mg Fe as FeSO4.H2O, 75mg Mn as
MnSO4.H2O, 40mg Zn as Bioplex® Zn, 1.5mg I as KIO3
4Supplied per kg diet: 11025 IU of vitamin A, 3258 IU vitamin D, 33 IU vitamin E, 0.91 mg of vitamin K, 2.21
mg thiamine, 7.72 mg riboflavin, 55 mg niacin, 18 mg pantothenate, 5 mg vitamin B6, 0.22 mg biotin, 1.10 mg
folic acid, 478 mg choline, 30 µg vitamin B12, 75 mg Zn as ZnO, 40 mg Fe as FeSO4.H2O, 64 mg Mn as MnO2,
10 g Cu as CuSO4.H2O, 1.85 mg I as EDDI, 0.25 mg Se as Ne2SO3 5Analyzed value of breeder diets only

129
Table 5.2 Effects of broiler breeder dietary FORPLUS™ level and Zn source on offspring
early growth performance through 3 weeks of age
Hatch
BW, g/b BW, g/b
BWG,
g/b FI, g/b FC
Main Effect of FORPLUS™
0% FORPLUS™ 43.2a 706 613 861 1.41
2% FORPLUS™ 42.1b 689 598 849 1.42
SEM 0.29 7.27 5.56 9.80 0.02
P-value 0.01 0.10 0.07 0.39 0.55
Main Effect of Zn Source
ZnO 42.5 704 613 866 1.41
Bioplex® Zn 42.7 691 598 844 1.41
SEM 0.29 7.27 5.56 9.80 0.02
P-value 0.51 0.20 0.07 0.13 0.98
Interaction Effects
0% FORPLUS™ + ZnO 43.4a 707 619 871 1.41
2% FORPLUS™ + ZnO 41.5b 702 607 860 1.42
0% FORPLUS™ + Bioplex® Zn 42.9a 706 607 851 1.40
2% FORPLUS™ + Bioplex® Zn 42.6ab 676 589 837 1.42
SEM 0.41 10.3 7.86 13.9 0.02
P-value 0.05 0.25 0.67 0.94 0.84 a,bFor each group of main effects and interaction effects, means within the same
column without common letters are significantly different (P≤0.05)

130
Table 5.3 Effects of broiler breeder dietary FORPLUS™ level and Zn source on offspring skeletal leg morphology at 3 weeks of age
Tibia Femur
Length,
mm
Diaphysis
width, mm
Proximal
epiphyseal
width, mm
Distal
epiphyseal
width, mm
Length,
mm
Diaphysis
width, mm
Proximal
epiphyseal
width, mm
Distal
epiphyseal
width, mm
Main Effect of FORPLUS™
0% FORPLUS™ 61.8 5.00 16.5 13.3 46.6b 6.10 12.9 13.9
2% FORPLUS™ 62.2 4.94 16.2 13.0 47.5a 5.99 13.1 13.6
SEM 0.46 0.07 0.15 0.12 0.29 0.07 0.21 0.22
P-value 0.48 0.58 0.14 0.06 0.03 0.34 0.56 0.40
Main Effect of Zn Source
ZnO 61.8 4.92 16.2 13.0 46.9 6.02 13.0 13.4
Bioplex® Zn 62.2 5.02 16.5 13.3 47.2 6.07 13.0 14.1
SEM 0.46 0.07 0.14 0.12 0.29 0.07 0.21 0.22
P-value 0.47 0.33 0.13 0.19 0.45 0.69 0.97 0.06
Interaction Effects
0% FORPLUS™ + ZnO 61.1 4.87 16.0b 13.1 46.3 5.94b 12.8 13.7
2% FORPLUS™ + ZnO 62.5 4.98 16.3b 12.9 47.6 6.11ab 13.2 13.2
0% FORPLUS™ + Bioplex® Zn 62.4 5.14 16.9a 13.5 46.9 6.25a 13.1 14.0
2% FORPLUS™ + Bioplex® Zn 62.0 4.91 16.0b 13.0 47.5 5.88b 13.0 14.1
SEM 0.65 0.10 0.20 0.17 0.42 0.11 0.29 0.31
P-value 0.16 0.12 0.01 0.57 0.39 0.02 0.43 0.31 a,bFor each group of main effects and interaction effects, means within the same column without common letters are significantly different (P≤0.05)

131
Table 5.4 Effects of broiler breeder dietary FORPLUS™ level and Zn source on offspring
bone breaking strength at 3 weeks of age
Tibia breaking
strength, kg force
Femur breaking
strength, kg force
Main Effect of FORPLUS™
0% FORPLUS™ 18.5 15.3
2% FORPLUS™ 16.8 14.0
SEM 0.71 0.56
P-value 0.12 0.13
Main Effect of Zn Source
ZnO 18.1 14.5
Bioplex® Zn 17.2 14.8
SEM 0.71 0.56
P-value 0.34 0.71
Interaction Effects
0% FORPLUS™ + ZnO 18.3 14.9
2% FORPLUS™ + ZnO 17.9 14.0
0% FORPLUS™ + Bioplex® Zn 18.6 15.6
2% FORPLUS™ + Bioplex® Zn 15.7 14.0
SEM 1.01 0.80
P-value 0.23 0.70

132
Table 5.5 Effects of broiler breeder dietary FORPLUS™ level and Zn source on offspring tibia ash percentage and mineral content at 3
weeks of age
Ash, % Cu, ppb Fe, ppm Mn, ppm Zn, ppm Ca, % P, %
Main Effect of FORPLUS™
0% FORPLUS™ 54.4 5.49 277 9.07 420 38.2 19.2
2% FORPLUS™ 54.3 5.51 289 8.94 405 38.2 19.2
SEM 0.30 0.06 9.54 0.31 7.52 0.13 0.06
P-value 0.82 0.81 0.37 0.76 0.18 1.00 0.95
Main Effect of Zn Source
ZnO 54.2 5.56 295 8.74 399b 38.1 19.2
Bioplex® Zn 54.6 5.44 271 9.27 427a 38.3 19.2
SEM 0.29 0.06 9.48 0.30 7.47 0.13 0.06
P-value 0.35 0.15 0.07 0.22 0.01 0.17 0.61
Interaction Effects
0% FORPLUS™ + ZnO 54.2 5.53 291 8.89 404 38.0 19.2
2% FORPLUS™ + ZnO 54.1 5.60 300 8.59 394 38.1 19.2
0% FORPLUS™ + Bioplex® Zn 54.6 5.46 262 9.26 437 38.4 19.3
2% FORPLUS™ + Bioplex® Zn 54.5 5.43 279 9.28 417 38.2 19.2
SEM 0.41 0.08 13.4 0.43 10.5 0.18 0.09
P-value 0.93 0.55 0.77 0.71 0.65 0.40 0.35 a,bFor each group of main effects and interaction effects, means within the same column without common letters are significantly
different (P≤0.05)

133
CHAPTER 6. Effects of Broiler Breeder Dietary Microalgae Level, Zn Source, and
Offspring Zn Source on Offspring Early Growth Performance and Skeletal Leg
Quality
ABSTRACT
Dietary omega-3 (n-3) polyunsaturated fatty acids (PUFA) are known to improve bone
quality in poultry species. FORPLUS™ (Alltech, Inc.) is an unextracted, whole-cell
microalgae (Aurantiochytrium limacinum CCAP 4087/2) source of n-3 PUFA, especially
DHA. Zinc (Zn) is a trace element and essential nutrient for growth and skeletal
development. Bioplex® Zn (Alltech, Inc.) is a Zn proteinate that has been shown to be
more bioavailable to chickens compared to inorganic sources of Zn. The purpose of this
study was to investigate the effects of broiler breeder diet and offspring dietary Zn source
(ZnO vs. Bioplex® Zn) on offspring early growth performance and skeletal leg quality. A
randomized complete block design with a 4x2 factorial treatment structure was used for
this trial. A total of 240, Cobb 500™ broiler breeder hens and 20 Cobb 500™ broiler
breeder roosters were randomly assigned to four dietary treatments. The four breeder
dietary treatments were 1) corn-soybean meal based diet + 40 mg ZnO/kg diet, 2) diet 1 +
2% FORPLUS™, 3) corn-soybean meal based diet + 40 mg Bioplex® Zn/kg diet, 4) Diet
3 + 2% FORPLUS™. When breeders were 30-31 wk of lay, fertile eggs were collected
and incubated until hatch. With respect to broiler breeder diet, 128 straight-run broiler
chicks hatched from each breeder dietary treatment group were assigned to broiler starter
diets supplemented with 40 mg Bioplex® Zn or ZnO/ kg feed. This resulted in 8 replicate
cages (8 chicks/cage) per dietary treatment. Broiler chick early growth performance, tibia
and femur breaking strength, tibia gross morphology, tibia ash %, and tibia ash mineral
content were measured after 3 wk. Broiler chicks hatched from breeders fed diets with 2%
vs 0% FORPLUS™ had lower (P≤0.05) initial BW, whereas broiler chicks hatched from
breeders provided diets with Bioplex® Zn vs ZnO had greater (P≤0.05) initial BW. After
3 wk, offspring from breeders fed diets with 2% vs 0% FORPLUS™ exhibited reduced
(P≤0.05) BWG and FI. Offspring that were 3 wk old had greater (P≤0.05) BW when fed
diets with Bioplex Zn vs ZnO. No effects of breeder or offspring diet were observed for

134
bone breaking strength, tibia ash percentage, or tibia ash mineral content. At 3 wk of age,
offspring had greater (P≤0.05) tibia diaphysis width and circumference when fed diets
supplemented with Bioplex® Zn vs ZnO. In conclusion, broiler breeder dietary
supplementation of FORPLUS™ negatively affected offspring early growth performance
while offspring dietary supplementation of Bioplex® Zn positively influenced tibia
morphology.

135
6.1 Introduction
Leg weakness and lameness as a result of skeletal leg disorders and deformities are
issues that cause concern for animal welfare and negatively affect the poultry industry.
Skeletal leg disorders and deformities pose a welfare concern because they may cause pain
and impair a bird’s ability to walk, thereby disrupting normal eating and drinking habits
and behaviors (Kestin et al., 1992; Bradshaw et al., 2002; Dinev, 2009; Nääs et al., 2009).
Consequences of moderate to severe lameness in broilers are lower growth rates, culling,
processing downgrades, and ultimately profit losses (Bradshaw et al., 2002; Knowles et
al., 2008; Dinev, 2009; Gocsik et al., 2017; Wijesurendra et al., 2017). It is estimated that
lameness affects an average of 21.4% of European broiler flocks and approximately 3.0%
of broilers may need to be culled due to severe lameness (Bassler et al., 2013; Marchewka
et al., 2013; Kittelsen et al., 2015; Tullo et al., 2017; Granquist et al., 2019). In the United
States there is a lack of recent, comprehensive studies on the incidence of lameness in
broilers, although it has been claimed that up to 6% of broilers have obvious skeletal
abnormalities or leg problems and 2% of broiler flocks suffer losses due to lameness
(Dunkley, 2007; Mitchell, 2014).
With regard to broiler breeding, genetic selection against skeletal leg problems in
broilers is a slow process and some researchers have indicated that changes to nutrition and
living environment may be more effective (Angel, 2007; Knowles et al., 2008; Rekaya et
al., 2013; Mitchell, 2014; González-Cerón et al., 2015). Management strategies to improve
broiler leg health have its limitations. Enrichment of broiler houses to induce exercise have
not been successful in limiting skeletal leg problems (Sherlock et al., 2010; Bailie et al.,
2018; Meyer et al., 2019). Litter choice is important for leg health, but if litter quality
deteriorates remedies to lessen its impact on leg health are very limited (Su et al., 2000).
Stocking density may improve leg health as it has consequences on litter quality, but
lowering stocking density to the extent of reducing leg problems would be very cost
prohibitive for many producers (Knowles et al., 2008). Longer periods of darkness (Cobb-
Vantress, 2012; Bassler et al., 2013; Aviagen, 2018) and control of toxin exposure can also
reduce or prevent skeletal disorders but have finite application in skeletal development and
health.

136
Dietary omega-3 (n-3) polyunsaturated fatty acids (PUFA) can be transferred from
broiler breeder diets to offspring tissues (Lin et al., 1991; Pappas et al., 2006; Hall et al.,
2007; Bautista-Ortega et al., 2009; Cherian et al., 2009; Koppenol et al., 2015a) and are
known to improve bone quality in poultry species (Watkins et al., 1996a; Watkins et al.,
1997b; Liu et al., 2003; Fleming, 2008). However, there is a lack of research on the effect
of broiler breeder dietary n-3 PUFA supplementation on offspring skeletal development
and limited information is available on n-3 PUFA in broiler diets on offspring performance
(Koppenol et al., 2015c). FORPLUS™ (Alltech, Inc.) is an unextracted, whole-cell
microalgae (Aurantiochytrium limacinum CCAP 4087/2) source of n-3 PUFA. It contains
64% fat with 16% of that fat as docosahexaenoic acid (DHA). Microalgae rich in n-3
PUFA may be considered as a sustainable, alternative to fish oil which is a common source
of n-3 PUFA in poultry diets.
It is well known that zinc (Zn), an essential trace element and nutrient, is an integral
component of numerous enzymes and proteins. These Zn-dependent molecules have
important roles in numerous biochemical and metabolic functions such as cell growth and
proliferation, cell differentiation, gene expression, and immunity (Vallee and Falchuk,
1993; Plum et al., 2010; Haase and Rink, 2014a, b). Zn is also essential for skeletal
development, specifically due to its role in stimulating the synthesis of collagen and
chondroitin for bone matrix and structure formation (Brandao-Neto et al., 1995) as well as
its role in osteoblast proliferation and activity (Seo et al., 2010). Supplementation of
organic Zn vs inorganic Zn in breeder diets resulted in reduced incidence of skeletal leg
abnormalities of offspring (Hudson et al., 2005), revealing the importance of Zn source in
offspring skeletal leg health. Blending organic trace minerals such as Cu, Mn, and Zn with
their inorganic counterparts in broiler breeder diets improved offspring bone calcification
rate, morphology, and biomechanical properties during the late embryonic development
(Favero et al., 2013). Based on review of literature, only one other study has reported on
the effects of broiler breeder Zn source and offspring Zn source on offspring growth
performance, but that study did not evaluate offspring bone quality (Hudson et al., 2005).
Bioplex® Zn (Alltech, Inc.) is a Zn-proteinate product that is more bioavailable to broilers
than some other sources of inorganic Zn (Ao et al., 2006; Ao et al., 2011). The objective
of this study was to evaluate dietary supplementation of FORPLUS™ and two sources of

137
Zn in broiler diets and offspring dietary zinc source on offspring early growth performance
and bone quality after hatch.
6.2 Materials and Methods
This study was conducted in compliance with the University of Kentucky
Institutional Animal Care and Use Committee protocols.
6.2.1 Experimental Design
A complete randomized block design with a 4x2 factorial treatment arrangement
consisting of four broiler breeder dietary treatments and two offspring dietary Zn sources
was used for this study. The four broiler breeder dietary treatments were 1) corn-soybean
meal based diet + 40 mg ZnO/kg diet, 2) diet 1 + 2% FORPLUS™, 3) corn-soybean meal
based diet + 40 mg Bioplex® Zn/kg diet, 4) Diet 3 + 2% FORPLUS™. Diets were
formulated to meet or exceed the energy and nutrient requirements (NRC, 1994) before lay
and throughout lay. The two offspring dietary Zn sources were ZnO and Bioplex® Zn
supplemented at 40 mg Zn/kg diet. The broiler starter diets were designed to meet all other
minimum energy and nutrient requirements (NRC, 1994). FORPLUS™ (Alltech, Inc.) is
an unextracted, whole-cell microalgae (Aurantiochytrium limacinum CCAP 4087/2) that
contains a minimum of 64% fat with 16% of the fat as DHA. Bioplex® Zn (Alltech, Inc.)
is a Zn-proteinate product. A total of 240 Cobb 500™ broiler breeder hens and 20 Cobb
500™ broiler breeder roosters were randomly assigned to the four dietary treatments.
Broiler breeders were provided ad libitum access to water and supplied feed on a daily
feeding regimen in a feeding trough as per the Cobb® Breeder Management Guide (Cobb-
Vantress, 2012).
The broiler breeders were housed in floor pen units that measured approximately
1.22 x 1.83 sq. meters. The litter for each pen was 100% large flake, pine wood shavings
supplied at approximately 3.66 cu. meters per pen and refreshed as needed. Broiler
breeders were raised in an ambient temperature range of 18.3 to 29.4 °C. Prior to the onset
of lay, a two-tier nest box that could accommodate up to four birds at a time was added to

138
each pen. Photostimulation was provided as 15 hours of light and 9 hours of darkness
throughout the entire laying period.
Fertile eggs were collected from each breeder pen at 30-31 weeks of lay (post-peak
lay), The eggs were set in a Nature Form Incubator (model 4680). Eggs were separated
and incubated by pen using incubator trays. The incubator temperature and relative
humidity conditions were set to 37.5°C and 60%, respectively. On embryonic day 18, eggs
were transferred to a Nature Form Hatcher (model 45) where the temperature was
maintained at 36.9°C and relative humidity was set to 64%. Eggs were grouped and labeled
by pen using wooden dividers in hatcher trays. Newly hatched, straight-run broiler chicks
were removed from the hatcher after 21 days of incubation.
With respect to broiler breeder diet, a total of 128 straight-run, one-day old broiler
chicks from each breeder dietary group were randomly assigned to diets containing
supplemental ZnO or Bioplex® Zn. This resulted in 8 replicate cages of 8 chicks per dietary
treatment. Cage dimensions were approximately 52 cm length x 61 cm width x 36 cm
height. Broiler chicks were provided ad libitum access to water via nipple drinkers and
feed via hanging feeding troughs. All broiler chicks were provided a corn-soybean meal
based starter diet formulated to meet or exceed energy and nutrient requirements (NRC,
1994). Temperature was set at 29.4°C for the first seven days and then maintained at an
ambient temperature between 18.3-29.4°C for the remainder of the study. Exhaust fans
provided ventilation and were used to control moisture and humidity. Daily
photostimulation was provided at 22 hours of light and 2 hours of darkness.
6.2.2 Early growth performance
Early growth performance of broiler chicks was measured from placement to 3
weeks of age. Cage body weight (BW) was recorded at placement and measured weekly
thereafter to calculate average body weight gain (BWG). Average feed intake (FI) of each
cage was measured weekly and used to calculate feed conversion (FC) represented by the
ratio of FI to BWG. All measurements of BWG, FI, and FC were corrected for chick
mortality.

139
6.2.3 Leg Bone Quality Measurements
At 3 weeks of age, two broiler chicks per cage were randomly selected and
euthanized by argon gas asphyxiation and cervical dislocation. Tibias and femurs were
collected from broilers for measurements of peak bone breaking strength. Only tibias were
used for gross morphology, bone ash percentage determination, and mineral content
determination. Tibias and femurs from the first broiler were used to analyze bone breaking
strength, whereas tibias from the second broiler were used to analyze gross morphology,
ash percentage and ash mineral content.
The tibias and femurs were cleaned of excess cartilage and flesh prior to analysis.
The bones were subjected to a three-point bending mechanical analysis (Instron Testing
Instrument, model 4301) to obtain peak breaking strength. The midshaft of bones were
positioned perpendicular to a steel wedge probe with the anterior side of the bone facing
probe. A load force of 100 kg was applied to the midshaft of the bone at 40mm/min until
peak breaking strength was determined.
Gross morphology measurements of tibias were determined using a VolScan
Profiler (Stable Micro Systems, Surrey, England). Cleaned and dried tibias were vertically
mounted onto the Volscan platform. The instrument was set to scan samples at a 0.5mm
vertical step at 1 rotation per second. Dry weights of the tibias were input into the Volscan
software manually to calculate sample density. Measurements obtained with the Volscan
Profiler included, volume, density, length, proximal epiphyseal width, distal epiphyseal
width, diaphysis width, diaphysis circumference, and surface area.
For ash determination, tibias were boiled for 15 minutes in deionized water to aid
in removal of flesh. Excess flesh and cartilage caps were removed from the bones. They
were then oven dried at 60°C for 72 hours. Afterwards, bones were soaked in 100%
petroleum ether until fat residues were removed. The bones were then oven dried overnight
at 105°C in porcelain crucibles to obtain the dry weight. After drying, bones were ashed
in a muffle furnace at 600°C for 6 hours (Ao et al., 2006). Ash percentage of each bone
was calculated and expressed as a percentage of dry weight.
Ashed tibias were then ground and homogenized for mineral analysis.
Approximately 0.2 grams of tibia ash was microwave digested in 8 ml concentrated nitric
acid (TraceMetal™ Grade, Fisher Scientific), 2 ml concentrated hydrochloric acid

140
(TraceMetal™ Grade, Fisher Scientific), and 10 ml of deionized water using CEM
Microwave Accelerated Reaction System 6 VessExpress program. Acid digested samples
were then diluted to with deionized water for trace mineral, Ca, and P analysis using
inductively coupled plasma-optical emission spectrum (Agilent Technologies Inc ICP-
OES, model 5110).
6.2.4 Statistical Analysis
Broiler chick hatch BW data was subjected to two-way analysis of variance using
the general linear model procedures of SAS® Software, version 9.4 (SAS, 2016). Broiler
breeder floor pen (n=5) served as the experimental unit for broiler chick hatch BW analysis.
The model included the fixed effects of block by hatching tray location, main effects broiler
breeder dietary FORPLUS™ level, main effects of broiler breeder dietary Zn source, and
interaction of those two factors. All other data for the study were subjected to two-way
analysis of variance using the general linear model procedures of SAS Software, version
9.4 (SAS, 2016) with a model including the fixed effect of block by experimental unit
(cage, n=8) location, main effect of broiler breeder diet, main effect of offspring dietary Zn
source, and the interaction effect of broiler breeder diet and offspring dietary Zn source.
For all post-hoc analyses, mean values were separated and compared using Fisher’s
protected least significant difference test. Mean values were declared significantly different
for P values ≤ 0.05.
6.3 Results and Discussions
6.3.1 Early Growth Performance
Main effects of broiler breeder dietary FORPLUS™ level and Zn source were
observed for newly hatched offspring BW (Table 6.3). Broiler chicks hatched from
breeders fed diets with 2% vs 0% FORPLUS™ had lower hatch BW, whereas broiler
chicks hatched from breeders provided diets with Bioplex® Zn vs ZnO had greater hatch
BW. By the time broiler chicks were 3 weeks old, breeder diet was found to affect early
growth performance (Table 6.4). Chicks from broiler breeders fed diets containing 2%

141
FORPLUS™ continued to depress offspring BW, BWG, and FI. Proportionate reductions
in BWG and FI resulted in no overall effect on FC. Offspring Zn source was found to
impact broiler BW at 3 weeks of age. Broilers fed diets with Bioplex® Zn were heavier
than broilers fed diets containing ZnO.
Broiler breeder dietary FORPLUS™ supplementation was found to have a greater
impact on offspring early growth performance than offspring dietary FORPLUS™
supplementation. In other studies broiler breeders fed diets supplemented with various
sources of n-3 PUFA produced smaller eggs (Pappas et al., 2005; Cherian, 2008; Koppenol
et al., 2014) and reduced chick weight at hatch (Koppenol et al., 2015c). The results
presented in this study are in agreement with results by Koppenol et al. (2015c). They
found that broiler chick BW and daily weight gain were reduced, and FC was poorer at 14
and 28 days of age due to breeder hen supplementation with n-3 PUFA. The results
presented in this study are in agreeance with previous research showing that broiler breeder
Zn source did not affect early offspring performance through 17 days of age, but offspring
organic Zn supplementation improved BWG and FC compared to inorganic Zn
supplementation (Hudson et al., 2005).
6.3.2 Leg Bone Quality
No effects of broiler breeder diet or offspring dietary Zn source was observed for
offspring bone breaking strength (Table 6.5), tibia ash percentage or tibia ash mineral
(Table 6.7) content at 3 weeks of age. VolScan Profiler results from Table 6.6 shows that
there was a main effect of offspring dietary Zn source on tibia morphology at 3 weeks of
age. Offspring with Bioplex® Zn supplementation had greater diaphysis width and
diaphysis circumference compared to offspring that had ZnO supplementation. Offspring
tibia volume, weight, and surface area also tended to increase with Bioplex® Zn vs ZnO
supplementation.
In Chapter 4, offspring from breeders fed Bioplex® Zn without FORPLUS™ had
increased tibia diaphysis width compared to offspring from breeders fed ZnO without
FORPLUS™ (Table 4.4). In previous research, a blend of organic and inorganic Cu, Mn
and Zn supplementation in broiler breeder diets improved offspring tibia and femur
diaphysis width at 14 days of embryonic development compared to inorganic trace mineral

142
supplementation alone (Favero et al., 2013). Kidd et al. (1992) found that tibia dry weight
was greater in offspring from breeders fed organic Zn vs inorganic Zn. Ash content
remained the same between the two groups. Dry weight accounts for the organic and
inorganic components of bone whereas ash accounts mainly for the inorganic portion of
bone. Their results indicate that dietary breeder Zn source may have affected the organic
portion of offspring bone which contains collagen, protein, enzymes, etc. Zn is known to
control the initiation of mineralization in bones, influence osteoblast activity, and increase
growth plate chondrocyte protein and enzyme activity (Litchfield et al., 1998; Kirsch et al.,
2000; Kwun et al., 2010; Seo et al., 2010).
6.4 Summary and Conclusions
Offspring from broiler breeders fed diets with FORPLUS™ had lower hatch BW
and reduced growth performance 3 weeks after hatch. Offspring dietary Bioplex® Zn
supplementation improved BW and influenced leg morphology 3 weeks after hatch. The
results from this study showed that there was no significant interaction between broiler
breeder dietary n-3 PUFA supplementation, Zn source, and offspring dietary Zn source on
offspring early growth performance or bone quality. However, during post-peak lay broiler
breeder diets supplemented with FORPLUS™ negatively impacted offspring hatch BW
and early growth performance. Offspring Bioplex® Zn on the other hand had positive
impacts on BW and skeletal leg morphology.

143
6.5 Tables
Table 6.1 Diet and nutrient composition of broiler breeder diets fed during post-peak lay
(28-45 wk of lay)
Diet Composition, % Diet 1 Diet 2 Diet 3 Diet 4
Corn 69.7 67.0 69.7 67.0
Soybean meal (48% CP) 19.4 18.9 19.4 18.9
Alfalfa meal (17% CP) 0.76 2.34 0.76 2.34
Oyster shell 3.00 3.00 3.00 3.00
FORPLUS™ - 2.00 - 2.00
Soybean oil 0.34 - 0.34 -
Limestone (38% Ca) 4.34 4.28 4.34 4.28
Dicalcium Phosphate 1.50 1.50 1.50 1.50
Salt, iodized 0.40 0.39 0.40 0.39
Vitamin premix1 0.25 0.25 0.25 0.25
ZnO mineral premix2 0.25 0.25 - -
Bioplex® Zn mineral premix3 - - 0.25 0.25
DL-Methionine 0.10 0.10 0.10 0.10
Total 100 100 100 100
Nutrient Composition
AMEn, kcal/kg 2850 2850 2850 2850
Protein, %4 15.7 15.0 14.4 14.2
Ca, %4 4.26 4.30 3.78 3.47
Avail. P, % 0.38 0.38 0.38 0.38
TSAA, %4 0.47 0.52 0.55 0.49
Lysine, %4 0.82 0.83 0.82 0.83
Na, % 0.18 0.18 0.18 0.18
Total Zn, mg/kg4 80.7 78.9 88.9 84.7
Crude Fat, %4 2.75 4.46 2.64 5.37
DHA, %4 0.00 0.30 0.02 0.42
Total n-3 PUFA, %4 0.07 0.38 0.07 0.53
Total n-6 PUFA, %4 1.44 1.67 1.41 1.93
n-6: n-3 PUFA 20.17 4.41 19.1 3.68 1Supplied per kg of diet: 9921 IU of vitamin A, 2756 ICU of vitamin D3, 33 IU vitamin E, 22.0 µg of
vitamin B12, 0.11 mg of biotin, 1.98 mg of vitamin K (as menadione), 1.98 mg of thiamine, 6.6 mg
of riboflavin, 11 mg of d-pantothenic acid, 3.97 mg of vitamin B6, 44 mg of niacin, 1.32 mg of folic
acid, 496 mg of choline
2Supplied per kg diet: 0.3mg Se as Ne2SO3, 5mg Cu as CuSO4.H2O, 20mg Fe as FeSO4.H2O, 75mg
Mn as MnSO4.H2O, 40mg Zn as ZnO, 1.5mg I as KIO3 3Supplied per kg diet: 0.3mg Se as Ne2SO3, 5mg Cu as CuSO4.H2O, 20mg Fe as FeSO4.H2O, 75mg
Mn as MnSO4.H2O, 40mg Zn as Bioplex® Zn, 1.5mg I as KIO3 4Analyzed value

144
Table 6.2 Diet and nutrient composition of offspring starter diets
Diet Composition, % Diet 1 Diet 2
Corn 56.9 56.9
Soybean meal (48% CP) 36.0 36.0
Vegetable oil 2.95 2.95
Limestone (38% Ca) 1.26 1.26
Dicalcium Phosphate 1.75 1.75
Salt, iodized 0.45 0.45
Vitamin premix1 0.25 0.25
ZnO mineral premix2 0.10 -
Bioplex® Zn mineral premix3 - 0.10
DL-Methionine 0.26 0.26
L-lysine 0.12 0.12
Total 100 100
Nutrient Composition
AMEn, kcal/kg 3080 3080
Protein, % 22.6 22.6
Ca, % 0.97 0.97
Avail. P, % 0.46 0.46
TSAA, % 0.98 0.98
Lysine, % 1.37 1.37
Na, % 0.29 0.29 1Supplied per kg of diet: 9921 IU of vitamin A, 2756 ICU of vitamin D3, 33 IU vitamin E, 22.0 µg
of vitamin B12, 0.11 mg of biotin, 1.98 mg of vitamin K (as menadione), 1.98 mg of thiamine, 6.6
mg of riboflavin, 11 mg of d-pantothenic acid, 3.97 mg of vitamin B6, 44 mg of niacin, 1.32 mg of
folic acid, 496 mg of choline
2Supplied per kg diet: 0.2mg Se as Ne2SO3, 10mg Cu as CuSO4.H2O, 45mg Fe as FeSO4.H2O,
100mg Mn as MnSO4.H2O, 40mg Zn as ZnO, 1.5mg I as KIO3 3Supplied per kg diet: 0.2mg Se as Ne2SO3, 10mg Cu as CuSO4.H2O, 45mg Fe as FeSO4.H2O,
100mg Mn as MnSO4.H2O, 40mg Zn as Bioplex® Zn, 1.5mg I as KIO3

145
Table 6.3 Effect of broiler breeder dietary FORPLUS™ level and Zn source at 30-31 weeks
of lay on offspring hatch weight
Hatch BW, g/b
Main Effect of FORPLUS™
0% FORPLUS™ 47.2a
2% FORPLUS™ 45.1b
SEM 0.26
P-value <0.01
Main Effect of Zn Source
ZnO 45.8b
Bioplex® Zn 46.5a
SEM 0.26
P-value 0.04
Interaction Effects
0% FORPLUS™ + ZnO 46.6
2% FORPLUS™ + ZnO 44.9
0% FORPLUS™ + Bioplex® Zn 47.8
2% FORPLUS™ + Bioplex® Zn 45.3
SEM 0.36
P-value 0.34 a,bFor each group of main effects and interaction effects,
means within the same column without common letters
are significantly different (P≤0.05)

146
Table 6.4 Effects of broiler breeder diet and offspring dietary Zn source on offspring growth performance through 3 weeks of age
BW, g/b BWG, g/b FI, g/b FC
Main Effect of Breeder Diet
1) 0% FORPLUS™ + 40 ppm ZnO 851a 750a 1081ab 1.44
3) 2% FORPLUS™ + 40 ppm ZnO 813bc 712b 1049b 1.48
3) 0% FORPLUS™ + 40 ppm Bioplex® Zn 846ab 747a 1124a 1.51
4) 2% FORPLUS™ + 40 ppm Bioplex® Zn 810c 705b 1071b 1.52
SEM 11.7 9.26 15.4 0.03
P-value 0.02 <0.01 0.01 0.13
Main Effect of Offspring Zn Source
ZnO 818b 724 1078 1.49
Bioplex® Zn 842a 733 1085 1.48
SEM 8.24 6.55 10.9 0.02
P-value 0.05 0.34 0.64 0.74
Interaction Effects of Breeder and Offspring Diet
Breeder diet 1 x Offspring ZnO 857 757 1101 1.46
Breeder diet 1 x Offspring Bioplex® Zn 846 743 1062 1.43
Breeder diet 2 x Offspring ZnO 796 705 1045 1.49
Breeder diet 2 x Offspring Bioplex® Zn 830 719 1053 1.47
Breeder diet 3 x Offspring ZnO 836 739 1131 1.53
Breeder diet 3 x Offspring Bioplex® Zn 856 755 1117 1.48
Breeder diet 4 x Offspring ZnO 784 695 1034 1.49
Breeder diet 4 x Offspring Bioplex® Zn 836 715 1108 1.56
SEM 16.5 13.1 21.8 0.04
P-value 0.29 0.57 0.07 0.41 a,bFor each group of main effects and interaction effects, means within the same column without common letters are
significantly different (P≤0.05)

147
Table 6.5 Effects of broiler breeder diet and offspring dietary Zn source on offspring bone
breaking strength at 3 weeks of age
Tibia breaking
strength,
kg force
Femur breaking
strength,
kg force
Main Effect of Breeder Diet
1) 0% FORPLUS™ + 40 ppm ZnO 22.1 17.7
3) 2% FORPLUS™ + 40 ppm ZnO 21.8 18.2
3) 0% FORPLUS™ + 40 ppm Bioplex® Zn 22.6 19.6
4) 2% FORPLUS™ + 40 ppm Bioplex® Zn 19.8 17.9
SEM 0.92 0.85
P-value 0.15 0.41
Main Effect of Offspring Zn Source
ZnO 21.1 18.0
Bioplex® Zn 22.1 18.8
SEM 0.65 0.60
P-value 0.29 0.33
Interaction Effects of Breeder and
Offspring Diet
Breeder diet 1 x Offspring ZnO 20.7 17.0
Breeder diet 1 x Offspring Bioplex® Zn 23.6 18.4
Breeder diet 2 x Offspring ZnO 20.4 17.7
Breeder diet 2 x Offspring Bioplex® Zn 23.2 18.8
Breeder diet 3 x Offspring ZnO 24.0 20.1
Breeder diet 3 x Offspring Bioplex® Zn 21.2 19.1
Breeder diet 4 x Offspring ZnO 19.2 17.0
Breeder diet 4 x Offspring Bioplex® Zn 20.3 18.9
SEM 1.30 1.20
P-value 0.11 0.68

148
Table 6.6 Effects of broiler breeder diet and offspring dietary Zn source on offspring tibia morphology at 3 weeks of age
Volume,
ml
Weight,
g
Density,
kg/m3
Length,
mm
Proximal
epiphyseal
width, mm
Distal
epiphyseal
width,
mm
Diaphysis
width,
mm
Diaphysis
circumference,
mm
Surface
area,
mm2
Main Effect of Breeder Diet
1) 0% FORPLUS™ + 40 ppm ZnO 3.23 1.73 535 62.2 17.2 12.7 6.11 20.8 1881
3) 2% FORPLUS™ + 40 ppm ZnO 3.20 1.69 527 62.1 17.1 12.6 5.92 20.4 1867
3) 0% FORPLUS™ + 40 ppm Bioplex® Zn 3.43 1.82 531 63.6 17.9 12.9 6.19 20.9 1959
4) 2% FORPLUS™ + 40 ppm Bioplex® Zn 3.27 1.70 518 63.3 17.4 12.8 6.08 20.4 1905
SEM 0.09 0.05 5.14 0.51 0.23 0.13 0.11 0.32 31.1
P-value 0.28 0.22 0.13 0.09 0.12 0.38 0.34 0.55 0.17
Main Effect of Offspring Zn Source
ZnO 3.20 1.69 527 62.4 17.3 12.6 5.96b 20.3b 1876
Bioplex® Zn 3.36 1.78 529 63.1 17.5 12.8 6.18a 20.9a 1930
SEM 0.06 0.04 3.64 0.36 0.16 0.09 0.08 0.22 22.0
P-value 0.08 0.09 0.79 0.18 0.53 0.13 0.04 0.05 0.09
Interaction Effects of Breeder and
Offspring Diet
Breeder diet 1 x Offspring ZnO 3.18 1.68 531 62.0 17.4 12.7 5.91 20.3 1864
Breeder diet 1 x Offspring Bioplex® Zn 3.28 1.77 539 62.3 17.1 12.7 6.30 21.2 1898
Breeder diet 2 x Offspring ZnO 3.06 1.61 526 61.9 17.0 12.5 5.74 19.8 1828
Breeder diet 2 x Offspring Bioplex® Zn 3.34 1.77 529 62.3 17.3 12.6 6.10 21.0 1905
Breeder diet 3 x Offspring ZnO 3.42 1.84 538 63.3 17.8 12.7 6.25 21.1 1955
Breeder diet 3 x Offspring Bioplex® Zn 3.45 1.81 525 63.9 18.0 13.0 6.14 20.7 1964
Breeder diet 4 x Offspring ZnO 3.16 1.63 514 62.5 17.2 12.7 5.95 19.9 1859
Breeder diet 4 x Offspring Bioplex® Zn 3.38 1.77 522 64.0 17.6 13.0 6.20 20.9 1952
SEM 0.13 0.07 7.27 0.72 0.32 0.18 0.15 0.45 44.0
P-value 0.76 0.58 0.44 0.83 0.77 0.79 0.33 0.28 0.76 a,bFor each group of main effects and interaction effects, means within the same column without common letters are significantly different (P≤0.05)

149
Table 6.7 Effects of broiler breeder diet and offspring dietary Zn source on offspring tibia ash percentage and mineral content at 3 weeks
of age
Ash, % Cu, ppm Fe, ppm Mn, ppm Zn, ppm Ca, % P, %
Main Effect of Breeder Diet
1) 0% FORPLUS™ + 40 ppm ZnO 51.6 7.03 316 8.40 382 38.8 20.0
3) 2% FORPLUS™ + 40 ppm ZnO 51.8 7.52 354 8.51 394 38.7 19.9
3) 0% FORPLUS™ + 40 ppm Bioplex® Zn 51.8 7.60 299 8.73 396 38.9 20.0
4) 2% FORPLUS™ + 40 ppm Bioplex® Zn 50.5 7.40 330 8.28 396 38.7 20.0
SEM 0.46 0.33 15.5 0.36 6.80 0.10 0.05
P-value 0.16 0.63 0.09 0.83 0.41 0.43 0.83
Main Effect of Offspring Zn Source
ZnO 51.5 7.53 331 8.46 394 38.7 20.0
Bioplex® Zn 51.4 7.24 318 8.49 390 38.8 20.0
SEM 0.33 0.23 10.9 0.25 4.81 0.07 0.03
P-value 0.85 0.38 0.41 0.93 0.59 0.81 0.85
Interaction Effects of Breeder and
Offspring Diet
Breeder diet 1 x Offspring ZnO 51.3 7.28 319 8.77 400 38.7 20.0
Breeder diet 1 x Offspring Bioplex® Zn 51.9 6.79 313 8.04 364 38.9 20.0
Breeder diet 2 x Offspring ZnO 51.5 8.11 383 9.01 388 38.7 19.9
Breeder diet 2 x Offspring Bioplex® Zn 52.1 6.94 325 8.00 401 38.6 19.9
Breeder diet 3 x Offspring ZnO 52.6 7.18 285 7.97 394 38.8 19.9
Breeder diet 3 x Offspring Bioplex® Zn 51.0 8.03 312 9.48 399 38.9 20.0
Breeder diet 4 x Offspring ZnO 50.5 7.58 337 8.10 395 38.7 20.0
Breeder diet 4 x Offspring Bioplex® Zn 50.5 7.21 322 8.45 398 38.6 19.9
SEM 0.65 0.47 21.9 0.50 9.61 0.14 0.07
P-value 0.32 0.19 0.29 0.06 0.06 0.76 0.43

150
CHAPTER 7. Effects of Broiler Breeder Dietary Microalgae Level, Zn Source, and
Offspring Microalgae Supplementation on Offspring Early Growth Performance and
Skeletal Leg Quality
ABSTRACT
Dietary omega-3 (n-3) polyunsaturated fatty acids (PUFA) are known to improve bone
quality in poultry species. FORPLUS™ (Alltech, Inc.) is an unextracted, whole-cell
microalgae (Aurantiochytrium limacinum CCAP 4087/2) source of n-3 PUFA, especially
DHA. Zinc (Zn) is a trace element and essential nutrient for growth and skeletal
development. Bioplex® Zn (Alltech, Inc.) is a Zn proteinate that has been shown to be
more bioavailable to chickens compared to inorganic sources of Zn. The purpose of this
study was to investigate the effects of broiler breeder diet and offspring dietary microalgae
level (0% vs. 1% FORPLUS™) on offspring early growth performance and skeletal leg
quality. A randomized complete block design with a 4x2 factorial treatment structure was
used for this trial. A total of 240 Cobb 500™ broiler breeder hens and 20 Cobb 500™
broiler breeder roosters were randomly assigned to four dietary treatments. The four
breeder dietary treatments were 1) corn-soybean meal based diet + 40 mg ZnO/kg diet, 2)
diet 1 + 2% FORPLUS™, 3) corn-soybean meal based diet + 40 mg Bioplex® Zn/kg diet,
4) Diet 3 + 2% FORPLUS™. When breeders were 35-37 wk of lay, fertile eggs were
collected and incubated until hatch. With respect to broiler breeder diet, 128 straight-run
broiler chicks hatched from each breeder dietary treatment group were assigned to broiler
starter diets with 0% or 1% FORPLUS™. This resulted in 8 replicate cages (8 chicks/cage)
per dietary treatment. Broiler chick early growth performance, tibia and femur breaking
strength, tibia gross morphology, tibia ash %, and tibia ash mineral content were measured
after 3 wk. Broiler chicks from breeders fed diets with 2% vs 0% FORPLUS™ had lower
(P≤0.05) initial BW and continued to have lower (P≤0.05) BW and BWG 3 wk after hatch.
Broiler chicks had poorer (P≤0.05) FC when fed diets with 1% vs 0% FORPLUS™. No
effects of breeder or offspring diet were observed for bone breaking strength, tibia ash
percentage, or tibia ash mineral content. An interaction effect of breeder diet and offspring
diet was observed for tibia diaphysis width when broiler chicks were 3 wk old. The best

151
dietary combination for optimal offspring tibia diaphysis width was 1% FORPLUS™ in
offspring diets and no Bioplex® Zn in breeder the diet. In conclusion, 2% FORPLUS™ in
the breeder diet was detrimental to offspring early growth performance. Offspring dietary
supplementation of 1% FORPLUS™ negatively affected FC and influenced tibia diaphysis
morphology when parent breeder diet was taken into account.

152
7.1 Introduction
Leg weakness and lameness as a result of skeletal leg disorders and deformities are
issues that cause concern for animal welfare and negatively affect the poultry industry.
Skeletal leg disorders and deformities pose a welfare concern because they may cause pain
and impair a bird’s ability to walk, thereby disrupting normal eating and drinking habits
and behaviors (Kestin et al., 1992; Bradshaw et al., 2002; Dinev, 2009; Nääs et al., 2009).
Consequences of moderate to severe lameness in broilers are lower growth rates, culling,
processing downgrades, and ultimately profit losses (Bradshaw et al., 2002; Knowles et
al., 2008; Dinev, 2009; Gocsik et al., 2017; Wijesurendra et al., 2017). It is estimated that
lameness affects an average of 21.4% of European broiler flocks and approximately 3.0%
of broilers may need to be culled due to severe lameness (Bassler et al., 2013; Marchewka
et al., 2013; Kittelsen et al., 2015; Tullo et al., 2017; Granquist et al., 2019). In the United
States there is a lack of recent, comprehensive studies on the incidence of lameness in
broilers, although it has been claimed that up to 6% of broilers have obvious skeletal
abnormalities or leg problems and 2% of broiler flocks suffer losses due to lameness
(Dunkley, 2007; Mitchell, 2014).
With regard to broiler breeding, genetic selection against skeletal leg problems in
broilers is a slow process and some researchers have indicated that changes to nutrition and
living environment may be more effective (Angel, 2007; Knowles et al., 2008; Rekaya et
al., 2013; Mitchell, 2014; González-Cerón et al., 2015). Management strategies to improve
broiler leg health have its limitations. Enrichment of broiler houses to induce exercise have
not been successful in limiting skeletal leg problems (Sherlock et al., 2010; Bailie et al.,
2018; Meyer et al., 2019). Litter choice is important for leg health, but if litter quality
deteriorates remedies to lessen its impact on leg health are very limited (Su et al., 2000).
Stocking density may improve leg health as it has consequences on litter quality, but
lowering stocking density to the extent of reducing leg problems would be very cost
prohibitive for many producers (Knowles et al., 2008). Longer periods of darkness (Cobb-
Vantress, 2012; Bassler et al., 2013; Aviagen, 2018) and control of toxin exposure can also
reduce or prevent skeletal disorders but have finite application in skeletal development and
health.

153
Dietary omega-3 (n-3) polyunsaturated fatty acids (PUFA) can be transferred from
broiler breeder diets to offspring tissues (Lin et al., 1991; Pappas et al., 2006; Hall et al.,
2007; Bautista-Ortega et al., 2009; Cherian et al., 2009; Koppenol et al., 2015a) and are
known to improve bone quality in poultry species (Watkins et al., 1996a; Watkins et al.,
1997b; Liu et al., 2003; Fleming, 2008). However, there is a lack of research on the effect
of broiler breeder dietary n-3 PUFA supplementation on offspring skeletal development
and limited information is available on n-3 PUFA in broiler diets on offspring performance
(Koppenol et al., 2015c) or interaction of n-3 PUFA supplementation in breeder and
offspring diets on performance (Koppenol et al., 2015b). Even less is known about the
interaction of n-3 PUFA in breeder and offspring diets on skeletal development.
FORPLUS™ (Alltech, Inc.) is an unextracted, whole-cell microalgae (Aurantiochytrium
limacinum CCAP 4087/2) source of n-3 PUFA. It contains 64% fat with 16% of that fat
as docosahexaenoic acid (DHA). Microalgae rich in n-3 PUFA may be considered as a
sustainable, alternative to fish oil which is a common source of n-3 PUFA in poultry diets.
It is well known that zinc (Zn), an essential trace element and nutrient, is an integral
component of numerous enzymes and proteins. These Zn-dependent molecules have
important roles in numerous biochemical and metabolic functions such as cell growth and
proliferation, cell differentiation, gene expression, and immunity (Vallee and Falchuk,
1993; Plum et al., 2010; Haase and Rink, 2014a, b). Zn is also essential for skeletal
development, specifically due to its role in stimulating the synthesis of collagen and
chondroitin for bone matrix and structure formation (Brandao-Neto et al., 1995) as well as
its role in osteoblast proliferation and activity (Seo et al., 2010). Supplementation of
organic Zn vs inorganic Zn in breeder diets resulted in reduced incidence of skeletal leg
abnormalities of offspring (Hudson et al., 2005), revealing the importance of Zn source in
offspring skeletal leg health. Blending organic trace minerals such as Cu, Mn, and Zn with
their inorganic counterparts in broiler breeder diets improved offspring bone calcification
rate, morphology, and biomechanical properties during the late embryonic development
(Favero et al., 2013). Based on review of literature, only one other study has reported on
the effects of broiler breeder Zn source on offspring growth performance, but that study
did not evaluate offspring bone quality (Hudson et al., 2005). Bioplex® Zn (Alltech, Inc.)
is a Zn-proteinate product that is more bioavailable to broilers than some other sources of

154
inorganic Zn (Ao et al., 2006; Ao et al., 2011). The objective of this study was to evaluate
dietary supplementation of FORPLUS™ and Zn source in broiler breeder diets and
offspring dietary supplementation of FORPLUS™ on offspring early growth performance
and bone quality after hatch.
7.2 Materials and Methods
This study was conducted in compliance with the University of Kentucky
Institutional Animal Care and Use Committee protocols.
7.2.1 Experimental Design
A complete randomized block design with a 4x2 factorial treatment arrangement
consisting of four broiler breeder dietary treatments and two offspring dietary FORPLUS™
levels was used for this study. The four broiler breeder dietary treatments were 1) corn-
soybean meal based diet + 40 mg ZnO/kg diet, 2) diet 1 + 2% FORPLUS™, 3) corn-
soybean meal based diet + 40 mg Bioplex® Zn/kg diet, 4) Diet 3 + 2% FORPLUS™. Diets
were formulated to meet or exceed the energy and nutrient requirements (NRC, 1994)
before lay and throughout lay. The two offspring dietary FORPLUS™ levels were 0% or
1% FORPLUS™. The broiler starter diets were also designed to meet all other minimum
energy and nutrient requirements (NRC, 1994). FORPLUS™ (Alltech, Inc.) is an
unextracted, whole-cell microalgae (Aurantiochytrium limacinum CCAP 4087/2) that
contains a minimum of 64% fat with 16% of the fat as DHA. Bioplex® Zn (Alltech, Inc.)
is a Zn-proteinate product. A total of 240 Cobb 500™ broiler breeder hens and 20 Cobb
500™ broiler breeder roosters were randomly assigned to the four dietary treatments.
Broiler breeders were provided ad libitum access to water and supplied feed on a daily
feeding regimen in a feeding trough as per the Cobb® Breeder Management Guide (Cobb-
Vantress, 2012).
The broiler breeders were housed in floor pen units that measured approximately
1.22 x 1.83 sq. meters. The litter for each pen was 100% large flake, pine wood shavings
supplied at approximately 3.66 cu. meters per pen and refreshed as needed. Broiler

155
breeders were raised in an ambient temperature range of 18.3 to 29.4 °C. Prior to the onset
of lay, a two-tier nest box that could accommodate up to four birds at a time was added to
each pen. Photostimulation was provided as 15 hours of light and 9 hours of darkness
throughout the entire laying period.
Fertile eggs were collected from each breeder pen at 35-37 weeks of lay (post-peak
lay), The eggs were set in a Nature Form Incubator (model 4680). Eggs were separated
and incubated by pen using incubator trays. The incubator temperature and relative
humidity conditions were set to 37.5°C and 60%, respectively. On embryonic day 18, eggs
were transferred to a Nature Form Hatcher (model 45) where the temperature was
maintained at 36.9°C and relative humidity was set to 64%. Eggs were grouped and labeled
by pen using wooden dividers in hatcher trays. Newly hatched, straight-run broiler chicks
were removed from the hatcher after 21 days of incubation.
With respect to broiler breeder diet, a total of 128 straight-run, one-day old broiler
chicks from each breeder dietary group were randomly distributed to the two offspring
diets with or without FORPLUS™. This resulted in 8 replicate cages of 8 chicks per
dietary treatment. Cage dimensions were approximately 52 cm length x 61 cm width x 36
cm height. Broiler chicks were provided ad libitum access to water via nipple drinkers and
feed via hanging feeding troughs. Temperature was set at 29.4°C for the first seven days
and then maintained at an ambient temperature between 18.3-29.4°C for the remainder of
the study. Exhaust fans provided ventilation and were used to control moisture and
humidity. Daily photostimulation was provided at 22 hours of light and 2 hours of
darkness.
7.2.2 Early growth performance
Early growth performance of broiler chicks was measured from placement to 3
weeks of age. Cage body weight (BW) was recorded at placement and measured weekly
thereafter to calculate average body weight gain (BWG). Average feed intake (FI) of each
cage was measured weekly and used to calculate feed conversion (FC) represented by the
ratio of FI to BWG. All measurements of BWG, FI, and FC were corrected for chick
mortality.
156
7.2.3 Leg Bone Quality Measurements
At 3 weeks of age, two broiler chicks per cage were randomly selected and
euthanized by argon gas asphyxiation and cervical dislocation. Tibias and femurs were
collected from broilers for measurements of peak bone breaking strength. Only tibias were
used for gross morphology, bone ash percentage determination, and mineral content
determination. Tibias and femurs from the first broiler were used to analyze bone breaking
strength, whereas tibias from the second broiler were used to analyze gross morphology,
ash percentage and ash mineral content.
The tibias and femurs were cleaned of excess cartilage and flesh prior to analysis.
The bones were subjected to a three-point bending mechanical analysis (Instron Testing
Instrument, model 4301) to obtain peak breaking strength. The midshaft of bones were
positioned perpendicular to a steel wedge probe with the anterior side of the bone facing
probe. A load force of 100 kg was applied to the midshaft of the bone at 40mm/min until
peak breaking strength was determined.
Gross morphology measurements of tibias were determined using a VolScan
Profiler (Stable Micro Systems, Surrey, England). Cleaned and dried tibias were vertically
mounted onto the Volscan platform. The instrument was set to scan samples at a 0.5mm
vertical step at 1 rotation per second. Dry weights of the tibias were input into the Volscan
software manually to calculate sample density. Measurements obtained with the Volscan
Profiler included, volume, density, length, proximal epiphyseal width, distal epiphyseal
width, diaphysis width, diaphysis circumference, and surface area.
For ash determination, tibias were boiled for 15 minutes in deionized water to aid
in removal of flesh. Excess flesh and cartilage caps were removed from the bones. They
were then oven dried at 60°C for 72 hours. Afterwards, bones were soaked in 100%
petroleum ether until fat residues were removed. The bones were then oven dried overnight
at 105°C in porcelain crucibles to obtain the dry weight. After drying, bones were ashed
in a muffle furnace at 600°C for 6 hours (Ao et al., 2006). Ash percentage of each bone
was calculated and expressed as a percentage of dry weight.
Ashed tibias were then ground and homogenized for mineral analysis.
Approximately 0.2 grams of tibia ash was microwave digested in 8 ml concentrated nitric
acid (TraceMetal™ Grade, Fisher Scientific), 2 ml concentrated hydrochloric acid

157
(TraceMetal™ Grade, Fisher Scientific), and 10 ml of deionized water using CEM
Microwave Accelerated Reaction System 6 VessExpress program. Acid digested samples
were then diluted to with deionized water for trace mineral, Ca, and P analysis using
inductively coupled plasma-optical emission spectrum (Agilent Technologies Inc ICP-
OES, model 5110).
7.2.4 Statistical Analysis
Broiler chick hatch BW data was subjected to two-way analysis of variance using
the general linear model procedures of SAS® Software, version 9.4 (SAS, 2016). Broiler
breeder floor pen (n=5) served as the experimental unit for broiler chick hatch BW analysis.
The model included the fixed effects of block by hatching tray location, main effects broiler
breeder dietary FORPLUS™ level, main effects of broiler breeder dietary Zn source, and
interaction of those two factors. All other data for the study were subjected to two-way
analysis of variance using the general linear model procedures of SAS Software, version
9.4 (SAS, 2016) with a model including the fixed effect of block by experimental unit
(cage, n=8) location, main effect of broiler breeder diet, main effect of offspring dietary Zn
source, and the interaction effect of broiler breeder diet and offspring dietary Zn source.
For all post-hoc analyses, mean values were separated and compared using Fisher’s
protected least significant difference test. Mean values were declared significantly different
for P values ≤ 0.05.
7.3 Results and Discussions
7.3.1 Early Growth Performance
A main effect of broiler breeder dietary FORPLUS™ level was observed on BW
of newly hatched chicks (Table 7.3). Offspring hatched form breeders fed 2%
FORPLUS™ had decreased hatch BW compared to offspring hatched from breeders
provide diets without FORPLUS™. Main effects of broiler breeder diet were observed on
early growth performance of their offspring through 3 weeks of age (Table 7.4). Broiler
offspring from breeders fed diets with 2% FORPLUS™ + Bioplex® Zn had the lowest BW

158
and BWG compared to all other offspring. A main effect of offspring dietary FORPLUS™
level was observed on FC. Table 7.4 also shows offspring fed diets supplemented with 1%
FORPLUS™ had poorer feed conversion compared to offspring fed diets without
FORPLUS™ supplementation.
In other studies broiler breeders fed diets supplemented with various sources of n-
3 PUFA produced smaller eggs (Pappas et al., 2005; Cherian, 2008; Koppenol et al., 2014)
and reduced chick weight at hatch (Koppenol et al., 2015c). The effects of FORPLUS™
on offspring early growth performance presented in this study are in agreement with two
studies conducted by Koppenol et al. (2015b; 2015c). They did not find any interaction
effect of breeder and offspring dietary n-3 PUFA supplementation on offspring growth
performance. However, they found that broiler chick BW and daily weight gain were
reduced throughout the starter and grower periods due to breeder hen supplementation with
n-3 PUFA. In contrast to the effect of n-3 PUFA in the breeder diet and results from the
present study, chick BW, daily weight gain, and FI were improved in the starter and grower
phases when chick diets were supplemented with n-3 PUFA. The information from the
present study and previous research indicate n-3 PUFA source and level in broiler chick
diets can lead to different growth performance outcomes. In regard to Zn source in broiler
breeder and offspring diets, the results presented in this study are in agreeance with
previous research showing that broiler breeder Zn source did not affect early offspring
performance through 17 days of age (Hudson et al., 2005).
7.3.2 Leg Bone Quality
There was no effect of breeder diet or offspring dietary FORPLUS™ level on
offspring bone breaking strength (Table 7.5), tibia ash percentage, or tibia ash mineral
content (Table 7.7). However, an interaction effect of breeder diet and offspring diet was
observed for tibia diaphysis width when broiler chicks were 3 weeks old (Table 7.6).
Offspring fed 1% FORPLUS™ and hatched from breeders given diets containing 0%
FORPLUS™ + ZnO had greater tibia diaphysis width compared to offspring fed 0%
FORPLUS™ and produced by the same broiler breeder group or broiler breeders fed diets
with 2% FORPLUS™ + Bioplex® Zn. Offspring fed 1% FORPLUS™ and hatched form
breeders fed 0% FORPLUS™ + Bioplex® Zn had the least diaphysis width. These results

159
indicate 1% FORPLUS™ in offspring diets can have variable influence on tibia diaphysis
width depending on breeder dietary n-3 PUFA and Zn source.
7.4 Summary and Conclusions
Offspring from broiler breeders fed diets with FORPLUS™ had lower hatch BW
and reduced growth performance 3 weeks after hatch. Offspring dietary FORPLUS™
supplementation resulted in poorer feed conversion. No significant effect of broiler breeder
dietary n-3 PUFA supplementation, Zn source, and offspring dietary FORPLUS™
supplementation on offspring early growth performance was found in this study.
Interaction effects of broiler breeder diet and offspring dietary FORPLUS™ level were
observed on tibia diaphysis width but were widely variable. In conclusion, during post-
peak lay broiler breeder diets supplemented with FORPLUS™ negatively impacted
offspring growth performance 3 weeks after hatch and had little effect on leg bone quality.
Leg bone quality in offspring from older hens did not benefit from added FORPLUS™ to
their diets.

160
7.5 Tables
Table 7.1 Diet and nutrient composition of broiler breeder diets fed during post-peak lay
(28-45 wk of lay)
Diet Composition, % Diet 1 Diet 2 Diet 3 Diet 4
Corn 69.7 67.0 69.7 67.0
Soybean meal (48% CP) 19.4 18.9 19.4 18.9
Alfalfa meal (17% CP) 0.76 2.34 0.76 2.34
Oyster shell 3.00 3.00 3.00 3.00
FORPLUS™ - 2.00 - 2.00
Soybean oil 0.34 - 0.34 -
Limestone (38% Ca) 4.34 4.28 4.34 4.28
Dicalcium Phosphate 1.50 1.50 1.50 1.50
Salt, iodized 0.40 0.39 0.40 0.39
Vitamin premix1 0.25 0.25 0.25 0.25
ZnO mineral premix2 0.25 0.25 - -
Bioplex® Zn mineral premix3 - - 0.25 0.25
DL-Methionine 0.10 0.10 0.10 0.10
Total 100 100 100 100
Nutrient Composition
AMEn, kcal/kg 2850 2850 2850 2850
Protein, %4 15.7 15.0 14.4 14.2
Ca, %4 4.26 4.30 3.78 3.47
Avail. P, % 0.38 0.38 0.38 0.38
TSAA, %4 0.47 0.52 0.55 0.49
Lysine, %4 0.82 0.83 0.82 0.83
Na, % 0.18 0.18 0.18 0.18
Total Zn, mg/kg4 80.7 78.9 88.9 84.7
Crude Fat, %4 2.75 4.46 2.64 5.37
DHA, %4 0.00 0.30 0.02 0.42
Total n-3 PUFA, %4 0.07 0.38 0.07 0.53
Total n-6 PUFA, %4 1.44 1.67 1.41 1.93
n-6: n-3 PUFA 20.17 4.41 19.1 3.68 1Supplied per kg of diet: 9921 IU of vitamin A, 2756 ICU of vitamin D3, 33 IU vitamin E, 22.0 µg of
vitamin B12, 0.11 mg of biotin, 1.98 mg of vitamin K (as menadione), 1.98 mg of thiamine, 6.6 mg
of riboflavin, 11 mg of d-pantothenic acid, 3.97 mg of vitamin B6, 44 mg of niacin, 1.32 mg of folic
acid, 496 mg of choline
2Supplied per kg diet: 0.3mg Se as Ne2SO3, 5mg Cu as CuSO4.H2O, 20mg Fe as FeSO4.H2O, 75mg
Mn as MnSO4.H2O, 40mg Zn as ZnO, 1.5mg I as KIO3 3Supplied per kg diet: 0.3mg Se as Ne2SO3, 5mg Cu as CuSO4.H2O, 20mg Fe as FeSO4.H2O, 75mg
Mn as MnSO4.H2O, 40mg Zn as Bioplex® Zn, 1.5mg I as KIO3 4Analyzed value

161
Table 7.2 Diet and nutrient composition of broiler breeder offspring diets
Diet Composition, % Diet 1 Diet 2
Corn 56.9 56.3
Soybean meal (48% CP) 36.0 35.9
Vegetable oil 2.90 2.55
FORPLUS™ - 1.00
Limestone (38% Ca) 1.42 1.42
Dicalcium Phosphate 1.75 1.75
Salt, iodized 0.45 0.45
Vitamin-mineral premix1 0.25 0.25
DL-Methionine 0.26 0.24
L-lysine 0.12 0.11
Total 100 100
Nutrient Composition
AMEn, kcal/kg 3080 3080
Protein, % 22.6 22.6
Ca, % 1.03 1.03
Avail. P, % 0.46 0.46
TSAA, % 0.98 0.98
Lysine, % 1.37 1.37
Na, % 0.29 0.29 1 Supplied per kg diet: 11025 IU of vitamin A, 3258 IU vitamin D, 33 IU vitamin E, 0.91 mg of
vitamin K, 2.21 mg thiamine, 7.72 mg riboflavin, 55 mg niacin, 18 mg pantothenate, 5 mg vitamin
B6, 0.22 mg biotin, 1.10 mg folic acid, 478 mg choline, 30 µg vitamin B12, 75 mg Zn as ZnO, 40
mg Fe as FeSO4.H2O, 64 mg Mn as MnO2, 10 g Cu as CuSO4.H2O, 1.85 mg I as EDDI, 0.25 mg
Se as Ne2SO3

162
Table 7.3 Effect of broiler breeder dietary FORPLUS™ level and Zn source at 41-43 weeks
of lay on offspring hatch weight
Hatch BW, g/b
Main Effect of FORPLUS™
0% FORPLUS™ 47.5a
2% FORPLUS™ 45.3b
SEM 0.24
P-value <0.01
Main Effect of Zn Source
ZnO 46.1
Bioplex® Zn 46.7
SEM 0.24
P-value 0.09
Interaction Effects
0% FORPLUS™ + ZnO 47.2
2% FORPLUS™ + ZnO 45.1
0% FORPLUS™ + Bioplex® Zn 47.9
2% FORPLUS™ + Bioplex® Zn 45.5
SEM 0.34
P-value 0.74 a,bFor each group of main effects and interaction effects,
means within the same column without common letters
are significantly different (P≤0.05)

163
Table 7.4 Effects of broiler breeder diet and offspring dietary FORPLUS™ level on offspring growth performance through 3 weeks of
age
BW, g/b BWG, g/b FI, g/b FC
Main Effect of Breeder Diet
1) 0% FORPLUS™ + 40 ppm ZnO 815a 712a 1084 1.53
3) 2% FORPLUS™ + 40 ppm ZnO 789a 700a 1083 1.55
3) 0% FORPLUS™ + 40 ppm Bioplex® Zn 790a 696a 1068 1.54
4) 2% FORPLUS™ + 40 ppm Bioplex® Zn 755b 668b 1066 1.60
SEM 10.5 9.71 12.5 0.02
P-value <0.01 0.02 0.62 0.13
Main Effect of Offspring FORPLUS™ level
0% FORPLUS™ 795 702 1066 1.52b
1% FORPLUS™ 779 686 1084 1.59a
SEM 7.40 6.87 8.81 0.02
P-value 0.13 0.12 0.16 0.01
Interaction Effects of Breeder and Offspring Diet
Breeder diet 1 x Offspring 0% FORPLUS™ 829 726 1075 1.48
Breeder diet 1 x Offspring 1% FORPLUS™ 801 697 1092 1.57
Breeder diet 2 x Offspring 0% FORPLUS™ 802 711 1081 1.52
Breeder diet 2 x Offspring 1% FORPLUS™ 776 689 1086 1.58
Breeder diet 3 x Offspring 0% FORPLUS™ 792 699 1055 1.52
Breeder diet 3 x Offspring 1% FORPLUS™ 788 694 1082 1.56
Breeder diet 4 x Offspring 0% FORPLUS™ 758 670 1054 1.58
Breeder diet 4 x Offspring 1% FORPLUS™ 751 665 1077 1.63
SEM 14.8 13.7 17.6 0.03
P-value 0.78 0.75 0.93 0.91 a,bFor each group of main effects and interaction effects, means within the same column without common letters are significantly
different (P≤0.05)

164
Table 7.5 Effects of broiler breeder diet and offspring dietary FORPLUS™ level on
offspring bone breaking strength at 3 weeks of age
Tibia breaking
strength,
kg force
Femur breaking
strength,
kg force
Main Effect of Breeder Diet
1) 0% FORPLUS™ + 40 ppm ZnO 24.0 20.5
3) 2% FORPLUS™ + 40 ppm ZnO 24.0 21.1
3) 0% FORPLUS™ + 40 ppm Bioplex® Zn 22.7 20.6
4) 2% FORPLUS™ + 40 ppm Bioplex® Zn 21.4 19.5
SEM 0.94 0.79
P-value 0.16 0.51
Main Effect of Offspring FORPLUS™
level
0% FORPLUS™ 23.4 20.2
1% FORPLUS™ 22.7 20.6
SEM 0.67 0.56
P-value 0.47 0.68
Interaction Effects of Breeder and
Offspring Diet
Breeder diet 1 x Offspring 0% FORPLUS™ 24.9 21.3
Breeder diet 1 x Offspring 1% FORPLUS™ 23.0 19.6
Breeder diet 2 x Offspring 0% FORPLUS™ 25.2 21.1
Breeder diet 2 x Offspring 1% FORPLUS™ 22.9 21.2
Breeder diet 3 x Offspring 0% FORPLUS™ 23.6 19.8
Breeder diet 3 x Offspring 1% FORPLUS™ 21.9 21.3
Breeder diet 4 x Offspring 0% FORPLUS™ 19.8 18.7
Breeder diet 4 x Offspring 1% FORPLUS™ 22.9 20.2
SEM 1.33 1.11
P-value 0.15 0.43

165
Table 7.6 Effects of broiler breeder diet and offspring dietary FORPLUS™ level on offspring tibia morphology at 3 weeks of age
Volume,
ml
Weight,
g
Density,
kg/m3
Length,
mm
Proximal
epiphyseal
width, mm
Distal
epiphyseal
width,
mm
Diaphysis
width,
mm
Diaphysis
circumference,
mm
Surface
area,
mm2
Main Effect of Breeder Diet
1) 0% FORPLUS™ + 40 ppm ZnO 3.39 1.70 504 63.4 18.0 12.7 5.95 20.3 1944
3) 2% FORPLUS™ + 40 ppm ZnO 3.36 1.76 522 63.3 17.9 12.8 5.98 20.2 1936
3) 0% FORPLUS™ + 40 ppm Bioplex® Zn 3.18 1.65 518 64.0 17.5 12.5 5.83 19.5 1891
4) 2% FORPLUS™ + 40 ppm Bioplex® Zn 3.15 1.62 518 62.9 17.4 12.5 5.79 19.5 1879
SEM 0.12 0.06 8.96 0.73 0.20 0.17 0.11 0.34 40.8
P-value 0.31 0.36 0.39 0.75 0.08 0.39 0.44 0.15 0.54
Main Effect of Offspring FORPLUS™
level
0% FORPLUS™ 3.24 1.67 519 63.1 17.8 12.6 5.85 19.7 1905
1% FORPLUS™ 3.30 1.69 512 63.6 17.6 12.6 5.93 20.0 1920
SEM 0.09 0.05 6.84 0.56 0.15 0.13 0.08 0.26 31.1
P-value 0.55 0.81 0.44 0.48 0.41 0.69 0.43 0.29 0.70
Interaction Effects of Breeder and
Offspring Diet
Breeder diet 1 x Offspring 0% FORPLUS™ 3.25 1.67 513 63.1 18.0 12.8 5.71bc 19.8 1908
Breeder diet 1 x Offspring 1% FORPLUS™ 3.52 1.73 494 63.7 18.0 12.6 6.19a 20.9 1979
Breeder diet 2 x Offspring 0% FORPLUS™ 3.45 1.80 523 63.3 18.2 12.9 6.11ab 20.6 1966
Breeder diet 2 x Offspring 1% FORPLUS™ 3.26 1.71 522 63.2 17.6 12.7 5.86abc 19.7 1907
Breeder diet 3 x Offspring 0% FORPLUS™ 3.28 1.71 520 64.7 17.7 12.5 5.93abc 19.6 1923
Breeder diet 3 x Offspring 1% FORPLUS™ 3.08 1.59 515 63.2 17.3 12.5 5.73bc 19.5 1859
Breeder diet 4 x Offspring 0% FORPLUS™ 2.96 1.52 518 61.5 17.2 12.4 5.64c 18.8 1825
Breeder diet 4 x Offspring 1% FORPLUS™ 3.34 1.73 518 64.3 17.5 12.5 5.93abc 20.1 1934
SEM 0.16 0.08 12.1 0.99 0.27 0.24 0.15 0.46 55.2
P-value 0.14 0.16 0.81 0.17 0.36 0.84 0.03 0.07 0.26 a,b,cFor each group of main effects and interaction effects, means within the same column without common letters are significantly different (P≤0.05)

166
Table 7.7 Effects of broiler breeder diet and offspring dietary FORPLUS™ level on offspring tibia ash percentage and mineral content
at 3 weeks of age
Ash, % Cu, ppm Fe, ppm Mn, ppm Zn, ppm Ca, % P, %
Main Effect of Breeder Diet
1) 0% FORPLUS™ + 40 ppm ZnO 54.2 8.44 277 8.53 353 38.7 17.4
3) 2% FORPLUS™ + 40 ppm ZnO 54.8 7.72 282 8.08 366 38.6 17.4
3) 0% FORPLUS™ + 40 ppm Bioplex® Zn 55.4 7.83 251 8.63 354 38.6 17.4
4) 2% FORPLUS™ + 40 ppm Bioplex® Zn 55.0 7.56 261 8.12 367 38.6 17.4
SEM 0.41 0.29 12.3 0.30 8.45 0.13 0.06
P-value 0.20 0.11 0.23 0.38 0.43 0.97 0.67
Main Effect of Offspring FORPLUS™ level
0% FORPLUS™ 55.1 7.71 261 8.44 362 38.6 17.4
1% FORPLUS™ 54.5 8.07 274 8.24 358 38.6 17.4
SEM 0.31 0.22 9.39 0.22 6.44 0.10 0.04
P-value 0.11 0.19 0.25 0.47 0.64 0.67 0.24
Interaction Effects of Breeder and Offspring
Diet
Breeder diet 1 x Offspring 0% FORPLUS™ 54.5 8.15 270 8.36 342 38.5 17.4
Breeder diet 1 x Offspring 1% FORPLUS™ 54.0 8.73 284 8.70 363 38.8 17.5
Breeder diet 2 x Offspring 0% FORPLUS™ 55.6 7.68 273 8.03 373 38.6 17.4
Breeder diet 2 x Offspring 1% FORPLUS™ 54.0 7.75 290 8.13 358 38.6 17.4
Breeder diet 3 x Offspring 0% FORPLUS™ 55.4 7.42 248 8.77 358 38.9 17.5
Breeder diet 3 x Offspring 1% FORPLUS™ 55.3 8.23 255 8.50 350 38.3 17.2
Breeder diet 4 x Offspring 0% FORPLUS™ 55.1 7.57 253 8.61 374 38.6 17.4
Breeder diet 4 x Offspring 1% FORPLUS™ 54.8 7.55 269 7.64 361 38.6 17.3
SEM 0.55 0.39 16.7 0.40 11.5 0.17 0.08
P-value 0.49 0.65 0.99 0.36 0.30 0.06 0.08

167
CHAPTER 8. Summary and Conclusions
The effects of dietary n-3 PUFA supplementation with microalgae (0% or 2%
FORPLUS™) and Zn source (inorganic: ZnO or organic: Bioplex® Zn) on broiler breeder
pullet growth and bone quality, broiler breeder reproduction, and offspring skeletal
development, growth and bone quality were evaluated. Broiler breeder offspring were
studied at three different time points during breeder reproduction to understand the impact
of breeder diet alone on offspring growth performance as well as the combined effects of
breeder diet and offspring diet on offspring early growth performance and bone quality.
Dietary microalgae supplementation level and Zn source were found to alter broiler
breeder pullet development as reported in Chapter 2. Most changes observed due to broiler
breeder diet were not due to interaction of the two dietary factors, but as an effect of either
dietary microalgae level or Zn source alone. From placement as one-day old pullets to
three weeks of age, broiler breeder pullets were provided ad libitum access to diets with
0% or 2% microalgae and supplemental inorganic or organic Zn. Growth and development
are important during the first several weeks of a broiler breeder’s life because it sets the
foundation for frame size and uniformity later on in life (Cobb-Vantress, 2012). It is also
important to control pullet BW during rearing because BW is associated with reproductive
performance (Kleyn, 2013). Current industry management practices involve feeding
pullets to achieve target BW at specific ages. Pullets fed diets with 2% microalgae had
greater femur quality although growth performance was reduced compared to pullets fed
diets without microalgae. All broiler breeder pullets were above the recommended BW
target for their age regardless of microalgae supplementation, although the pullets fed diets
with microalgae were closer to the optimal BW for their age compared to pullets not fed
microalgae. The microalgae used in this study provided a source of docosahexaenoic acid
(DHA) and DHA is critical for bone modelling in young animals (Watkins et al., 2003; Li
et al., 2010; Ahn et al., 2016). The first 6 weeks of pullet rearing is especially important
for skeletal development (Kleyn, 2013). Microalgae supplementation promoted femur
development in broiler breeder pullets early in life instead of BW accumulation which may
translate to a more stable frame and easier management of pullet BW.

168
When broiler breeder pullets reached 3 weeks of age, they were no longer provided
ad libitum access to their diets. A daily, restricted feeding regimen was implemented to
control pullet growth (BW). During restricted feeding at 6 and 16 wk of age, pullet bone
breaking strength and bone ash mineral content was altered by microalgae and Zn source
supplementation. Specifically, 2% microalgae supplementation reduced tibia breaking
strength and Zn content at 6 weeks of age, while organic Zn reduced femur breaking
strength and Cu content at 16 weeks of age. Other studies have reported that dietary n-3
PUFA (Lukaski et al., 2001; Chow, 2007) and trace mineral antagonisms (Hamilton et al.,
1979; Sun et al., 2012) can alter trace mineral absorption and metabolism. The difference
in pullet feeding management from ad libitum to restricted feeding may have also
contributed to pullet leg bone quality, as nutrient intake was limited to control pullet
growth. More research is needed to assess the effects of dietary lipids and trace mineral
nutrition on pullet leg bone development and health during restricted feeding.
When pullets reached the pre-lay phase (19-20 weeks of age), microalgae
supplementation and organic Zn source had separate, positive effects on pullet BW. During
the pre-lay phase an acceleration of pullet BW is expected to prepare egg production
(Cobb-Vantress, 2012). Pullets fed diets with 2% microalgae had increased BW at 19 and
20 weeks of age compared to pullets fed diets without microalgae. The same observations
were made for pullets fed organic Zn vs inorganic Zn. A study conducted by Robinson et
al. (1995) found that pullet BW at 20 weeks old can determine reproductive performance
later on in life, such that lighter pullets were more likely to produce more broken eggs,
have lower fertility, and have a lower number of chicks produced per hen.
Uniformity must be monitored when feed is restricted to ensure that the pullet flock
will reach sexual maturity at the same time and have uniform egg production (Cobb-
Vantress, 2012). Overweight broiler breeders are known to have greater reproductive
dysfunction (Leeson and Summers, 2010) that results in reduced egg production (Chen et
al., 2006), while underweight broiler breeders may not have sufficient energy and nutrient
reserves to sustain steady egg production which also results in reduced reproductive
performance (Robinson et al., 1995; Leeson and Summers, 2010). Therefore, broiler
breeder pullet uniformity is of utmost importance and a high priority for producers (Kleyn,
2013). Organic Zn compared to inorganic Zn in pullet diets resulted in better BW

169
uniformity throughout the pullet rearing phase (3-20 weeks of age) which may translate to
better reproductive performance later in life.
In Chapter 3, the effects of microalgae and Zn source supplementation in broiler
breeder diets on egg quality, hen day production, fertility, and hatchability of offspring
were investigated. Most of these reproduction variables were affected by microalgae level
and Zn source alone and not in combination. The broiler breeder reproductive period can
be divided into two phases, peak lay or post-peak lay based on ovulation patterns (Leeson
and Summers, 2010). For this study, peak lay represented a time period from the onset of
lay to a high and steady rate of egg production. The decline in ovulation after peak lay due
to broiler breeder aging is referred to as post-peak lay.
Throughout peak and post-peak lay, broiler breeders that were fed diets with 2%
microalgae produced smaller eggs with greater eggshell percentage. The reduced egg size
was most likely a consequence of reduced yolk weight due to microalgae supplementation.
During ovulation broiler breeders release a follicle composed of yolk into the oviduct
where albumen and the shell is added to form an egg. The yolk accounts for approximately
30% of the egg weight (Noble and Cocchi, 1990) and this value is fairly consistent despite
any differences in egg size. Increased dietary n-3 PUFA has been cited to interfere with
the liver production of very low density lipid proteins (Vance and Vance, 1990), which are
transferred to the ovary and become a major component of follicle yolk (Noble and Cocchi,
1990; Speake et al., 1998). It is possible microalgae supplementation decreased liver lipid
synthesis need for yolk formation. The eggshell is composed of 96% calcium carbonate
(Nys et al., 2004). Part of the calcium needed to form the eggshell comes from the diet and
part of it is mobilized from femurs and tibias as a result of bone resorption (Leeson and
Summers, 2001). Previous research suggests that n-3 PUFA, including DHA, can enhance
Ca absorption, bioavailability and increase Ca content of bones (Claassen et al., 1995;
Kruger and Horrobin, 1997; Liu et al., 2003). Perhaps the increase in eggshell percentage
throughout lay was the result of improved Ca absorption and/or metabolism due to
microalgae supplementation.
Microalgae supplementation in broiler breeder diets did not impact hen day
production throughout lay, whereas inorganic Zn improved hen day production during
post-peak lay. However, the effect of inorganic Zn on hen day production may be

170
confounded by the high amount of Ca present in the breeder diets supplemented with
inorganic Zn compared to breeder diets supplemented with organic Zn. Fertility and
hatchability were not affected by microalgae supplementation or Zn source during peak
lay. During post-peak lay microalgae supplementation and organic Zn source improved
offspring hatchability. Hatchability improvements coincided with reduced percentage of
chicks that did not pip, indicating either microalgae or organic Zn may have reduced late
embryonic mortality during post-peak lay. For breeders fed diets with 2% microalgae, it
is unclear why hatchability increased. Although, organic Zn source was previously cited to
improve hatchability in breeders (Hudson et al., 2004; El-Samee et al., 2012) the
mechanism of this phenomenon is poorly understood and requires more investigation.
The effects of broiler breeder dietary microalgae supplementation and Zn source
on offspring skeletal leg development at hatch was evaluated in Chapter 4. Skeletal leg
morphology, growth plate morphology, and bone-specific alkaline phosphatase
measurements were obtained in 3 different offspring groups. The three offspring groups
were hatched at 3 different time points during the broiler breeder laying phase in roughly
ten-week intervals; 19-20 weeks of lay (peak lay), 30-31 weeks of lay (post-peak lay), and
41-43 weeks of lay (post-peak lay).
During embryonic growth, the offspring’s sole nutrient source comes from the
nutrients deposited into the egg yolk, albumin, shell membrane and shell by the broiler hen
(Romanoff and Romanoff, 1967; Richards, 1997; Yair and Uni, 2011). Broiler breeder
diet had a direct influence on offspring skeletal development during embryonic growth.
The offspring group from 19-20 weeks of lay benefited the most from broiler dietary
supplementation of organic Zn. These offspring had increased leg bone dimensions such
as greater tibia length and femur epiphysis width due to organic Zn in the breeder diet.
Bone size and shape are established during ontogeny and its structure can influence bone
strength (Hart et al., 2017). This group of offspring also had greater bone formation as
indicated by elevated bone-specific alkaline phosphatase activity in their serum.
Furthermore, femur growth plate morphology was altered such that the proliferative and
hypertrophic chondrocyte zones were greater. Among other factors, growth plate
chondrocyte proliferation and hypertrophy greatly impacts long bone elongation (Pines and
Hurwitz, 1991; Villemure and Stokes, 2009). Similar to the first offspring group (from 19-

171
20 weeks of lay), the second offspring group from 30-31 weeks of lay had greater tibia
dimensions such as length and diaphysis width due to organic Zn in the breeder diet. This
group also had greater femur growth plate hypertrophic zone height. However, as the
broiler breeders neared the end of lay, the skeletal development of the last group of
offspring from 41-43 weeks of lay only exhibited increased tibia growth plate hypertrophic
zone height indicating the effect of Zn source may eventually diminish with breeder age.
Microalgae supplementation in the breeder diet altered offspring femur structure by
increasing proximal and distal epiphysis width in the first offspring group from 19-20
weeks of lay. In the second offspring group from 30-31 weeks of lay, tibia length and
diaphysis width were increased by the combination of 2% microalgae and inorganic Zn in
the breeder diet. The last offspring group had reduced femur diaphysis and distal epiphysis
widths due to microalgae supplementation in the breeder diet, but this may be explained
by decreased chick size that was also observed in this offspring group (chapter 7 results).
In chapter 5 the effect of microalgae supplementation and Zn source in broiler
breeder diets on offspring early growth performance and leg bone quality 3 weeks after
hatch was evaluated. Microalgae supplementation in breeder diets reduced offspring hatch
weight. The reduced offspring hatch weight corresponds to reduced egg size by 2%
microalgae in breeder diets that was observed in chapter 3. Despite a reduction in offspring
hatch weight, 2% microalgae in the breeder diet did not affect offspring growth
performance through 3 weeks of age. However, microalgae supplementation in breeder
diets increased offspring femur length when they were 3 weeks old. Results from a
previous study determined that the femur is sensitive to changes in dietary n-3 PUFA (Li
et al., 2010). These results from this study show that broiler offspring femur are sensitive
to n-3 PUFA in parent breeder diets. Broiler breeder dietary Zn source did not affect
offspring hatch weight or early growth performance but did impact offspring skeletal
morphology up to 3 weeks of age. Offspring from breeders fed organic Zn had increased
proximal tibia epiphyseal width and Zn content. In Chapter 4, both organic Zn and
microalgae in breeder diets improved skeletal leg morphology of this offspring group at
hatch. It appears that the positive effects of 2% microalgae and organic Zn in breeder diets
on offspring skeletal morphology persisted up to 3 weeks after hatch.

172
In Chapter 6 the interaction of broiler breeder diet and offspring dietary Zn source
on offspring early growth performance and leg bone quality 3 weeks after hatch was
evaluated. Similar to results found in chapter 5, 2% microalgae supplementation in breeder
diets reduced chick hatch weight. In addition, 2% microalgae in breeder diets negatively
affected offspring growth performance up to 3 weeks post-hatch. Offspring leg bone
quality remained unchanged due to breeder diet. In contrast, organic Zn supplementation
in the offspring diet was found to increase body weight, tibia diaphysis width, and tibia
diaphysis circumference at 3 weeks of age. Therefore, this group of offspring did not
benefit from microalgae or Zn source in the breeder diet, but from organic Zn
supplementation in their diets instead.
The interaction effect of broiler breeder diet offspring microalgae supplementation
on offspring early growth performance and leg bone quality 3 weeks after hatch was
assessed in Chapter 7. As was observed in chapters 5 and 6, breeders fed diets
supplemented with 2% microalgae produced offspring with reduced chick hatch weight. It
is very likely that reduced chick hatch weight is correlated to egg size results shown in
chapter 3. Regarding offspring early growth performance, results from chapter 6 were
replicated in chapter 7 - supplemental microalgae in the breeder diets reduced offspring
growth performance through 3 weeks of age. These findings indicate that microalgae in
breeder diets, particularly during post-peak lay, can have lasting negative effects on
offspring hatch weight and early growth performance. Offspring provided supplemental
microalgae in their diet exhibited poorer feed conversion 3 weeks after hatch compared to
offspring that were not provided dietary microalgae. These results show that microalgae
in the breeder or offspring diet had a negative effect on offspring early growth performance.
For this study offspring bone quality was not significantly altered by breeder diet, offspring
diet, or a combination of both diets. The offspring in chapter 7 were produced late in the
broiler breeder post-peak lay phase. In chapter 4, skeletal development of offspring
produced late in the breeder laying phase was minimally impacted by breeder diet. It is
possible that the effect of microalgae and Zn source supplementation in breeder diets on
offspring skeletal development and bone quality declines with breeder age.
Overall, the results from studies show that 2% microalgae in broiler breeder diets
improved broiler breeder pullet leg development during ad libitum feeding, pullet pre-lay

173
BW during restricted feeding, and breeder offspring hatchability during post-peak lay.
However, microalgae in broiler breeder diets negatively affected egg size, offspring hatch
weight, and offspring early growth performance. Organic Zn in broiler breeder diets
improved pullet uniformity during restricted feeding, pullet pre-lay BW during restricted
feeding, breeder offspring hatchability during post-peak lay, embryonic skeletal
development of offspring, and offspring bone quality. Organic Zn in offspring diets
improved offspring early growth performance and leg bone morphology. In conclusion,
long-term microalgae supplementation has limited application in broiler breeder diets,
whereas organic Zn is beneficial for broiler breeder pullet development, broiler breeder
reproduction, and offspring skeletal development.

174
BIBLIOGRAPHY
Abbas, S., A. G. Elseid, and M. Ahmed. 2010. Effect of body weight uniformity on the
productivity of broiler breeder hens. Int. J. Poult. Sci 9: 225-230.
Abdallah, D. et al. 2014. Fatty acid composition in matrix vesicles and in microvilli from
femurs of chicken embryos revealed selective recruitment of fatty acids.
Biochemical and biophysical research communications 446: 1161-1164.
Abdelnour, S., M. A. El-Hack, M. Arif, A. Khafaga, and A. Taha. 2019. The application
of the microalgae Chlorella spp. as a supplement in broiler feed. World's Poultry
Science Journal 75: 305-318.
Abdulla, N. R. et al. 2017. Effects of dietary oil sources, calcium and phosphorus levels on
growth performance, carcass characteristics and bone quality of broiler chickens.
Journal of applied animal research 45: 423-429.
Ahmad, S., M. Yousaf, M. A. Sabri, and Z. Kamran. 2012. Response of laying hens to
omega-3 fatty acids for performance and egg quality. Avian Biology Research 5:
1-10.
Ahmadieh, H., and A. Arabi. 2011. Vitamins and bone health: beyond calcium and vitamin
D. Nutrition Reviews 69: 584-598.
Ahn, S. H. et al. 2016. Free fatty acid receptor 4 (GPR120) stimulates bone formation and
suppresses bone resorption in the presence of elevated n-3 fatty acid levels.
Endocrinology 157: 2621-2635.
Al-Rubaye, A. A. et al. 2015. Genome analysis of Staphylococcus agnetis, an agent of
lameness in broiler chickens. PloS one 10: e0143336.
Al-Rubaye, A. A. K. et al. 2016. Chondronecrosis with osteomyelitis in broilers: Further
defining a bacterial challenge model using the wire flooring model. Poultry Science
96: 332-340.
Alagawany, M. et al. 2019. Omega-3 and Omega-6 Fatty Acids in Poultry Nutrition: Effect
on Production Performance and Health. Animals 9: 573.
Angel, R. 2007. Metabolic disorders: limitations to growth of and mineral deposition into
the broiler skeleton after hatch and potential implications for leg problems. Journal
of Applied Poultry Research 16: 138-149.
Annison, G. 1993. The role of wheat non-starch polysaccharides in broiler nutrition.
Australian Journal of Agricultural Research 44: 405-422.
Ao, T. et al. 2006. Evaluation of Bioplex Zn® as an organic zinc source for chicks.
International Journal of Poultry Science 5: 808-811.
Ao, T. et al. 2011. Effects of feeding different concentration and forms of zinc on the
performance and tissue mineral status of broiler chicks. British Poultry Science 52:
466-471.
Arend, W. P., and J. M. Dayer. 1990. Cytokines and cytokine inhibitors or antagonists in
rheumatoid arthritis. Arthritis & Rheumatism 33: 305-315.
U.S. Poultry & Egg Association. 2018. Indentified Research Needs (2018).
http://www.uspoultry.org/research/docs/USPOULTRY-Identified-Research-
Needs-2018.pdf. Accessed August 27, 2019.
Atencio, A., H. Edwards Jr, and G. Pesti. 2005. Effects of vitamin D3 dietary
supplementation of broiler breeder hens on the performance and bone abnormalities
of the progeny. Poultry science 84: 1058-1068.

175
Aviagen. 2018. Ross Broiler Management Handbook.
Aydin, R., and M. Cook. 2004. The effect of dietary conjugated linoleic acid on egg yolk
fatty acids and hatchability in Japanese quail. Poultry Science 83: 2016-2022.
Aydin, R., M. W. Pariza, and M. E. Cook. 2001. Olive Oil Prevents the Adverse Effects of
Dietary Conjugated Linoleic Acid on Chick Hatchability and Egg Quality. The
Journal of Nutrition 131: 800-806.
Bailie, C. L., M. Baxter, and N. E. O’Connell. 2018. Exploring perch provision options for
commercial broiler chickens. Applied Animal Behaviour Science 200: 114-122.
Bassler, A. W. et al. 2013. Potential risk factors associated with contact dermatitis,
lameness, negative emotional state, and fear of humans in broiler chicken flocks.
Poult Sci 92: 2811-2826.
Bautista-Ortega, J., D. E. Goeger, and G. Cherian. 2009. Egg yolk omega-6 and omega-3
fatty acids modify tissue lipid components, antioxidant status, and ex vivo
eicosanoid production in chick cardiac tissue. Poult Sci 88: 1167-1175.
Bellairs, R., and M. Osmond. 2005. Atlas of chick development. Elsevier
Bhattacharya, A., M. Rahman, D. Sun, and G. Fernandes. 2007. Effect of fish oil on bone
mineral density in aging C57BL/6 female mice. The Journal of nutritional
biochemistry 18: 372-379.
Boling, S., D. Webel, I. Mavromichalis, C. M. Parsons, and D. Baker. 2000. The effects of
citric acid on phytate-phosphorus utilization in young chicks and pigs. Journal of
Animal Science 78: 682-689.
Bradshaw, R., R. Kirkden, and D. Broom. 2002. A review of the aetiology and pathology
of leg weakness in broilers in relation to welfare. Avian and poultry biology reviews
13: 45-103.
Brandao-Neto, J., V. Stefan, B. B. Mendonca, W. Bloise, and A. V. B. Castro. 1995. The
essential role of zinc in growth. Nutrition Research 15: 335-358.
Brody, T. 1994. Nutritional biochemistry. Nutritional biochemistry.
Buijs, S., L. Keeling, S. Rettenbacher, E. Van Poucke, and F. A. Tuyttens. 2009. Stocking
density effects on broiler welfare: identifying sensitive ranges for different
indicators. Poult Sci 88: 1536-1543.
Butterworth, A. 1999. Infectious components of broiler lameness: a review. World's
poultry science journal 55: 327-352.
Calder, P. C. 2001. Polyunsaturated fatty acids, inflammation, and immunity. Lipids 36:
1007-1024.
Calder, P. C. 2006a. n− 3 polyunsaturated fatty acids, inflammation, and inflammatory
diseases. The American journal of clinical nutrition 83: 1505S-1519S.
Calder, P. C. 2006b. Polyunsaturated fatty acids and inflammation. Prostaglandins,
leukotrienes and essential fatty acids 75: 197-202.
Chang, A., J. Halley, and M. Silva. 2016. Can feeding the broiler breeder improve chick
quality and offspring performance? Animal Production Science 56: 1254-1262.
Chen, S., J. McMurtry, and R. Walzem. 2006. Overfeeding-induced ovarian dysfunction
in broiler breeder hens is associated with lipotoxicity. Poultry science 85: 70-81.
Cherian, G. 2008. Egg quality and yolk polyunsaturated fatty acid status in relation to
broiler breeder hen age and dietary n-3 oils. Poult Sci 87: 1131-1137.
Cherian, G. 2013. Chapter 28 - Omega-3 Fatty Acids and Early Life Nutritional
Programming: Lessons from the Avian Model A2 - Watson, Ronald Ross. In: V.

176
R. Preedy (ed.) Bioactive Food as Dietary Interventions for Liver and
Gastrointestinal Disease. p 437-448. Academic Press, San Diego.
Cherian, G. 2015. Nutrition and metabolism in poultry: role of lipids in early diet. J Anim
Sci Biotechnol 6: 28.
Cherian, G., J. Bautista-Ortega, and D. E. Goeger. 2009. Maternal dietary n-3 fatty acids
alter cardiac ventricle fatty acid composition, prostaglandin and thromboxane
production in growing chicks. Prostaglandins Leukot Essent Fatty Acids 80: 297-
303.
Chow, C. K. 2007. Fatty acids in foods and their health implications. CRC press
Claassen, N., H. Coetzer, C. Steinmann, and M. Kruger. 1995. The effect of different n-
6n-3 essential fatty acid ratios on calcium balance and bone in rats. Prostaglandins,
leukotrienes and essential fatty acids 53: 13-19.
Clarke, M. et al. 2014. B-vitamins and bone in health and disease: the current evidence.
Proceedings of the Nutrition Society 73: 330-339.
Cobb-Vantress. 2012. Cobb Broiler Management Guide.
Collins, F. L., S. M. Kim, L. R. McCabe, and C. M. Weaver. 2017. Intestinal microbiota
and bone health: the role of prebiotics, probiotics, and diet Bone Toxicology. p 417-
443. Springer.
Conaway, H. H., P. Henning, and U. H. Lerner. 2013. Vitamin A metabolism, action, and
role in skeletal homeostasis. Endocrine Reviews 34: 766-797.
Cook, M. 2000. Skeletal deformities and their causes: introduction. Poultry Science 79:
982-984.
Couch, J., W. Cravens, C. Elvehjem, and J. Halpin. 1948. Relation of biotin to congenital
deformities in the chick. Anatomical Record 100: 29-48.
Cravens, W., W. McGibbon, and E. Sebesta. 1944. Effect of biotin deficiency on
embryonic development in the domestic fowl. Anatomical Record 90: 55-64.
Crespo, N., and E. Esteve-Garcia. 2001. Dietary fatty acid profile modifies abdominal fat
deposition in broiler chickens. Poultry science 80: 71-78.
Curtis, C. L. et al. 2000. n-3 fatty acids specifically modulate catabolic factors involved in
articular cartilage degradation. Journal of Biological Chemistry 275: 721-724.
de Jong, I. C., H. Gunnink, and J. Van Harn. 2014. Wet litter not only induces footpad
dermatitis but also reduces overall welfare, technical performance, and carcass
yield in broiler chickens. Journal of Applied Poultry Research 23: 51-58.
Derakhshanfar, A., R. Kheirandish, S. Alidadi, and A. Bidadkosh. 2013. Study of long
effects of administration of aspirin (acetylsalicylic acid) on bone in broiler
chickens. Comparative Clinical Pathology 22: 1201-1204.
Dibner, J. J., J. D. Richards, M. L. Kitchell, and M. A. Quiroz. 2007. Metabolic Challenges
and Early Bone Development. The Journal of Applied Poultry Research 16: 126-
137.
Dinev, I. 2009. Clinical and morphological investigations on the prevalence of lameness
associated with femoral head necrosis in broilers. Br Poult Sci 50: 284-290.
Dunkley, C. 2007. Leg Problems in Broilers. https://thepoultrysite.com/articles/leg-
problems-in-broilers. Accessed September 11, 2019.
EFSA. 2010. Scientific Opinion on welfare aspects of the management and housing of the
grand‐parent and parent stocks raised and kept for breeding purposes. EFSA
Journal 8: 1667.

177
EFSA Panel on Animal Health Welfare. 2010. Scientific opinion on the influence of
genetic parameters on the welfare and the resistance to stress of commercial
broilers. EFSA Journal 8: 1666.
El-Samee, L. D. A., I. El-Wardany, N. G. Ali, and O. Abo-El-Azab. 2012. Egg quality,
fertility and hatchability of laying quails fed diets supplemented with organic zinc,
chromium yeast or mannan oligosaccharides. International Journal of Poultry
Science 11: 221-224.
Estevez, I. 2007. Density allowances for broilers: where to set the limits? Poult Sci 86:
1265-1272.
FAO. 2014. Review of animal welfare legislation in the beef, pork, and poultry industries.
10, Food and Agriculture Organization of the United Nations, Rome.
Farhoomand, P., and S. Checaniazer. 2009. Effects of graded levels of dietary fish oil on
the yield and fatty acid composition of breast meat in broiler chickens. Journal of
Applied Poultry Research 18: 508-513.
Favero, A. et al. 2013. Development of bone in chick embryos from Cobb 500 breeder hens
fed diets supplemented with zinc, manganese, and copper from inorganic and amino
acid-complexed sources. Poultry science 92: 402-411.
Finley, J. W., and C. D. Davis. 2001. Manganese absorption and retention in rats is affected
by the type of dietary fat. Biological trace element research 82: 143-158.
Fleming, R. H. 2008. Nutritional factors affecting poultry bone health. Proc Nutr Soc 67:
177-183.
Fong, L., B. S. Muhlhausler, R. A. Gibson, and C. J. Xian. 2012. Perinatal maternal dietary
supplementation of omega3-fatty acids transiently affects bone marrow
microenvironment, osteoblast and osteoclast formation, and bone mass in male
offspring. Endocrinology 153: 2455-2465.
Gartner, L. P., and J. L. Hiatt. 2001. Color Textbook of Histology. WB Saunders,
Philadelphia.
Gocsik, E., A. M. Silvera, H. Hansson, H. W. Saatkamp, and H. J. Blokhuis. 2017.
Exploring the economic potential of reducing broiler lameness. Br Poult Sci 58:
337-347.
Goldring, M. B. 2000. Osteoarthritis and cartilage: the role of cytokines. Current
rheumatology reports 2: 459-465.
González-Cerón, F., R. Rekaya, N. Anthony, and S. Aggrey. 2015. Genetic analysis of leg
problems and growth in a random mating broiler population. Poultry science 94:
162-168.
Granquist, E. G., G. Vasdal, I. C. de Jong, and R. O. Moe. 2019. Lameness and its
relationship with health and production measures in broiler chickens. Animal: 1-8.
Gunness, P. et al. 2016. Circulating triglycerides and bile acids are reduced by a soluble
wheat arabinoxylan via modulation of bile concentration and lipid digestion rates
in a pig model. Molecular nutrition & food research 60: 642-651.
Haase, H., and L. Rink. 2014a. Multiple impacts of zinc on immune function. Metallomics
6: 1175-1180.
Haase, H., and L. Rink. 2014b. Zinc signals and immune function. Biofactors 40: 27-40.
Hall, J. A., S. Jha, M. M. Skinner, and G. Cherian. 2007. Maternal dietary n-3 fatty acids
alter immune cell fatty acid composition and leukotriene production in growing
chicks. Prostaglandins Leukot Essent Fatty Acids 76: 19-28.

178
Hamilton, R., M. Fox, B. Fry Jr, A. Jones, and R. Jacobs. 1979. Zinc interference with
copper, iron and manganese in young Japanese quail. Journal of food science 44:
738-741.
Hart, N. H. et al. 2017. Mechanical basis of bone strength: influence of bone material, bone
structure and muscle action. J Musculoskelet Neuronal Interact 17: 114-139.
Havenstein, G. B., P. R. Ferket, and M. A. Qureshi. 2003. Growth, livability, and feed
conversion of 1957 versus 2001 broilers when fed representative 1957 and 2001
broiler diets. Poult Sci 82: 1500-1508.
Havenstein, G. B., P. R. Ferket, S. E. Scheideler, and B. T. Larson. 1994. Growth,
livability, and feed conversion of 1957 vs 1991 broilers when fed "typical" 1957
and 1991 broiler diets. Poult Sci 73: 1785-1794.
Head, B., M. Bionaz, and G. Cherian. 2019. Flaxseed and Carbohydrase Enzyme
Supplementation Alters Hepatic n-3 Polyunsaturated Fatty Acid Molecular Species
and Expression of Genes Associated with Lipid Metabolism in Broiler Chickens.
Veterinary sciences 6: 25.
Henry, P., C. Ammerman, D. Campbell, and R. Miles. 1987. Effect of antibiotics on tissue
trace mineral concentration and intestinal tract weight of broiler chicks. Poultry
Science 66: 1014-1018.
Holick, M. F. 2007. Vitamin D deficiency. New England Journal of Medicine 357: 266-
281.
Houshmand, M. et al. 2011. Effects of non‐antibiotic feed additives on performance, tibial
dyschondroplasia incidence and tibia characteristics of broilers fed low‐calcium
diets. Journal of animal physiology and animal nutrition 95: 351-358.
Howlett, C. 1980. The fine structure of the proximal growth plate and metaphysis of the
avian tibia: endochondral osteogenesis. Journal of Anatomy 130: 745.
Huang, S.-c. et al. 2018. Role and regulation of growth plate vascularization during
coupling with osteogenesis in tibial dyschondroplasia of chickens. Scientific
reports 8: 3680.
Hudson, B., W. Dozier III, and J. Wilson. 2005. Broiler live performance response to
dietary zinc source and the influence of zinc supplementation in broiler breeder
diets. Animal Feed Science and Technology 118: 329-335.
Hudson, B., W. Dozier Iii, J. Wilson, J. Sander, and T. Ward. 2004. Reproductive
performance and immune status of caged broiler breeder hens provided diets
supplemented with either inorganic or organic sources of zinc from hatching to 65
wk of age. Journal of Applied Poultry Research 13: 349-359.
Hulan, H., R. Ackman, W. Ratnayake, and F. Proudfoot. 1989. Omega-3 fatty acid levels
and general performance of commercial broilers fed practical levels of redfish meal.
Poultry Science 68: 153-162.
Hulan, H., F. Proudfoot, R. Ackman, and W. Ratnayake. 1988. Omega-3 fatty acid levels
and performance of broiler chickens fed redfish meal or redfish oil. Canadian
Journal of Animal Science 68: 533-547.
Hulan, H., F. Proudfoot, D. Ramey, and K. McRae. 1980. Influence of genotype and diet
on general performance and incidence of leg abnormalities of commercial broilers
reared to roaster weight. Poultry Science 59: 748-757.

179
Hutchins, H. L., Y. Li, K. Hannon, and B. A. Watkins. 2011. Eicosapentaenoic acid
decreases expression of anandamide synthesis enzyme and cannabinoid receptor 2
in osteoblast-like cells. The Journal of nutritional biochemistry 22: 195-200.
Jacob, J., and T. Pescatore. 2013. Avian Skeletal System. Report No. ASC-202,
Cooperative Extension Service, University of Kentucky College of Agriculture,
Food and Environment.
Jaroni, D., S. Scheideler, M. Beck, and C. Wyatt. 1999. The effect of dietary wheat
middlings and enzyme supplementation II: apparent nutrient digestibility, digestive
tract size, gut viscosity, and gut morphology in two strains of leghorn hens. Poultry
Science 78: 1664-1674.
Jenkinson, A., M. Franklin, K. Wahle, and G. Duthie. 1999. Dietary intakes of
polyunsaturated fatty acids and indices of oxidative stress in human volunteers.
European journal of clinical nutrition 53: 523.
Jiang, T. et al. 2015. Molecular survey of bacterial communities associated with bacterial
chondronecrosis with osteomyelitis (BCO) in broilers. PloS one 10: e0124403.
Jiang, X. et al. 2019. Effect of Anacardic Acid against Thiram Induced Tibial
Dyschondroplasia in Chickens via Regulation of Wnt4 Expression. Animals 9: 82.
Kang, H. et al. 2013. Effect of various forms of dietary Chlorella supplementation on
growth performance, immune characteristics, and intestinal microflora population
of broiler chickens. Journal of Applied Poultry Research 22: 100-108.
Kapell, D. N. et al. 2012. Twenty-five years of selection for improved leg health in
purebred broiler lines and underlying genetic parameters. Poult Sci 91: 3032-3043.
Katono, T. et al. 2008. Sodium butyrate stimulates mineralized nodule formation and
osteoprotegerin expression by human osteoblasts. Archives of oral biology 53: 903-
909.
Kaukonen, E., M. Norring, and A. Valros. 2017. Perches and elevated platforms in
commercial broiler farms: use and effect on walking ability, incidence of tibial
dyschondroplasia and bone mineral content. Animal 11: 864-871.
Kawaguchi, H., C. C. Pilbeam, J. R. Harrison, and L. G. Raisz. 1995. The role of
prostaglandins in the regulation of bone metabolism. Clinical Orthopaedics and
Related Research: 36-46.
Keci, M. et al. 2019. Deoxynivalenol in the Diet Impairs Bone Mineralization in Broiler
Chickens. Toxins (Basel) 11.
Keegan, J. D., G. Fusconi, M. Morlacchini, and C. A. Moran. 2019. Whole-Life or
Fattening Period Only Broiler Feeding Strategies Achieve Similar Levels of
Omega-3 Fatty Acid Enrichment Using the DHA-Rich Protist, Aurantiochytrium
limacinum. Animals 9: 327.
Kestin, S. C., S. Gordon, G. Su, and P. Sorensen. 2001. Relationships in broiler chickens
between lameness, liveweight, growth rate and age. Vet Rec 148: 195-197.
Kestin, S. C., T. G. Knowles, A. E. Tinch, and N. G. Gregory. 1992. Prevalence of leg
weakness in broiler chickens and its relationship with genotype. Vet Rec 131: 190-
194.
Khan, S. H., and J. Iqbal. 2016. Recent advances in the role of organic acids in poultry
nutrition. Journal of Applied Animal Research 44: 359-369.
Kidd, M., N. Anthony, and S. Lee. 1992. Progeny performance when dams and chicks are
fed supplemental zinc. Poultry Science 71: 1201-1206.

180
Kidd, M. T. 2003. A treatise on chicken dam nutrition that impacts on progeny. World's
Poultry Science Journal 59: 475-494.
Kierończyk, B., M. Rawski, D. Józefiak, and S. Świątkiewicz. 2017. Infectious and non-
infectious factors associated with leg disorders in poultry–a review. Annals of
animal science 17: 645-669.
Kirsch, T., G. Harrison, K. P. Worch, and E. E. Golub. 2000. Regulatory roles of zinc in
matrix vesicle‐mediated mineralization of growth plate cartilage. Journal of Bone
and Mineral Research 15: 261-270.
Kittelsen, K., E. Granquist, Ø. Kolbjørnsen, O. Nafstad, and R. Moe. 2015. A comparison
of post-mortem findings in broilers dead-on-farm and broilers dead-on-arrival at
the abattoir. Poultry science 94: 2622-2629.
Kleyn, R. 2013. Chicken nutrition. A Guide for Nutritionists and Poultry Professionals.
British library press, Leicestershire, London, UK: 191-208.
Knowles, T. G. et al. 2008. Leg disorders in broiler chickens: prevalence, risk factors and
prevention. PloS one 3: e1545.
Kohli, P., and B. D. Levy. 2009. Resolvins and protectins: mediating solutions to
inflammation. Br J Pharmacol 158: 960-971.
Koppenol, A. et al. 2015a. Transition of maternal dietary n-3 fatty acids from the yolk to
the liver of broiler breeder progeny via the residual yolk sac. Poult Sci 94: 43-52.
Koppenol, A. et al. 2014. Effect of the ratio of dietary n-3 fatty acids eicosapentaenoic acid
and docosahexaenoic acid on broiler breeder performance, egg quality, and yolk
fatty acid composition at different breeder ages. Poult Sci 93: 564-573.
Koppenol, A., E. Delezie, J. Buyse, and N. Everaert. 2015b. The interaction between
maternal and post-hatch n-3 fatty acid supplementation in broiler diets. J Anim
Physiol Anim Nutr (Berl) 99: 864-872.
Koppenol, A. et al. 2015c. Effects of maternal dietary EPA and DHA supplementation and
breeder age on embryonic and post-hatch performance of broiler offspring: age and
n-3 pufa affect embryonic and post-hatch performance. J Anim Physiol Anim Nutr
(Berl) 99 Suppl S1: 36-47.
Koren, N., S. Simsa-Maziel, R. Shahar, B. Schwartz, and E. Monsonego-Ornan. 2014.
Exposure to omega-3 fatty acids at early age accelerate bone growth and improve
bone quality. J Nutr Biochem 25: 623-633.
Korver, D., P. Wakenell, and K. Klasing. 1997. Dietary fish oil or lofrin, a 5-lipoxygenase
inhibitor, decrease the growth-suppressing effects of coccidiosis in broiler chicks.
Poultry science 76: 1355-1363.
Kruger, M. C., M. Coetzee, M. Haag, and H. Weiler. 2010. Long-chain polyunsaturated
fatty acids: selected mechanisms of action on bone. Prog Lipid Res 49: 438-449.
Kruger, M. C., and D. F. Horrobin. 1997. Calcium metabolism, osteoporsis and essential
fatty acids: A review. Progress in lipid research 36: 131-151.
Kwun, I.-S. et al. 2010. Zinc deficiency suppresses matrix mineralization and retards
osteogenesis transiently with catch-up possibly through Runx 2 modulation. Bone
46: 732-741.
Lau, B. Y., D. J. Cohen, W. E. Ward, and D. W. Ma. 2013. Investigating the role of
polyunsaturated fatty acids in bone development using animal models. Molecules
18: 14203-14227.

181
Leach, R. M., Jr., and E. Monsonego-Ornan. 2007. Tibial dyschondroplasia 40 years later.
Poult Sci 86: 2053-2058.
Leeson, S., and J. Summers. 2005. Commercial poultry nutrition. Commercial poultry
nutrition.
Leeson, S., and J. D. Summers. 2001. Nutrition of the Chicken, 4th Edition. University
Books, Guelph, Ontario, Canada.
Leeson, S., and J. D. Summers. 2010. Broiler breeder production. Nottingham University
Press
Li, J., D. Bi, S. Pan, Y. Zhang, and D. Zhou. 2008. Effects of high dietary vitamin A
supplementation on tibial dyschondroplasia, skin pigmentation and growth
performance in avian broilers. Research in veterinary science 84: 409-412.
Li, Y., M. F. Seifert, S.-Y. Lim, N. Salem, and B. A. Watkins. 2010. Bone mineral content
is positively correlated to n-3 fatty acids in the femur of growing rats. British
journal of nutrition 104: 674-685.
Liem, A., G. M. Pesti, and H. M. Edwards, Jr. 2008. The Effect of Several Organic Acids
on Phytate Phosphorus Hydrolysis in Broiler Chicks. Poultry Science 87: 689-693.
Lilburn, M. S. 1994. Skeletal Growth of Commercial Poultry Species. Poultry Science 73:
897-903.
Lin, D. S., W. E. Connor, and G. J. Anderson. 1991. The incorporation of n-3 and n-6
essential fatty acids into the chick embryo from egg yolks having vastly different
fatty acid compositions. Pediatric research 29: 601.
Litchfield, T., Y. Ishikawa, L. Wu, R. Wuthier, and G. Sauer. 1998. Effect of metal ions
on calcifying growth plate cartilage chondrocytes. Calcified tissue international 62:
341-349.
Liu, D., and D. Denbow. 2001. Maternal dietary lipids modify composition of bone lipids
and ex vivo prostaglandin E2 production in early postnatal Japanese quail. Poultry
Science 80: 1344-1352.
Liu, D., H. Veit, J. Wilson, and D. Denbow. 2003. Long-term supplementation of various
dietary lipids alters bone mineral content, mechanical properties and histological
characteristics of Japanese quail. Poultry Science 82: 831-839.
Lucas, S. et al. 2018. Short-chain fatty acids regulate systemic bone mass and protect from
pathological bone loss. Nature communications 9: 55.
Lukaski, H. C., W. W. Bolonchuk, L. M. Klevay, D. B. Milne, and H. H. Sandstead. 2001.
Interactions among dietary fat, mineral status, and performance of endurance
athletes: a case study. International journal of sport nutrition and exercise
metabolism 11: 186-198.
Lunven, P., C. L. C. De St Marcq, E. Carnovale, and A. Fratoni. 1973. Amino acid
composition of hen's egg. British Journal of Nutrition 30: 189-194.
MacDonald, J. M. 2014. Technology, Organization, and Financial Performance in U.S.
Broiler Production, EIB-126. U.S. Department of Agriculture, Economic Research
Service.
Marchewka, J., T. Watanabe, V. Ferrante, and I. Estevez. 2013. Welfare assessment in
broiler farms: Transect walks versus individual scoring. Poultry science 92: 2588-
2599.

182
Maroufyan, E. et al. 2012. Omega-3 polyunsaturated fatty acids enrichment alters
performance and immune response in infectious bursal disease challenged broilers.
Lipids in Health and Disease 11: 15.
Mattila, P., K. Lehikoinen, T. Kiiskinen, and V. Piironen. 1999. Cholecalciferol and 25-
hydroxycholecalciferol content of chicken egg yolk as affected by the
cholecalciferol content of feed. Journal of Agricultural and Food Chemistry 47:
4089-4092.
McCarthy, T. L., M. Centrella, L. G. Raisz, and E. Canalis. 1991. Prostaglandin E2
stimulates insulin-like growth factor I synthesis in osteoblast-enriched cultures
from fetal rat bone. Endocrinology 128: 2895-2900.
Mehmood, K. et al. 2018. Tetramethylpyrazine mitigates toxicity and liver oxidative stress
in tibial dyschondroplasia chickens. Pak Vet J 38: 76-80.
Meyer, M. M., A. K. Johnson, and E. A. Bobeck. 2019. A novel environmental enrichment
device improved broiler performance without sacrificing bird physiological or
environmental quality measures. Poult Sci.
Mitchell, R. D. 2014. Broiler lameness in the United States: An industry perspective. In:
25th Annual Australian Poultry Science Symposium, Sydney, New South Wales. p
175-180.
Moran, C., D. Currie, J. Keegan, and A. Knox. 2018. Tolerance of Broilers to Dietary
Supplementation with High Levels of the DHA-Rich Microalga, Aurantiochytrium
Limacinum: Effects on Health and Productivity. Animals 8: 180.
Mutuş, R. et al. 2006. The effect of dietary probiotic supplementation on tibial bone
characteristics and strength in broilers. Poultry science 85: 1621-1625.
Nääs, I. et al. 2009. Impact of lameness on broiler well-being. Journal of Applied Poultry
Research 18: 432-439.
Naber, E. 1979. The effect of nutrition on the composition of eggs. Poultry Science 58:
518-528.
Najafi, P. et al. 2015. Environmental temperature and stocking density effects on acute
phase proteins, heat shock protein 70, circulating corticosterone and performance
in broiler chickens. International journal of biometeorology 59: 1577-1583.
National Chicken Council. 2019a. U.S. Broiler Performance: 1925 to Present.
https://www.nationalchickencouncil.org/about-the-industry/statistics/u-s-broiler-
performance/. Accessed September 18, 2019.
National Chicken Council. 2019b. Vertical Integration: What it is - and why it's good for
the chicken industry...and you. https://www.nationalchickencouncil.org/industry-
issues/vertical-integration/.
Noble, R. C., and M. Cocchi. 1990. Lipid metabolism and the neonatal chicken. Prog Lipid
Res 29: 107-140.
Norrdin, R., W. Jee, and W. High. 1990. The role of prostaglandins in bone in vivo.
Prostaglandins, leukotrienes and essential fatty acids 41: 139-149.
NRC. 1994. Nutrient requirements of poultry. 9th revised ed. National Academy Press,
Washington, D.C.
Nys, Y., J. Gautron, J. M. Garcia-Ruiz, and M. T. Hincke. 2004. Avian eggshell
mineralization: biochemical and functional characterization of matrix proteins.
Comptes Rendus Palevol 3: 549-562.

183
OECD/FAO. 2019. OECD-FAO Agricultural Outlook 2019-2018. OECD Publishing,
Paris/Food and Agriculture Organization of the United Nations, Rome.
https://doi.org/10.1787/agr_outlook-2019-en
Okoye, J. O., I. U. Asuzu, and H. C. Gugnani. 1988. Paralysis and lameness associated
with aflatoxicosis in broilers. Avian Pathol 17: 731-734.
Oliveira, T. et al. 2015. Effects of in ovo injection of organic zinc, manganese, and copper
on the hatchability and bone parameters of broiler hatchlings. Poultry science 94:
2488-2494.
Orth, M., and M. Cook. 1994. Avian tibial dyschondroplasia: a morphological and
biochemical review of the growth plate lesion and its causes. Veterinary Pathology
31: 403-414.
Orth, M. W., Y. Bai, I. H. Zeytun, and M. E. Cook. 1992. Excess levels of cysteine and
homocysteine induce tibial dyschondroplasia in broiler chicks. The Journal of
nutrition 122: 482-487.
Ortiz, L., M. Rodriguez, C. Alzueta, A. Rebolé, and J. Trevino. 2009. Effect of inulin on
growth performance, intestinal tract sizes, mineral retention and tibial bone
mineralisation in broiler chickens. British poultry science 50: 325-332.
Oviedo-Rondón, E., P. Ferket, and G. Havestein. 2006. Nutritional factors that affect leg
problems in broilers and turkeys. Avian and Poultry Biology Reviews 17: 89-103.
Oviedo-Rondón, E. O. et al. 2009. Incubation conditions affect leg health in large, high-
yield broilers. The Journal of Applied Poultry Research 18: 640-646.
Palacios, C. 2006. The role of nutrients in bone health, from A to Z. Critical reviews in
food science and nutrition 46: 621-628.
Panda, A. K., S. V. R. Rao, M. V. Raju, and S. R. Sharma. 2006. Dietary supplementation
of Lactobacillus sporogenes on performance and serum biochemico-lipid profile of
broiler chickens. The Journal of Poultry Science 43: 235-240.
Pappas, A., T. Acamovic, N. Sparks, P. Surai, and R. McDevitt. 2005. Effects of
supplementing broiler breeder diets with organic selenium and polyunsaturated
fatty acids on egg quality during storage. Poultry Science 84: 865-874.
Pappas, A., T. Acamovic, P. Surai, and R. McDevitt. 2006. Maternal organo-selenium
compounds and polyunsaturated fatty acids affect progeny performance and levels
of selenium and docosahexaenoic acid in the chick tissues. Poultry Science 85:
1610-1620.
Paxton, H., P. G. Tickle, J. W. Rankin, J. R. Codd, and J. R. Hutchinson. 2014. Anatomical
and biomechanical traits of broiler chickens across ontogeny. Part II. Body segment
inertial properties and muscle architecture of the pelvic limb. PeerJ 2: e473.
Pines, M., and S. Hurwitz. 1991. The role of the growth plate in longitudinal bone growth.
Poultry science 70: 1806-1814.
Plavnik, I., and M. L. Scott. 1980. Effects of Additional Vitamins, Minerals, or Brewer’s
Yeast upon Leg Weaknesses in Broiler Chickens. Poultry Science 59: 459-464.
Plum, L. M., L. Rink, and H. Haase. 2010. The essential toxin: impact of zinc on human
health. Int J Environ Res Public Health 7: 1342-1365.
Pompeu, M. et al. 2012. Nutritional aspects related to non-infectious diseases in locomotor
system of broilers. World's Poultry Science Journal 68: 669-678.

184
Poureslami, R., K. Raes, G. M. Turchini, G. Huyghebaert, and S. De Smet. 2010. Effect of
diet, sex and age on fatty acid metabolism in broiler chickens: n-3 and n-6 PUFA.
Br J Nutr 104: 189-197.
Powers, H. J. 2003. Riboflavin (vitamin B-2) and health. The American Journal of Clinical
Nutrition 77: 1352-1360.
Prophet, E. B., B. Mills, J. Arrington, and L. H. Sobin. 1992. Armed forces institute of
pathology. Laboratory methods in histotechnology: 279.
Quarantelli, A. et al. 2007. Effects of different levels of dietary biotin on the performance
and bone structure of broilers. Italian Journal of Animal Science 6: 5-7.
Raisz, L. G., and P. M. Fall. 1990. Biphasic effects of prostaglandin E2 on bone formation
in cultured fetal rat calvariae: interaction with cortisol. Endocrinology 126: 1654-
1659.
Raju, M. V. L. N., and G. Devegowda. 2000. Influence of esterified-glucomannan on
performance and organ morphology, serum biochemistry and haematology in
broilers exposed to individual and combined mycotoxicosis (aflatoxin, ochratoxin
and T-2 toxin). British Poultry Science 41: 640-650.
Randall, C., and C. Mills. 1981. Observations on leg deformity in broilers with particular
reference to the intertarsal joint. Avian Pathology 10: 407-431.
Rath, N., M. Richards, W. Huff, G. Huff, and J. Balog. 2005. Changes in the tibial growth
plates of chickens with thiram-induced dyschondroplasia. Journal of comparative
pathology 133: 41-52.
Rath, N. C., G. R. Huff, W. E. Huff, and J. M. Balog. 2000. Factors Regulating Bone
Maturity and Strength in Poultry. Poultry Science 79: 1024-1032.
Rath, N. C., W. E. Huff, G. R. Huff, and L. Kannan. 2007. Induction of tibial
dyschondroplasia by carbamate and thiocarbamate pesticides. Avian Dis 51: 590-
593.
Rekaya, R., R. L. Sapp, T. Wing, and S. E. Aggrey. 2013. Genetic evaluation for growth,
body composition, feed efficiency, and leg soundness. Poult Sci 92: 923-929.
Rennie, J. S., C. C. Whitehead, and B. H. Thorp. 1993. The effect of dietary 1, 25-
dihydroxycholecalciferol in preventing tibial dyschondroplasia in broilers fed on
diets imbalanced in calcium and phosphorus. British Journal of Nutrition 69: 809-
816.
Richards, M. P. 1997. Trace mineral metabolism in the avian embryo. Poultry Science 76:
152-164.
Robinson, F., N. Robinson, R. Hardin, and J. Wilson. 1995. The effects of 20-week body
weight and feed allocation during early lay on female broiler breeders. Journal of
Applied Poultry Research 4: 203-210.
Romanoff, A. L., and A. J. Romanoff. 1967. Biochemistry of the avian embryo; a
quantitative analysis of prenatal development.
Sahraei, M., H. Janmmohamadi, A. Taghizadeh, A. G. Moghadam, and S. Rafat. 2012.
Estimation of the relative bioavailability of several zinc sources for broilers when
fed a conventional diet. Biotechnology in Animal Husbandry 28: 441-453.
Salim, H., C. Jo, and B. Lee. 2008. Zinc in broiler feeding and nutrition. Avian Biology
Research 1: 5-18.
Samman, S. et al. 2009. Fatty acid composition of certified organic, conventional and
omega-3 eggs. Food Chemistry 116: 911-914.

185
Sandoval, M. et al. 1998. Performance and tissue zinc and metallothionein accumulation
in chicks fed a high dietary level of zinc. Poultry Science 77: 1354-1363.
SAS. 2016. SAS® Software, Version 9.4. Copyright © 2016 by SAS Institute Inc., Cary,
NC, USA.
Scholz-Ahrens, K. E., G. Schaafsma, E. G. van den Heuvel, and J. Schrezenmeir. 2001.
Effects of prebiotics on mineral metabolism. The American journal of clinical
nutrition 73: 459s-464s.
Schreiner, M., H. W. Hulan, E. Razzazi‐Fazeli, J. Böhm, and R. G. Moreira. 2005. Effect
of different sources of dietary omega‐3 fatty acids on general performance and fatty
acid profiles of thigh, breast, liver and portal blood of broilers. Journal of the
Science of Food and Agriculture 85: 219-226.
Selvaraj, R. K., R. Shanmugasundaram, and K. C. Klasing. 2010. Effects of dietary lutein
and PUFA on PPAR and RXR isomer expression in chickens during an
inflammatory response. Comparative Biochemistry and Physiology Part A:
Molecular & Integrative Physiology 157: 198-203.
Seo, H. J., Y. E. Cho, T. Kim, H. I. Shin, and I. S. Kwun. 2010. Zinc may increase bone
formation through stimulating cell proliferation, alkaline phosphatase activity and
collagen synthesis in osteoblastic MC3T3-E1 cells. Nutr Res Pract 4: 356-361.
Shen, C.-L., J. Peterson, O. L. Tatum, and D. M. Dunn. 2008. Effect of long-chain n-3
polyunsaturated fatty acid on inflammation mediators during osteoblastogenesis.
Journal of medicinal food 11: 105-110.
Sherlock, L., T. G. Demmers, A. E. Goodship, I. D. McCarthy, and C. M. Wathes. 2010.
The relationship between physical activity and leg health in the broiler chicken. Br
Poult Sci 51: 22-30.
Shim, M. Y., A. B. Karnuah, N. B. Anthony, G. M. Pesti, and S. E. Aggrey. 2012. The
effects of broiler chicken growth rate on valgus, varus, and tibial dyschondroplasia.
Poult Sci 91: 62-65.
Siegel, P. B., K. Barger, and F. Siewerdt. 2019. Limb Health in Broiler Breeding: History
Using Genetics to Improve Welfare. The Journal of Applied Poultry Research.
Skuladottir, I. H., D. H. Petursdottir, and I. Hardardottir. 2007. The effects of omega-3
polyunsaturated fatty acids on TNF-α and IL-10 secretion by murine peritoneal
cells in vitro. Lipids 42: 699-706.
Solomon, S. 2010. The eggshell: strength, structure and function. British poultry science
51: 52-59.
Speake, B. K., A. M. Murray, and R. C. Noble. 1998. Transport and transformations of
yolk lipids during development of the avian embryo. Prog Lipid Res 37: 1-32.
Stalker, M. J., M. L. Brash, A. Weisz, R. M. Ouckama, and D. Slavic. 2010. Arthritis and
osteomyelitis associated with Enterococcus cecorum infection in broiler and broiler
breeder chickens in Ontario, Canada. Journal of veterinary diagnostic investigation
22: 643-645.
Su, G., P. Sorensen, and S. C. Kestin. 2000. A note on the effects of perches and litter
substrate on leg weakness in broiler chickens. Poult Sci 79: 1259-1263.
Sullivan, T. W. 1994. Skeletal problems in poultry: estimated annual cost and descriptions.
Poultry science 73: 879-882.

186
Summers, J., H. SHEN, S. Leeson, and R. Julian. 1984. Influence of vitamin deficiency
and level of dietary protein on the incidence of leg problems in broiler chicks.
Poultry science 63: 1115-1121.
Sun, Q., Y. Guo, J. Li, T. Zhang, and J. Wen. 2010. Effects of methionine hydroxy analog
chelated Cu/Mn/Zn on laying performance, egg quality, enzyme activity and
mineral retention of laying hens. The Journal of Poultry Science: 1108310128-
1108310128.
Sun, Q. et al. 2012. Dietary mineral sources altered lipid and antioxidant profiles in broiler
breeders and posthatch growth of their offsprings. Biological trace element research
145: 318-324.
Sunde, M., W. Cravens, C. Elvehjem, and J. Halpin. 1950. The effect of folic acid on
embryonic development of the domestic fowl. Poultry Science 29: 696-702.
Sunder, G. S., C. V. Kumar, A. Panda, M. Raju, and S. R. Rao. 2013. Effect of
supplemental organic Zn and Mn on broiler performance, bone measures, tissue
mineral uptake and immune response at 35 days of age. Current research in poultry
science 3: 1-11.
Sunder, G. S. et al. 2008. Effects of Higher Levels of Zinc Supplementation on
Performance, Mineral Availability, and Immune Competence in Broiler Chickens.
The Journal of Applied Poultry Research 17: 79-86.
Tarlton, J. F., L. J. Wilkins, M. J. Toscano, N. C. Avery, and L. Knott. 2013. Reduced bone
breakage and increased bone strength in free range laying hens fed omega-3
polyunsaturated fatty acid supplemented diets. Bone 52: 578-586.
Thornton, P., and D. Brownrigg. 1961. Calcium utilization and skeletal development in
chicks as influenced by parental dietary ascorbic acid. The Journal of nutrition 75:
354-360.
Thorp, B. H. 1994. Skeletal disorders in the fowl: a review. Avian Pathology 23: 203-236.
Torres, C., and D. Korver. 2018. Influences of trace mineral nutrition and maternal flock
age on broiler embryo bone development. Poultry science 97: 2996-3003.
Tortora, G. J., and K. Petti. 2002. Principles of human anatomy. John Wiley & Sons
Triyuwanta, L. C., and Y. Nys. 1992. Dietary phosphorus and food allowance of dwarf
breeders affect reproductive performance of hens and bone development of their
progeny. British poultry science 33: 363-379.
Tullo, E. et al. 2017. Association between environmental predisposing risk factors and leg
disorders in broiler chickens. Journal of animal science 95: 1512-1520.
USDA. 2012. Agricultural Resource Management Survey: Broiler Highlights.
http://www.nass.usda.gov/Surveys/Guide_to_NASS_Surveys/Ag_Resource_Man
agement/ARMS_Broiler_Factsheet/index.asp. Accessed March 20, 2015.
Vallee, B. L., and K. H. Falchuk. 1993. The biochemical basis of zinc physiology. Physiol
Rev 73: 79-118.
Vance, J. E., and D. E. Vance. 1990. Lipoprotein assembly and secretion by hepatocytes.
Annual review of nutrition 10: 337-356.
Vasdal, G., J. Vas, R. C. Newberry, and R. O. Moe. 2019. Effects of environmental
enrichment on activity and lameness in commercial broiler production. Journal of
Applied Animal Welfare Science 22: 197-205.
Ventura, B. A., F. Siewerdt, and I. Estevez. 2010. Effects of barrier perches and density on
broiler leg health, fear, and performance. Poult Sci 89: 1574-1583.
187
Viguet-Carrin, S., P. Garnero, and P. D. Delmas. 2006. The role of collagen in bone
strength. Osteoporos Int 17: 319-336.
Villemure, I., and I. A. Stokes. 2009. Growth plate mechanics and mechanobiology. A
survey of present understanding. Journal of biomechanics 42: 1793-1803.
Waldenstedt, L. 2006. Nutritional factors of importance for optimal leg health in broilers:
A review. Animal Feed Science and Technology 126: 291-307.
Walker, A. 2001. Leg health in broilers [Fact Sheet]. Defra, IGER, ADAS, and
University of Bristol. Leaflet 522, United Kingdom.
http://www.agrowebcee.net/fileadmin/user_upload/faw/doc/reports2/REVIEW_O
N_WELFARE_OF_BROILERS_01.pdf
Walser, M. M., V. C. Morris, and O. A. Levander. 1988. Effect of dietary selenium on the
development of Fusarium-induced tibial dyschondroplasia in broiler chickens.
Avian diseases: 84-88.
Wang, X., G. J. Fosmire, C. V. Gay, and R. M. Leach Jr. 2002. Short-term zinc deficiency
inhibits chondrocyte proliferation and induces cell apoptosis in the epiphyseal
growth plate of young chickens. The Journal of nutrition 132: 665-673.
Watkins, B., C. Whitehead, and S. Duff. 1991. Hydrogenated oil decreases tissue
concentrations of n‐6 polyunsaturated fatty acids and may contribute to
dyschondroplasia in broilers. British poultry science 32: 1109-1119.
Watkins, B. A. 1998. Regulatory effects of polyunsaturates on bone modeling and cartilage
function The Return of w3 Fatty Acids into the Food Supply No. 83. p 38-51.
Karger Publishers.
Watkins, B. A., Y. Li, H. E. Lippman, and S. Feng. 2003. Modulatory effect of omega-3
polyunsaturated fatty acids on osteoblast function and bone metabolism.
Prostaglandins Leukot Essent Fatty Acids 68: 387-398.
Watkins, B. A., Y. Li, H. E. Lippman, and M. F. Seifert. 2001a. Omega-3 Polyunsaturated
Fatty Acids and Skeletal Health. Experimental Biology and Medicine 226: 485-
497.
Watkins, B. A., Y. Li, and M. F. Seifert. 2001b. Lipids as modulators of bone remodelling.
Current Opinion in Clinical Nutrition & Metabolic Care 4: 105-110.
Watkins, B. A., Y. Li, and M. F. Seifert. 2001c. Nutraceutical fatty acids as biochemical
and molecular modulators of skeletal biology. Journal of the American College of
Nutrition 20: 410S-416S.
Watkins, B. A., H. E. Lippman, L. Le Bouteiller, Y. Li, and M. F. Seifert. 2001d. Bioactive
fatty acids: role in bone biology and bone cell function. Prog Lipid Res 40: 125-
148.
Watkins, B. A., M. F. Seifert, and K. G. Allen. 1997a. Importance of dietary fat in
modulating PGE2 responses and influence of vitamin E on bone morphometry.
World review of nutrition and dietetics 82: 250-259.
Watkins, B. A. et al. 1997b. Dietary lipids modulate bone prostaglandin E2 production,
insulin-like growth factor-I concentration and formation rate in chicks. The Journal
of nutrition 127: 1084-1091.
Watkins, B. A., C. L. Shen, K. G. Allen, and M. F. Seifert. 1996a. Dietary (n‐3) and (n‐6)
polyunsaturates and acetylsalicylic acid alter ex vivo PGE2 biosynthesis, tissue
IGF‐I levels, and bone morphometry in chicks. Journal of Bone and Mineral
Research 11: 1321-1332.

188
Watkins, B. A., H. Xu, and J. J. Turek. 1996b. Linoleate impairs collagen synthesis in
primary cultures of avian chondrocytes. Proceedings of the Society for
Experimental Biology and Medicine 212: 153-159.
White, H. B. 1987. Vitamin-binding proteins in the nutrition of the avian embryo. J Exp
Zool Suppl 1: 53-63.
Whitehead, C. C., H. A. McCormack, L. McTeir, and R. H. Fleming. 2004. High vitamin
D3 requirements in broilers for bone quality and prevention of tibial
dyschondroplasia and interactions with dietary calcium, available phosphorus and
vitamin A. Br Poult Sci 45: 425-436.
Wideman, R. et al. 2015. Prophylactic administration of a combined prebiotic and
probiotic, or therapeutic administration of enrofloxacin, to reduce the incidence of
bacterial chondronecrosis with osteomyelitis in broilers. Poultry science 94: 25-36.
Wideman, R. et al. 2012. A wire-flooring model for inducing lameness in broilers:
evaluation of probiotics as a prophylactic treatment. Poultry science 91: 870-883.
Wideman, R. F., Jr. 2016. Bacterial chondronecrosis with osteomyelitis and lameness in
broilers: a review. Poult Sci 95: 325-344.
Wideman, R. F., Jr., and I. Pevzner. 2012. Dexamethasone triggers lameness associated
with necrosis of the proximal tibial head and proximal femoral head in broilers.
Poult Sci 91: 2464-2474.
Wideman, R. F., and R. D. Prisby. 2013. Bone circulatory disturbances in the development
of spontaneous bacterial chondronecrosis with osteomyelitis: a translational model
for the pathogenesis of femoral head necrosis. Front Endocrinol (Lausanne) 3: 183.
Wijesurendra, D. S. et al. 2017. Pathological and microbiological investigations into cases
of bacterial chondronecrosis and osteomyelitis in broiler poultry. Avian Pathol 46:
683-694.
Wilson, H., E. Miller, R. Harms, and B. Damron. 1980. Hatchability of chicken eggs as
affected by dietary phosphorus and calcium. Poultry Science 59: 1284-1289.
Woyengo, T., and C. Nyachoti. 2011. Supplementation of phytase and carbohydrases to
diets for poultry. Canadian Journal of Animal Science 91: 177-192.
Wu, W., M. E. Cook, Q. Chu, and E. B. Smalley. 1993. Tibial dyschondroplasia of chickens
induced by fusarochromanone, a mycotoxin. Avian Diseases: 302-309.
Wuthier, R. E. 1975. Lipid composition of isolated epiphyseal cartilage cells, membranes
and matrix vesicles. Biochimica et Biophysica Acta (BBA)-Lipids and Lipid
Metabolism 409: 128-143.
Xu, H., A. Watkins, and H. D. Adkisson. 1994. Dietary lipids modify the fatty acid
composition of cartilage, isolated chondrocytes and matrix vesicles. Lipids 29: 619-
625.
Xu, H., B. Watkins, and M. Seifert. 1995. Vitamin E stimulates trabecular bone formation
and alters epiphyseal cartilage morphometry. Calcified Tissue International 57:
293-300.
Yair, R., A. Cahaner, Z. Uni, and R. Shahar. 2017. Maternal and genetic effects on broiler
bone properties during incubation period. Poultry science 96: 2301-2311.
Yair, R., R. Shahar, and Z. Uni. 2013. Prenatal nutritional manipulation by in ovo
enrichment influences bone structure, composition, and mechanical properties.
Journal of animal science 91: 2784-2793.

189
Yair, R., R. Shahar, and Z. Uni. 2015. In ovo feeding with minerals and vitamin D3
improves bone properties in hatchlings and mature broilers. Poultry science 94:
2695-2707.
Yair, R., and Z. Uni. 2011. Content and uptake of minerals in the yolk of broiler embryos
during incubation and effect of nutrient enrichment. Poultry science 90: 1523-1531.
Yair, R., Z. Uni, and R. Shahar. 2012. Bone characteristics of late-term embryonic and
hatchling broilers: Bone development under extreme growth rate. Poultry science
91: 2614-2620.
Yalcin, S., H. B. Molayoglu, M. Baka, O. Genin, and M. Pines. 2007. Effect of temperature
during the incubation period on tibial growth plate chondrocyte differentiation and
the incidence of tibial dyschondroplasia. Poult Sci 86: 1772-1783.
Yamaguchi, M. 1998. Role of zinc in bone formation and bone resorption. The Journal of
Trace Elements in Experimental Medicine: The Official Publication of the
International Society for Trace Element Research in Humans 11: 119-135.
Yamaguchi, M., A. Igarashi, and S. Uchiyama. 2004. Bioavailability of zinc yeast in rats:
stimulatory effect on bone calcification in vivo. Journal of health science 50: 75-
81.
Yamaguchi, M., K. Inamoto, and Y. Suketa. 1986. Effect of essential trace metals on bone
metabolism in weanling rats: comparison with zinc and other metals' actions.
Research in experimental medicine 186: 337-342.
Yamaguchi, M., and K. Takahashi. 1984. Role of zinc as an activator of bone metabolism
in weanling rats. Japanese journal of bone and mineral metabolism 2: 186-191.
Yamaguchi, M., and R. Yamaguchi. 1986. Action of zinc on bone metabolism in rats:
increases in alkaline phosphatase activity and DNA content. Biochemical
pharmacology 35: 773-777.
Yilmaz-Dikmen, B., and U. Sahan. 2009. The relationship among age, yolk fatty acids
content, and incubation results of broiler breeders. Poultry science 88: 185-190.
Zeisel, S. H., and K.-A. Da Costa. 2009. Choline: an essential nutrient for public health.
Nutrition reviews 67: 615-623.
Zeng, H., J. J. Cao, and G. F. Combs. 2013. Selenium in bone health: roles in antioxidant
protection and cell proliferation. Nutrients 5: 97-110.
Zhang, C., D. Li, F. Wang, and T. Dong. 2003. Effects of dietary vitamin K levels on bone
quality in broilers. Archives of Animal Nutrition 57: 197-206.
Zhang, H. et al. 2018a. Effect of tetramethyl thiuram disulfide (thiram) in relation to tibial
dyschondroplasia in chickens. Environmental science and pollution research
international 25: 28264-28274.
Zhang, H. et al. 2018b. Icariin ameliorate thiram-induced tibial dyschondroplasia via
regulation of WNT4 and VEGF expression in broiler chickens. Frontiers in
pharmacology 9: 123.
Zhang, W. et al. 2012. Effects of insulin and insulin-like growth factor 1 on osteoblast
proliferation and differentiation: differential signalling via Akt and ERK. Cell
biochemistry and function 30: 297-302.
Ziaie, H. et al. 2011. Effect of antibiotic and its alternatives on morphometric
characteristics, mineral content and bone strength of tibia in Ross broiler chickens.
Global Veterinaria 7: 315-322.

190
Zuidhof, M. J., B. L. Schneider, V. L. Carney, D. R. Korver, and F. E. Robinson. 2014.
Growth, efficiency, and yield of commercial broilers from 1957, 1978, and 2005.
Poult Sci 93: 2970-2982.

191
VITA
Marquisha Paul attended Kentucky State University from 2002-2006 where she
was received a bachelor’s degree in Biology and an associate’s degree in Liberal Studies.
In 2007, she joined Alltech, Inc. as a research technician where she has co-authored several
peer reviewed journal articles. In 2011, she was awarded Histotechnologist of the Year by
the Kentucky Society for Histotechnology. In 2012, Marquisha enrolled in the University
of Kentucky to pursue higher education in Animal and Food Sciences. As a master’s
student she received the Southern Poultry Science Society Outstanding Research Poster
Presentation Award for her research in broiler nutrition at the International Poultry
Scientific Forum in Atlanta, Georgia. In 2015, Marquisha received her master’s degree in
Animal and Food Sciences. She continued in the Animal and Food Sciences program at
the University of Kentucky as a doctoral student. As a doctoral student, Marquisha has
received Southern Poultry Science Society’s Outstanding Research Poster Presentation and
Graduate Student Travel awards for her research in broiler breeder nutrition.