micro-irrigation design for avocado orchard in california
TRANSCRIPT

MICRO-IRRIGATION DESIGN FOR AVOCADO ORCHARD IN CALIFORNIA
by
Michael Meyer
Agricultural Systems Management
BioResource and Agricultural Engineering Department
California Polytechnic State University
San Luis Obispo, CA
2014

ii
TITLE : Micro-Irrigation Design for Avocado Orchard in California
AUTHOR : Michael Meyer
DATE SUBMITTED : May 30, 2014
Franklin P. Gaudi _________________________
Senior Project Advisor Signature
_________________________
Date
Dr. Art MacCarley _________________________
Department Head Signature
_________________________
Date

iii
ACKNOWLEDGEMENTS
First, I would like to express my appreciation to the grower, Craig Underwood, for
providing me with the project parameters, necessary information and great patience as I
completed this report.
Second, I would like to thank my advisor, Franklin P. Gaudi, who offered extensive
guidance and practical advice throughout the lengthy process of this design and report.
Third, I am particularly grateful for the assistance and product information given by
Brian Meyer and Coast Water Solutions out of Oxnard, California.
Fourth, I would like to thank the following groups and companies for their assistance
with the collection of my data:
Mission Produce, Inc.
Netafim Irrigation, Inc.
California Avocado Commission
California Irrigation Management Information System
Cal Poly Irrigation Training and Research Center
Fifth and most importantly, I would like to express my full gratitude to my parents for
believing in me while providing courage and support through my educational career.

iv
ABSTRACT
This project encompasses the design and recommendations for a micro-irrigation system
on an avocado orchard owned by Underwood Family Farms in Somis, California. The
main objective of this report is to improve the existing irrigation system’s efficiency and
uniformity with the new design and recommendations. The analysis includes information
about good irrigation practices, irrigation system design and all the processes herein.
Although there are many opinions on growing, irrigating and maintaining an avocado
orchard, all of the methods, procedures and suggestions must be based on accurate data to
provide reliable information to the grower. Evaluating the irrigation system and
suggesting improvements will require proper steps and full understanding of irrigation
systems, avocados, and soil and water requirements. This report will provide essential
information for successfully growing avocados in Ventura County, as well as detailed
advice for micro-irrigation systems on avocados.

v
DISCLAIMER STATEMENT
The university makes it clear that the information forwarded herewith is a project
resulting from a class assignment and has been graded and accepted only as a fulfillment
of a course requirement. Acceptance by the university does not imply technical accuracy
or reliability. Any use of the information in this report is made by the user(s) at his/her
own risk, which may include catastrophic failure of the device or infringement of patent
or copyright laws.
Therefore, the recipient and/or user of the information contained in this report agrees to
indemnify, defend and save harmless the Sate, its officers, agents, and employees from
any and all claims and losses accruing or resulting to any person, firm, or corporation
who may be injured or damaged as a result of the use of this report.

vi
TABLE OF CONTENTS
Page
SIGNATURE PAGE .......................................................................................................... ii
ACKNOWLEDGEMENTS ............................................................................................... iii
ABSTRACT ....................................................................................................................... iv
DISCLAIMER STATEMENT ............................................................................................v
LIST OF FIGURES ......................................................................................................... viii
LIST OF TABLES ............................................................................................................. ix
INTRODUCTION ...............................................................................................................1
Background ......................................................................................................................1
Justification ......................................................................................................................1
Objectives .........................................................................................................................2
LITERATURE REVIEW ....................................................................................................3
Avocado Varieties ............................................................................................................3
Hass ..............................................................................................................................3
Fuerte ............................................................................................................................3
Reed ..............................................................................................................................3
Irrigation ...........................................................................................................................3
Common Irrigation Systems for Avocados ..................................................................4
Micro-Sprinklers...........................................................................................................5
Types of Micro-Sprinklers ...........................................................................................6
Soil ...................................................................................................................................8
Soil Requirements ........................................................................................................8
Soil Salinity ..................................................................................................................9
Salinity’s Effects on Avocado Trees ............................................................................9
Salinity Management ....................................................................................................9
Water’s Effects on Soil Salinity ...................................................................................9
Managing Avocado Trees ..............................................................................................10
Managing Avocado Fruit Drop ..................................................................................10
Fertilizers ....................................................................................................................10
Irrigation System Management ......................................................................................11
Irrigating Avocado Trees ............................................................................................11
When to Irrigate ..........................................................................................................11
Determining How Much Water to Use .......................................................................11
Managing Irrigation ....................................................................................................12
Benefits of Irrigation ..................................................................................................12
PROCEDURES AND METHODS....................................................................................14
Existing Conditions ........................................................................................................14
Field Constraints .........................................................................................................14
Canopy Cover .............................................................................................................14
Water Source and Fertigation .....................................................................................15
Filtration .....................................................................................................................16
System Inspection .......................................................................................................16
Pipelines .....................................................................................................................17
Risers ..........................................................................................................................18

vii
Pressure Regulators ....................................................................................................18
Lateral Hoses and Emission Devices .........................................................................18
Energy and Water Use ................................................................................................20
Irrigation System Design ................................................................................................20
Flow Rate Requirements ............................................................................................20
Wetted Area ................................................................................................................21
Micro-Sprinkler Selection ..........................................................................................21
Flow Rate by Tree Spacing ........................................................................................22
Summary of Selected Equipment ...............................................................................23
AutoCAD Design ...........................................................................................................23
Design Process............................................................................................................24
Lateral Hose Locations ...............................................................................................25
Critical Path ................................................................................................................25
Pipe Characteristics ....................................................................................................26
Hose Lengths ..............................................................................................................26
RESULTS ..........................................................................................................................27
Peak Evapotranspiration .................................................................................................27
Required System Flow Rate ...........................................................................................27
Irrigation Schedule .........................................................................................................27
Selected Micro-Sprinklers ..............................................................................................27
Total System Flow Rate .................................................................................................27
Required Inlet Pressure ..................................................................................................27
Size and Length of Hose ................................................................................................28
Cost Analysis ..................................................................................................................28
DISCUSSION ....................................................................................................................30
Existing Equipment and Constraints ..............................................................................30
Design Considerations and Limitations .........................................................................30
RECOMMENDATIONS ...................................................................................................32
Management ...................................................................................................................32
Equipment ......................................................................................................................32
REFERENCES ..................................................................................................................34
APPENDICES ...................................................................................................................37
Appendix A: Senior Project Contract .............................................................................38
Appendix B: Example Design Calculations ...................................................................41
Appendix C: Pump Information .....................................................................................43
Appendix D: Canopy Cover ...........................................................................................46
Appendix E: Manifold Flows and Critical Path Data ....................................................50
Appendix F: Irrigation System Design Drawings ..........................................................55

viii
LIST OF FIGURES
Page
1. Netafim Micro-Sprinkler in Orchard………………………………………….…..2
2. Example of micro-sprinkler.………………………………………………….…...5
3. Micro-Sprinkler spray patterns.……………………………………………….…..6
4. Example of Netafim (SR, SRD) micro-sprinkler.………………………………...7
5. Example of Netafim (LR, LRD) micro-sprinkler.…………………………….…..7
6. Example of Netafim jet micro-sprinkler……………………………………….….8
7. Berkeley centrifugal booster pump………………………………………………16
8. Hydrokleen tubescreen filter……………………………………………………..16
9. Pressure reading downstream of filter…………………………………………...17
10. Example of a 2 GPH drip emitter………………………………………………..19
11. Example of micro-sprinkler in orchard…………………………………………..19
12. Aerial view of Underwood avocado orchard…………………………………….23
13. Figure eight clamping hose end………………………………………………….24

ix
LIST OF TABLES
Page
1. Net GPH per tree and net total GPM ……………………………………………20
2. Gross GPH per tree required and total GPM required…………………………...21
3. Minimum sprinkler diameter required…………………………………………...21
4. Netafim supernet sprinkler characteristics……………………………………….22
5. Total GPM applied and flow/area………………………………………………..22
6. Sprinkler characteristics for each spacing………………………………………..23
7. Pipe characteristics……………………………………………………………….26
8. Hose lengths for different spacings………………………………………………26
9. Bill of materials…………………………………………………………………..29

1
INTRODUCTION
Background
The farming industry in California has been growing at unpredictable measures, which is
essential in supporting the ever-increasing population. Many agricultural companies are
centralized in California because of its’ compatible weather for certain crops that gives
farmers the opportunity to achieve an efficient yield and productivity. Farming
companies strive to find the most efficient ways to grow their crop in order to generate
the most profit and produce the highest yield. All farms try to save as much water as
possible, have the best irrigation efficiency and generate the most income as possible.
The goal is to provide recommendations and design a micro-irrigation system for
avocados that will achieve all of these feats.
The avocado, more formally represented as “Persea Americana”, is one of the most
delicious and nutritious fruits native to Mexico and Central America. As avocado
consumption continues to expand throughout the United States as well as internationally,
growers are looking for new ways to increase yields and decrease costs. According to
Mission Produce, “California has over 61,000 acres of avocados, which account for about
95% of the U.S. crop” (Shopping the World, 2013). California grown avocados are
preferred because of their high quality, year-round growth as a result of coastal
microclimates, excellent soil characteristics, and proper maintenance. “Santa Barbara,
San Luis Obispo and Ventura Counties have combined to produce over 275 million
pounds of avocados per year” (Mission Avocados, 2013). There are about 6,000 avocado
growers from San Luis Obispo to the Mexican border producing a combination of over
300 million pounds a year. Despite these high production rates, California alone cannot
provide the market with a consistent supply of quality fruit year-round. Fortunately, crop
seasons are different in certain areas of the world, so there is adequate overlap of
availability throughout the year.
Justification
One of the most important contemporary issues today is how to increase production while
decreasing water use and costs. In order for agriculture to continue to feed the world,
growers must learn to make existing water supplies stretch as far as possible. More and
more growers are switching to micro-irrigation for their tree and row crops because of the
potential to increase efficiencies and save water. Micro-irrigation can save water and
fertilizer by applying less water exactly where it is needed. In order to maximize yield
and profits, growers must perform excellent irrigation practices as well as consistent
maintenance of their micro-irrigation system. Some of these practices include proper
irrigation design, spacing, sprinkler type, scheduling, fertigation and chemigation. Micro-
irrigation with micro-sprinklers is a very common method for irrigating tree crops in
California and will be explained in depth throughout this report. Figure 1 on the
following page is an image of a Netafim Micro-Sprinkler in an avocado orchard.

2
Figure 1: Netafim Micro-Sprinkler in Orchard.
Objectives
The objective of this project was to design and recommend an irrigation system that
would enable the grower to improve the distribution uniformity in the orchard with given
constraints. The grower did not want to spend the time and money to change any of the
underground piping system currently in use, nor did he want to change the filter, pump
and irrigation method. The factors that could be changed to improve the uniformity
include the hoses, micro-sprinklers, pressure regulators, location of hose cuts and the
irrigation schedule. It is important to apply enough water to satisfy the needs of the soil,
trees and evapotranspiration rates during the hottest time of the year. These project
parameters and requirements will be discussed throughout the rest of the report.

3
LITERATURE REVIEW
Avocado Varieties
Although there are almost 500 different varieties of avocados in the world, only 7 are
commercially grown in California (Avocado Varieties, 2014). Among these seven most
common varieties are Bacon, Fuerte, Gwen, Hass, Pinkerton, Reed and Zutano. Growers
today are constantly trying to find the ideal variety with the most uniform size and
appearance, longest shelf life, greatest tolerance to weather changes and widest
availability year-round. The avocado that has best fit these characteristics is the Hass, and
it accounts for 95% of the total crop in California. The ideal growing conditions along the
California coast provide good soil with proper drainage, abundant sunshine and cool
ocean breezes that allow avocados to flourish in these regions. The three most common
varieties are Hass, Fuerte and Reed, and their descriptions are below.
Hass. Hass avocados are the most commonly grown throughout the world with an
excellent shelf life and year-round availability in California. Some of their characteristics
include a small to medium sized seed, easy peeling when ripe, skin darkens as it ripens,
and great taste. These oval-shaped, average to large sized fruit generally weigh anywhere
from 5 to 12 ounces. The most common tree spacing for Hass is 20’ x 15’ with an
average of 135 trees per acre. The Hass season typically runs from January to October
with the best eating quality during the latter months (Avocado Varieties, 2013).
Fuerte. Fuerte avocados are the established favorite because of their high quality and
excellent flavor. The Fuerte is native to Mexico and is one of the only varieties capable of
surviving freezing temperatures. Some of their characteristics include smooth green skin,
medium sized seed, easy peeling and great taste. These pear-shaped avocados typically
weigh anywhere from 5 to 14 ounces but are not commonly marketed in California retail
stores. The most common tree spacing for Fuerte is 20’ x 20’ with an average of 100 trees
per acre. The Fuerte season typically runs from late fall through spring and the skin stays
green throughout the season (Avocado Varieties, 2013).
Reed. Reed avocados are large, round fruit known for their softball shape and excellent
taste during their prime. Some of their characteristics include round, medium sized seed,
easy peeling and good taste. This summertime variety can often serve as a meal
replacement because of its ability to grow anywhere from 8 to 18 ounces. Unfortunately,
they are rarely available and exclusively available in Southern California. The most
common tree spacing for Reed is 15’ x 15’ with an average of 150 trees per acre. The
Reed season is a little shorter running from summer to late fall and the skin darkens as it
ripens throughout the season (Avocado Varieties, 2013).
Irrigation
The implementation of new and improved irrigation systems has enabled farmers
worldwide to save water, decrease costs and increase crop production. The purpose of
irrigation is to supply dry land with water by means of ditches, pipes or streams.

4
Irrigation systems are used to assist in the growing of agricultural crops, maintenance of
landscapes, and leaching of soils in dry areas and during periods of inadequate rainfall.
Some of the most important required components in an irrigation system include a water
source, a drainage system and correctly sized piping, hose, pumps, valves, fittings and
filters. The common water sources include canals, reservoirs and groundwater wells. The
invention of irrigation controllers allowed farmers to control pumps, valves and
scheduling from any hand-held device or computer. The implementation of a backflow
device prevents dirty water from flowing back to the source through the mainline. Using
correctly sized commercial grade materials can eliminate or reduce the need to replace
and repair parts.
The goal with every type of irrigation system is to have high distribution uniformity and
application efficiency. When these goals are met, the plants will receive the same amount
of water, fertilizer and chemicals that are needed for plant growth. A high uniformity
indicates that water is evenly applied throughout the system, while a low uniformity
could be either too much or too little water in different areas of the orchard. The
application efficiency is a percentage of the ratio of the average depth of water infiltrated
to the average depth of water applied. “The water requirement for a crop is directly
related to the water lost through evapotranspiration (ET). Evapotranspiration for a crop
depends on solar radiation, humidity, temperature, wind and stage of growth” (Burt,
2013). Knowing the ET and the soil infiltration rates can help growers increase the
uniformity and efficiency of the system. Evapotranspiration refers to the amount of water
used by the crop plus the amount of water evaporated from the surface of the soil.
In California, the supply of water is very limited and that is why costs are high and
farmers are desperate for sustainable innovations. Irrigation costs will continue to rise
because of the competition for water, products and labor required to operate and monitor
micro-irrigation systems. When not using their own wells, growers are often allotted a
certain amount of water pressure and volume, which forces them to divide their ranch
into blocks and irrigate them on a schedule, one set at a time. Timing and scheduling is
very important because each set will replace the soil moisture that has been used by the
crop or has evaporated from the soil. According to (Olsen, 2013), “one irrigation set is the
largest area that can be irrigated with the available water pressure and volume”. There are
many factors for growers to consider when determining the size of a block and the
duration of a set. The type of irrigation system influences the scheduling and sizes of
blocks. Typical irrigation methods that allow for larger sets and various pressures and
flows include drip irrigation and micro-sprinklers.
Common Irrigation Systems for Avocados. Micro-irrigation systems have the
capability of distributing water where it is needed at low pressures and low flows. The
two common micro-irrigation systems used on avocados in California are drip and micro-
sprinklers. Drip is not as common with avocados but sets can be much larger because of
the slower application rate (Smith, 2014). Micro-sprinklers are excellent for avocado
trees because their low application rate and 10’ to 15’ wetting diameter on the surface of
the soil.

5
Drip irrigation is an excellent method for saving water as it allows water to slowly drip
out of the emitters either onto the soil surface or directly in the root zone. Individual
hoses called laterals run down the rows with low-pressure emitters near the bases of each
tree applying anywhere from ½ to 2 gallons of water per hour. To accommodate for larger
trees, growers sometimes run two hoses down the row, one on each side of the tree.
According to Koch, “as the tree grows, additional emitters will be added to the surface
hose until 6-8 emitters feed water to each tree” (2013). Although fertilizers and chemicals
can be injected right into the drip system, it is necessary to have a reliable filtration
system that filters out all the particles that could potentially clog the drip emitters.
Micro-Sprinklers. Micro-sprinklers can also be used to efficiently distribute water and
fertilizer to the soil surface and base of the trees. Micro-sprinklers can have high
application efficiency, allowing farmers to save water and only apply water to the plant’s
root zone. Similar to drip irrigation, lateral hoses run down each row with micro-
sprinklers branching off from an attached spaghetti hose. Although the lateral hoses can
be buried in the root zone, it is ideal to keep them on the surface for ease of repair and
maintenance. Each sprinkler is generally located equidistant between two trees and is
sufficient to supply enough water to one side of both trees. When properly spaced, micro-
sprinklers can give a very uniform application of water over the irrigated area. There are
many types of sprinklers with different orifice sizes that can be used depending on the
pattern, flows, pressures and tree spacing. Growers often start with the smaller sprinklers
while the trees are young and then swap them out for larger ones in order to keep the
irrigated area on pace with the growth of the root system. An example of a Netafim
micro-sprinkler is shown in Figure 1 below, and some of their most common micro-
sprinklers are discussed in depth below.
Figure 2: Example of micro-sprinkler.
Micro-sprinklers are classified in low volume irrigation systems that can have high
application efficiency, allowing growers to save water by only applying it to the root
zone. Applying water at a lower rate than the infiltration rate allows growers to correlate
the amount of water infiltrated with the application rate. Every once in a while, growers

6
will irrigate with a much larger set in order to leach salts from the soil. Micro-sprinklers
allow growers to irrigate any farmable topography with a small, continuous, steady
supply of water. One of the only downsides of micro-sprinklers is that the labor in
operation and maintenance does require some skill. These systems require regular
maintenance to reduce clogging, including frequent flushing of pipelines and lateral
hoses, and addition of chemicals to kill bacteria and other biological growth (Burt, 2013).
The filters and sprinklers also need regular maintenance to ensure that they operate as
designed.
Types of Micro-Sprinklers. There are a few different types of micro-sprinklers, all of
which are most suitable for orchard crops such as lemons, oranges and avocados. Micro-
sprinkler systems use small plastic sprinklers or jets that spray water over the soil surface,
creating a wetted area 12 feet or more in diameter (Burt, 2013). As opposed to drip,
micro-sprinklers have larger passages that help resist clogging. These sprinklers apply
water to the soil surface by a small spray or mist at a discharge rate anywhere from 4 to
20 gallons per hour. The simple and replaceable plastic materials are resistant to all
agrochemicals and weather. The unique design ensures even water quantities per tree,
good distribution uniformity and wetting diameter assuming inlet pressure is within
range. There are many different makes and models of micro-sprinklers but almost all of
them are available as pressure compensated or non-pressure compensated with a variety
of coverage radii and spray patterns. The most common micro-sprinkler spray patterns
can be viewed in Figure 2 below.
Figure 3. Netafim Micro-Sprinkler spray patterns.
The main ways to differentiate between micro-sprinklers is whether they are short range,
long range, pressure compensated or non-pressure compensated. A few of the most
common micro-sprinklers exclusively designed for orchards and tree crops are shown
below.
Short Radius (SR, SRD). These micro-sprinklers were designed for irrigation of tree
plantations and orchards requiring efficient distribution. The SR means that it has a
revolving rotor irrigating a medium sized area. The SRD means that it has a stream
deflector, which creates a smaller spray area and is used during the initial growing period.
Once the root system spreads out, the deflector can be broken off in order to generate a
larger wetting area. The micro-emitter comes in 10 sizes emitting flows from 7 to 80
gallons per hour. A short radius micro-sprinkler made by Netafim is shown in Figure 3

7
below (Micro-Sprinklers, 2014).
Figure 4: Example of Netafim (SR, SRD) micro-sprinkler.
Long Radius (LR, LRD). These micro-sprinklers were designed for irrigation of tree
plantations with large root volumes. The LR means revolving rotor irrigating a large area
and the LRD means it has the similar stream deflector but for a larger area. The emitter
also comes in 10 different sizes emitting flows from 7 to 80 gallons per hour. An example
of a long radius micro-sprinkler made by Netafim is shown in Figure 4 below (Micro-
Sprinklers, 2014).
Figure 5: Example of Netafim (LR, LRD) micro-sprinkler.
Jet Micro-Sprinkler. These micro-sprinklers were designed for tree plantations and
orchards irrigating with harsh water containing large amounts of sand. It is designed with
a special upper bearing that keeps the rotor from spinning. Unlike normal swivels, the
static emitter helps prevent wear from sand and other particles in the water. The emitter
comes in five sizes emitting flows from 10 to 30 gallons per hour. An example of a jet
micro-sprinkler made by Netafim is shown in Figure 5 below (Micro-Sprinklers, 2014).

8
Figure 6: Example of Netafim jet micro-sprinkler.
Pressure Compensated. These micro-sprinklers will deliver a wide regulating range with
a high distribution uniformity and large water passage. They are available in all four
spray patterns as well as long and short range swivel spray options. The pressure
compensation feature will help the sprinkler deliver a precise amount of water regardless
of the changes in pressure due to long rows or elevation changes (Micro-Sprinklers,
2014). They are ideal for orchards, vineyards and nursery installations where flow
regulation is desired.
Non-Pressure Compensated. These micro-sprinklers offer the maximum diameter of
coverage along with a high distribution uniformity. They are cheaper than pressure
compensated micro-sprinklers and are ideal for orchards with minimal elevation changes.
Non-pressure compensated sprinklers should not be installed in orchards that contain
large elevation changes and pressure variations.
Soil
Soil is one of the most, if not the most important factor in any crop’s growth and
productivity. Avocados can grow in any soil that has low salinity and drains well, but they
grow the best in the West coast’s sandy loam soil. They will only survive in soils with
good drainage and are tolerant of acidic or alkaline soils, but only to a certain point. Once
the pH and the fertility of the soil is determined, fertilizers can be added to replenish the
soil with needed nutrients such as nitrogen, phosphorous, potassium, iron, zinc and
calcium.
Soil Requirements. In order to achieve healthy growth and fruit size, avocado trees must
have good soil drainage and sufficient available soil nutrients. Avocado trees thrive in
well-aerated and loose soil such as limestone, sandy loam and decomposed granite. If the
soil does not drain well, the trees can be planted on raised mounds to increase drainage
and control root rot. Proper drainage and consistent irrigation is necessary to leach excess
salts and avoid cool and damp winter soils. “Although avocados can tolerate both acidic
and alkaline soils, the best pH range is between 5.5 and 6.5” (Rodriquez, 2013). In order
to maintain a healthy pH range, provide the shallow root system with as much sunlight as
possible while periodically amending the soil with lime and sulfur.

9
Soil Salinity. Understanding soil salinity is a key concept to successful avocado grove
management because high soil salinity negatively affects overall yield. Soil salinity is the
amount of salt content in the soil and is caused by processes such as mineral weathering
and irrigation. Avocados tend to be sensitive to high soil salinity, which is unfortunate
because salts occur in all soil and irrigation water. Soil salinity is measured in
decisiemens per meter (dS/m) as the salt concentration in a soil solution with the use of
electrical conductivity (EC). For further understanding and depending on the density of
the water, 1 dS/m is equal to 640 parts per million (Measuring Units, 2013). A soil
salinity with EC < 1.3 dS/m is best for avocado tree productivity (Burt, 2013). Once the
soil EC threshold is exceeded, the yield percentage begins to decrease rapidly.
For every unit increase in salinity beyond the threshold, the yield will decrease 21% per
dS/m (Burt, 2013). Soil salinity can occur from a variety of causes including evaporation
of water leaving salts behind, use of chloride-based fertilizers, application of mulches and
manures and water logging. Water logging occurs when excess water seeps down, raises
the water table and moves more salt to the surface. When avocado trees utilize water they
do not utilize the salt in the water, thus leaving salt behind to accumulate within the soil.
This means it is very important to irrigate enough to keep the EC below 1.3 dS/m.
Salinity’s Effects on Avocado Trees. High soil salinity makes it more difficult for the
tree to absorb moisture. This issue can lead to tip burn, improper photosynthesis and poor
root growth. Avocados like fast draining organic soil because too much salt in the soil
reduces avocado yield and effects tree size.
Salinity Management. Irrigation, leaching and drainage are critical to salinity
management. First, it is important to understand the physical and chemical properties of
the soil in order to manage the salinity and water application. The top six inches of the
soil are the most important to manage because of the shallow root system. Growers use
soil tensiometers to consistently measure the soil moisture and salt content at desired
depths. It is best to use low-salinity irrigation water and when necessary, apply gypsum to
help lower the salt content, decrease water logging and improve soil structure. Long
irrigation cycles every so often will enable salts to be leached effectively. If subject to
winter rains, follow up with an irrigation set in order to dilute and leach salts down into
the root zone.
Water’s Effects on Soil Salinity. While irrigation water can add large amounts of salt to
soil, it can also be used to remove salt from the soil through leaching. Leaching is a
process occurring after an irrigation set that provides enough water to leach the soil and
drain away the excess salt (Burt, 2013). Appropriate leaching amounts depend on
irrigation water salinity and target root-zone salinity. It is crucial to know the salt content
in the irrigation water. If there is sufficient rainfall, a certain amount of salts will naturally
leach from the soil. During dry conditions, the soil dries out faster resulting in salt
accumulation in the soil and the need for it to be leached out. Irrigation sets should be
slow and deep when leaching salts and avoiding salt burn.

10
Monitoring soil moisture in avocado groves is very important because growers need to
know when and how much to irrigate. Given the increasing costs of water and the need to
properly manage irrigation, adjusting the frequency and volume applied is essential.
“Avocado trees are heavy users of water, but they have a shallow feeder root system
located primarily in the top six inches of soil that are prone to drying out” (New Growers,
2014). The feeder roots also have very few root hairs, thus making them inefficient at
absorbing water. Hillside groves with decomposed granite drain well, but they drain
rather quickly. Groves with high clay content can suffer from poor drainage that leads to
root rot. Growers need to closely monitor the soil moisture levels in order to prevent
over- and under-irrigation.
Managing Avocado Trees
Cultural management of avocado groves is necessary throughout the year because
avocado trees are tropical rainforest trees that are active year-round. While winter is a
good time to assess the most recent avocado production, growers should utilize the
autumnal months to prepare avocado groves for winter weather events (Preparing
California Avocado Groves for Winter, 2014). Some techniques used for managing
avocados include pruning, fertilization and freeze protection. After the winter rains, it is
important to flush out accumulated salts and apply pruning techniques and fertilization in
order to achieve optimal spring performance. Fruit size can be affected by lack of water, a
cold winter, a cool spring and improper management techniques. In areas with more
drastic climate changes, proper frost protection measures must be taken in order to
protect the trees and prevent a decrease in productivity. The many methods recommended
for efficient management of avocado groves will be discussed below.
Managing Avocado Fruit Drop. Unfortunately, avocado fruit drop does happen and can
be very frustrating for growers. On the other hand, fruit drop is normal reaction thought
to be the trees’ way of getting rid of fruit with defective or weak seeds. Although growers
have no direct control over the fruit that drops, there are a few ways to maintain a healthy
tree and reduce fruit drop. Two of the most important ways to reduce fruit drop are
decreasing stress by excellent irrigation management and picking the mature fruit on time
in order to prevent them from competing with the new crop. Low percentages of fruit
drop can sometimes be irrelevant considering “avocado trees can produce 100-200
avocados during a bad year and 200-300 avocados during a good year” (Arpaia, 2013).
More effective management techniques include over-fertilizing with Nitrogen and cross-
pollinating with other varieties.
Fertilizers. Fertilization and having a proper nutritional program is necessary for all
crops in order to generate the best possible yields and productivity. Avocados thrive from
constant, light applications of nutrients including nitrogen, phosphorous, potassium and
zinc. These water-soluble nutrients can be automatically or manually injected into the
irrigation system to provide nutrients at any time. Fertilizer injectors allow growers to
insert and distribute nutrients and fertilizer throughout the system with very little chance
of clogging. As the tree matures, increased nutritional needs are required to maintain the
proper pH range and soil nutrient content. Consistent soil pH measurements can help the
11
growers know when to fertilize, as well as what type of fertilizer to use.
Another way to maintain balanced nutrient levels is to collect leaf samples and perform a
nutrient analysis. According to Arpaia and Faber, “a young tree needs ½-1 pound of
Nitrogen per year, spread out over several applications. As the trees mature, the amount
of fertilizer needed will increase accordingly” (Arpaia, 2013). In order to grow healthy
avocados, the maximum amount of fertilizer to use for a mature tree should never exceed
1 pound per year per tree. After every fertilization application, growers should follow up
with a deep and thorough irrigation set.
Irrigation System Management
Irrigating Avocado Trees. Irrigation is important for avocado trees in California because
avocados are native to the humid sub-tropical and tropical regions of central and northern
South America where rainfall is abundant. In comparison, California is an arid
Mediterranean climate with low rainfall. For best growth and yields, avocado trees need a
minimum amount of water each year, approximately 40-50 inches of rain, and moist soils
in order to support the number of roots needed for healthy avocado trees (Irrigating
Avocado Trees, 2014). The avocado tree does not search for water therefore water needs
to be provided to the trees at the right times. In addition, the majority of avocado roots
are in the top six inches of soil, typically spreading out to the end of the canopy
(Irrigating Avocado Trees, 2014). For these reasons, California avocado growers rely on
irrigation systems to support the water needs of their grove and keep the soil from drying
out during periods of no rainfall. Optimal irrigation requires uniform water application
and helps prevent an economic loss through lower yields. Poor irrigation practices such
as prolonged saturated soils, standing water and poor timing can lead to root rot and
sacrifice tree health.
When to Irrigate. Knowing when to irrigate is one of the most important factors in
maintaining high irrigation efficiency. Deciding when to irrigate can be done using
weather-based methods, soil-based schedules, or a fixed frequency every so many days.
One of the hardest things to avoid can be over- and under-irrigation. Avocado trees can
only handle so much stress before the roots begin to dry out and begin to decrease
productivity. Depending on weather, soil and water availability, the most common
irrigation schedule for avocados will include two or three, 6-8 hour sets per week
(Underwood, 2014).
Properly placed tensiometers can be used for direct soil measurement to determine when
to irrigate and to prevent over- or under-irrigation. The tensiometer displays the amount
of tension the plant is using to pull water from the soil. Using soil tension measurements
to determine groundwater availability can help a grower anticipate a plant’s water needs
and avoid plant stress before it occurs. Depending on the soil type, irrigation for avocados
should generally start when the 12-inch tensiometer reads 25 to 30 centibars, earlier if the
soil is very sandy and later if the soil has high clay content.
Determining How Much Water to Use. The design of the irrigation system and the

12
determination of the amount of water to use depends on the crop and is a job for the
professional. To reduce costs and increase productivity, growers aim for at least 80%
efficiency with high distribution uniformity. In general, the depth of irrigation should
match the location of the avocado roots. Water and nutrients pushed deeper than the
rooting depth are considered waste and should be avoided.
Different soils need different amounts of water as sandy soils hold less water and have
less lateral movement of water than clay based soils. When dealing with clay based soils,
it is important to maintain a consistent schedule because if irrigation is stopped for too
long, the soil will harden and runoff will increase. Different sized trees also need different
amounts of water. Enough water for a large tree with a good layer of mulch can be less
than that for a small growing tree. In order to calculate the amount of water and the best
irrigation schedule for a grove, the CIMIS system can be used to calculate the daily water
use. The California Irrigation Management Information System (CIMIS) uses a collection
of data from over 100 weather stations in California to help growers and managers with
water applications, budgets and schedules. The weather data is automatically transmitted
to one central location where it is processed and used to determine evapotranspiration
rates in all the different locations (Land and Water Use, 2014).
Managing Irrigation. Managing the cost of irrigation is one of the most important
methods in becoming a successful California avocado grower. Irrigation can be the
greatest cost of production for an avocado grower and that is why we are constantly
searching for ways to increase efficiency and distribution uniformity. Unfortunately, the
exact amount of water differs for each grove due to differences in soil types,
microclimate, elevation changes and tree type, size and health. As a general rule,
“growers should budget for 3.5 acre-feet of water per acre per year with sprinklers
because Hass avocados typically transpire 40-60 gallons of water per day during the
warmer seasons” (Koch, 2013). To ensure your irrigation is not wasting water, consider
the following avocado cultural management practices as outlined by the California
Avocado Commission (Manage Water Costs by Assessing Your Irrigation System, 2013).
These include:
Capping off sprinklers to diseased and damaged trees
Stump canopied trees
Thin crowded groves
Apply mulch and remove weeds
Keep skirts low on trees
Always maintain system for leaks
Don’t irrigate too much on slopes because there will be runoff and potential
washing away of soil
Benefits of Irrigation. Although it is obvious that all crops need irrigation, it is
beneficial to take a closer look at how and why irrigation is so important. In California,
poor avocado yields are often related to poor irrigation practices and soil salinity issues.
Water plays an important role in crop production and photosynthesis. Photosynthesis
helps create amino acids, proteins, vitamins, hormones and enzymes that support tree
growth and fruit production, as well as oils and sugars in the fruit. Water serves as an

13
excellent source in delivering salts and minerals to the roots and leaves. On the other
hand, water used for leaching helps rid the root zone of salts that can lead to tip burn and
leaf drop, which can reduce fruit production. Water also helps cool the leaves of the tree
to prevent overheating and potential shutdown of photosynthesis.

14
PROCEDURES AND METHODS
The design components placed on this project came about through discussion with the
grower, Craig Underwood. There were certain aspects to the project that he wanted
changed and others that he wanted to keep the same. Unlike most irrigation system
designs, this design is more of an improvement than a design starting from scratch. On
that same note, there were certain aspects in the design that were unknown by the grower
and left to be decided from a best guess by the designer. The trees are already planted and
the system components are already in place. The well, pump, filter, mainline and
manifolds are to remain unchanged.
Existing Conditions
The grower is looking for ways to improve his irrigation strategies, yield and distribution
uniformity without changing any of the above components. According to his recent
evaluation, the trees are being under-irrigated and the distribution uniformity is
underperforming and costing him money. To achieve a higher distribution uniformity, a
system must be designed to have minimal pressure variation and uniform flow rates from
the sprinkler heads. To establish the most accurate design procedure, careful inspection
and evaluation of the current irrigation system was required. The first step in the design
process is understanding the field constraints, what is available and what problems are
already occurring.
Field Constraints. The 10.6 avocado orchard is located in Somis, California, on a
gravelly sandy loam soil with a pH of about 7.5 (Underwood, 2014). The elevation
differences throughout the field are minimal and result in a slope that varies between 0
and 1%. There are 37 rows of trees with varying amounts of trees per row from 43 to 67.
In order to help increase yield, cross-pollinating Fuerte avocado trees were planted in
10% of the orchard. The tree rows run north and south in order to allow maximum
sunlight at all times.
Certain sections of trees were planted at different times and thus resulting in three
different tree spacings. With a bird’s-eye view counting from East to West, the first 18
rows were planted in 2005, on a 10 ft. by 14 ft. spacing and make up about 2.8 acres of
the field. Rows 19 through 24 were planted in 1999, on an 18 ft. by 23 ft. spacing and
make up about 2.4 acres of the field. Rows 25 through 37 were planted in 2001, on an 18
ft. by 23 ft. spacing. In 2009, interplants were added to part of that section. As can be
seen in the irrigation system design, the interplants in rows 25 through 37 end at the 26th
tree from the top and result in a 1.9 acre section with a 9 ft. by 23 ft. tree spacing. The
remaining section below is on an 18 ft. by 23 ft. spacing and makes up about 3.5 acres.
This variant tree spacing is the root of all difficulties for the system design as it causes
uneven canopy cover as well as inconsistent ET rates and water requirements throughout
the field. A map of the field can be viewed in Appendix F.
Canopy Cover. It is important to know the canopy cover in any orchard because of its
effects on ET and the resulting water requirements. As the canopy cover increases so

15
does the ET rates. Canopy cover is expressed in a percentage and refers to the amount of
ground coverage that the trees, branches and leaves provide. The ET rate increases as
canopy increases because the highest percent of ET occurs in the leaves as they are
continually breathing and transpiring water. The overall canopy cover for the entire
orchard was determined to be 76%. The canopy cover for the section on a 10 ft. by 14 ft.
spacing is 90%. The canopy cover for the section on an 18 ft. by 23 ft. spacing including
rows 19 through 24 is 83%. The canopy cover for the section with interplants in rows 25
through 37 is 72% and the canopy cover for the section below the interplants on an 18 ft.
by 23 ft. spacing is 79%.
These results were determined from the i-Tree Canopy website and can be seen in the
Appendix D. Since the canopy cover percentages in each of the different sections are
greater than 60%, the orchard can be considered mature. For a mature orchard where the
same or similar percent canopy cover exists throughout, each section needs to receive the
same amount of water per acre regardless of the tree spacing. The hours per week or the
nozzle size on the sprinklers need to be adjusted for each of the different spacings. Since
the grower is irrigating the entire orchard as one block, the only option is to adjust the
nozzle sizes on the sprinklers.
The goal is get the highest and most uniform canopy cover percentage as possible
throughout the orchard, and the best way of reaching this goal is by irrigating the same
amount of water per acre regardless of the spacing. Unfortunately, the only way to really
know how much water the trees are using is to install a weather station and soil moisture
sensors in each of the different sections. These will help tell how much water the trees are
actually using during the different times of the year.
Water Source and Fertigation. Water is available from a concrete standpipe near the
top right corner of the field. The water runs from the well on the property and is stored in
a 10 ft. concrete standpipe before entering the system. The well water contains 50-100
PPM nitrate and 150 PPM chloride. In order to balance out these high rates and allow for
more efficient nutrient uptake by the trees, the grower annually injects 90 lbs. of
potassium and 90 lbs. nitrogen. He also annually applies 500 lbs. of sulfur that is hand
spread throughout the orchard to help lower the soil and water pH. These fertilizer
applications are typically divided out into 3 to 4 events per year. Once an irrigation set is
activated, the water is pressurized by a booster pump and enters the pipeline system.
When operating at its highest efficiency, the 25 HP Peerless End Suction booster pump is
capable of pumping about 500 GPM at about 95 PSI. Pumps are necessary for all micro-
irrigation systems in order to maintain consistent pressures and flows throughout the
field. Figure 6 below is a picture of the pump that is currently in use for this orchard.
16
Figure 7. Berkeley centrifugal booster pump.
Filtration. After the well water exits the pump it is passed through a stainless steel
Hydrokleen Tubescreen filter. Regardless of the source, water needs filtration in order to
reduce emitter plugging and bacterial growth. Failure to use the proper type of filter will
generally result in eventual system failure. Although sand-media tanks are typically
recommended for micro-irrigation systems, the grower is confident in the cleanliness of
his well water and decided to keep using the Tubescreen filter that is already in place.
This filter has a backflush cap that is manually activated when the pressure difference
across the filter exceeds 7 PSI. Figure 7 below is a picture of the filter that is currently in
use for this orchard.
Figure 8. Hydrokleen tubescreen filter.
System Inspection. Since this design did not include installation of a new pump, filter
and pipeline system, pressure readings throughout the field were required. In order to
make sure there was adequate pressure in the system, several pressure readings were
taken while the system was running. The downstream pressure exiting the filter after a
recent backflush was about 77 PSI and can be viewed in Figure 8 below.

17
Figure 9. Pressure reading downstream of filter.
The pressure entering Manifold 1 after Valve 1 was 54 PSI and the pressure at the 28th
riser in Manifold 1 was 42 PSI. The pressure entering Manifold 2 after Valve 2 was 55
PSI and the pressure at the 10th
riser in Manifold 2 was 59 PSI. The pressure entering
Manifold 3 after Valve 3 was 59 PSI and the pressure at the 6th
riser in Manifold 3 was
also 59 PSI. These pressure readings solidify the fact that there is more than enough
pressure throughout the system. A map of these pressure readings can be viewed in
Appendix F.
Pipelines. Once the water passes through the filter it is ready to enter the pipeline
system, where it can be distributed from a main pipeline system to laterals in the orchard.
The mainline and manifolds consist of Class 125 PVC in three different sizes including 1-
1/2 inch, 2-1/2 inch and 4 inch. According to the grower, record of the exact location of
reduction in the pipelines is unknown, but since there is adequate pressure in the last riser
of each manifold, it can be concluded that the pressure loss due to friction in the pipeline
is not a critical problem.
On the other hand, it is known that the entire mainline from the exit of the filter to the
valve at the beginning of each manifold is 4 inch. Next, each manifold is known to
include the three above said pipe sizes but the exact point of reduction is unknown. It is
also known that the majority of irrigation systems installed are done so by abiding by the
5 ft/sec. rule. This means that the pipe is sized so that the velocity through each section
will not exceed 5 ft/sec. and thus, result in minimal pressure loss due to friction.
The entire pipeline system consisting of Class 125 PVC pipe is underground in place and
will not be altered. There is a valve at the beginning of each of the three manifolds that
remains wide open at all times, unless manually closed in case of an emergency.
Although the orchard could be split up into three different blocks, it is currently and will
remain irrigated as 1 block.
18
Risers. The next source of difficulty for the design is the variant locations of risers, brass
hose bibs and pressure regulators at each riser. A riser is usually a flexible PVC pipe that
allows the water to rise from the underground pipeline to serve the aboveground laterals.
A brass hose bib is a valve that is used to regulate flow in most household hoses and
should not be used in any agricultural applications.
Manifold 1 serves 37 rows, it only contains 28 risers. Rows 1 through 18 each have a
riser with a 20 PSI regulator at the top. From row 19 to 37 there is a riser every other row
that has either a 25 PSI regulator or no regulator at all. Manifold 2 has 10 risers that
alternate rows from 19 to 37. Manifold 3 has 6 risers that serve rows 25 through 37. The
exact locations of the risers can be seen on the irrigation system design in Appendix F.
Pressure Regulators. A pressure regulator is a device that limits the amount of pressure
entering a lateral regardless of the inlet pressure, as long as the inlet pressure is above the
pre-set pressure on the regulator. They are necessary because flow rates will change as
pressure changes. Each riser has either a 20, 25, or 30 PSI regulator, but several have no
regulator at all. Therefore, this design focused on standardizing the pressure regulator for
each riser.
Lateral Hoses and Emission Devices. Once the water rises up and passes through the
hose bib and pressure regulators, it enters the ½ inch polyethylene hoses that run up and
down every row. These ½ inch hoses are undersized relative to the total water flow in the
system and as a result, there are large pressure losses due to friction in the hoses. In order
to prevent these losses and increase efficiency, the size of these hoses will need to be
increased. Water flows through the lateral hoses and out of the emission devices, where it
infiltrates the soil to replenish soil moisture.
The grower is currently using 4 different emitter devices that are randomly located
throughout the orchard. These devices include 1 and 2 GPH drip emitters at the base of
about 60% of the trees in the orchard, as well as 7 or 9 GPH micro-sprinklers in between
the trees in every row. The drip emitters are small plastic pieces that are inserted directly
into the lateral hose. The drip emitters are adding unnecessary flow to the laterals, which
causes an increase in friction loss. A picture of this connection can be seen in Figure 9
below.

19
Figure 10. Example of a 2 GPH drip emitter.
The micro-sprinklers are connected to the lateral hose via a small spaghetti hose that is
typically 1 to 3 feet long. They are also attached to a plastic stake that allows for the
sprinkler to be elevated 6 to 12 inches and the hose or sprinkler to be moved around
without disturbing the spray pattern. The micro-sprinkler can be seen in Figure 10 below.
Since there is no pattern or uniformity relating the location of the emitters to the different
tree spacings, this is a major cause of poor distribution uniformity that needs to be
improved.
Figure 11. Example of micro-sprinkler in orchard.
20
Energy and Water Use. The grower is currently on a time-of-use program with
Southern California Edison. This means that Edison will provide them a discounted rate
when they use power during off-peak hours. In order to take full advantage of this
opportunity, the grower does not irrigate between the hours of noon and 6 p.m. to keep
costs low. He still has to make sure he has an irrigation window that is long enough to
apply the trees with what they need. Under-irrigation can result in a reduction of crop
production and increase in soil salinization. He is currently irrigating the entire orchard in
1 set, two times a week for 6 hours. During warmer periods with no rainfall, he will
increase the application time to 8-10 hours, and once every two weeks he will irrigate for
15 to 20 hours for leaching. There are no soil tensiometers in the field telling him when to
irrigate. Instead, he sticks to his own schedule that he has learned from experience over
the years. Unfortunately, his system is so inefficient that he is applying an excess of
water to some trees and not enough to others.
Irrigation System Design
The irrigation system design begins with determining the water requirements for the trees
in each of the different sections. In order to determine the net water requirement per tree
and for the entire orchard, the spacing, ET rate and irrigation window need to be known.
The net water requirement refers to only the water that the tree is using. According to the
ITRC website, the peak ET rate for Avocados in Zone 4 in Ventura County is 4.97 inches
in the month of August, which equates to .16 inches per day. The irrigation window of 9
hours per day, 4 days a week for a total of 36 hours per week was determined to provide
the most efficient flow rate out of the pump and into the system.
Flow Rate Requirements. The spacing, irrigation window, flow rate per tree and flow
rate per spacing can be viewed in Table 1 below. The calculations for Table 1 can be
viewed in Appendix B.
Table 1. Net GPH per tree and net total GPM.
The total net flow rate required by the trees before including leaching requirement, spray
losses and desired distribution uniformity is 148 GPM. Once the net flow rate is
determined, the gross flow rate per tree and for the entire orchard can be calculated.
Gross refers to the total amount of water applied after accounting for spray losses, desired
distribution uniformity and the leaching requirement. Spray losses from the micro-
sprinklers are assumed to be 5% and the desired distribution uniformity is .85 to account
for potential system deterioration.
The leaching requirement is the extra percentage of water that is needed to keep the soil
below the threshold soil salinity (ECe) for the crop. Avocados are very sensitive to salty

21
soils and have an ECe of 1.3 dS/m (Burt, 2012). For every unit increase in soil salinity,
avocado yields will decrease 21%. It is very crucial to irrigate enough to leach the salts
from the soil and keep the ECe below 1.3 so that the trees can absorb the correct amount
of nutrients and moisture. The salinity of the irrigation water (ECw) used at the
Underwood orchard is 1.51 ds/m. The ECe and the ECw are used to determine the
leaching requirement for the orchard. The leaching requirement for the orchard is .3 and
is used in the equation to determine how much irrigation water should be applied to the
field. The leaching requirement calculations are shown in Appendix B for Table 2. The
total irrigation water required for the orchard is 262 GPM. More detailed calculations for
the data in Table 2 below are shown in Appendix B.
Table 2. Gross GPH per tree required and total GPM required.
Total Flow = 67.3GPM + 40GPM + 154.7GPM = 262 GPM.
Wetted Area. The next step in the design process is to calculate a minimum required
sprinkler diameter. It is important to note that the entire field is irrigated as 1 block and
that there is 1 micro-sprinkler per tree. It is also important to note that the gravelly sandy
loam soil in the orchard will have an additional lateral movement of water of 0.5 feet,
which will at 1 ft. to the total diameter (ITRC, 2008). Larger sprinkler diameters are
recommended for avocados because they make better use of the available soil nutrients
and moisture while supplying a wider root system. The minimum required sprinkler
diameter is calculated using a wetted area of 60% of the total tree spacing area. The
minimum required sprinkler diameters can be viewed in Table 3 below and the
calculations can be viewed in Appendix B.
Table 3. Minimum sprinkler diameter required.
Micro-sprinkler Selection. Once the required flow rate and minimum required sprinkler
diameters are determined, it is time to select a sprinkler that adequately meets the
constraints. Recall that since the previously discussed ET rates are similar throughout the
orchard regardless of the spacing, the chosen sprinklers will need to apply the same or
near the same flow per acre.
The first step is to choose a sprinkler manufacturer, which was easy because the grower
requested to replace the old sprinklers with new Netafim micro-sprinklers. Table 4 below
Spacing A (sq. ft) 60% of A Req'd Dia. Min Rqd Dia
10x14 140 84 10.3 9.3
9x23 207 124.2 12.6 11.6
18x23 414 248.4 17.8 16.8

22
shows Netafim’s Supernet pressure compensated sprinkler characteristics and the chosen
sprinklers that could best match the requirements. Pressure compensated means that the
sprinkler will maintain the same flow rate as long as the inlet pressure is within the
recommended pressure range. The recommended pressure range for the sprinklers below
is anywhere from 25 to 50 PSI, which covers the pressures available at every riser
throughout the Underwood orchard. The highlighted sprinklers below best match the
required sprinkler flow rates in Table 2 and the required diameter in Table 3. The 5.3
GPH sprinkler will be installed in the section on a 10 ft. by 14 ft. spacing. The 7.4 GPH
sprinkler will be installed in the section on a 9 ft. by 23 ft. spacing. Lastly, the 15.3 GPH
sprinkler will be installed in the section on an 18 ft. by 23 ft. spacing.
Table 4. Netafim supernet sprinkler characteristics.
Flow Rate by Tree Spacing. After choosing the sprinklers that will be used for the new
irrigation system design, the flow per area and the total flow applied can be calculated.
The total flow applied to each section is calculated by multiplying the number of
sprinklers by the flow rate per sprinkler. Once the flow rates for each of the sections on a
different spacing are calculated, they can be added up to find the total flow rate during an
irrigation set. This flow rate was calculated to be 283 GPM and can be viewed in Table 5
below. The reason why the number of trees does not match the number of sprinklers is
because in every micro-irrigation design, an extra emitter is added to the outside of every
row. Since there are 37 rows of trees, there are 37 more sprinklers than trees. The
calculations for Table 5 can be viewed in Appendix B.
Table 5. Total GPM applied and flow/area.
Netafim Swivel Performance Long Short
Nozzle in. #, Color GPH Swivel Co Wet D Swivel Co Wet D
0.035 20, purple 5.3 Purple 14.8 Blue 8.2
0.045 28 l green 7.4 Purple 19.7 Blue 11.5
0.045 30 brown 8.2 Purple 19.7 Blue 11.5
0.047 35 sky blue 9.2 Purple 19.7 Blue 11.5
0.05 40 Blue 10.6 Purple 19.7 Blue 11.5
0.056 50 green 13.2 Black 23 Blue 14.8
0.061 58 gray 15.3 Black 23 Blue 14.8
0.068 70 black 18.5 Black 23 Blue 16.4
0.069 90 orange 23.8 Black 23 Blue 16.4

23
Summary of Selected Equipment. Table 6 below is a summary of the chosen sprinkler
characteristics. It clearly shows which sprinkler will be installed in each spacing and what
the required pressure is for each. Under the “swivel” column, “LR” stands for long range
and “SR” stands for short range. These headings refer to the distance of the sprinkler
diameter.
Table 6: Sprinkler characteristics for each spacing.
AutoCAD Design
Once the number of trees, number of sprinklers, flow rate per sprinkler and total system
flow rate are determined, the actual design can begin. All of the design parameters
discussed below can be viewed on the AutoCAD design of the irrigation system at the
end of this report. All necessary measurements and elevations for the design were
previously taken at the Underwood orchard or found using Google Earth. Fortunately for
this orchard, certain things that were previously discussed are already in place and will
remain unchanged. These include the pump, filter, mainline, manifolds, valves, risers and
trees. An aerial view of the orchard was used to help ensure the AutoCAD design was
similar. Figure 10 below shows the aerial view taken from Google Earth.
Figure 12. Aerial view of Underwood avocado orchard.
Spacing # of Sets Req'd GPH GPH/spk Swivel Required P Min Rqd Dia Spk. Dia.
10x14 1 4.80 5.30 #20 LR 25-30 9.3 14.8
9x23 1 7.10 7.40 #28 SR 25-30 11.6 11.5
18x23 1 14.20 15.30 #58 LR 30 16.8 23

24
Design Process. The first step was to draw the trees on the on the correct spacing for
each section in order to ensure the field dimensions were to scale. Once all 1,796 trees
were drawn and in place, the other finite objects including the pump, filter, mainline,
manifold, valves and risers could be drawn in their respectful locations. Next, the sections
of different spacings and location of the interplants were labeled. The interplants in rows
25 through 37 end after the 26th
tree from the top. Once these locations were clearly
defined, the lateral hoses and sprinklers were drawn in. Each sprinkler of a different flow
rate was drawn in a different color for ease of differentiation between them. The layout of
the different designated sprinkler areas is very important in order to avoid confusion of
the specific areas where the flow rates are different. Next, optimum locations of lateral
hose cuts were determined by calculating the flows through the three different manifolds
and minimizing hose length as often as possible.
Microsoft Excel was used to make several spreadsheets and perform trial and error
calculations until the flow rate in each manifold had the lowest possible friction loss.
These calculations can be viewed in Appendix E. At every hose cut in the field, the hose
is closed off by bending and securing it with a plastic figure eight. Figure 11 below is a
close up of a figure eight clamping and cutting off flow at the end of a hose.
Figure 13. Figure eight clamping hose end.
Since rows 1 through 18 each have their own riser off of Manifold 1, the hoses were cut
at both ends of each row. For rows 19 through 24 on Manifold 1, the hoses were cut at
the uphill end and after the ninth tree downhill from the riser. For rows 25 through 37 on
Manifold 1, the hoses were cut at the uphill end and after the 12th
tree downhill from the
riser. For rows 19 through 24 on Manifold 2, the uphill hose ends were cut at the same
location as the downhill hose ends on Manifold 1, and the downhill hoses were cut at the
end of each row. For rows 25 through 30 on Manifold 2, the uphill hose ends were cut at
the same location as the downhill hose ends on Manifold 1, and the downhill hose ends
were cut after the 7th
downhill tree.
For rows 31 through 37, the uphill hose ends were cut at the same place as rows 25
through 30 and the downhill hose ends were cut after the 11th
downhill tree. For rows 25
through 30 on Manifold 3, the uphill hose ends were cut at the same location as the

25
downhill cuts on Manifold 2 and the downhill hoses were cut at the end of each row. For
rows 31 through 37 on Manifold 3, the uphill hose ends were cut at the same location as
the downhill cuts on Manifold 2 and the downhill hoses were cut at the end of each row.
It is important to note that the above manifold serves the sprinkler at every downhill hose
cut line. For further understanding refer to the irrigation design in Appendix F.
Lateral Hose Locations. Determining the location of the lateral hose cuts was a key step
that made it possible to count the number of trees uphill and downhill from the each
manifold. The number of trees uphill and downhill of the first riser on Manifold 1 and the
end risers on each manifold in row 37 were counted and labeled. This also allowed for
the number of sprinklers on each lateral to be counted as well as the total flow rates in
each lateral and manifold. Since the risers throughout the orchard serve various amounts
of laterals, it is important to note how many each riser serves. In Manifold 1, risers 1
through 18 and riser 28 serve one lateral and risers 19 through 27 serve two laterals. In
Manifold 2, each riser serves two laterals except for riser 10, which serves only one
lateral. In Manifold 3, riser 1 and 3 serve three laterals, riser 2, 4 and 5 serve two laterals
and riser 6 serves one lateral.
The total flows in each lateral and each manifold were calculated in the spreadsheet that
can be viewed in Appendix E. The sprinkler flow rates were multiplied by the number of
sprinklers in each lateral to determine each individual lateral flow rate. Then each of
those flow rates were added together to determine the total manifold flow rate. The total
flow rate for Manifold 1 was 174.63 GPM. The total flow rate for Manifold 2 was 82.88
GPM. The total flow rate for Manifold 3 was 25.245 GPM. The sum of the three
manifold flow rates was 282.75 GPM, which was the same flow calculated in the early
steps of the design. It is important to know the flow rate going into each manifold in
order to calculate the friction loss through the hoses and the critical path.
Critical Path. The critical path is the furthest path a water molecule travels in the system
that has either the highest flow rate or the highest required inlet pressure. The critical path
for the Underwood orchard was determined to be riser 21 on Manifold 1 and was
calculated using the spreadsheet in Appendix E. The inputs needed to calculate the
friction loss and required inlet pressure for the critical path include hose inside diameter,
section flow rates, section lengths, C value and velocity. The C value is the roughness
coefficient of the material and is 150 for Class 125 PVC and 140 for polyethylene hose.
The Hazen-Williams equation used to calculate friction loss can be viewed in Appendix
E.
The calculated inlet pressure requirement for the critical path was 33.01 PSI. This means
that as long as there is at least 33.01 PSI available at riser 21 on Manifold 1, then there
will be sufficient pressure at every riser in the system. In order to provide certainty of the
inlet pressure at every riser, all of the old pressure regulators will be removed and
replaced with 35 PSI regulators. Since the inlet pressure requirement for the critical
lateral is 33.01 PSI, all other risers will have enough pressure to satisfy every sprinkler in
the orchard.

26
One more critical path calculation was made for the manifolds to confirm there was
enough pressure at the head of each manifold. Since the flow in Manifold 1 was
determined to be undoubtedly the greatest, it was assumed to have the most critical path.
The same Excel spreadsheet was used to calculate the friction loss and required inlet
pressure at the head of the manifold. The calculated inlet pressure for Manifold 1 was
55.93 PSI, slightly larger than the pressure reading of 54 PSI that was previously
mentioned. This is a very minor difference and will result with insignificant effects
because these calculations were based off a desired average pressure of 55 PSI, which is
much higher than what actually is needed. The overestimate of desired average pressure
was made with regard to the fact that the friction loss calculations are affected by the pipe
inside diameter. As previously stated, it is unknown where the exact location of reduction
in the manifold pipe size occurs, so it is better to overestimate then underestimate. These
calculations can be viewed on the spreadsheet in Appendix E.
Pipe Characteristics. Table 7 below shows the characteristics for the Class 125 PVC and
the polyethylene (PE) hose used in the design. It includes the nominal size, inside
diameter and C value for each. The inside diameters and C values are used in the Hazen-
Williams equations to calculate friction loss in a section of pipe.
Table 7. Pipe characteristics.
Hose Lengths. The next step is to calculate the total hose length necessary for the new
irrigation design and installation. Table 8 below shows the hose lengths for the three
different spacings. To find the total area of each section, the spacing area was multiplied
by the number of sprinklers in that area. The hose length was determined by multiplying
the number of sprinklers by the sprinkler spacing down the rows. Once the hose lengths
for the three different sections were calculated, they were added together to find the
subtotal hose length. The total hose length still required the extra sections of hose
connecting the areas where two laterals are served by one riser, as well as an additional
2.5% of hose for snaking and flushing the hose ends. The total hose length was calculated
to be 24,441.13 feet and the calculations can be viewed in Appendix B.
Table 8. Hose lengths for different spacings.

27
RESULTS
Peak Evapotranspiration
The peak ET rate is necessary for any irrigation system design. The peak ET rate for
avocados during the month of August is .16 inches per day.
Required System Flow Rate
In order to satisfy the desired distribution uniformity, leaching requirement and ET rates
of the trees in each of the sections with different spacings, the new required system flow
rate was calculated. The total irrigation water required for the orchard is 262.03 GPM and
the calculations for this can be viewed in Appendix B.
Irrigation Schedule
The irrigation schedule was calculated to ensure that the trees will be receiving enough
water during the hottest month of the year. It is based off of the system flow rate, tree
spacing and peak ET rates. During the month of August, the irrigation schedule should
consist of four 9-hour sets per week for a total of 36 hours per week. As the days get
cooler and ET rates decrease, the hours of operation will be cut back in order to save
water and money.
Selected Micro-Sprinklers
Each micro-sprinkler was selected based off of the tree spacing and required flow rates in
each section of the field. The chosen sprinklers are pressure compensated with a rating of
25 to 50 PSI. In the section on a 10 ft. x 14 ft. spacing, there will be 841 micro-sprinklers
with a flow rate of 5.3 GPH. In the section on a 9 ft. x 23 ft. spacing, there will be 338
micro-sprinklers with a flow rate of 7.4 GPH. In the section on an 18 ft. x 23 ft. spacing,
there will be 414 micro-sprinklers with a flow rate of 15.3 GPH. Regardless of the
spacing, each micro-sprinkler will apply the correct amount of water per acre and will
result with an improvement to yield and distribution uniformity.
Total System Flow Rate
The total system flow rate was calculated using the number of sprinklers and each of the
sprinkler flow rates. The total system flow rate during peak ET will be 282.75 GPM. This
flow rate will remain the same throughout the year, but hours of operation will decrease
as ET rates decrease.
Required Inlet Pressure
The critical path method was used to determine the required inlet pressure at the critical
manifold and lateral hose. The required inlet pressure for the critical manifold is 55.93
PSI and the required inlet pressure for the critical lateral hose is 33.01 PSI.

28
Size and Length of Hose
The size of the hose allows the designer to determine whether or not the required flows
will be able to reach every emitter with enough available pressure. The ¾ inch hose will
be used because it has minimal pressure loss due to friction with the required lateral flow
rates. The total required hose length is 24,441.13 feet and was calculated in order to
provide enough hose for snaking, flushing hose ends and meeting the length requirements
of each micro-sprinkler spacing.
Cost Analysis
An estimate of the costs for the irrigation system improvements was acquired from Coast
Water Solutions in Oxnard, California. Table 9 below displays the item number,
description, quantity, unit cost and total cost for all of the materials necessary for the
irrigation system.
The quantity of hose was determined from the hose length calculations. The quantities for
the fittings and sprinklers were rounded up in order to allow the grower to have extra just
in case of wear and failure. Since there are 44 risers in the orchard, the grower will
receive 50 of each of the necessary fittings. Since there are 71 total laterals and each
lateral has two hose ends, the grower will receive 175 figure eight hose ends. He will also
receive over 30 extra of each micro-sprinkler. Lastly, 1 pint of glue and 1 pint of primer
will be necessary to glue all of the slip fittings together.
The only other costs to the grower will include the labor for installing the new pressure
regulated riser assemblies, removal and replacement of irrigation hoses and installation of
the new pressure compensating sprinklers. The subtotal for the bill of materials is $7,
135.00. Since the sales tax for agricultural irrigation equipment is 2%, the subtotal will
have to be multiplied by 1.02 in order to get the total cost. The total cost to the grower for
all of the necessary materials to improve his irrigation system as desired is $7,277.70. All
of this data and calculations for this data can be viewed on the next page.

29
Table 9: Bill of materials.
Item # Item Description Qty Unit Cost Total
DH3/4 Toro Blue Stripe 3/4" x 1000', .805 x .925 25 106.0 2650
54 PSI
M66P 3/4" Male Thread x 3/4" IPS Socket & 1" 50 0.68 34
Spigot, MHA-34
GBV75 3/4" Global Ball Valve, MHT x FHT 50 1.40 70
9CST 3/4" Compression Swivel Tee W/Screen, 50 3.12 156
9 CST
9AP8 3/4" Figure 8 Hose End 175 0.24 42
9CC 3/4" Compression Coupling for Drip Hose 50 1.09 54.5
PRL-35 3/4" Senninger 35PSI Regulator, FHTxMHT 50 5.25 262.5
31722 Netafim Supernet PC SPK 5.3GPH Purple 875 2.00 1750
Noz W LR Purple Swivel, D-14.8'
31725 Netafim Supernet PC SPK 7.4GPH Light 375 2.00 750
Green Noz W SR Blue Swivel, D-11.5'
31721 Netafim Supernet PC SPK 15.3GPH Gray 675 2.00 1350
Noz W LR Black Swivel, D-23'
5E531 Weld-On Cement, PVC Glue - 1 Pint 1 9.00 9
6KWU5 Weld-On PVC P70 Purple Primer - 1 Pint 1 7.00 7
Subtotal 7,135.00$
Sales Tax 2% 142.70$
Total 7,277.70$
30
DISCUSSION
Existing Equipment and Constraints
Designing an irrigation system requires certain techniques and knowledge of crops, soils,
topography, water supply, boundary constraints, climate and social and economic
considerations. When designing an irrigation system, it is important to ensure that all
constraints, requirements and calculations are accurately reported. Along with the
grower’s requests, the distribution uniformity evaluation performed on the Underwood
orchard provided reassurance that the current irrigation system needed improvement. In
fact, the evaluation missed a few key factors that would have made the evaluation more
accurate and result in a lower distribution uniformity. The factors that the evaluation did
not mention were the varied tree spacing, the risers serving 2 and 3 rows, the randomly
located 1 and 2 GPH drip emitters and the varied pressure regulators. All of which are
crucial in performing an irrigation design to improve the distribution uniformity. Several
visits to the orchard enabled the designer to acquire all of the necessary knowledge to
design and improve the irrigation system in place.
Multiple emitter flow rates were installed randomly throughout the orchard. The most
likely reason for this is that as sprinklers began to wear, they were accidentally replaced
with another sprinkler of the wrong size. Two different sized sprinklers and two different
sized drip emitters were found. The 1 and 2 GPH drip emitters could have been used
when the trees were younger, but now they are serving no beneficial purpose. Having
multiple emitter flow rates randomly spaced in the field can drastically hurt the
distribution uniformity.
Most irrigation systems designed today typically have one riser for every lateral.
Unfortunately, the Underwood orchard has a very random layout of risers in the field. It
seems as if some of the risers were installed sometime after the initial irrigation system
was installed. Risers throughout the orchard serve up to three laterals. This could have a
negative effect on the distribution uniformity and was not mentioned in the distribution
uniformity report. The flows through every riser must be known in order to calculate
pressure requirements and total flow rates.
Every micro-irrigation system requires pressure regulation whether it has regulators at the
manifold or at the risers. The Underwood orchard has three different sized pressure
regulators also randomly spaced in the orchard. The different pressure regulators at the
risers include 20 PSI, 25 PSI and 30 PSI, while some risers have no pressure regulation at
all. This is another negative effect on distribution uniformity because the available
pressure in the laterals vary. Also, the non-pressure compensating sprinklers that are used
in the orchard are adversely effected by varying pressures.
Design Considerations and Limitations

31
Quite possibly the most important characteristic of the Underwood orchard is the fact that
three different tree spacings are irrigated all as one block. Since the sprinkler flow rates
are random, the grower has very little chance of confirming that he is applying enough
water per acre. This is a common way of non-uniformly applying water because an
excess of water is applied to some trees and not enough to others. The current sprinklers
need to be replaced with sprinklers with the necessary flow rates for each spacing
because for a mature orchard, the number of gallons needed per day per acre is the same
regardless of tree spacing.
Using the three chosen sprinklers, the emitter flow rates can be matched with the tree
spacings and the correct amount of water per acre will be applied. Another option could
be to use the same sprinkler flow rate on the same spacing throughout the orchard, but
every so often a sprinkler would inevitably be placed adjacent to a tree and consequently
cause more problems with distribution uniformity. If the grower had a way of changing
the system so that it could be run on three separate blocks, then the same sprinkler flow
rates could be used and the hours of operation per block would be the only variable.
Other problems with the irrigation system include undersized lateral hoses and large
pressure variations throughout the system. In all irrigation systems, it is very important to
match the flow rates with the correct pipe inside diameter. The ½ inch hose currently in
place is too small for the flows they are withstanding and therefore, the friction loss
through the laterals is higher than it should be. As a result, there are large pressure
differences from the inlet to the end of each lateral, causing poor overlap, uneven
distribution, large droplet size and sprinkler rotation problems. Adequate pressures will
ensure that each sprinkler is applying the correct flow rate, which will result in an
improvement to the yield and distribution uniformity.
Once all of the design constraints and current irrigation system problems were
considered, the actual design requirements and improvements were clearly defined. The
previously discussed design calculations and drawings were performed in order to
confirm that the new hose, sprinklers and flow rates would suffice the available flow and
pipeline system. Given the improved irrigation design and the total flow of 282.75 GPM
during the month of August, the avocado trees at the Underwood orchard will no doubt
be receiving enough water to meet the plant ET rates. The distribution uniformity will
increase and the overall yield will improve. The desires of the grower will be met and the
trees will flourish.

32
RECOMMENDATIONS
Making improvements in irrigation systems and irrigation water management not only
saves water, but can save nutrients, chemicals, time and money. For best quality and yield
bring the irrigation system up to par while managing the system to provide the correct
amount of water at the optimum timing. The main issue for the Underwood orchard is
how to improve the distribution uniformity and still utilize the existing pump, filter,
mainline, manifolds and risers.
Management
For better irrigation system management, growers should update their systems with
available technologies for scheduling irrigations according to plant needs, as well as
controlling volumes and frequencies of applications. Installing soil moisture tensiometers
in each section of different spacing will enable the grower to monitor how much water is
being taken up by the tree and thus, when and how much to irrigate. An irrigation
controller can help the grower save time and manpower by automatically controlling the
irrigation system and distributing water and nutrients to the orchard. The automated
irrigation and fertilization system will collaborate with the soil moisture sensors to
provide an efficient means irrigation scheduling.
The grower is currently applying 90 pounds of nitrogen throughout the orchard every
year, which equates to about .01 pounds per tree. Increasing the amount of nitrogen
application will help increase yield and overall tree health and growth. Each tree should
annually receive .5 to 1 pound of nitrogen spread out over 3 to 4 applications. After
fertilizer cycles are completed, the grower should follow up with a deep thorough
irrigation set to flush out the lines and help the nitrogen infiltrate the soil.
Although the grower is not experiencing drastic problems with clogging, frequent
measures should be taken to monitor the water quality. If the water quality gets worse,
the grower should consider replacing the Tubescreen filter with sand media tanks, the
highest recommended filters for all micro-irrigation systems.
During the hottest time of the year, each irrigation set should be 9 hours per day for 4
days a week. During the rest of the year, the irrigation sets should be cut back and
adjusted to match ET rates.
Equipment
The ½ inch polyethylene hose that is currently in use is undersized relative to the total
flow of the system and as a result, large pressure drops are occurring down every lateral.
Replacing the ½ inch hose with ¾ inch hose will deliver more volume of water with less
friction loss, as well as eliminate all of the 1 and 2 GPH drip emitters that are serving no
purpose other than negatively affecting the distribution uniformity. Also, running the
shortest laterals as possible is recommended to help decrease friction loss and total flows
in each lateral.

33
In order for the grower to know exactly how much pressure is at the head of each lateral,
35 PSI pressure regulators should be installed. Since the ¾ inch polyethylene hose is
rated at 54 PSI, it is very important that there are not excess pressures in the hose. Also,
the recommended Netafim SuperNet pressure compensated micro-sprinklers are rated for
25 to 50 PSI, so the grower can be sure there will be sufficient pressure and flow to each
sprinkler. These sprinklers are optimum for a wide range of applications and have a
unique nozzle that gives them one of the highest distribution uniformities on the market.
The brass hose bibs that are used as valves at the top of ever riser should never be used in
any agricultural irrigation system. Over the years, the handles become brittle, rusted shut
and leaking problems occur. Replacing the hose bibs with plastic ball valves are a cheap
fix that will have less friction loss and provide ease of replacement when they begin to
wear.

34
REFERENCES
Arpaia, Mary L., and Ben Faber. "Answers to Questions." Answers to Questions.
UCANR, n.d. Web. 15 Oct. 2013. <http://ucavo.ucr.edu/General/Answers.html>.
"Assess Avocado Grove Irrigation Methods." California Avocado Commission. The
California Avocado Commission, 2014. Web. 20 Apr. 2014.
<http://www.californiaavocadogrowers.com/cultural-management-library/assess-
avocado-grove-irrigation-methods>.
"Avocado Varieties." California Avocado. California Avocado Commission, n.d. Web.
17 June 2014.
<http://www.californiaavocado.com/avocado-varieties/>.
"Avocado Varieties - Types of Avocados." California Avocados Direct. N.p., 2013. Web.
16 Oct. 2013.
<http://www.californiaavocadosdirect.com/8/avocado-varieties-types-of-
avocados.aspx>.
Burt, C.M. 2013. Irrigation Water Management BRAE 340. ITRC, Cal Poly State
University, San Luis Obispo
Burt, C.M. 2013. Agricultural Irrigation Systems BRAE 440. ITRC, Cal Poly State
University, San Luis Obispo.
Faber, Ben. "Irrigation Book 2 - Chapter 1." Avocado Production in California: Cultural
Care. By Gary Bender. San Diego: Regents of the U of California, 2014. 1-26. Print.
<http://ucanr.org/sites/alternativefruits/files/121292.pdf>.
“Irrigating Avocado Trees.” California Avocado Commission. The California Avocado
Commission, 2014. Web. 20 Apr. 2014.
<http://www.californiaavocadogrowers.com/cultural-management-library/irrigating-
avocado-trees>.
ITRC. 2008. Principles of Irrigation. Cal Poly Irrigation Training and Research Center,
San Luis Obispo, CA.
“i-Tree Canopyv6.0”. i-Tree Canopy. U.S. Forest Service, n. d. Web. 2 May 2014.
<http://www.itreetools.org/canopy/index.php>.
Koch, Frank. "Orchard Layout." Avocado Grower's Handbook (Chapter 2). The Hofshi
Foundation, 1983. Web. 13 Oct. 2013.
<http://www.avocadosource.com/books/koch_1983/koch_2b.htm> .
"Land and Water Use." Department of Water Resources, 2014. Web. 10 June 2014.
<http://www.cd.water.ca.gov/land_wateruse/cimis.cfm>.

35
“Manage Water Costs by Assessing Your Irrigation System.” California Avocado
Commission. The California Avocado Commission, 2014. Web. 20 Apr. 2014.
<http://www.californiaavocadogrowers.com/cultural-management-library/manage-
water-costs-assessing-your-irrigation-system>.
"Measuring Units." Environment and Heritage. NSW, 11 Oct. 2013. Web. 21 May 2014.
<http://www.environment.nsw.gov.au/salinity/basics/units.htm>.
Meyer, B. 2014. Personal Communication. Brian Meyer, CEO, Coast Water Solutions,
Oxnard, CA.
"Micro Sprinklers - Netafim." Sprinklers and Micro-Sprinklers for Agriculture. Netafim,
n.d. Web. 15 Apr. 2014.
<http://www.netafim.com/product-category/agriculture-micro-sprinklers-emitters>.
"Mission Avocados -- Growers." Regional Crop Reports. Mission Produce, Inc., 2013.
Web. 13 Oct. 2013.
<http://www.missionpro.com/regionalcropreport.html>.
“Netafim Drip/Micro Irrigation Solutions – Agriculture Division”. Netafim USA. Netafim
Irrigation, Inc., 2014. Web. 28 April 2014.
<http://www.netafimusa.com/agriculture/products/supernet>.
“New Growers.” California Avocado Commission. The California Avocado Commission,
2014. Web. 20 Apr. 2014.
<http://www.californiaavocadogrowers.com/growing/new-growers>.
Olsen, Craig. "What Is Irrigation?" What Is Irrigation? N.p., n.d. Web. 13 Oct. 2013.
<http://www.olsensprinkler.com/What_is_Irrigation.html>.
“Preparing California Avocado Groves for Winter.” California Avocado Commission.
The California Avocado Commission, 2014. Web. 20 Apr. 2014.
<http://www.californiaavocadogrowers.com/cultural-management-library/preparing-
california-avocado-groves-winter>.
Rodriguez, Amy. "Cross-Pollination of an Avocado." Home Guides. Demand Media, n.d.
Web. 16 Oct. 2013.
<http://homeguides.sfgate.com/cross-pollination-avocado-43038.html>.
Rodriguez, Amy. "What Kind of Soil Is Good for Avocado Trees?" Home Guides.
Demand Media, n.d. Web. 12 Oct. 2013.
<http://homeguides.sfgate.com/kind-soil-good-avocado-trees-39791.html>.
36
Rose, Leslie. "Home Guides." The Best Fertilizers for Avocado Trees. Demand Media,
n.d. Web. 12 Oct. 2013. <http://homeguides.sfgate.com/fertilizers-avocado-trees-
55019.html>.
"Shopping the World for Avocados." Mission Avocados. Mission Produce, Inc., 2013.
Web. 14 Oct. 2013.
<http://www.missionpro.com/avocadosourcing.html>.
Smith, Bryan. "Drip vs. Micro Sprinklers." Trickle-L Forum. N.p., n.d. Web. 15 April
2014.
<http://www.trickle-l.com/new/archives/dvms.html>.
“Tubescreen”. Hydrokleen. Web. 7 May 2014.
<http://www.hydrokleensystems.com/tubescreen.html>.
Underwood, C. 2014. Personal communication. Craig Underwood, CEO, Chief
Engineer, Underwood Family Farms, Somis, CA.

37
APPENDICES

38
APPENDIX A
Senior Project Contract

39
C a l i f o r n i a P o l y t e c h n i c S t a t e U n i v e r s i t y May 30, 2014
BioResource and Agricultural Engineering Department Meyer, Michael
BRAE Senior Project Contract ASM
Project Title: Micro-Irrigation Design for Avocado Orchard in California
Background Information: Farmers are always trying to find the most efficient ways to grow their
crop in order to make the most profit and produce the highest yield. The goal is to design an irrigation
system for an avocado orchard that satisfies the given constraints. The intention is to determine a plot of
land, type of irrigation system, plant and soil requirements and an irrigation schedule. I will be
communicating with certain companies that specialize in avocados and sprinkler irrigation. All farms try
to save the most water as possible, have the best irrigation efficiency and generate the most income as
possible. The goal is to come up with an irrigation design that will achieve all of these feats.
Statement of Work: The first phase of this project would be to research everything about avocados, as
well as the best irrigation management techniques for it. The second phase will be to get in touch with as
many different companies that can be used as resources and references for the project. The third phase
will be to work with the grower and discuss his desires and goals for the design. The fourth phase should
include the design steps, calculations and drawings. The focus will be on meeting the project
requirements, improving distribution uniformity, and providing recommendations for the most efficient
irrigation design.
How Project Meets Requirements for the BRAE Major Major Design Experience – The ASM senior project must incorporate a major design experience to meet
specific needs. The design process typically includes the following fundamental elements.
Establishment of
objectives and criteria
– The ASM senior project includes a problem solving experience that
incorporates the application of technology and the organizational skills of
business and management, the quantitative, analytical problem solving.
Synthesis and analysis The project involves the application of irrigation design, soil analysis,
economic feasibility and crop management.
Construction, testing and
evaluation
The project involves design/management skills in the areas of irrigation
system evaluation, design and cost analysis.
Incorporation of applicable
engineering standards
Quantitative problem solving will include design calculations and the cost
analysis of the project.
Capstone Design Experience - The ASM senior project must be based on the knowledge and skills
acquired in earlier coursework (Major, Support and/or GE courses).
Incorporates
knowledge/skills from
earlier coursework
BRAE 133 Engineering Graphics, 151 AutoCAD, 340 Irrigation Water
Management, 418/419 Ag Systems Management, 440 On-Farm Irrigation
Systems, 438 Micro-Irrigation Systems, SS 121 Introduction to Soil
Science, AGB 212 Ag Economics, AGB 310 Ag Credit and Finance
ASM Approach – Agricultural Systems Management involves the development of solutions to
technological, business or management problems associated with agricultural or related industries. A
systems approach, interdisciplinary experience, and agricultural training in specialized areas are common
features of this type of problem solving.
The project applies specialized knowledge in irrigation system design and

40
Systems Approach management.
Interdisciplinary Features
The project involves the integration of multiple design aspects that requires
knowledge in soil, water, irrigation and plant management.
Sustainability
Design a system that can save the most water and produce the least amount
of waste. Achieve the best possible irrigation efficiency and distribution
uniformity.
Health and Safety Growing, picking, injecting acids and fertilizers.
Project Parameters
The project must be cost effective. The design must meet the goals of the
grower and the needs of the crop. The design must work effectively. The
farmer must be able to apply the design.
List of Tasks and Time Estimate
TASK
Research in library (irrigation systems, crop requirements)
Their positives and negatives
Their feasibility
Talking to the middle men
Talking to both companies
Visiting the business
Working drawing of design
Business Plans
Crop Information
Calculations
Final evaluation
Preparation of written report
TOTAL
Hours
40
15
25
10
10
15
20
20
20
10
5
_ 20__
210
Financial Responsibility Preliminary estimate of project costs: $
Finances approved by (signature of Project Sponsor):
Final Report Due: Number of Copies:
Approval Signatures Date Student:
Project Supervisor:
Department Head:

41
APPENDIX B
Example Design Calculations

42
Table 1
Area = 10’ x 14’ = 140 sq. ft.
Hours/day = 36 / 7 = 5.14 hrs.
Net GPM/tree = (.16 in/day x 140 sq. ft.) / (96.3 x 5.14 hrs.) = .045 GPM
Net GPH/tree = .045 GPM x 60 minutes = 2.714 GPH/tree
Total GPM/spacing = 2.714 GPH x 841 sprinklers = 38.038 GPM
Net Flow = 38.038 GPM + 22.604 GPM + 87.472 GPM = 148.11 GPM
Table 2
ECe = 1.3 dSm
ECw = 1510 umhos/cm x .001 dSm = 1.51 dSm
LR = 1.51 dSm / ((5 x 1.3 dSm) – 1.51 dSm) = .30
Gross GPH/tree = 2.714 GPH / ((1-5%) x .85 x (1-.30)) = 4.8 GPH
Gross GPM/tree = 4.8 GPH / 60 minutes = .080 GPM
Total GPM/spacing = .080 GPM x 841 sprinklers = 67.29 GPM
Gross Flow = 262.03 GPM
Table 3
60% of Area = 140 sq. ft. x .60 = 84 sq. ft.
Area = (3.14 x D^2) / 4
Required Diameter = (4 x 84 sq. ft. / 3.14) = 10.3 ft.
Additional Lateral Movement = .5 ft. x 2 sides = 1.0 ft.
Minimum Required Diameter = 10.3 ft. – 1 ft. = 9.3 ft.
Table 5
Total # of Sprinklers = 841 + 338 + 654 = 1833
Sprinkler GPM = 5.3 GPH / 60 minutes = .088 GPM
Total Flow per Spacing = .088 GPM x 841 sprinklers = 74.288 GPM
Total Flow = 74.288 GPM + 41.687 GPM + 166.77 GPM = 282.745 GPM
Total Area = 140 sq. ft. x 823 trees = 115,220 sq. ft.
Flow/Area = 74.288 GPM / 115,220 sq. ft. = .00064
Table 8
Hose Length = 841 sprinklers x 10 ft. = 8410 ft.
Lateral Connections = 27 sections x 23’ per section = 621 ft.
Total Hose Length = ((8410 ft. + 3042 ft. + 11,772 ft.) + 621 ft.) x 1.025 = 24,441.13 ft.

43
APPENDIX C
Pump Information

44

45
Image of Filter, Pump and Concrete Standpipe
at Underwood Orchard

46
APPENDIX D
Canopy Cover

47

48

49

50
APPENDIX E
Manifold Flows and Critical Path Data

51
Manifold 1
Riser Sprinklers GPH GPM GPM Sprayers GPH GPM
Total
GPM
1 44 5.3 0.09 - - - - 3.89
2 44 5.3 0.09 - - - - 3.89
3 44 5.3 0.09 - - - - 3.89
4 44 5.3 0.09 - - - - 3.89
5 44 5.3 0.09 - - - - 3.89
6 44 5.3 0.09 - - - - 3.89
7 44 5.3 0.09 - - - - 3.89
8 44 5.3 0.09 - - - - 3.89
9 44 5.3 0.09 - - - - 3.89
10 44 5.3 0.09 - - - - 3.89
11 44 5.3 0.09 - - - - 3.89
12 44 5.3 0.09 - - - - 3.89
13 44 5.3 0.09 - - - - 3.89
14 46 5.3 0.09 - - - - 4.06
15 52 5.3 0.09 - - - - 4.59
16 56 5.3 0.09 - - - - 4.95
17 57 5.3 0.09 - - - - 5.04
18 58 5.3 0.09 - - - - 5.12
19 42 15.3 0.26 - - - - 10.71
20 42 15.3 0.26 - - - - 10.71
21 42 15.3 0.26 - - - - 10.71
22 52 7.4 0.12 6.41 16 15.3 0.255 10.49
23 52 7.4 0.12 6.41 16 15.3 0.255 10.49
24 52 7.4 0.12 6.41 16 15.3 0.255 10.49
25 52 7.4 0.12 6.41 16 15.3 0.255 10.49
26 52 7.4 0.12 6.41 16 15.3 0.255 10.49
27 52 7.4 0.12 6.41 16 15.3 0.255 10.49
28 26 7.4 0.12 3.21 8 15.3 0.255 5.25
Total GPM in Manifold 1 = 174.63
GPM = 5.3 GPH / 60 minutes = .09 GPM
Total Lateral GPM = 44 sprinklers x .09 GPM = 3.89 GPM
Total Manifold GPM = sum of all 28 lateral flows = 174.63
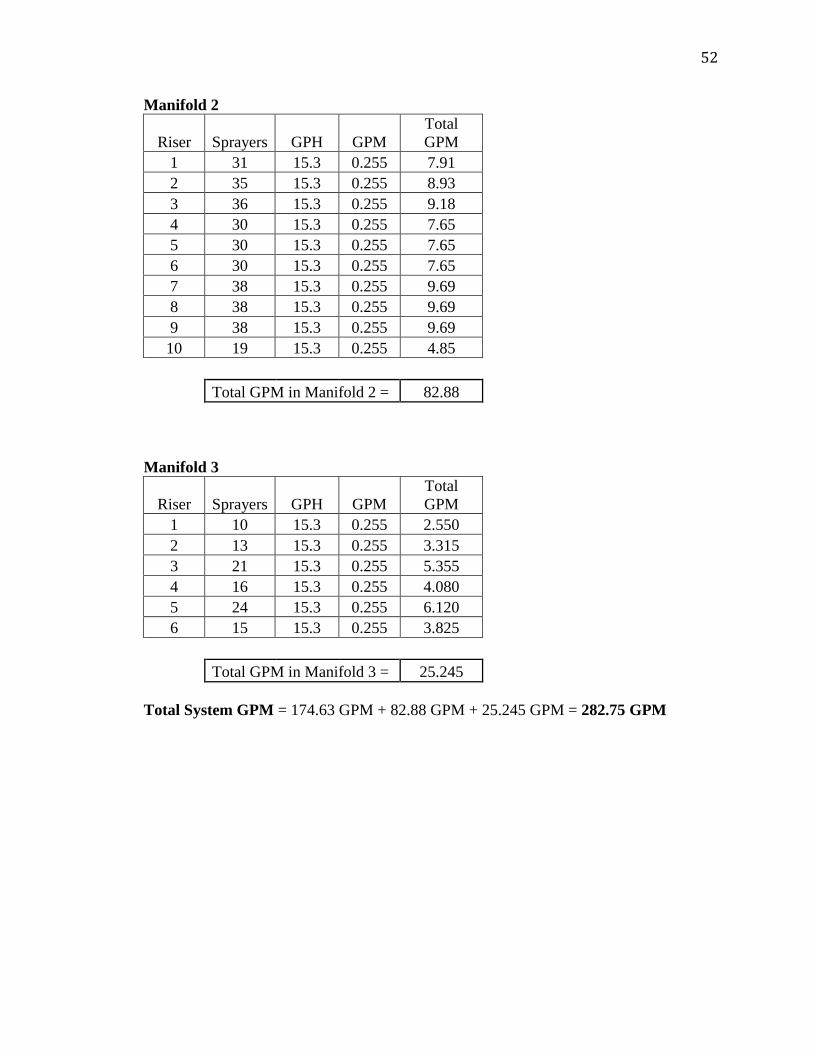
52
Manifold 2
Riser Sprayers GPH GPM
Total
GPM
1 31 15.3 0.255 7.91
2 35 15.3 0.255 8.93
3 36 15.3 0.255 9.18
4 30 15.3 0.255 7.65
5 30 15.3 0.255 7.65
6 30 15.3 0.255 7.65
7 38 15.3 0.255 9.69
8 38 15.3 0.255 9.69
9 38 15.3 0.255 9.69
10 19 15.3 0.255 4.85
Total GPM in Manifold 2 = 82.88
Manifold 3
Riser Sprayers GPH GPM
Total
GPM
1 10 15.3 0.255 2.550
2 13 15.3 0.255 3.315
3 21 15.3 0.255 5.355
4 16 15.3 0.255 4.080
5 24 15.3 0.255 6.120
6 15 15.3 0.255 3.825
Total GPM in Manifold 3 = 25.245
Total System GPM = 174.63 GPM + 82.88 GPM + 25.245 GPM = 282.75 GPM

53
Friction Loss in Hose: Hf = 10.5 x (GPM/C)^1.852 x L x ID^-4.87
CRITICAL PATH - Manifold 1, Riser 21
Pipe Size Inside Sch./ Sec. Fric. Sec.
Sec Nominal Diameter Class Flow Length Velocity Loss Fric. Loss
(in) (in) (gpm) (ft) (ft/s) (psi/100ft)
1 3/4 0.805 Hose 0.255 18 0.16 0.03 0.00 psi
2 3/4 0.805 Hose 0.51 18 0.32 0.09 0.02 psi
3 3/4 0.805 Hose 0.765 18 0.48 0.19 0.04 psi
4 3/4 0.805 Hose 1.02 18 0.64 0.33 0.06 psi
5 3/4 0.805 Hose 1.275 18 0.80 0.50 0.09 psi
6 3/4 0.805 Hose 1.53 18 0.96 0.70 0.13 psi
7 3/4 0.805 Hose 1.785 18 1.12 0.94 0.17 psi
8 3/4 0.805 Hose 2.04 18 1.28 1.20 0.22 psi
9 3/4 0.805 Hose 2.295 18 1.44 1.49 0.27 psi
10 3/4 0.805 Hose 2.55 18 1.61 1.81 0.33 psi
11 3/4 0.805 Hose 2.805 9 1.77 2.16 0.19 psi
Desired Average Pressure 25 psi psi Pipe Friction Loss 1.51 psi
Elevation Difference 2 ft Minor Losses (10%) 0.15 psi
If spr is uphill from lateral inlet, enter a pos. # (+uphill,-downhill) 0.87 psi
If spr is downhill from lateral inlet, enter a neg. # Total Friction Loss 2.52 psi
Inlet Pres. = Ave. Pres. + k(Total Friction Loss))
+ 0.5(± Ele. diff/2.31 ft/psi) k = 0.75 for laterals using a single pipe size k = 0.75
k = 0.67 for laterals using 2 or more pipe sizes
Required Inlet Pressure 27.33 psi
SUBMAIN - Riser and 23' Section of Hose
Pipe Size Inside Sch./ Sec. Fric. Sec.
Nominal Diameter Class Flow Length Velocity Loss Fric. Loss
Sec (in) (in) (gpm) (ft) (ft/s) (psi/100ft)
1 3/4 0.805 hose 5.355 23 3.37 6.30 1.45 psi
2 3/4 0.805 hose 10.71 12 6.74 22.75 2.73 psi
Total Friction Loss 4.18 psi
CONTROL VALVES
Zone Name Flow Fric. Loss
1 PGV-ASV 1" Critical Path 6.7 gpm 1.50 psi
Total = 33.01

54
Friction Loss in Hose: Hf = 10.5 x (GPM/C)^1.852 x L x ID^-4.87
CRITICAL PATH - Manifold 1
Pipe Size Inside Sch./ Sec. Fric. Sec.
Sec Nominal Diameter Class Flow Length Velocity Loss Fric. Loss
(in) (in) (gpm) (ft) (ft/s) (psi/100ft)
1 1 1/2 1.784 c125 5.25 23 0.67 0.13 0.03 psi
2 1 1/2 1.784 c125 15.74 46 2.02 0.96 0.44 psi
3 1 1/2 1.784 c125 26.23 46 3.36 2.48 1.14 psi
4 2 1/2 2.699 c125 36.72 46 2.06 0.62 0.28 psi
5 2 1/2 2.699 c125 47.21 46 2.64 0.98 0.45 psi
6 2 1/2 2.699 c125 57.7 46 3.23 1.42 0.65 psi
7 2 1/2 2.699 c125 68.19 46 3.82 1.94 0.89 psi
8 2 1/2 2.699 c125 78.9 46 4.42 2.54 1.17 psi
9 2 1/2 2.699 c125 89.61 46 5.02 3.21 1.48 psi
10 4 4.224 c125 100.32 46 2.29 0.45 0.21 psi
11 4 4.224 c125 105.44 14 2.41 0.49 0.07 psi
12 4 4.224 c125 110.48 14 2.53 0.53 0.07 psi
13 4 4.224 c125 115.43 14 2.64 0.58 0.08 psi
14 4 4.224 c125 120.02 14 2.74 0.62 0.09 psi
15 4 4.224 c125 124.08 14 2.84 0.66 0.09 psi
16 4 4.224 c125 127.97 14 2.93 0.70 0.10 psi
17 4 4.224 c125 131.86 14 3.02 0.74 0.10 psi
18 4 4.224 c125 135.75 14 3.10 0.78 0.11 psi
19 4 4.224 c125 139.64 14 3.19 0.82 0.12 psi
20 4 4.224 c125 143.53 14 3.28 0.87 0.12 psi
21 4 4.224 c125 147.42 14 3.37 0.91 0.13 psi
22 4 4.224 c125 151.31 14 3.46 0.96 0.13 psi
23 4 4.224 c125 155.2 14 3.55 1.00 0.14 psi
24 4 4.224 c125 159.09 14 3.64 1.05 0.15 psi
25 4 4.224 c125 162.98 14 3.73 1.10 0.15 psi
26 4 4.224 c125 166.87 14 3.82 1.15 0.16 psi
27 4 4.224 c125 170.76 14 3.90 1.20 0.17 psi
28 4 4.224 c125 174.65 14 3.99 1.25 0.17 psi
Desired Average Pressure 55 psi psi Pipe Friction Loss 5.06 psi
Elevation Difference -6 ft Minor Losses (10%) 0.51 psi
If spr is uphill from lateral inlet, enter a pos. # (+uphill,-downhill) -2.60 psi
If spr is downhill from lateral inlet, enter a neg. # Total Friction Loss 2.97 psi
Inlet Pres. = Ave. Pres. + k(Total Friction Loss))
+ 0.5(± Ele. diff/2.31 ft/psi) k = 0.75 for laterals using a single pipe size k = 0.75
k = 0.67 for laterals using 2 or more pipe sizes
Required Inlet Pressure 55.93 psi

55
APPENDIX F
Irrigation System Design Drawings

56