micro focus presentation template...this presentation must not be copied, reproduced, published,...
TRANSCRIPT

Micro Focus
26 May 2020
Lender Presentation

2
DisclaimerThis presentations has been prepared solely to provide a basis for for potential providers of finance to consider whether to assist Micro Focus International PLC (“Micro Focus") and its subsidiaries (each a “Company” and together, the “Companies") with their evaluation of raising new debt facilities in connection with a potential refinancing transaction involving the Companies (the “Transaction). The existence of this presentation, the information contained within it and any information otherwise made available, whether orally or in writing, in connection herewith is confidential and is being made on the basis that the recipients keep such information confidential and use such information solely for the purposes contemplated hereby. This presentation must not be copied, reproduced, published, distributed, disclosed or passed to any other person at any time except in accordance with the confidentiality agreement entered into by you with Micro Focus in relation tothe Transaction.
This presentation is being communicated in the United Kingdom only to persons who have professional experience in matters relating to investments, i.e. investment professionals falling within the meaning of Article 19(5) of the Financial Services and Markets Act 2000 (Financial Promotion) Order 2005, as amended and to persons to whom it is otherwise lawful to distribute it. This presentation is not for publication, distribution or release, directly or indirectly, in or into or from Australia, Canada, New Zealand, Japan, South Africa, or any other state or jurisdiction in which the same would be restricted, unlawful or unauthorised. This presentation is for information purposes only and shall not constitute an offer to buy, sell, issue, or acquire, or the solicitation of an offer to buy, sell, issue, or acquire any securities.
This presentation may include material non-public information or inside information under Regulation (EU) No 596/2014 (Market Abuse Regulation) and accordingly, recipients agree not to use all or any of the Information contained in this presentation to deal, for its account or the account of any third party, directly or indirectly, in any securities of the Company (or engage in any other activity which would constitute an offence under the UK market abuse regime) before the information is made public.
This presentation may include management projections and certain other matters that may be considered “forward-looking” statements within the meaning of Section 27A of the Securities Act of 1933, as amended, and Section 21E of the Securities Exchange Act of 1934, as amended, including statements regarding the intent, belief or current expectations of the Companies and their management with respect to, among other things, future events and financial trends affecting the Companies. Forward-looking statements include, but are not limited to, statements regarding future events, plans, goals, objectives and expectations. The words “believes”, “expects”, “anticipates”, “estimates”, “plan”, “intend”, “likely”, “will,", “should”, and similar expressions are intended to identify such forward-looking statements. In addition, any statements that refer to expectations or other characterizations of future events or circumstances are forward-looking statements. Recipients are cautioned that any such management projections, estimates or other forward-looking statements are based on assumptions and estimates developed by management of the Companies, that any such forward-looking statements are not guarantees of future performance and that matters referred to in such forward-looking statements involve known and unknown risks, uncertainties and other factors which may cause actual results, performance or achievements of the Companies to be materially different from any future results, performance or achievements expressed or implied by such forward-looking statements. Such factors, risks and uncertainties include, among other things, the impact of current or pending legislation and regulation, antitrust considerations, the impact of pending or future litigation or claims, changes in general economic conditions, fluctuations in interest rates, fluctuations in exchange rates, changes in industry conditions, changes in market conditions, changes in operating performance, changes in customers’ demand for the Companies’ products and services, changes in the level of competition, technological changes and innovations, changes in governmental regulations and policies and actions of regulatory bodies, changes in tax rates and changes in capital expenditure requirements.
The information contained within this presentation has not been independently verified. No reliance may be placed, for any purpose whatsoever, on the information or opinions contained in this presentation nor on its completeness and no representation or warranty, express or implied, is given by or on behalf of any Company, or their respective directors, employees, agents or advisers as to the accuracy or completeness of the information or opinions contained in this presentation. The projections contained herein should not be regarded as a representation or warranty, express or implied, by any Company or their respective directors, employees, agents or advisors that the projected or estimated results will be achieved. To the maximum extent permitted by law, none of the Companies, their directors, officers, shareholders, advisors, employees or agents, nor any other person accepts any liability, including, without limitation, any liability arising out of fault or negligence for any loss arising from the use of the information contained in this presentation.
This presentation speaks only as at the date on which it is made, Neither the delivery of this presentation nor any further discussions of any of the Companies with any of the recipients shall, under any circumstances, create any implication that there has been no change in the affairs of the Companies since that date and the Companies do not undertake any duty to update or to correct this presentation.
The Information contained in this presentation is for information purposes only. The material and information herein is not to be shared with any other parties. The information contained in this presentation is not investment or financial product advice and is not intended to be used as the basis for making an investment decision. This presentation has been prepared without taking into account the investment objectives, financial situation or particular needs of any particular person.
Certain market data information in this presentation is based on management’s estimate. Each Company obtained the industry, market and competitive position data used throughout this presentation from internal estimates and research as well as from industry publications and research, surveys and studies conducted by third parties. However, this information may prove to be inaccurate because of the method by which each Company obtained some of the data for its estimates or because this information cannot always be verified due to the limits on the availability and reliability of raw data, the voluntary nature of the data gathering process and other limitations and uncertainties.

3
Today’s speakers
Stephen MurdochChief Executive Officer
Previously COO at Micro Focus
Prior to joining Micro Focus, Stephen held senior executive positions in general management, sales, and
strategy with IBM and Dell
Has 25 years of experience in IT industry spanning hardware, software, and services
Brian McArthur-MuscroftChief Financial Officer
Previously CFO at Paysafe led the business to listing on LSE
Prior to Paysafe CFO at Telecity, led the IPO listing
Also Interim CFO on the turnaround of MCI Worldcom EMEA
Named as Business Week’s Finance Director of the Year in 2013 and again in 2017
Rob EbreyHead of Treasury
13+ years of experience at Micro Focus
Joined Micro Focus in 2006 as Group Financial Controller
Head of Treasury since 2009
Graduated from Durham University with a Bachelors degree in Economics

Transaction Overview
Micro Focus Overview
Company Update
Key Credit Highlights
Q&A
Agenda:
4

5
Executive Summary
■ On the back of the H1 trading update announced on May 19th, Micro Focus is looking to raise €400mm
and $400mm in new 5-year Term Loan B to partially refinance its existing $1,415mm Term Loan B-2 due
November 2021
■ In addition, the company will use $150mm of available cash to partly repay the Term Loan B-2
■ Leverage neutral transaction at 3.3x pro forma net leverage (i.e. excluding IFRS 16 and consistent with
previous reporting ) with a reduction in gross debt
■ Remainder of the 2021 maturity will be refinanced through additional debt capital markets transactions,
free cash flow generated from operations and/or existing sources of liquidity
■ Following publication of FY20 interim results, the company has additional flexibility to access European and US bond
markets if required

6
Transaction overview
Pro forma capitalization
Sources and uses
Sources $mm Uses $mmNew TLB (€) 4401 Partially Refinance TLB-2 due 2021 840New TLB ($) 400 Partly Repay TLB-2 due 2021 150Cash and cash equivalents 150Total sources 990 Total uses 990
As of Apr-20 Adjustment Pro forma$mm x LTM EBITDA $mm $mm x LTM EBITDA Maturity Margin / Floor
Estimate2
Cash and cash equivalents (805) 150 (655)Unamortized debt financing costs3 (81) (81)RCF ($500mm) 175 175 2022 L+325bps / 0%New TLB (€) - 440 440 2025 E+450bps / 0% New TLB ($) - 400 400 2025 L+450bps / 1%TLB-2 (MA FinanceCo, $) 1,415 (990) 425 2021 L+225bps / 0%TLB (MA FinanceCo, €) 492 492 2024 E+275bps / 0%TLB-3 (MA FinanceCo, $) 368 368 2024 L+250bps / 0%TLB (Seattle SpinCo, $) 2,486 2,486 2024 L+250bps / 0%Other (finance leases) 21 21
Total gross debt 4,957 4.08x 4,807 3.95x
Total net debt 4,071 3.35x 4,071 3.35x
LTM April-20E PF Adj. EBITDA 1,216 1,216
Notes: (1) Based on EUR:USD of 1.10; (2) Estimated numbers based on 19 May trading update. Numbers in this statement were reported in billions to 2dp and as such may be subject to rounding in this document; (3) Relates to loan arrangement costs for Term Loans and RCF which are netted from gross debt in line with IFRS

7
Summary terms and conditionsTerm Loan B
Borrower MA Finance Co.
Currency EUR USD
Amount €400mm $400MM
Use of proceeds Refinancing of existing debt
Ranking and security Senior Secured
Maturity 2025
Repayment 2.5% per annum
Margin E+450bps L+450bps
Floor 0.00% 1.00%
Call protection NC1, 102
Maintenance covenants None (as existing)
Other termsLargely in line with existing term loans, with share buybacks and special dividends governed by 3.0x Senior
Secured Net Leverage Ratio
Governing law New York law
8
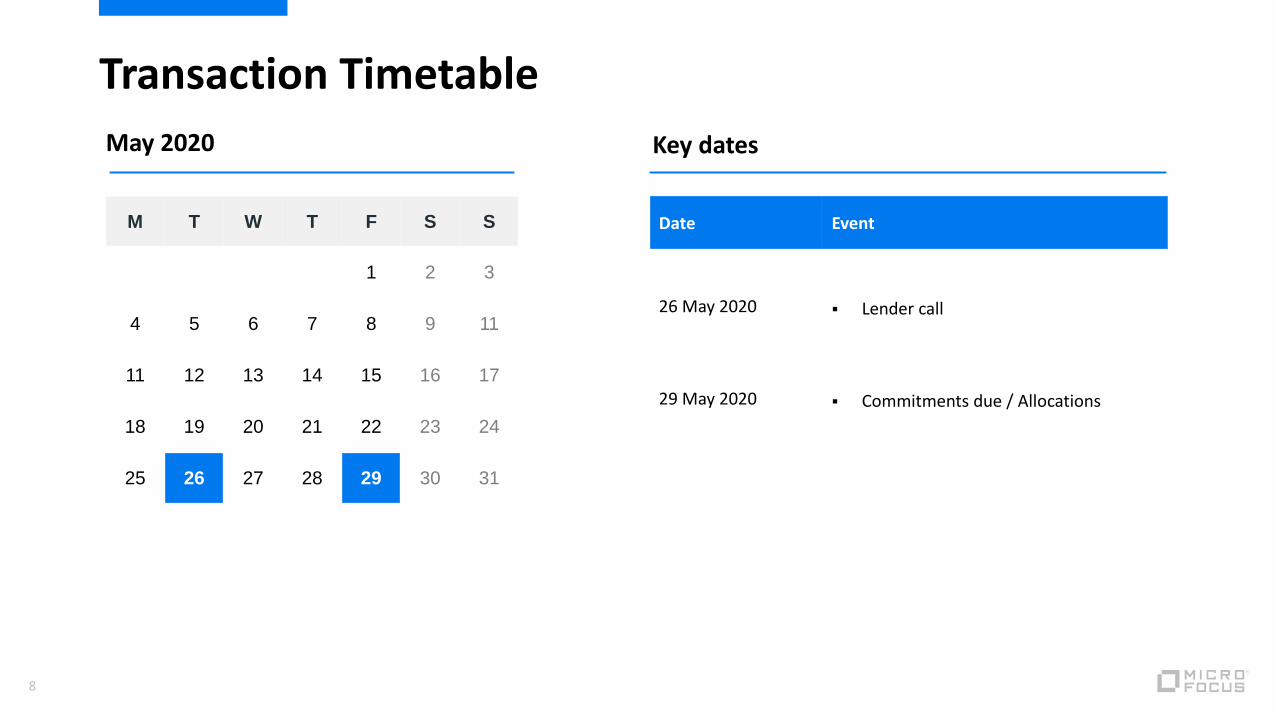
Transaction Timetable
Date Event
26 May 2020 Lender call
29 May 2020 Commitments due / Allocations
May 2020
M T W T F S S
1 2 3
4 5 6 7 8 9 11
11 12 13 14 15 16 17
18 19 20 21 22 23 24
25 26 27 28 29 30 31
Key dates

1. Micro Focus Overview
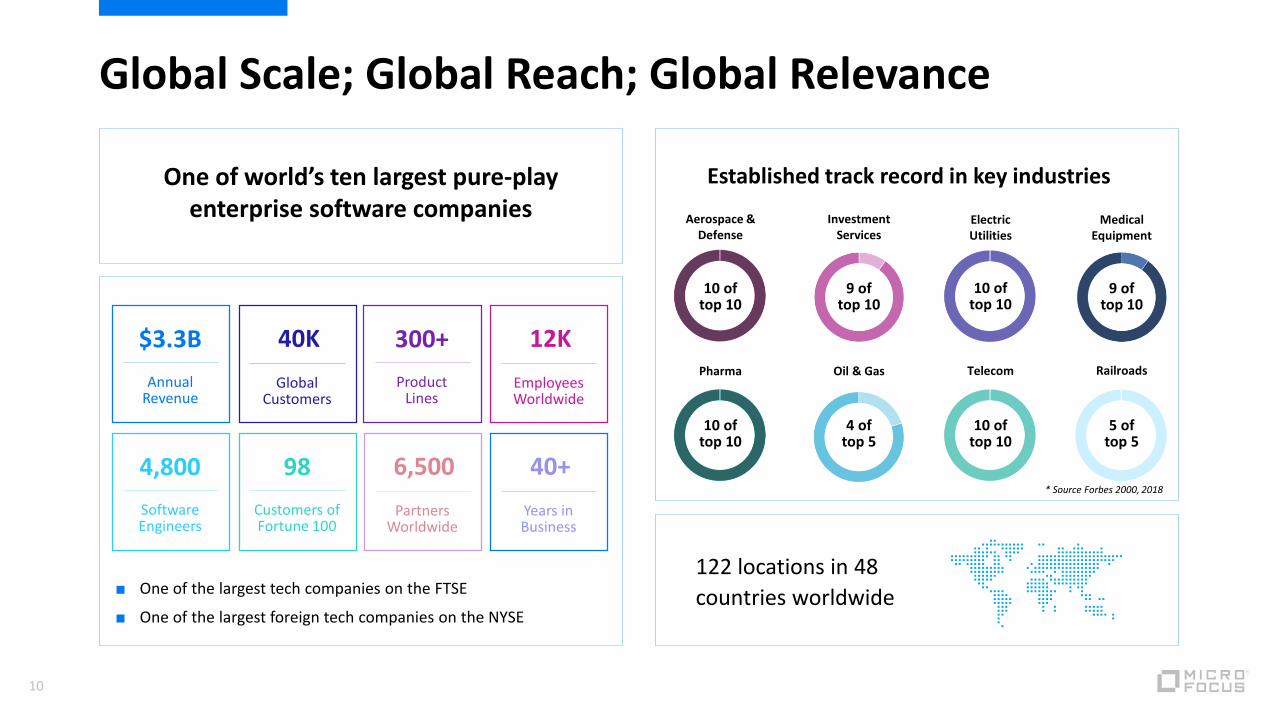
Global Scale; Global Reach; Global Relevance
Aerospace & Defense
10 of top 10
Pharma
10 of top 10
Investment Services
9 of top 10
Oil & Gas
4 of top 5
Electric Utilities
10 of top 10
Telecom
10 of top 10
Medical Equipment
9 of top 10
Railroads
5 of top 5
* Source Forbes 2000, 2018
Established track record in key industries
122 locations in 48
countries worldwide
One of world’s ten largest pure-play enterprise software companies
■ One of the largest tech companies on the FTSE
■ One of the largest foreign tech companies on the NYSE
$3.3B
Annual Revenue
40K
Global Customers
300+
Product Lines
12K
Employees Worldwide
4,800
Software Engineers
6,500
Partners Worldwide
98
Customers of Fortune 100
40+
Years in Business
10

HBR March 2018
Why Do So Many High-Profile Digital Transformations Fail?
“Not hard-wired into business strategy and
key processes…”
“Executives spent too much time on the new and ignore the rest…”

The reality for customers is a complex hybrid landscape
Internetof
Things(IoT)
That spans mainframe, mobile, on-premise, off-premise or hybrid
z / OSPL / I
COBOL
CICS
IMS
PublicCloud Private
Cloud
CORBA
IaaS
PaaS
12

Micro Focus’s innovation is designed to help corporates enable Digital Transformation
Enterprise DevOps
Hybrid IT Management
Security, Risk & Governance
Predictive Analytics
Speed
Security
Insights
AgilityEnabled by…
We allow you to deliver…
13

2. Company Update

■ Micro Focus delivers mission-critical enterprise software which as such is essential for to our customers businesses
■ Business continuity plans have been thoroughly tested and are proving robust
■ We have more than 90% of our people working from home and supporting our customers effectively and are proud of the commitment and determination of our teams in making this transition as seamless as possible despite the challenges
■ Our primary focus remains the health and safety of our employees and delivering for our customers and partners
■ Since the lockdown, the Company has undertaken a pulse survey of all staff which had a record response rate and scores following the companies response to the pandemic
Micro Focus response to COVID

16
Trading update for H1 FY20
■ Expect to report revenue of $1.45bn for the first half (CCY decline of approximately 11%)
■ Consistent with original guidance and COVID-19 update 18 March 2020
■ The identifiable impact of Covid-19 is estimated to be at least 2% decline on revenues in the period
■ The Group identified a slowdown in customer buying behaviour in April 2020 leading to the deferral of specific projects involving new licence and services revenues, as well as delays to some maintenance renewals
■ Impact of revenue reduction at Adjusted EBITDA level has been largely mitigated
■ Driven by close management of variable and discretionary costs
■ Adjusted EBITDA margin (after IFRS 16) of approximately 38% in the period was towards the upper end of our expectations
■ Total available liquidity of $1.1bn including revolver at 30 April 2020

17
Potential financial impact of COVID-19
■ Micro Focus delivers mission-critical enterprise software to over 40,000 customers. The majority of our revenues are contractual and recurring in nature and the resilience this affords can be seen in the company’s ability to generate cash and manage costs to partly mitigate revenue weakness
■ Despite this resilience, the ultimate impact on the global economy remains unknown, as does the timing and extent to which that impact flows through into customer spending plans on enterprise software
■ As a minimum, we continue to believe it appropriate to be prepared for a level of disruption to our new sales activity and timing pressure on renewals
■ Similar to most companies, we have removed formal revenue guidance for FY20. In addition, we are evaluating the potential impact on the carrying value of our intangible assets and goodwill
■ The company has reacted quickly to ensure a balanced approach to mitigating the immediate risks whilst continuing to make progress on the actions taken as a result of the Strategic and Operational Review
■ The investments outlined as part of that review are broadly continuing as planned
■ Outside of these investments, mitigating actions including a hiring freeze in all but exceptional circumstances, as well as reductions in all discretionary spending, are now in place
■ The Group is prepared to implement further actions in reducing costs, in the event the pandemic has a prolonged impact on trading performance
18
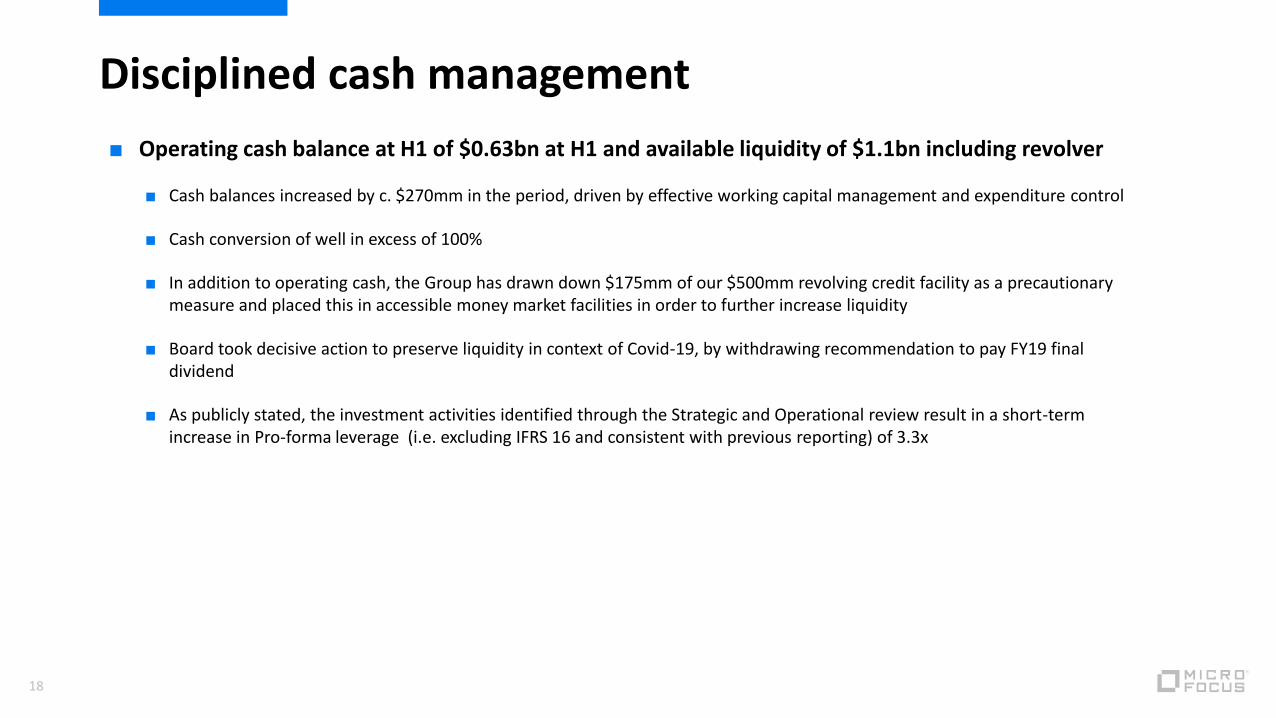
Disciplined cash management
■ Operating cash balance at H1 of $0.63bn at H1 and available liquidity of $1.1bn including revolver
■ Cash balances increased by c. $270mm in the period, driven by effective working capital management and expenditure control
■ Cash conversion of well in excess of 100%
■ In addition to operating cash, the Group has drawn down $175mm of our $500mm revolving credit facility as a precautionary measure and placed this in accessible money market facilities in order to further increase liquidity
■ Board took decisive action to preserve liquidity in context of Covid-19, by withdrawing recommendation to pay FY19 final dividend
■ As publicly stated, the investment activities identified through the Strategic and Operational review result in a short-term increase in Pro-forma leverage (i.e. excluding IFRS 16 and consistent with previous reporting) of 3.3x

3. Key Credit Highlights

Micro Focus key credit highlights
* Cash flow includes SUSE for 4 months in FY19 until disposal
20
Sustained cash flow generation and disciplined approach to financial policy
A player of scale in the global enterprise software market
Highly diversified and recurring revenue base
■ Global software company supporting 40k customers
■ No revenue concentration by geography or end market with c.70% recurring revenues
■ Free Cash Flow* $576m in FY19 after incurring exceptional costs
Disciplined cash management Working capital management group delivering
tight working capital control and cash management
1
5
2
4
3
Full suite of products across critical IT infrastructure for corporates today
■ Supporting mission critical business processes, with balanced revenue generation across five product groups and over 300 business lines

Q&A

Appendix – FY19 Financial performance

■ Revenue declined 7.3% period-on-period on a CCY basis
for the twelve months to 31 October 2019.
■ Licence revenue decline of 7.2% in FY19 is less than the
FY18 decline of 12.8%.
■ Decline in maintenance revenue was impacted by one
off events including the disposal of Atalla and selling to
the US Government via a strategic partner rather than
direct. Restating for these two items maintenance
revenue decline would have been 4.7% (FY19 actual:
6.2%). See appendix 3 for further detail.
■ SaaS and other recurring and Consulting revenue
accounts for 2.6ppts of the overall decline.
■ Adjusted EBITDA margin increase of 2.0 ppt to 40.7% in
the twelve months ended 31 October 2019.
■ Diluted adjusted Earnings per share from continuing
operations of 195.89 cents - an increase of 4.5%
primarily driven by a lower share count.* Diluted adjusted EPS from continuing operations
23
FY19 FY18 Change %Reported CCY
Licence 800.0 862.4 (7.2%)
Maintenance 2,057.6 2,193.7 (6.2%)
SaaS and other recurring 279.7 314.8 (11.1%)
Consulting 217.9 277.7 (21.5%)
Constant currency revenue (before haircut)
3,355.2 3,648.6 (8.0%)
Deferred revenue haircut (6.8) (34.7) (80.4%)
Constant currency revenue 3,348.4 3,613.9 (7.3%)
Total constant currency costs (1,985.9) (2,214.4) (10.3%)
Constant currency adjusted EBITDA 1,362.5 1,399.5 (2.6%)
Constant currency adjusted EBITDA margin % 40.7% 38.7% 2.0 ppt
Per share data presented at Actual rates
Diluted adjusted EPS (cents)* 195.89 187.51 4.5%
Dividend per share (cents) 116.66 100.84 15.7%
Historical financial performance (1 of 2)

FY19 FY18 Change %Reported Reported
Exceptional spend (at actual rates)
System related spend ($m) 126.3 114.4 10.4%
Other integration costs ($m) 168.0 293.5 (42.8%)
Total HPE Software related exceptional spend 294.3 407.9
(27.8%)
Other ($m) * (0.1) 31.8 (100.3%)
Total (reported in operating profit) 294.2 439.7 (33.1%)
Adjusted cash conversion ** 95.3% 105.7% (10.4)ppt
Free cash flow ($m) ** 576.2 755.6 (23.7%)
Net debt ($m) 4,338.5 4,253.5 2.0%
Net debt to Adjusted EBITDA ratio *** 3.2x 2.8x 0.4x
■ HPE Software related actual exceptional charge of
$294.3m. Total HPE software exceptional forecast
spend still on target at $960M assuming delivery of
systems project to current schedule.
■ In the twelve months to 31 October 2019 adjusted cash
conversion of 95.3% and free cash flow of $576.2m.
Long term adjusted cash conversion target range
remains 95-100%.
■ Underlying free cash flow of c. $700-800m due to
tailwind of the end of exceptional costs partially offset
by tax increases.
■ Net debt of $4,338.5m and period end gearing of 3.2x
Adjusted EBITDA. Further gearing analysis presented
later in this section. * Other is net of costs and revenue.** Cash flow includes results for SUSE for entire period in FY18 but for only 4 months in FY19.*** Adjusted EBITDA for FY19 is for continuing operations only, the
comparatives include the discontinued operation.
24
Historical financial performance (2 of 2)

$1,402.5m
■ We continued to be a highly cash generative business in
FY19.
■ Improvement in collection of overdue trade
receivables, which de-risked the balance sheet, offset
by timing differences of exceptional cash costs and
deferred revenue.
■ Increase in tax payments of $88.4m in FY19 as we
continue to utilise tax attributes acquired with HPE
Software.
■ Low capex since all R&D expensed through EBIDTA.
■ Underlying interest cover is c. 4.5-5.0x before dividend
and after capex.*Cash flow and Adjusted EBITDA includes results for SUSE for entire period in FY18 but for only 4 months in FY19.
25
FY19 FY18
Cash generated from operations before working capital 1,177.5 1,191.2
Movement in working capital (121.2) (39.6)
Cash generated from operations 1,056.3 1,151.6
Interest payments (227.1) (219.5)
Bank loan costs 0.0 (10.8)
Tax payments (167.4) (79.0)
Purchase of intangible assets (29.3) (56.5)
Purchase of property, plant and equipment (56.3) (30.2)
Free cash flow 576.2 755.6
Adjusted cash conversion % * 95.3% 105.7%
Cash flow summary

Highly Diversified Global Revenue Streams with recurring revenue base
52%
37%
11%
InternationalUS$1,233
15%
22%
30%
20%
13%North America
US$1,743
APAC & JapanUS$379
24%
61%
7%
8%
70% recurring revenues
Total revenue: $3.4bn
AMCUS$508
ADMUS$722
ITOMUS$1,022
SecurityUS$681
IM&GUS$422
LicenceUS$800
MaintenanceUS$2,058
ConsultancyUS$218
SubscriptionUS$280
Source: Company filings, Gartner, industry researchNote: Recurring revenue consists of Maintenance and Subscriptions (Micro Focus) or Support and SaaS (HPE Software)1 Micro Focus FY19 results – revenue before haircut
26
Geography FY2019 US$mm1 Business FY2019 US$mm1 Recurring revenue FY2019 US$mm1
2&3

Micro Focusproduct portfolio
IT Operations Management Application Delivery
Management Security
Application Modernization & Connectivity
Information Management & Governance
Gartner categorization ITOM DevOps Security Mainframe Other
Revenue ($) / (%) Total: $3,3551 $1,022m / 30% $722m / 22% $681m / 20% $509m / 15% $422m / 13%
Revenue Split
Growth (%)1,2 (10.1%) (5.6%) (9.3%) (2.2%) (11.4%)
Overview
■ IT Operations Management product group provides the software required to automate routine IT tasks, helping enterprises reduce costs and improve the reliability of applications running in a traditional, cloud or hybrid environment
■ Enables programmers to develop applications across multiple platforms
■ Enables the use of centralized applications to end-users across different environments
■ Provides comprehensive solutions that span security and risk management
■ Facilitate secure access by using identity information
■ Increased compliance / regulation, expansion and diversity of cyber threats and resultant financial impact
■ COBOL Development products enable programmers to develop applications written in COBOL across multiple platforms
■ Mainframe solutions products let customers maximize value out of their mainframe
■ Brings people, projects and processes together in a secure environment
■ Core products include email, calendaring, contact management, solutions for file & print / storage of enterprise files
Select products
■ PlateSpin■ SiteScope■ Data Protector■ VM Explorer■ Serena Business Manager■ Silk■ OpsBridge
■ Serena Distributed (excluding Serena Business Manager)
■ AppPulse■ Mercury■ VM Explorer
■ Net IQ■ ZENworks■ Sentinel■ ArcSight■ Voltage■ Fortify
■ COBOL■ Rumba■ CORBA■ Reflection■ Serena Mainframe
■ IDOL ■ Vertica■ OES■ GroupWise
SubscriptionLicence Maintenance Consulting
Micro Focus offers a full suite of products across critical IT infrastructure for corporates today
Micro Focus provides a fast, low-risk path to digital transformationSource: Company filings, Gartner, industry research1 Micro Focus FY19 results – revenue before haircut; 2 Constant currency change to FY18
27
23%
63%
1%
12%
18%
67%
12%
3%
27%
61%
5%
6%
34%
64%
2%
18%
44%
35%
4%
Recurring

Cash generated from operations 1,056 1,152
Adjusted EBITDA 1,403 1,530
Less: exceptional items (reported in Operating Profit) (294) (440)
Adjusted EBITDA less exceptional items 1,108 1,090
Adjusted cash conversion %1 95.3% 105.7%
Sustained cash flow generation of over US$500m (after exceptional costs)(US$m) FY19A FY18A
Cash generated from operations before working capital 1,178 1,191
Movement in working capital (121) (40)
Cash generated from operations 1,056 1,152
Interest paid (227) (220)
Bank fees paid 0 (11)
Tax paid (167) (79)
Capex and intangibles (86) (87)
Free cash flow (after exceptional costs) 576 756
Source: Company filings1 Cash flow and Adjusted EBITDA includes results for SUSE for entire period in FY18 but for only four months in FY19
28
FY18: Adjusted for SUSE impact ($76m)
and lower tax payments in year
($79m vs $167m in FY19) FCF is
relatively flat across both years

* The prior year comparatives have been restated to reflect the reorganisation of the LATAM operations from North America (previously named the “Americas”) to International (previously named “EMEA”). This restatement ensures consistent revenue trend reporting.29
$m Licence Maintenance
SaaS and
other
recurring
Consulting Total Licence Maintenance
SaaS and
other
recurring
Consulting Total
AMC 170.9 326.1 - 11.7 508.7 (5.1%) (0.6%) 0.0% (1.4%) (2.2%)ADM 130.3 485.4 87.8 18.2 721.7 (4.2%) (3.3%) (8.1%) (41.9%) (5.6%)ITOM 237.5 645.8 11.0 127.5 1,021.8 (3.9%) (11.1%) (22.0%) (14.6%) (10.1%)Security 185.7 416.7 35.0 43.9 681.3 (13.1%) (5.4%) (0.8%) (29.0%) (9.3%)IM&G 75.6 183.6 145.9 16.6 421.7 (11.7%) (6.8%) (14.1%) (29.2%) (11.4%)Revenue before haircut 800.0 2,057.6 279.7 217.9 3,355.2 (7.2%) (6.2%) (11.1%) (21.5%) (8.0%)
Haircut 0.0 (6.0) (0.8) 0.0 (6.8) n/a (78.6%) (84.6%) (100.0%) (80.4%)Revenue 800.0 2,051.6 278.9 217.9 3,348.4 (7.2%) (5.3%) (9.9%) (21.1%) (7.3%)
North America 385.8 1,074.0 206.1 77.2 1,743.1 0.6% (9.4%) (11.7%) (32.1%) (9.0%)International 295.0 766.0 59.9 112.3 1,233.2 (18.4%) (3.2%) (7.3%) (12.6%) (8.4%)Asia Pac & Japan 119.2 217.6 13.8 28.4 378.9 1.3% 0.2% (18.3%) (20.2%) (2.1%)Revenue before haircut 800.0 2,057.6 279.7 217.9 3,355.2 (7.2%) (6.2%) (11.1%) (21.5%) (8.0%)Haircut 0.0 (6.0) (0.8) 0.0 (6.8) n/a (78.6%) (84.6%) (100.0%) (80.4%)
Revenue 800.0 2,051.6 278.9 217.9 3,348.4 (7.2%) (5.3%) (9.9%) (21.1%) (7.3%)
FY19 CCY % change to FY18 (restated*)
Revenue by product portfolio and region