micro fabrication of biodegradable polymer drug delivery devices
TRANSCRIPT
General rights Copyright and moral rights for the publications made accessible in the public portal are retained by the authors and/or other copyright owners and it is a condition of accessing publications that users recognise and abide by the legal requirements associated with these rights.
Users may download and print one copy of any publication from the public portal for the purpose of private study or research.
You may not further distribute the material or use it for any profit-making activity or commercial gain
You may freely distribute the URL identifying the publication in the public portal If you believe that this document breaches copyright please contact us providing details, and we will remove access to the work immediately and investigate your claim.
Downloaded from orbit.dtu.dk on: Jan 31, 2019
Micro fabrication of biodegradable polymer drug delivery devices
Nagstrup, Johan
Publication date:2013
Document VersionPublisher's PDF, also known as Version of record
Link back to DTU Orbit
Citation (APA):Nagstrup, J. (2013). Micro fabrication of biodegradable polymer drug delivery devices. Kgs. Lyngby: TechnicalUniversity of Denmark (DTU).
Ph.D Thesis
Micro fabrication of biodegradablepolymer drug delivery devices.
Johan Nagstrup
January 2013
DTU Nanotech - Department of Micro- and NanotechnologyTechnical University of Denmark

ii
iii
Abstract
The pharmaceutical industry is presently facing several obstacles in developing oral drugdelivery systems. This is primarily due to the nature of the discovered drug candidates.The discovered drugs often have poor solubility and low permeability across the gastrointestinal epithelium. Furthermore, they are often degraded before they can be absorbed.The result is low bioavailability of the drugs. To overcome these challenges, better drugdelivery systems need to be developed. Recently, micro systems have emerged as promisingcandidates to solve the challenges of poor solubility, low permeability and degradation.These systems are for the majority based on traditional materials used in micro technology,such as SU-8, silicon, poly(methyl methacrylate). The next step in developing these newdrug delivery systems is to replace classical micro fabrication materials with biodegradablepolymers. In order to successfully do this, methods for fabricating micro structures inbiodegradable polymers need to be developed.The goal of this project has been to develop methods for micro fabrication in biodegradablepolymers and to use these methods to produce micro systems for oral drug delivery. Thishas successfully been achieved by fabrication of micro container systems made of poly(L-lactic acid) and polycaprolactone.To achieve this, polymer solutions have been developed using the theory of Hansen’ssolubility parameters. The solutions are used to fabricate polymer films by spin coating,which are used in the fabrication of micro devices for oral drug delivery. Films consistingof both polymer and pharmaceuticals have also been developed by spin coating. A deepreactive ion etch producing sloped sidewalls for stamp production has been developed.The sloped sidewalls ensure a successful separation of stamp and film after patterning.Large scale methods for filling of micro reservoirs based on embossing, screen printing andsolvent casting have been developed.In vitro drug release experiments on both type of micro devices have been performed.The experiments show that most of the drug is released from the developed devices.Additionally, it has been shown that it is possible to control the release of drug by addingpolymeric coatings.

iv
v
Dansk resume
Den farmaceutiske industri star i øjeblikket over for flere forhindringer, nar de udviklermedicin administreret oralt, primært pa grund af typen af lægemiddelkandidaterne. Lægemi-dlerne er ofte svært opløselige og har en lav permeabilitet i gastrointestinalt epithel. Desu-den nedbrydes de ofte, før de bliver absorberet. Resultatet er en lav biotilgængelighed aflægemidlerne. For at overvinde disse udfordringer, er det nødvendigt at udvikle mediciner-ingssystemer.For nylig er mikrosystemer kommet frem som kandidater til at løse problemerne. Størstedelenaf disse systemer er baseret pa materialer, der ofte anvendes i mikroteknologi, sasom SU-8, silicium, poly(methyl methacrylate). Det næste skridt i udviklingen af nye mediciner-ingssystemer er at erstatte klassiske mikrofabrikationsmaterialer med bionedbrydelige poly-merer. For at kunne gøre dette, skal der udvikles metoder til at fremstille mikrostruktureri bionedbrydelige polymerer.Malet med dette projekt har været at udvikle metoder til mikrofabrikation af bionedbry-delige polymerer og at anvende disse metoder til at fremstille systemer, der kan brugestil oral medicinering. Dette er opnaet ved fremstilling af mikrocontainere lavet af poly(L-lactid acid) og polycaprolactone. Endvidere er et mikrosystem baseret pa stablede lagaf polymer og lag af polymer blandet med medicin fremstillet.For at fremstille mikrosystemerne, er polymeropløsninger blevet udviklet ud fra Hansensteori om opløselighedsparametre. Opløsningerne bruges til fremstilling af polymerfilm vedspin-coating. Disse film benyttes ved fremstilling af mikrosystemer til oral medicinering.En film, som bestar af bade af polymer og lægemiddel, er desuden ogsa blevet udvikletved spin-coating.Dybe reaktive ion ætse, der producerer skra sidevægge til stempel produktionen, er blevetudviklet. De skranende sidevægge sikre en vellykket adskillelse af stempel og film efterstempling. Metoder til fyldning af mikroreservoirer er blevet udviklet. Disse er baseret paprægning, silketryk og solvent støbning.Der er udført in vitro lægemiddelfrigivelsesforsøg pa begge mikrosystemer. Disse viser, atnæsten al lægemidlet frigives fra systemerne. Endvidere har det vist sig, at det er muligtat kontrollere frigivelsen af lægemidlet ved tilsætning af polymerbelægninger.
vi
Preface
This thesis is carried out at DTU Nanotech, Department of Micro and Nanotechnology, atthe Technical University of Denmark, DTU. The thesis is carried out in the Nanoprobesgroup under the supervision of Professor Anja Boisen and Assistant Professor StephanSylvest Keller. The project started on the 1st of December 2009 and was finished on the31st of January 2013.
Kongens Lyngby, January 31st 2013
Johan Nagstrup
DTU Nanotech - Department of Micro- and NanotecnologyTechnical University of Denmark
DTU - Building 345 eastDK-2800 Kongens Lyngby
Denmark
vii
Acknowledgements
I would like to thank my supervisors Professor Anja Boisen and Associate ProfessorStephan Sylvest Keller for guidance, support and feedback. I would like to acknowl-edge Professor Kristoffer Almdal for his help on several topic and especially his help onpolymer related topics, Professor Thomas Rades and Associate Professor Anette Mullertzfor their support on pharmaceutical topics. Thanks to the laboratory technicians andprocess specialists at Danchip, especially process specialist Jonas Michael Lindhard forhis help with DRIE and SEM related questions. I would like to thank the entire NAMECteam for a great working environment and support during the thesis. Finally I would liketo thank the rest of the Nanoprobes group for guidance on different subjects and a lot ofgood times.

viii
Contents
1 Introduction 1
1.1 NAMEC project & vision . . . . . . . . . . . . . . . . . . . . . . . . . . . . 1
1.2 Device . . . . . . . . . . . . . . . . . . . . . . . . . . . . . . . . . . . . . . . 2
1.3 Goal of the PhD . . . . . . . . . . . . . . . . . . . . . . . . . . . . . . . . . 3
1.4 Model drug . . . . . . . . . . . . . . . . . . . . . . . . . . . . . . . . . . . . 3
1.5 Review of existing research . . . . . . . . . . . . . . . . . . . . . . . . . . . 3
1.6 Novelty . . . . . . . . . . . . . . . . . . . . . . . . . . . . . . . . . . . . . . 6
1.7 Thesis outline . . . . . . . . . . . . . . . . . . . . . . . . . . . . . . . . . . . 7
2 Polymers 9
2.1 Solubility theory . . . . . . . . . . . . . . . . . . . . . . . . . . . . . . . . . 9
2.2 Biopolymers . . . . . . . . . . . . . . . . . . . . . . . . . . . . . . . . . . . . 13
2.3 Solutions . . . . . . . . . . . . . . . . . . . . . . . . . . . . . . . . . . . . . 14
2.4 Polymer films . . . . . . . . . . . . . . . . . . . . . . . . . . . . . . . . . . . 15
2.5 Summary . . . . . . . . . . . . . . . . . . . . . . . . . . . . . . . . . . . . . 18
3 Polymer drug matrix 19
3.1 Solvent-polymer-drug interaction . . . . . . . . . . . . . . . . . . . . . . . . 19
3.2 Drug matrix characterization . . . . . . . . . . . . . . . . . . . . . . . . . . 23
3.3 Summary . . . . . . . . . . . . . . . . . . . . . . . . . . . . . . . . . . . . . 27
4 Stamps 29
4.1 Fabrication . . . . . . . . . . . . . . . . . . . . . . . . . . . . . . . . . . . . 29
4.2 SU-8 stamps . . . . . . . . . . . . . . . . . . . . . . . . . . . . . . . . . . . 30
4.3 Silicon . . . . . . . . . . . . . . . . . . . . . . . . . . . . . . . . . . . . . . . 32
4.4 Nickel . . . . . . . . . . . . . . . . . . . . . . . . . . . . . . . . . . . . . . . 34
4.5 Stamp comparison . . . . . . . . . . . . . . . . . . . . . . . . . . . . . . . . 35
4.6 DRIE process development . . . . . . . . . . . . . . . . . . . . . . . . . . . 36
4.7 summary . . . . . . . . . . . . . . . . . . . . . . . . . . . . . . . . . . . . . 41
5 Micro containers 43
5.1 SU-8 micro containers . . . . . . . . . . . . . . . . . . . . . . . . . . . . . . 43
5.2 Biodegradable polymer containers . . . . . . . . . . . . . . . . . . . . . . . 46
5.3 Fabrication technologies . . . . . . . . . . . . . . . . . . . . . . . . . . . . . 46
ix
x CONTENTS
5.4 Comparison of methods . . . . . . . . . . . . . . . . . . . . . . . . . . . . . 485.5 Hot embossing . . . . . . . . . . . . . . . . . . . . . . . . . . . . . . . . . . 495.6 PLLA containers . . . . . . . . . . . . . . . . . . . . . . . . . . . . . . . . . 505.7 PCL containers . . . . . . . . . . . . . . . . . . . . . . . . . . . . . . . . . . 535.8 Summary . . . . . . . . . . . . . . . . . . . . . . . . . . . . . . . . . . . . . 54
6 Container filling 576.1 Embossing . . . . . . . . . . . . . . . . . . . . . . . . . . . . . . . . . . . . . 576.2 Screen printing . . . . . . . . . . . . . . . . . . . . . . . . . . . . . . . . . . 606.3 Solvent casting . . . . . . . . . . . . . . . . . . . . . . . . . . . . . . . . . . 626.4 Comparison . . . . . . . . . . . . . . . . . . . . . . . . . . . . . . . . . . . . 656.5 Summary . . . . . . . . . . . . . . . . . . . . . . . . . . . . . . . . . . . . . 66
7 Drug delivery 677.1 Dissolution . . . . . . . . . . . . . . . . . . . . . . . . . . . . . . . . . . . . 677.2 Drug matrix . . . . . . . . . . . . . . . . . . . . . . . . . . . . . . . . . . . . 707.3 Micro containers . . . . . . . . . . . . . . . . . . . . . . . . . . . . . . . . . 737.4 UV imager experiment . . . . . . . . . . . . . . . . . . . . . . . . . . . . . . 757.5 Summary . . . . . . . . . . . . . . . . . . . . . . . . . . . . . . . . . . . . . 77
8 Conclusion 79
9 Outlook 83
Bibliography 85
Appendices 92

Chapter 1
Introduction
Oral delivery is often the preferred route of drug administration since it provides goodcompliance for the patients and no need for health professionals. However, the phar-maceutical industry is presently facing several obstacles when developing oral deliverysystems, primarily due to the nature of the discovered drug candidates. Generally drugcandidates can be divided into two categories; small molecules and biological compounds.The discovered active small molecules often have a poor solubility and a low permeabil-ity across the gastro intestinal (GI) epithelium. Biological compounds, like proteins andnucleic acids, are degraded in the GI tract and have a poor permeability. Both typesof compounds therefore require development of special drug delivery systems to reach asatisfactory oral bioavailability.Traditionally, oral drug delivery is based on compressed tablets and capsules. Recently,micro and nano particles as well as micro systems have emerged as possible drug carriersthat can solve the challenges described above [1, 2]. The aim of the project is to developand improve such micro systems for drug delivery. The PhD study is carried out as partof a larger consortium, NAnoMEChanical sensors and actuators, fundamentals and newdirections (NAMEC) - a VKR Centre of Excellence, working on micro systems for oraldrug delivery among other technologies such as sensors. The main collaborators for theoral drug delivery project consist of engineers from the Department of Micro and Nan-otechnology (DTU Nanotech), at the Technical University of Denmark and pharmacistsfrom the Department of Pharmaceutics and Analytical Chemistry at the University ofCopenhagen (KU Farma). The following sections will explain the vision of the NAMECdrug delivery project as well as introduce the collaborating parties and the main tasks setforth for each party.
1.1 NAMEC project & vision
The main goal of the drug delivery project in NAMEC is to realize and characterize microsystems for oral administration of drug. It is the vision of this project to develop a generaldrug delivery system that can deal with the challenges described above no matter whichkind of drug the system carries. The system should have a protective shell around the
1
2 CHAPTER 1. INTRODUCTION
drug to protect the drug from degradation in the stomach. Technologies controlling therelease should be developed to control the release kinetics such as time and position. Thesystem should adhere to the intestinal epithelial surface and release the drug unidirectionalacross the epithelial cell surface to increases the drug uptake. Ideally, this should preventdrug from passing through the gastrointestinal tract without being absorbed. Formula-tions aiding the dissolution and enhancing the permeability across the gastro intestinalepithelium should be developed. Additionally, the devices should be easy to swallow toincrease patient compliance.
1.2 Device
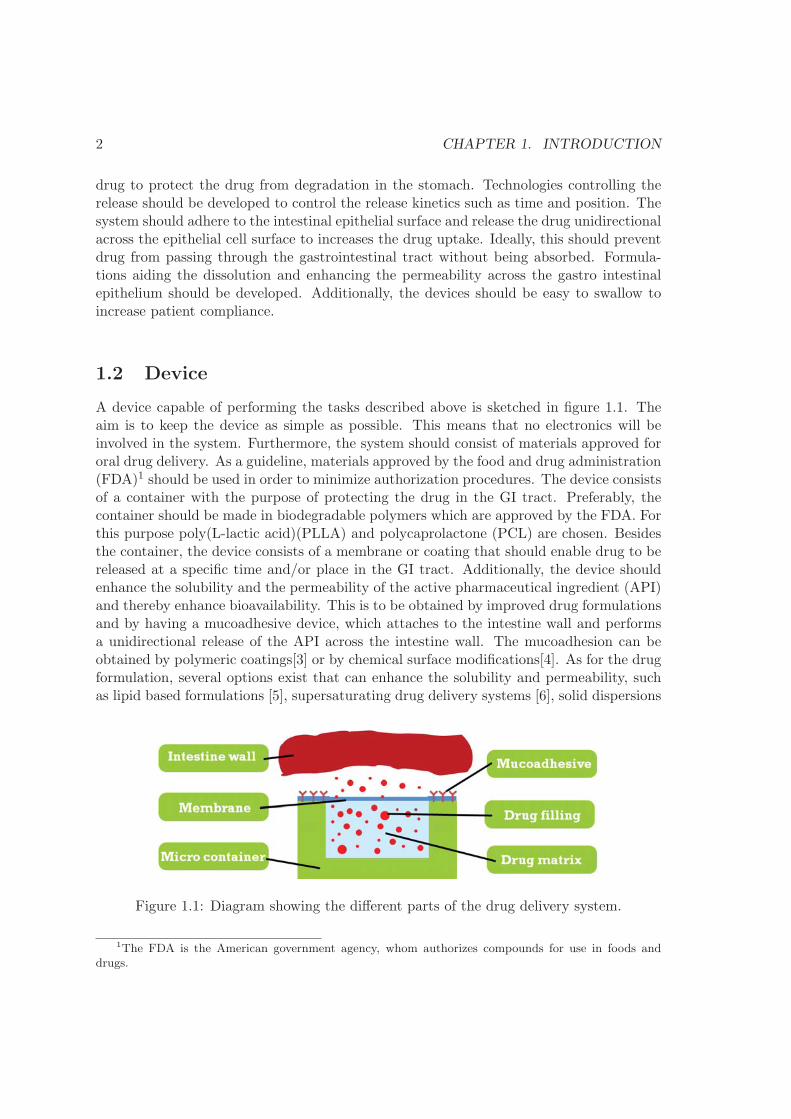
A device capable of performing the tasks described above is sketched in figure 1.1. Theaim is to keep the device as simple as possible. This means that no electronics will beinvolved in the system. Furthermore, the system should consist of materials approved fororal drug delivery. As a guideline, materials approved by the food and drug administration(FDA)1 should be used in order to minimize authorization procedures. The device consistsof a container with the purpose of protecting the drug in the GI tract. Preferably, thecontainer should be made in biodegradable polymers which are approved by the FDA. Forthis purpose poly(L-lactic acid)(PLLA) and polycaprolactone (PCL) are chosen. Besidesthe container, the device consists of a membrane or coating that should enable drug to bereleased at a specific time and/or place in the GI tract. Additionally, the device shouldenhance the solubility and the permeability of the active pharmaceutical ingredient (API)and thereby enhance bioavailability. This is to be obtained by improved drug formulationsand by having a mucoadhesive device, which attaches to the intestine wall and performsa unidirectional release of the API across the intestine wall. The mucoadhesion can beobtained by polymeric coatings[3] or by chemical surface modifications[4]. As for the drugformulation, several options exist that can enhance the solubility and permeability, suchas lipid based formulations [5], supersaturating drug delivery systems [6], solid dispersions
Figure 1.1: Diagram showing the different parts of the drug delivery system.
1The FDA is the American government agency, whom authorizes compounds for use in foods anddrugs.
1.3. GOAL OF THE PHD 3
[7], amorphous drug formulations[8] and nano crystalline formulations [9]. In determiningthe size of the device the following consideration are made. The size of the device shouldallow for easy swallowing as this can be a problem for patients. Generally, people candetect particles with a size of a few hundred microns in the mouth [10]. Thus it can be anadvantage to keep the size of the device below a few hundred microns. In terms of drugdelivery, the bigger the device is, the fewer devices are needed for a dose. An estimateof micro devices needed for an erythropoietin dose of 0.03mg is found to be 230.000 [11],assuming a device measuring 40 μm in diameter and 6.2 μm in height. Thus, havinglarger devices could reduce this number significantly. Little is known about mucoadhesionof micro devices and the effect of size on this property. It is likely that the device would bedragged along by intestinal fluids if it sticks too far out of the mucus layer. Additionally,there is the issue of handling the devices, which become significantly easier the larger thedevices are. With these factors in mind, it is decided to fabricate micro container proto-types with a characteristic length of 300 μm.The development of the drug delivery device is divided into work packages consisting of; (1)micro container fabrication, which is my work package, (2) lid and coatings, (3) mucoad-hesion, (4) filling of micro containers, drug matrix and (5) drug formulation. The DTUNanotech personnel is responsible for the container fabrication, the container filling as wellas the lid and coatings while the KU Farma personnel is responsible for mucoadhesion,drug matrix as well as drug formulations.
1.3 Goal of the PhD
This section lists the goals set forth at the beginning of the PhD. The goals are based onthe vision and the device described above and the first work package.
• Develop fabrication methods for micro structuring of biodegradable polymers.
• Fabrication of micro containers in biodegradable polymers.
• Develop methods that can be up scaled for large scale production.
1.4 Model drug
Pharmaceutical active ingredients are often divided into four categories classifying themby solubility and permeability [12]. For the class 1 drugs, both the permeability andsolubility is high, while both are low for the class 4 drugs. Class 2 has a high permeabilityand low solubility and vice versa for class 3 drugs. As a model drug, a class four drug ischosen as it represents the challenges facing most newly developed drugs [13]. The choiceof drug is furosemide. The drug is used for treating edema and hypertension cite [14, 15].
1.5 Review of existing research
This section presents the most relevant research concerning micro devices for oral drugdelivery. In terms of size, micro devices for oral drug delivery position themselves between
4 CHAPTER 1. INTRODUCTION
conventional tables and research fields such as micro- and nano-particles, vesicles, micellesetc. These research fields represent alternative technologies to the micro devices and willnot be covered here. The research field concerning micro devices similar to the one de-scribed in section 1.1 emerged a little more than a decade ago. The first micro systemmatching the vision described in section 1.1 is found in a patent dating 01/06/2000 andpublished 03/12/2002. The patent idea is published in an article by Martin and Grove[1]. Both have since demonstrated the idea by realizing silicon micro particles [16, 17].Since then, several research groups around the world have worked within the field of microdevices for oral drug delivery. A number of reviews [18, 19, 20, 21, 22] outline most ofthe work carried out and the future potential. To give an overview of the current state ofthe art, the work of four research groups are highlighted in the following paragraphs andsummarized in table 1.1 and figure 1.2.
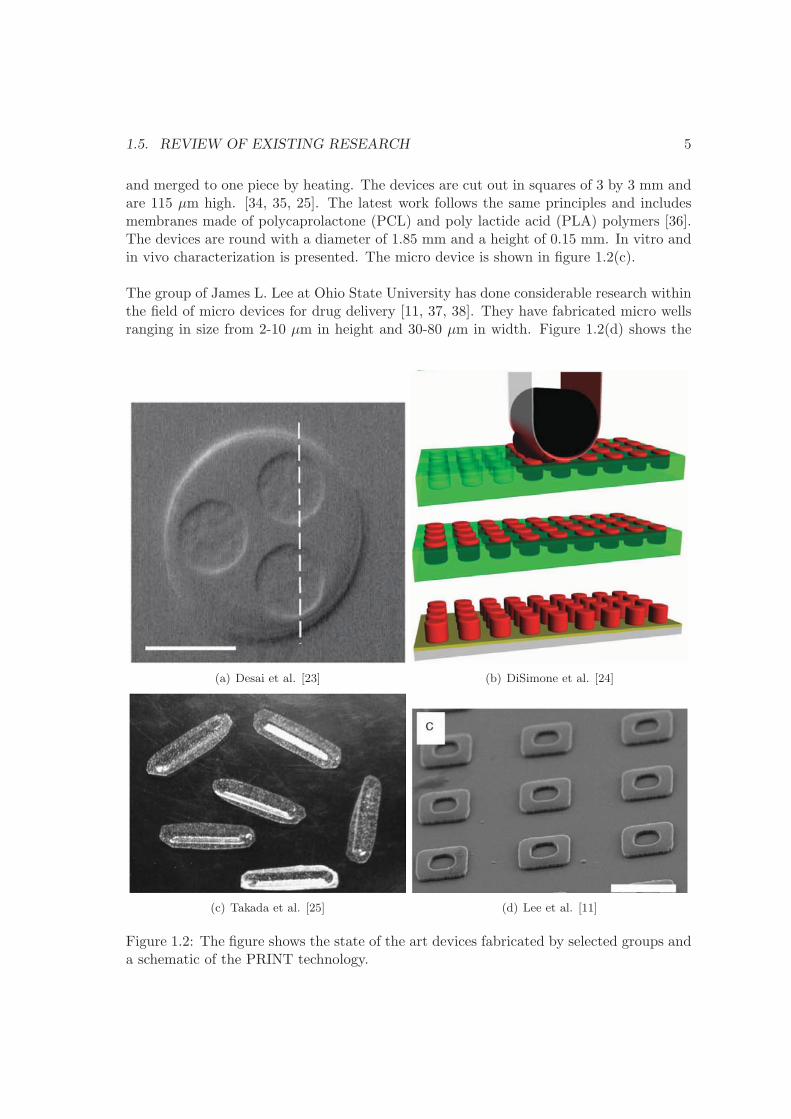
The group of Tejal Desai at University of California, San Francisco has carried out a lotof research on mucoadhesive micro devices for oral drug delivery and their work repre-sents the state of the art within the field. Several micro systems have been realized andoptimized during the past decade. Their first devices where micro wells fabricated insilicon using standard silicon technology [26]. The structures had a height of 2 μm witha 1 μm deep reservoir and a width of 50 to 150 μm. Improved bioadhesion was shownby chemically modifying the device surface and attaching lectin. In vitro experimentson CaCo-2 cells showed improved bioadhesion. Desai et al. have later improved thesedevices several times. Micro devices with multiple drug reservoirs have been fabricated[4]. Devices have been realized in poly(methyl methacrylate) (PMMA)[27], poly(lactic-co-glycolic acid) (PLGA), gelatine and SU-8.[28]. Devices have typical feature size of 50-200μm in width and height of 5-10 μm. Testing of drug release and bioadhesion of thesedevices is done in vitro [29, 30]. The latest work describes bioadhesive micro devices withmultiple reservoirs made in PMMA [23]. The device has three compartments containingthree different types of drug and measures 200 μm in width and 7.5 μm in height. Thecompartments measure 60 μm and are 5 μm deep. In vitro drug release was tested in aCaCo-2 cell setup. Figure 1.2(a) shows an image of the latest device published.
The group of Joseph DiSimone at University of North Carolina has developed a fabri-cation method, Particle Replication In Non-wetting Templates (PRINT), which is used toproduce micro and nano particles for drug delivery. The method enables the fabricationof individual particles. The non-wetting technology avoids the creation of a residual layerthat usually connects particles made by embossing. Figure 1.2(b) shows a schematic ofthe PRINT technology. Particles have been fabricated with sizes ranging from 200 nmto 7 μm [31, 32, 24, 33]. The particles have been fabricated in many different materialssuch as poly(ethylene glycol) (PEG), Poly(L-lactic acid) (PLLA) and PLGA and testedin vitro and in vivo.
The group of Kanji Takada at Kyoto Pharmaceutical University has made devices fororal drug delivery consisting of solvent cast layers of ethyl cellulose, cellulose and a pHsensitive coating, such as Eudragit R© or HP-55 R©. The layers are stacked upon each other
1.5. REVIEW OF EXISTING RESEARCH 5
and merged to one piece by heating. The devices are cut out in squares of 3 by 3 mm andare 115 μm high. [34, 35, 25]. The latest work follows the same principles and includesmembranes made of polycaprolactone (PCL) and poly lactide acid (PLA) polymers [36].The devices are round with a diameter of 1.85 mm and a height of 0.15 mm. In vitro andin vivo characterization is presented. The micro device is shown in figure 1.2(c).
The group of James L. Lee at Ohio State University has done considerable research withinthe field of micro devices for drug delivery [11, 37, 38]. They have fabricated micro wellsranging in size from 2-10 μm in height and 30-80 μm in width. Figure 1.2(d) shows the
(a) Desai et al. [23] (b) DiSimone et al. [24]
(c) Takada et al. [25] (d) Lee et al. [11]
Figure 1.2: The figure shows the state of the art devices fabricated by selected groups anda schematic of the PRINT technology.
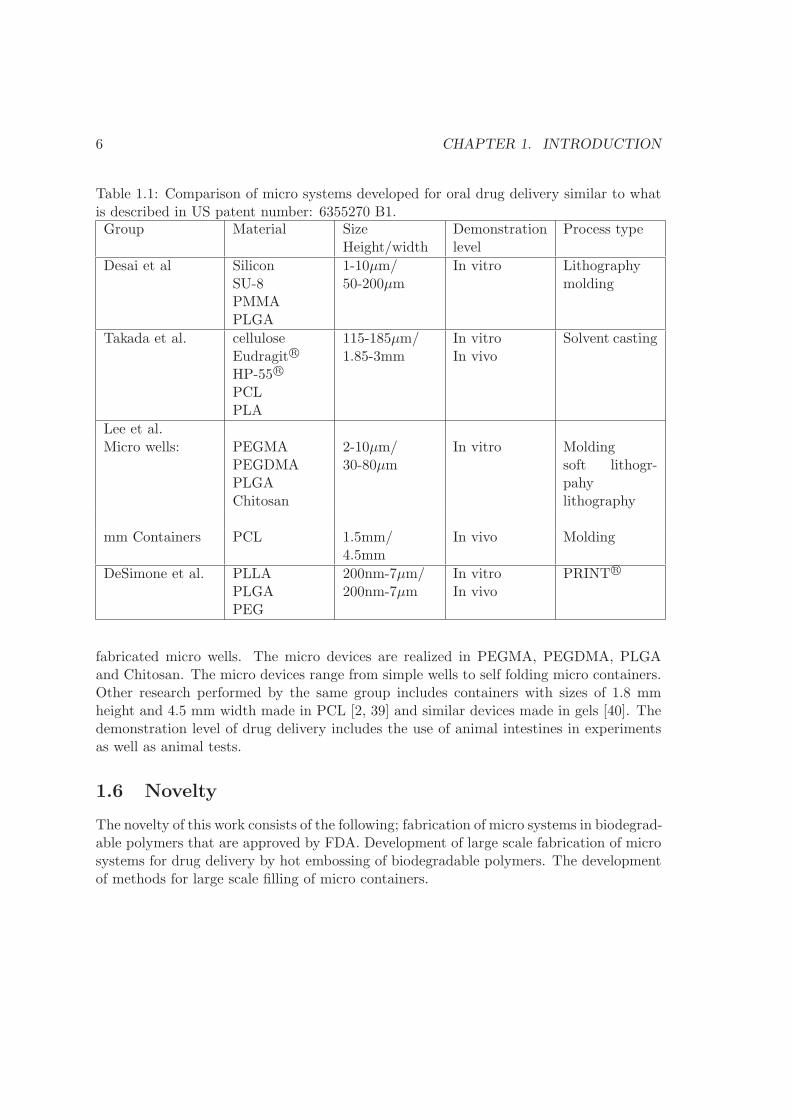
6 CHAPTER 1. INTRODUCTION
Table 1.1: Comparison of micro systems developed for oral drug delivery similar to whatis described in US patent number: 6355270 B1.Group Material Size
Height/widthDemonstrationlevel
Process type
Desai et al SiliconSU-8PMMAPLGA
1-10μm/50-200μm
In vitro Lithographymolding
Takada et al. celluloseEudragit R©
HP-55 R©
PCLPLA
115-185μm/1.85-3mm
In vitroIn vivo
Solvent casting
Lee et al.Micro wells: PEGMA
PEGDMAPLGAChitosan
2-10μm/30-80μm
In vitro Moldingsoft lithogr-pahylithography
mm Containers PCL 1.5mm/4.5mm
In vivo Molding
DeSimone et al. PLLAPLGAPEG
200nm-7μm/200nm-7μm
In vitroIn vivo
PRINT R©
fabricated micro wells. The micro devices are realized in PEGMA, PEGDMA, PLGAand Chitosan. The micro devices range from simple wells to self folding micro containers.Other research performed by the same group includes containers with sizes of 1.8 mmheight and 4.5 mm width made in PCL [2, 39] and similar devices made in gels [40]. Thedemonstration level of drug delivery includes the use of animal intestines in experimentsas well as animal tests.
1.6 Novelty
The novelty of this work consists of the following; fabrication of micro systems in biodegrad-able polymers that are approved by FDA. Development of large scale fabrication of microsystems for drug delivery by hot embossing of biodegradable polymers. The developmentof methods for large scale filling of micro containers.
1.7. THESIS OUTLINE 7
1.7 Thesis outline
This section presents an overview of the chapters in the thesis and a short summary of thecontent of the individual chapters. The thesis is divided into ten chapters plus appendices.The first appendix is a list of scientific contributions made during the PhD study. Followingthis is published work, then a list of polymers considered for the project and data sheetsfor PCL and PLLA. Lastly process recipes and process data are included. Each chapterstarts with a short introduction and ends with a summary of the most important findings.
Chapter 2 - Polymers The chapter describes the theory of solubility used for makingsolutions. It highlights characteristics of the most used polymers. Finally, it de-scribes the spin coating method used for film deposition along with spin curves forPCL and PLLA.
Chapter 3 - Drug matrix This chapter describes the development of a drug matrixconsisting of PCL and furosemide. The chapter shows how Hansen’s solubility pa-rameters can be used for complex systems with multiple compounds. Furthermore,the drug matrix is characterized by microscopy and X-ray diffraction.
Chapter 4 - Stamps This chapter explains the fabrication of the different stamps madein the project. The stamps are later used for embossing of polymers. Stamps inthree different materials are made; SU-8, silicon and nickel. Finally, a deep reactiveion etch process is developed to tune the slope of the side walls.
Chapter 5 - Micro containers The fabrication of the different micro containers is de-scribed in this chapter along with an introduction to hot embossing. Micro containersare made in SU-8, PLLA and PCL.
Chapter 6 - Filling The filling of the different micro containers is shown in this chapter.Three different methods for filling are tested and compared.
Chapter 7 - Drug delivery In vitro drug release from the drug matrix along with thedrug release from micro containers are described in this chapter. The drug releaseis tested mainly by μ-dissolution. A control experiment using a UV-imager is made.
Chapter 8 - Conclusion The conclusion summarizes the most important results ob-tained in the thesis.
Chapter 9 - Outlook The outlook highlights possible directions for future developmentof micro devices for drug delivery.

8 CHAPTER 1. INTRODUCTION
Chapter 2
Polymers
This chapter covers the theory of solubility, the characteristics of the most used polymersin this project, preparation of biopolymer solutions and film fabrication by spin coating.In this project alot of emphasis is on the fabrication of biodegradable micro containersmade in poly-L-lactide acid (PLLA) and polycaprolactone (PCL) which are approved bythe FDA. These polymers will be covered in depth in this chapter while less frequentlyused polymers and materials will be covered to some degree.
2.1 Solubility theory
This section contains the solubility theory used throughout the project in the developmentof solutions for various purposes. First, an introduction to Hansen’s solubility parameters(HSP) is given and the thermodynamic theory behind HSP is presented. The parameterspace and solubility concept of HSP is explained. Once the concepts of HSP are establishedan example of its use in choosing solvent(s) for a given polymer is presented. Furthermore,considerations of solubility of systems with multiple components are given.
2.1.1 Introduction
The theory of solubility is a complex matter and several different approaches exist. Flory-Huggins are among the first to derive a solubility theory. The Flory-Huggins solubilitytheory is based on change in Gibbs free energy. The solubility is defined by the interactionparameter χ [41] . The approach to solubility that will be addressed in this chapter isthe one of Hildebrand and Hansen. The theory is based on the cohesive energy. TheHildebrand parameter δ is an interaction parameter like Flory-Huggins. The theory is ap-plicable to associated solutions and is based on the principle of ”like dissolve like”. Thus,materials with similar δ parameters are likely to be miscible.Hansen solubility parameters (HSP) expand the Hildebrand solubility parameter δ intothree parameters, creating a three dimensional parameter space. The use of three param-eters offers a more accurate treatment of solubility than that of Hildebrand. AlthoughHSP improves the theory of Hildebrand, limitations apply to the theory as molecularshape and size are not taken into account. HSP is an empirical approach to solubility
9
10 CHAPTER 2. POLYMERS
and thus material parameters have to be determined in order to use HSP. Luckily manypeople have worked with HSP and thus HSP parameters can be found for more than 2000compounds[42]. If a specific compound of interest is not cataloged with HSP data, thereader is reffered to [43] for details on how to obtain HSP data.For further information on the different solubility theories, see [43, 41, 44].
2.1.2 Parameter space & solubility
Hansens solubility parameters use cohesive energy to predict solubility. The cohesiveenergy can be divided into three components, the non polar atomic interactions ED, thepermanent dipole- permanent dipole molecule interactions EP and the hydrogen bondinginteraction EH . The total cohesive energy is given by:
Ecohesive = ED + EP + EH (2.1)
Dividing with the molar volume, one arrives at the Hildebrand and Hansen parameters δ[MPa
12 ]:
Ecohesive
Vmol= δ2 = δ2D + δ2P + δ2H (2.2)
The three parameters determine the coordinate of a compound in Hansen space. Theparameters can either be found experimentally, see [43] or they can be calculated usingvarious models included in HSPiP[42]. The coordinate is the center of the Hansen solubilitysphere. The radius of the sphere is determined via experiments. The material in questionis immersed in a series of test solvents with different HSP coordinates. By determiningwhether or not the material dissolves, the solvent is given a score of either 1 if it dissolves(good) or 0 if it does not dissolve (bad). The distance between the sphere center coordinateand the test solvents is then calculated using the following formula:
R2a = 4(δD1 − δD2)
2 + (δP1 − δP2)2 + (δH1 − δH2)
2 (2.3)
An interaction radius R0 is defined such that; solvents lying outside the interaction radiusare considered bad solvents (score 0) and solvents lying inside the interaction radius areconsidered good solvents (score 1). By iteration of the test solvents, the interaction radiusR0 is determined. The uncertainty of R0 depends on the number of test solvents andtheir HSP coordinates. For easy recognition of good and bad solvents, the RED numberis introduced as the ratio of distance between a solvent and the sphere center and theinteraction radius:
RED = Ra/R0 (2.4)
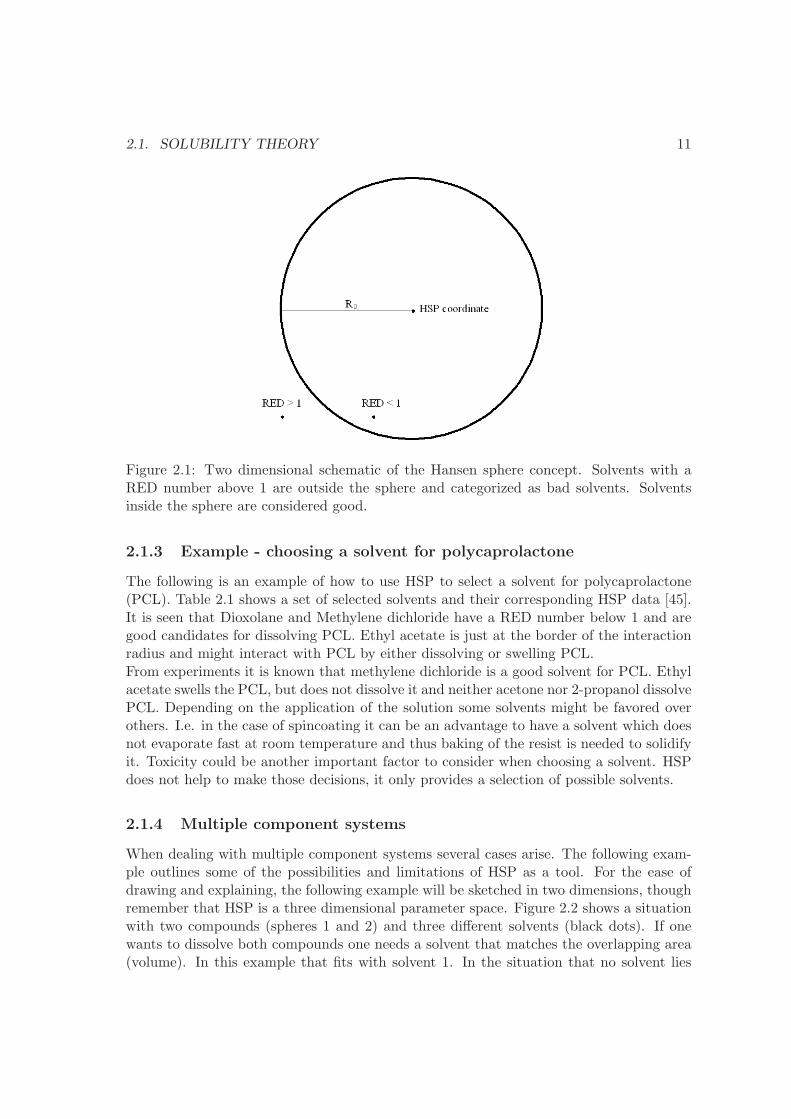
If the RED number is below 1 the affinity of the solvent is good and if the RED numberis above 1, the affinity of the solvent is bad. Thus, a solvent with a coordinate outside thesphere will not dissolve the compound while a solvent inside will dissolve it. Figure 2.1shows a two dimensional representation of the sphere concept. In practise the uncertaintyinherent from the calculation of HSP data give rise to a grey area for solvents with a REDnumber close to 1. Solvents just outside the sphere might dissolve the material and viceversa.
2.1. SOLUBILITY THEORY 11
Figure 2.1: Two dimensional schematic of the Hansen sphere concept. Solvents with aRED number above 1 are outside the sphere and categorized as bad solvents. Solventsinside the sphere are considered good.
2.1.3 Example - choosing a solvent for polycaprolactone
The following is an example of how to use HSP to select a solvent for polycaprolactone(PCL). Table 2.1 shows a set of selected solvents and their corresponding HSP data [45].It is seen that Dioxolane and Methylene dichloride have a RED number below 1 and aregood candidates for dissolving PCL. Ethyl acetate is just at the border of the interactionradius and might interact with PCL by either dissolving or swelling PCL.From experiments it is known that methylene dichloride is a good solvent for PCL. Ethylacetate swells the PCL, but does not dissolve it and neither acetone nor 2-propanol dissolvePCL. Depending on the application of the solution some solvents might be favored overothers. I.e. in the case of spincoating it can be an advantage to have a solvent which doesnot evaporate fast at room temperature and thus baking of the resist is needed to solidifyit. Toxicity could be another important factor to consider when choosing a solvent. HSPdoes not help to make those decisions, it only provides a selection of possible solvents.
2.1.4 Multiple component systems
When dealing with multiple component systems several cases arise. The following exam-ple outlines some of the possibilities and limitations of HSP as a tool. For the ease ofdrawing and explaining, the following example will be sketched in two dimensions, thoughremember that HSP is a three dimensional parameter space. Figure 2.2 shows a situationwith two compounds (spheres 1 and 2) and three different solvents (black dots). If onewants to dissolve both compounds one needs a solvent that matches the overlapping area(volume). In this example that fits with solvent 1. In the situation that no solvent lies
12 CHAPTER 2. POLYMERS
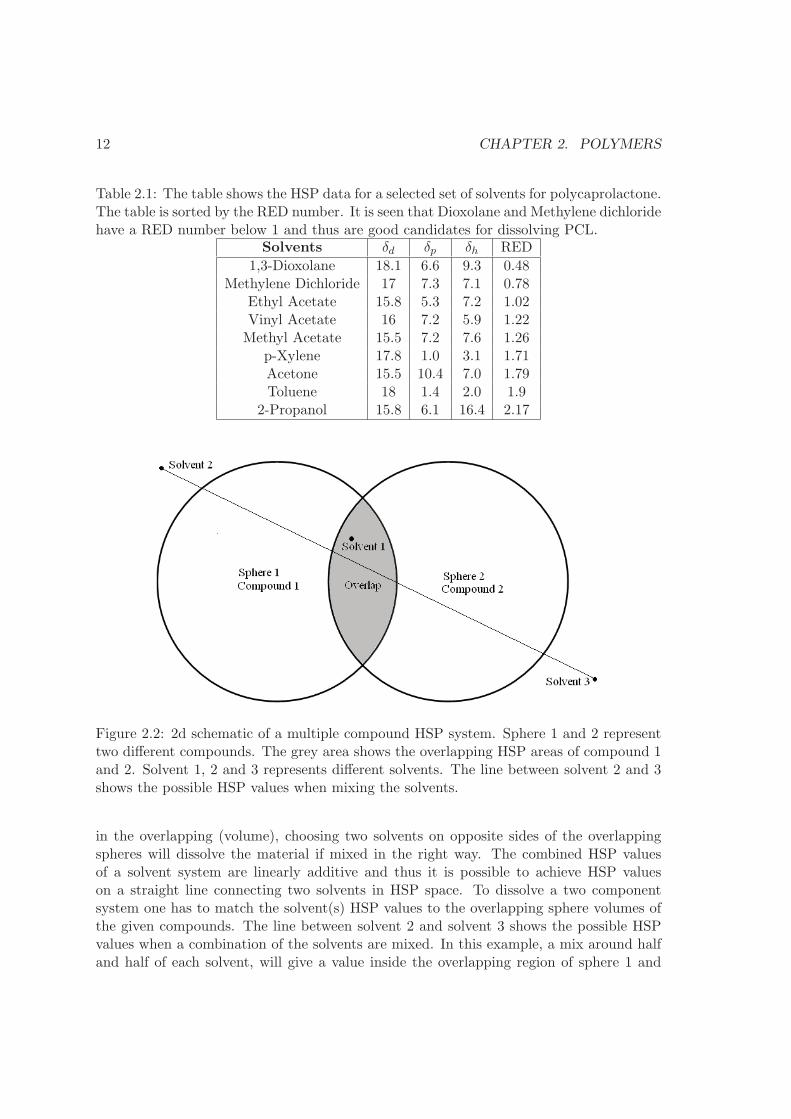
Table 2.1: The table shows the HSP data for a selected set of solvents for polycaprolactone.The table is sorted by the RED number. It is seen that Dioxolane and Methylene dichloridehave a RED number below 1 and thus are good candidates for dissolving PCL.
Solvents δd δp δh RED
1,3-Dioxolane 18.1 6.6 9.3 0.48Methylene Dichloride 17 7.3 7.1 0.78
Ethyl Acetate 15.8 5.3 7.2 1.02Vinyl Acetate 16 7.2 5.9 1.22Methyl Acetate 15.5 7.2 7.6 1.26
p-Xylene 17.8 1.0 3.1 1.71Acetone 15.5 10.4 7.0 1.79Toluene 18 1.4 2.0 1.9
2-Propanol 15.8 6.1 16.4 2.17
Figure 2.2: 2d schematic of a multiple compound HSP system. Sphere 1 and 2 representtwo different compounds. The grey area shows the overlapping HSP areas of compound 1and 2. Solvent 1, 2 and 3 represents different solvents. The line between solvent 2 and 3shows the possible HSP values when mixing the solvents.
in the overlapping (volume), choosing two solvents on opposite sides of the overlappingspheres will dissolve the material if mixed in the right way. The combined HSP valuesof a solvent system are linearly additive and thus it is possible to achieve HSP valueson a straight line connecting two solvents in HSP space. To dissolve a two componentsystem one has to match the solvent(s) HSP values to the overlapping sphere volumes ofthe given compounds. The line between solvent 2 and solvent 3 shows the possible HSPvalues when a combination of the solvents are mixed. In this example, a mix around halfand half of each solvent, will give a value inside the overlapping region of sphere 1 and
2.2. BIOPOLYMERS 13
sphere 2, thus dissolving both compounds. The trick of mixing solvents to match a specificHSP value is valid for a single compound as well. When mixing solvents it is important totake the boiling point into account. For example solvent 1 evaporates fast while solvent 2evaporates slowly. The solvent mixture will alter its composition over time if it is allowedto evaporate. Thus the HSP values of the system will change when the ratio of solventchange. If the system is delicate and responds fast to the change in solvent ratio, one of thecomponents might go out of solution while the other will remain in solution. Dependingon the application of the blend this can either be a feature or an issue.
2.1.5 HSP remarks
The strength of HSP lies in the large amount of data available to the user. Data can befound in Hansen’s solubility parameters, a users handbook[43] or on the web[42]. It canbe of great help to use the HSPiP program, which has all data available in data sheets andtools to help you with calculations and comparisons. It should be noted that HSP valuesare affected by temperature, which the theory does not include. Thus, data obtainedat room temperature might be significantly different if used at extreme temperatures.Molecular size and shape are not considered and can play a role in solubility. Regardlessof its limits, HSP can be of great help when choosing solvents, as it provides the user witha selection of possible solvents to use.
2.2 Biopolymers
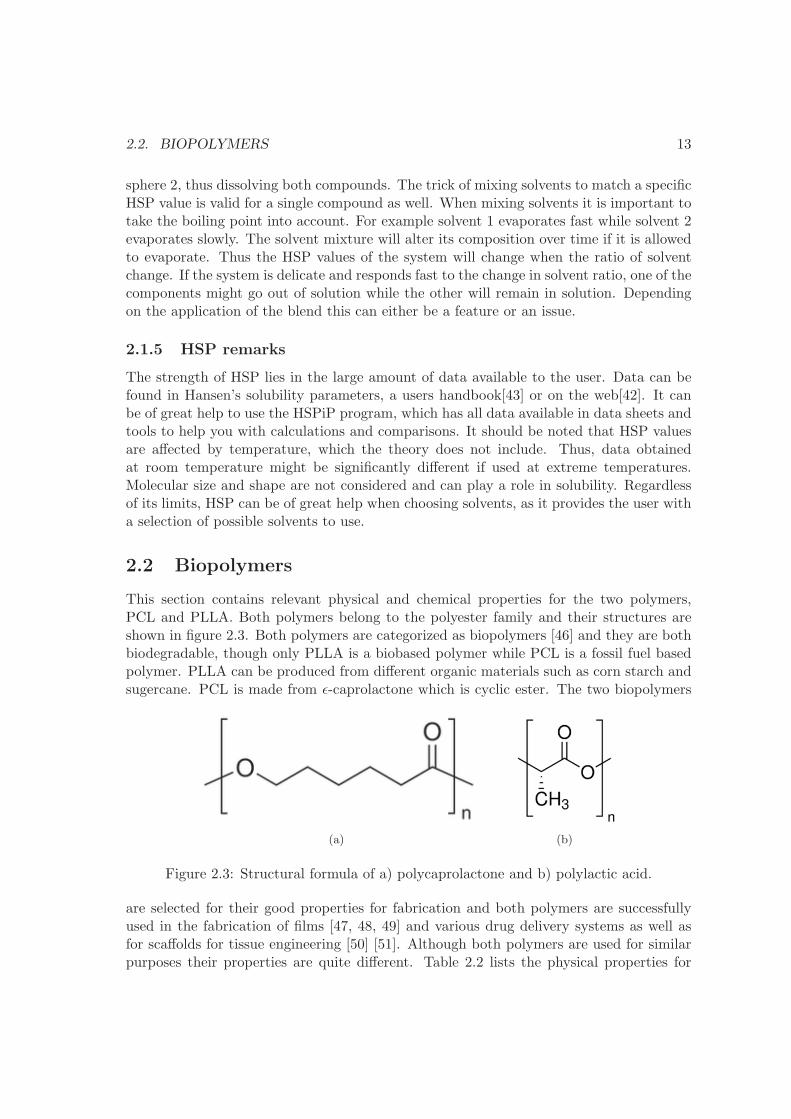
This section contains relevant physical and chemical properties for the two polymers,PCL and PLLA. Both polymers belong to the polyester family and their structures areshown in figure 2.3. Both polymers are categorized as biopolymers [46] and they are bothbiodegradable, though only PLLA is a biobased polymer while PCL is a fossil fuel basedpolymer. PLLA can be produced from different organic materials such as corn starch andsugercane. PCL is made from ε-caprolactone which is cyclic ester. The two biopolymers
(a) (b)
Figure 2.3: Structural formula of a) polycaprolactone and b) polylactic acid.
are selected for their good properties for fabrication and both polymers are successfullyused in the fabrication of films [47, 48, 49] and various drug delivery systems as well asfor scaffolds for tissue engineering [50] [51]. Although both polymers are used for similarpurposes their properties are quite different. Table 2.2 lists the physical properties for
14 CHAPTER 2. POLYMERS
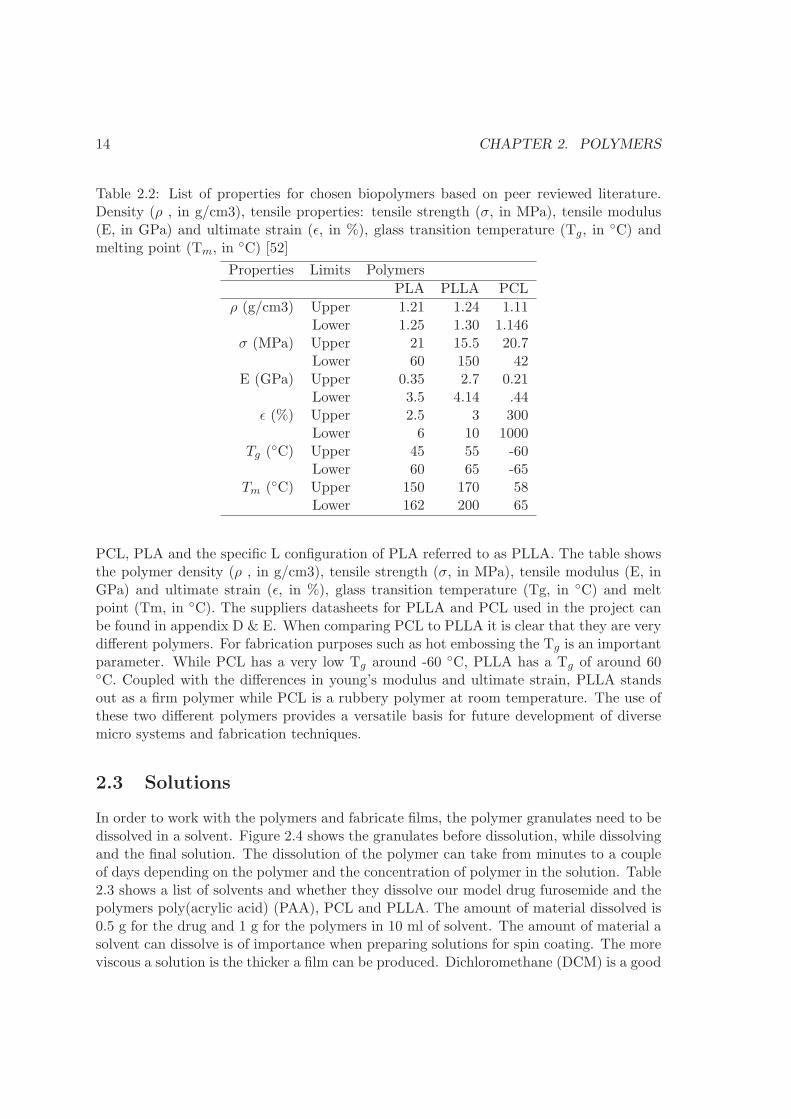
Table 2.2: List of properties for chosen biopolymers based on peer reviewed literature.Density (ρ , in g/cm3), tensile properties: tensile strength (σ, in MPa), tensile modulus(E, in GPa) and ultimate strain (ε, in %), glass transition temperature (Tg, in
◦C) andmelting point (Tm, in ◦C) [52]
Properties Limits Polymers
PLA PLLA PCL
ρ (g/cm3) Upper 1.21 1.24 1.11Lower 1.25 1.30 1.146
σ (MPa) Upper 21 15.5 20.7Lower 60 150 42
E (GPa) Upper 0.35 2.7 0.21Lower 3.5 4.14 .44
ε (%) Upper 2.5 3 300Lower 6 10 1000
Tg (◦C) Upper 45 55 -60Lower 60 65 -65
Tm (◦C) Upper 150 170 58Lower 162 200 65
PCL, PLA and the specific L configuration of PLA referred to as PLLA. The table showsthe polymer density (ρ , in g/cm3), tensile strength (σ, in MPa), tensile modulus (E, inGPa) and ultimate strain (ε, in %), glass transition temperature (Tg, in ◦C) and meltpoint (Tm, in ◦C). The suppliers datasheets for PLLA and PCL used in the project canbe found in appendix D & E. When comparing PCL to PLLA it is clear that they are verydifferent polymers. For fabrication purposes such as hot embossing the Tg is an importantparameter. While PCL has a very low Tg around -60 ◦C, PLLA has a Tg of around 60◦C. Coupled with the differences in young’s modulus and ultimate strain, PLLA standsout as a firm polymer while PCL is a rubbery polymer at room temperature. The use ofthese two different polymers provides a versatile basis for future development of diversemicro systems and fabrication techniques.
2.3 Solutions
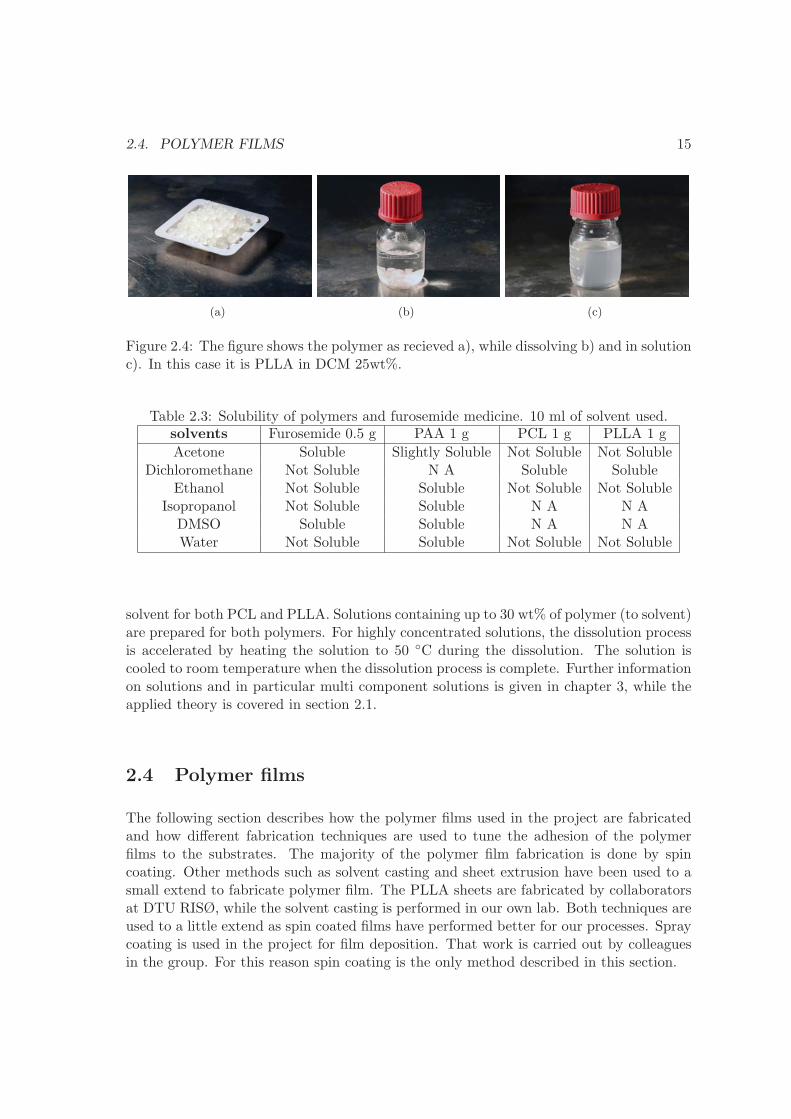
In order to work with the polymers and fabricate films, the polymer granulates need to bedissolved in a solvent. Figure 2.4 shows the granulates before dissolution, while dissolvingand the final solution. The dissolution of the polymer can take from minutes to a coupleof days depending on the polymer and the concentration of polymer in the solution. Table2.3 shows a list of solvents and whether they dissolve our model drug furosemide and thepolymers poly(acrylic acid) (PAA), PCL and PLLA. The amount of material dissolved is0.5 g for the drug and 1 g for the polymers in 10 ml of solvent. The amount of material asolvent can dissolve is of importance when preparing solutions for spin coating. The moreviscous a solution is the thicker a film can be produced. Dichloromethane (DCM) is a good
2.4. POLYMER FILMS 15
(a) (b) (c)
Figure 2.4: The figure shows the polymer as recieved a), while dissolving b) and in solutionc). In this case it is PLLA in DCM 25wt%.
Table 2.3: Solubility of polymers and furosemide medicine. 10 ml of solvent used.solvents Furosemide 0.5 g PAA 1 g PCL 1 g PLLA 1 g
Acetone Soluble Slightly Soluble Not Soluble Not SolubleDichloromethane Not Soluble N A Soluble Soluble
Ethanol Not Soluble Soluble Not Soluble Not SolubleIsopropanol Not Soluble Soluble N A N A
DMSO Soluble Soluble N A N AWater Not Soluble Soluble Not Soluble Not Soluble
solvent for both PCL and PLLA. Solutions containing up to 30 wt% of polymer (to solvent)are prepared for both polymers. For highly concentrated solutions, the dissolution processis accelerated by heating the solution to 50 ◦C during the dissolution. The solution iscooled to room temperature when the dissolution process is complete. Further informationon solutions and in particular multi component solutions is given in chapter 3, while theapplied theory is covered in section 2.1.
2.4 Polymer films
The following section describes how the polymer films used in the project are fabricatedand how different fabrication techniques are used to tune the adhesion of the polymerfilms to the substrates. The majority of the polymer film fabrication is done by spincoating. Other methods such as solvent casting and sheet extrusion have been used to asmall extend to fabricate polymer film. The PLLA sheets are fabricated by collaboratorsat DTU RISØ, while the solvent casting is performed in our own lab. Both techniques areused to a little extend as spin coated films have performed better for our processes. Spraycoating is used in the project for film deposition. That work is carried out by colleaguesin the group. For this reason spin coating is the only method described in this section.

16 CHAPTER 2. POLYMERS
2.4.1 Spin coating
Spin coating is a fabrication technique that is widely used for deposition of thin films,especially in the micro electronics industry. The film thickness varies greatly from tensof nanometers [53] to hundreds of micro meters [54]. The spin coating process is a welldocumented and well established technique. The process is described here, though forfurther details on theory the reader is referred to [55] [56]. Figure 2.5 shows the spincoating process. First, a solution is dispensed on the center of a substrate. The substrateis then rotated at high rotation per minute (RPM). The centrifugal force pushes thesolution from the center to the edge of the substrate, where excess solution is spun off thesubstrate. The thickness of the film is inversely proportional to the spin speed and time.After spinning the film is dried. The subsequent procedure after spin coating is highlydependent on the spun solution. It might be drying at room temperature or baking atelevated temperature. This is highly dependent on the solvent(s) used in the spin coatedsolution. Furthermore, heating steps can be used to facilitate cross linking. In our case,the films are either degassed at room temperature or on a hotplate, depending on thesolution and the wanted film adhesion. The procedure can be repeated to stack layers ofspin coated films on top of each other. Experiments with different solutions and spin
Figure 2.5: Main process steps in the spin coating process. [57] First, solution is appliedto the substrate. Then the substrate is rotated. The rotation distributes the solutionuniformly on the substrate creating a film. After rotation the film is dried. The processcan be repeated to stack layers.
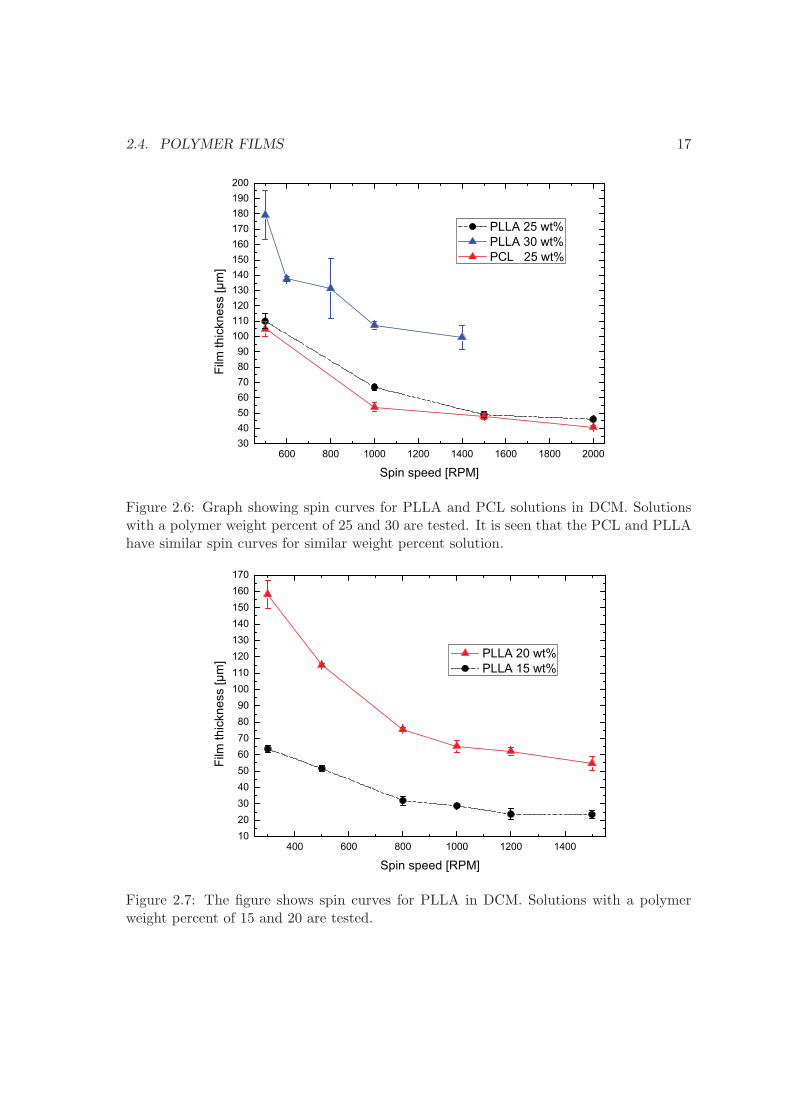
speed are performed to obtain spin curves relating spin speed to film height. Figure 2.6shows the spin curves for solutions of PLLA with a weight percent (wt%) of 25 and 30 andfor a PCL solution with a wt% of 25. The solvent used in both cases is DCM. The spintime is kept constant at 50 sec. It is seen that PCL and PLLA have similar spin curves.The 30 wt% solution is difficult to spin and often an uneven result is obtained, hence thelarge error bars. Figure 2.7 shows spin curves for a solution of PLLA with a wt% of 15and 20. The spin curves shown in figure 2.6 are made with the first batch of polymersreceived, while the spin curves in figure 2.7 are made with the second batch of polymersreceived. There is a small difference in the thickness of the polymer films created withthe two batches. A 20 wt% solution with the second batch produces almost similar filmthicknesses as a 25 wt% solution of the first batch. The reason for this is unknown though
2.4. POLYMER FILMS 17
600 800 1000 1200 1400 1600 1800 200030405060708090
100110120130140150160170180190200
Film
thic
knes
s[µ
m]
Spin speed [RPM]
PLLA 25 wt%PLLA 30 wt%PCL 25 wt%
Figure 2.6: Graph showing spin curves for PLLA and PCL solutions in DCM. Solutionswith a polymer weight percent of 25 and 30 are tested. It is seen that the PCL and PLLAhave similar spin curves for similar weight percent solution.
400 600 800 1000 1200 1400102030405060708090
100110120130140150160170
Film
thic
knes
s[µ
m]
Spin speed [RPM]
PLLA 20 wt%PLLA 15 wt%
Figure 2.7: The figure shows spin curves for PLLA in DCM. Solutions with a polymerweight percent of 15 and 20 are tested.

18 CHAPTER 2. POLYMERS
it is likely due to a difference in molecular weight. The spin curves serve as a guideline forpolymer film fabrication. The polymer film is later used to fabricate micro containers byhot embossing, see chapter 5.
2.4.2 PLLA film on silicon wafer - procedure
This paragraph describes the procedure used for a successful spin coating of PLLA. Fur-thermore, the possible post spinning treatments that can be used to tune the adhesion ofthe polymer to the substrate are explained.In order to reproduce film thickness and to get a uniform and smooth surface it is rec-ommended to use fresh solutions every time and not to use the last 10% of solution. Thereason for this is that some of the solvent will evaporate from the solution when usingit and thus the solution will thicken. The wafer should be rotating while the solution isdispensed on the wafer. When the silicon wafer is coated, the wafer is left to degas for 24H. This is done in order to minimize the content of solvent left in the film. If the wafer isheated right after spin coating, bubbles of trapped solvent will create a very uneven sur-face. Depending on the desired adhesion, the following steps can vary. If a good adhesionis wanted, the wafers should receive a heat treatment. The wafers should be heated on ahotplate at 220 ◦C for a minimum of 15 min. When removing the wafers, they should beplaced on a poor heat conductor i.e. cleanroom paper. If the temperature decreases tofast, stress will be induced in the film from the difference in thermal expansion betweenthe substrate and polymer. This can cause peeling of the polymer film. If the PLLA filmcontains bubbles these can be removed by extending the heating time to i.e. 1 hour. Aweak adhesion of the film to the silicon wafer is obtained by not heating the substrate.If left for several days up to weeks, the adhesion will diminish and result in the polymerpealing off. This can be a desired option if you want to release the film from the substrateafter complete processing.
2.5 Summary
In this chapter Hansen’s theory of solubility is introduced. Examples of its use to choosea solvent for PCL are shown and its applications in multiple component systems are de-scribed. The two biodegradable polymers (PCL, PLLA) mainly used in the project areintroduced along with their properties. It is shown how to prepare films, by dissolving thepolymers in organic solvent and spin coating the solutions on silicon substrates. Further-more, the polymer film adhesion to the substrate can be tuned by heat treatment afterspin coating.
Chapter 3
Polymer drug matrix
The idea is to have a versatile film consisting of polymer and drug, that is applicableto many applications such as filling of micro containers, see section 6.1. This chapterdescribes the development of the polymer drug matrix used in the project for filling ofmicro containers via a hot embossing technique. The polymer drug matrix is developedwith the following conditions in mind; 1) The furosemide should preferably be in theamorphous state, to facilitate a fast dissolution of the otherwise poorly soluble drug. 2)The matrix should contain as much drug as possible, thus maximizing the amount of activeingredient per volume. 3) The distribution of the polymer and drug should be uniform.First, an overview of the solvent-polymer-drug interaction is presented along with thetwo methods used for fabricating polymer drug films; solvent casting and spin coating.Second, the developed polymer drug matrix is characterized. The drug dissolution fromthe polymer drug matrix is characterized with a Pion μ dissolution UV profiler and theresults from these experiments can be found in the drug release chapter 7.
3.1 Solvent-polymer-drug interaction
To achieve the properties above, it is of great importance to understand the interaction ofthe polymer, the drug and the solvents, as it affects the final product as well as the possiblemethods of fabrication. To achieve a homogenous film a good blend of the polymer and thedrug is needed. Two different techniques are tested for the fabrication of the drug matrix;solvent casting and spin coating. Other techniques for fabricating films exist such as mold-ing, thermoforming and extrusion, but these have not been investigated in this project.Hot melt extrusion is widely used in the plastic industry as well as the pharmaceuticalindustry and is a good example of how to mass produce polymer drug films [58, 59].Two approaches for achieving a homogenous distribution of polymer and drug have beenconsidered. 1) Either the polymer and drug should be miscible and thus phase separationcan be avoided. 2) The solvent should evaporate immediately upon film formation, thusfreezing the material in place, similar to quench cooling. The first approach requires thatthe materials are miscible. According to HSP this means that they should be alike, thushaving similar HSP values. The second requirement is that they can be dissolved in the
19
20 CHAPTER 3. POLYMER DRUG MATRIX
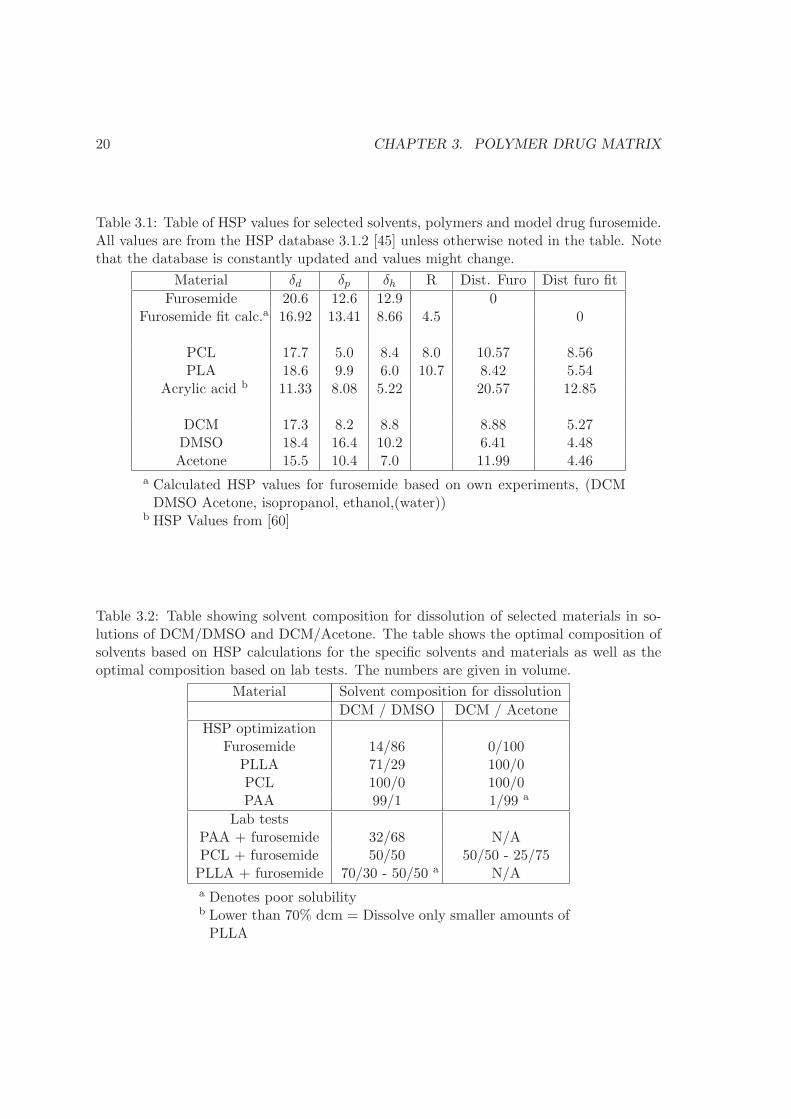
Table 3.1: Table of HSP values for selected solvents, polymers and model drug furosemide.All values are from the HSP database 3.1.2 [45] unless otherwise noted in the table. Notethat the database is constantly updated and values might change.
Material δd δp δh R Dist. Furo Dist furo fit
Furosemide 20.6 12.6 12.9 0Furosemide fit calc.a 16.92 13.41 8.66 4.5 0
PCL 17.7 5.0 8.4 8.0 10.57 8.56PLA 18.6 9.9 6.0 10.7 8.42 5.54
Acrylic acid b 11.33 8.08 5.22 20.57 12.85
DCM 17.3 8.2 8.8 8.88 5.27DMSO 18.4 16.4 10.2 6.41 4.48Acetone 15.5 10.4 7.0 11.99 4.46
a Calculated HSP values for furosemide based on own experiments, (DCMDMSO Acetone, isopropanol, ethanol,(water))
b HSP Values from [60]
Table 3.2: Table showing solvent composition for dissolution of selected materials in so-lutions of DCM/DMSO and DCM/Acetone. The table shows the optimal composition ofsolvents based on HSP calculations for the specific solvents and materials as well as theoptimal composition based on lab tests. The numbers are given in volume.
Material Solvent composition for dissolution
DCM / DMSO DCM / Acetone
HSP optimizationFurosemide 14/86 0/100
PLLA 71/29 100/0PCL 100/0 100/0PAA 99/1 1/99 a
Lab testsPAA + furosemide 32/68 N/APCL + furosemide 50/50 50/50 - 25/75PLLA + furosemide 70/30 - 50/50 a N/A
a Denotes poor solubilityb Lower than 70% dcm = Dissolve only smaller amounts ofPLLA
3.1. SOLVENT-POLYMER-DRUG INTERACTION 21
same solvent, thus their solubility radii must have shared volume in HSP space. Lookingat the HSP parameters for furosemide and polymers in table 3.1, all three polymer have agreater distance between them and furosemide than the solubility radius R. This is equalto a RED number above one, meaning that they are not alike. Based on the HSP valuesphase separation of the materials is expected. Therefore, the first option is unlikely andthe second option is considered for the fabrication of a homogenous film. HSP is used todetermine if the drug and polymer can be dissolved in the same solution. To be dissolvedin the same solution the solubility spheres of the compounds must overlap and thus sharea volume in Hansen space. This case is described in section 2.1.4 of the polymer theory.A blend of solvents is used in order to dissolve both furosemide and polymer. Table 3.2shows solvent composition for dissolution of the frequently used materials in this projectin blends of DCM/Dimethyl sulfoxide (DMSO) and DCM/Acetone. The table shows theoptimal composition of solvents based on HSP calculations for the specific solvents andmaterials as well as the optimal composition based on lab experience.
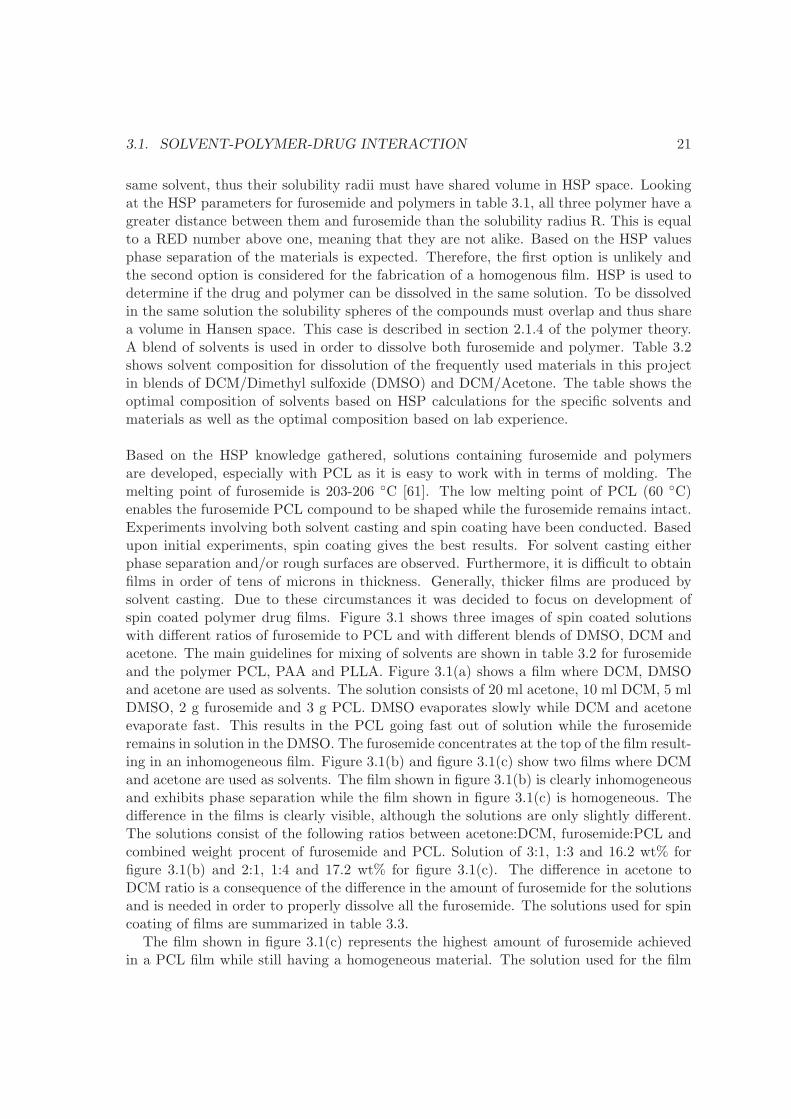
Based on the HSP knowledge gathered, solutions containing furosemide and polymersare developed, especially with PCL as it is easy to work with in terms of molding. Themelting point of furosemide is 203-206 ◦C [61]. The low melting point of PCL (60 ◦C)enables the furosemide PCL compound to be shaped while the furosemide remains intact.Experiments involving both solvent casting and spin coating have been conducted. Basedupon initial experiments, spin coating gives the best results. For solvent casting eitherphase separation and/or rough surfaces are observed. Furthermore, it is difficult to obtainfilms in order of tens of microns in thickness. Generally, thicker films are produced bysolvent casting. Due to these circumstances it was decided to focus on development ofspin coated polymer drug films. Figure 3.1 shows three images of spin coated solutionswith different ratios of furosemide to PCL and with different blends of DMSO, DCM andacetone. The main guidelines for mixing of solvents are shown in table 3.2 for furosemideand the polymer PCL, PAA and PLLA. Figure 3.1(a) shows a film where DCM, DMSOand acetone are used as solvents. The solution consists of 20 ml acetone, 10 ml DCM, 5 mlDMSO, 2 g furosemide and 3 g PCL. DMSO evaporates slowly while DCM and acetoneevaporate fast. This results in the PCL going fast out of solution while the furosemideremains in solution in the DMSO. The furosemide concentrates at the top of the film result-ing in an inhomogeneous film. Figure 3.1(b) and figure 3.1(c) show two films where DCMand acetone are used as solvents. The film shown in figure 3.1(b) is clearly inhomogeneousand exhibits phase separation while the film shown in figure 3.1(c) is homogeneous. Thedifference in the films is clearly visible, although the solutions are only slightly different.The solutions consist of the following ratios between acetone:DCM, furosemide:PCL andcombined weight procent of furosemide and PCL. Solution of 3:1, 1:3 and 16.2 wt% forfigure 3.1(b) and 2:1, 1:4 and 17.2 wt% for figure 3.1(c). The difference in acetone toDCM ratio is a consequence of the difference in the amount of furosemide for the solutionsand is needed in order to properly dissolve all the furosemide. The solutions used for spincoating of films are summarized in table 3.3.
The film shown in figure 3.1(c) represents the highest amount of furosemide achievedin a PCL film while still having a homogeneous material. The solution used for the film
22 CHAPTER 3. POLYMER DRUG MATRIX
Table 3.3: Table showing the solutions used for the spin coating of films shown in figure3.1.
Figure Solvents [ml] Furosemide [g] PCL [g]
3.1(a) DCM/DMSO/Acetone20/10/5
2 3
3.1(b) DCM/Acetone10/30
1.5 4.5
3.1(c) DCM/Acetone10/20
1 4
(a) (b) (c)
Figure 3.1: The figure shows three images of spin coated solutions containing furosemideand polycaprolactone. a) shows a film where DCM, DMSO and acetone are used assolvents. DMSO evaporates slowly while DCM and acetone evaporate fast. This resultsin the PCL quickly going out of solution while the furosemide remains in solution in theDMSO. The furosemide concentrates at the top of the film in a highly non uniform film. b)and c) show two films where DCM and acetone is used as solvent. The ratio of furosemideto PCL is 1:3 for b) with a 16.2 wt% solution, while it is 1:4 for c) with a 17.2 wt%solution. The film shown in b) exhibits clear phase separation while the materials are welldistributed in c).
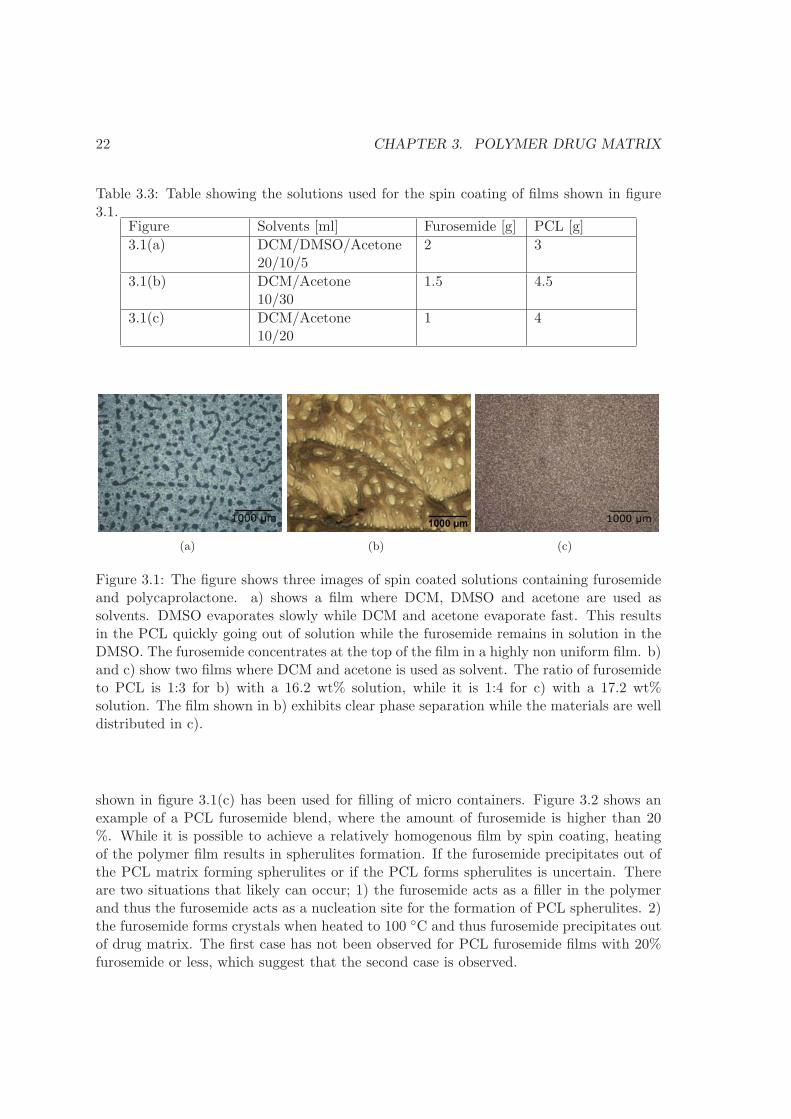
shown in figure 3.1(c) has been used for filling of micro containers. Figure 3.2 shows anexample of a PCL furosemide blend, where the amount of furosemide is higher than 20%. While it is possible to achieve a relatively homogenous film by spin coating, heatingof the polymer film results in spherulites formation. If the furosemide precipitates out ofthe PCL matrix forming spherulites or if the PCL forms spherulites is uncertain. Thereare two situations that likely can occur; 1) the furosemide acts as a filler in the polymerand thus the furosemide acts as a nucleation site for the formation of PCL spherulites. 2)the furosemide forms crystals when heated to 100 ◦C and thus furosemide precipitates outof drug matrix. The first case has not been observed for PCL furosemide films with 20%furosemide or less, which suggest that the second case is observed.
3.2. DRUG MATRIX CHARACTERIZATION 23
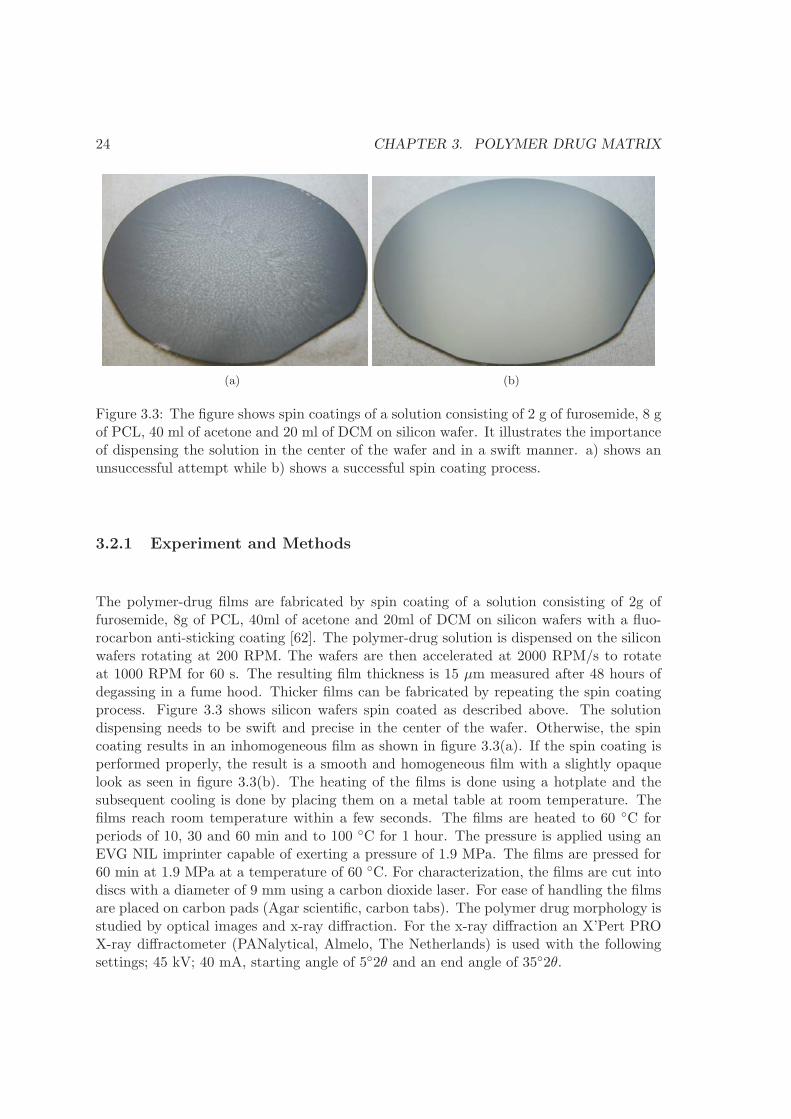
(a) 5 min heating (b) 10 min heating (c) 15 min heating
Figure 3.2: Optical microscope images of spin coated solution of furosemide and poly-caprolactone. Column (a), (b) and (c) shows films that have been annealed on a hotplateat 100 ◦C for 5,10 and 15 minutes respectively. The top row shows images right afterthe annealing. The middle row 1 day after annealing and the bottom row 7 days afterannealing.
3.2 Drug matrix characterization
A set of experiments based on the optimized polymer drug matrix seen in figure 3.1(c) isconducted. A total of six different batches are used to evaluate the effect of heat treatment(Room temperature, 60 ◦C for 10,30,60 min, 100 ◦C for 60 min.) and pressure treatment(embossing 60 ◦C for 60 min at 1.9MPa) on the drug release and conformation of thepolymer- drug films. The objective is to evaluate the stability of the PCL furosemide drugmatrix during processing. This section will describe the experiment and all the resultsexcept for the drug release which is covered in chapter 7.
24 CHAPTER 3. POLYMER DRUG MATRIX
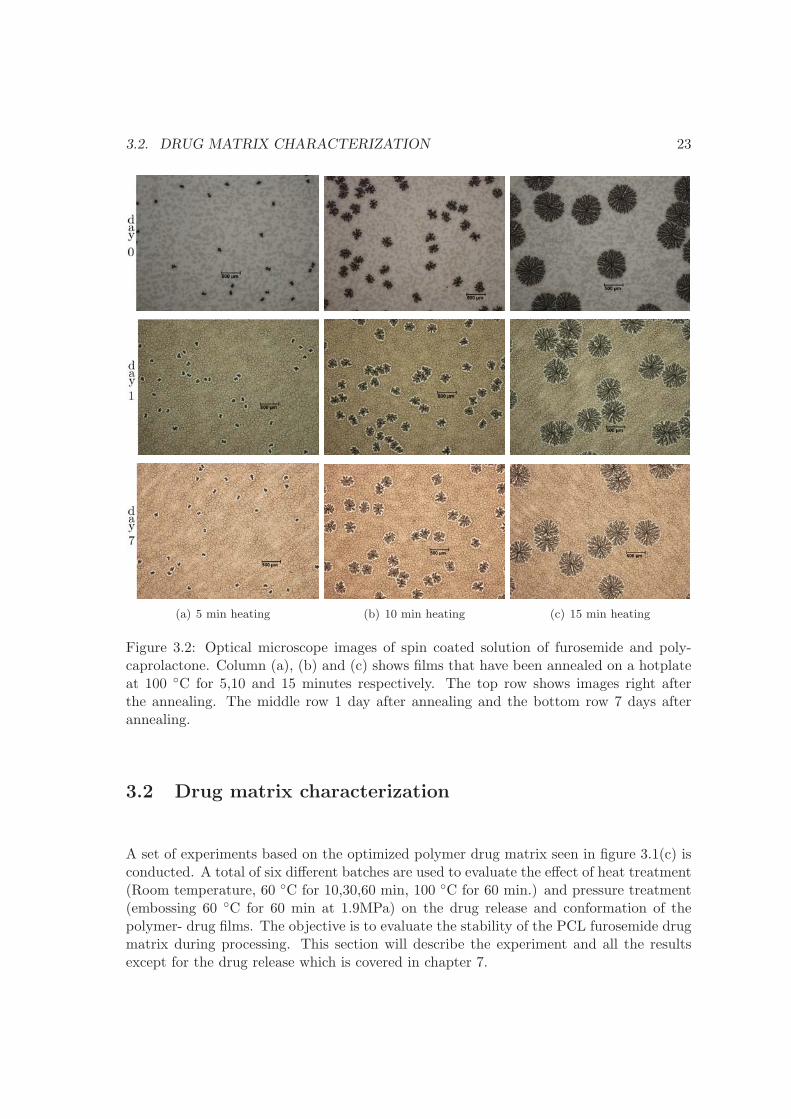
(a) (b)
Figure 3.3: The figure shows spin coatings of a solution consisting of 2 g of furosemide, 8 gof PCL, 40 ml of acetone and 20 ml of DCM on silicon wafer. It illustrates the importanceof dispensing the solution in the center of the wafer and in a swift manner. a) shows anunsuccessful attempt while b) shows a successful spin coating process.
3.2.1 Experiment and Methods
The polymer-drug films are fabricated by spin coating of a solution consisting of 2g offurosemide, 8g of PCL, 40ml of acetone and 20ml of DCM on silicon wafers with a fluo-rocarbon anti-sticking coating [62]. The polymer-drug solution is dispensed on the siliconwafers rotating at 200 RPM. The wafers are then accelerated at 2000 RPM/s to rotateat 1000 RPM for 60 s. The resulting film thickness is 15 μm measured after 48 hours ofdegassing in a fume hood. Thicker films can be fabricated by repeating the spin coatingprocess. Figure 3.3 shows silicon wafers spin coated as described above. The solutiondispensing needs to be swift and precise in the center of the wafer. Otherwise, the spincoating results in an inhomogeneous film as shown in figure 3.3(a). If the spin coating isperformed properly, the result is a smooth and homogeneous film with a slightly opaquelook as seen in figure 3.3(b). The heating of the films is done using a hotplate and thesubsequent cooling is done by placing them on a metal table at room temperature. Thefilms reach room temperature within a few seconds. The films are heated to 60 ◦C forperiods of 10, 30 and 60 min and to 100 ◦C for 1 hour. The pressure is applied using anEVG NIL imprinter capable of exerting a pressure of 1.9 MPa. The films are pressed for60 min at 1.9 MPa at a temperature of 60 ◦C. For characterization, the films are cut intodiscs with a diameter of 9 mm using a carbon dioxide laser. For ease of handling the filmsare placed on carbon pads (Agar scientific, carbon tabs). The polymer drug morphology isstudied by optical images and x-ray diffraction. For the x-ray diffraction an X’Pert PROX-ray diffractometer (PANalytical, Almelo, The Netherlands) is used with the followingsettings; 45 kV; 40 mA, starting angle of 5◦2θ and an end angle of 35◦2θ.
3.2. DRUG MATRIX CHARACTERIZATION 25
(a) (b)
(c) (d)
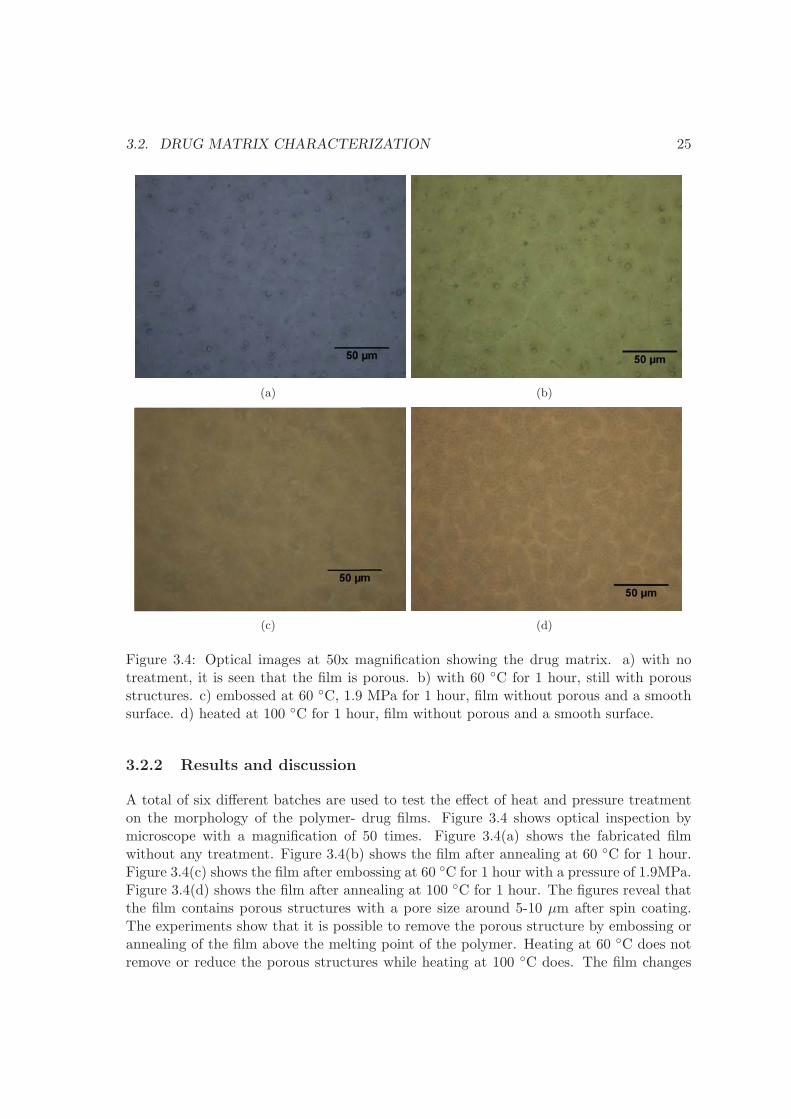
Figure 3.4: Optical images at 50x magnification showing the drug matrix. a) with notreatment, it is seen that the film is porous. b) with 60 ◦C for 1 hour, still with porousstructures. c) embossed at 60 ◦C, 1.9 MPa for 1 hour, film without porous and a smoothsurface. d) heated at 100 ◦C for 1 hour, film without porous and a smooth surface.
3.2.2 Results and discussion
A total of six different batches are used to test the effect of heat and pressure treatmenton the morphology of the polymer- drug films. Figure 3.4 shows optical inspection bymicroscope with a magnification of 50 times. Figure 3.4(a) shows the fabricated filmwithout any treatment. Figure 3.4(b) shows the film after annealing at 60 ◦C for 1 hour.Figure 3.4(c) shows the film after embossing at 60 ◦C for 1 hour with a pressure of 1.9MPa.Figure 3.4(d) shows the film after annealing at 100 ◦C for 1 hour. The figures reveal thatthe film contains porous structures with a pore size around 5-10 μm after spin coating.The experiments show that it is possible to remove the porous structure by embossing orannealing of the film above the melting point of the polymer. Heating at 60 ◦C does notremove or reduce the porous structures while heating at 100 ◦C does. The film changes
26 CHAPTER 3. POLYMER DRUG MATRIX
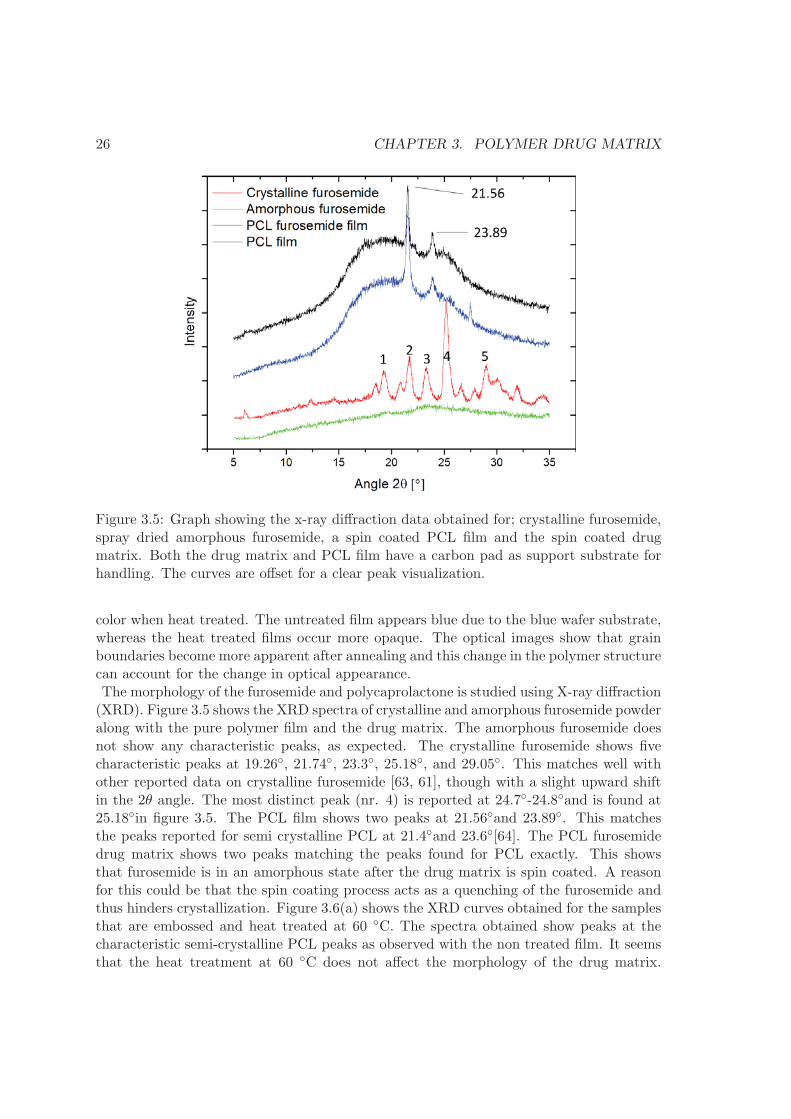
Figure 3.5: Graph showing the x-ray diffraction data obtained for; crystalline furosemide,spray dried amorphous furosemide, a spin coated PCL film and the spin coated drugmatrix. Both the drug matrix and PCL film have a carbon pad as support substrate forhandling. The curves are offset for a clear peak visualization.
color when heat treated. The untreated film appears blue due to the blue wafer substrate,whereas the heat treated films occur more opaque. The optical images show that grainboundaries become more apparent after annealing and this change in the polymer structurecan account for the change in optical appearance.The morphology of the furosemide and polycaprolactone is studied using X-ray diffraction(XRD). Figure 3.5 shows the XRD spectra of crystalline and amorphous furosemide powderalong with the pure polymer film and the drug matrix. The amorphous furosemide doesnot show any characteristic peaks, as expected. The crystalline furosemide shows fivecharacteristic peaks at 19.26◦, 21.74◦, 23.3◦, 25.18◦, and 29.05◦. This matches well withother reported data on crystalline furosemide [63, 61], though with a slight upward shiftin the 2θ angle. The most distinct peak (nr. 4) is reported at 24.7◦-24.8◦and is found at25.18◦in figure 3.5. The PCL film shows two peaks at 21.56◦and 23.89◦. This matchesthe peaks reported for semi crystalline PCL at 21.4◦and 23.6◦[64]. The PCL furosemidedrug matrix shows two peaks matching the peaks found for PCL exactly. This showsthat furosemide is in an amorphous state after the drug matrix is spin coated. A reasonfor this could be that the spin coating process acts as a quenching of the furosemide andthus hinders crystallization. Figure 3.6(a) shows the XRD curves obtained for the samplesthat are embossed and heat treated at 60 ◦C. The spectra obtained show peaks at thecharacteristic semi-crystalline PCL peaks as observed with the non treated film. It seemsthat the heat treatment at 60 ◦C does not affect the morphology of the drug matrix.
3.3. SUMMARY 27
(a) (b)
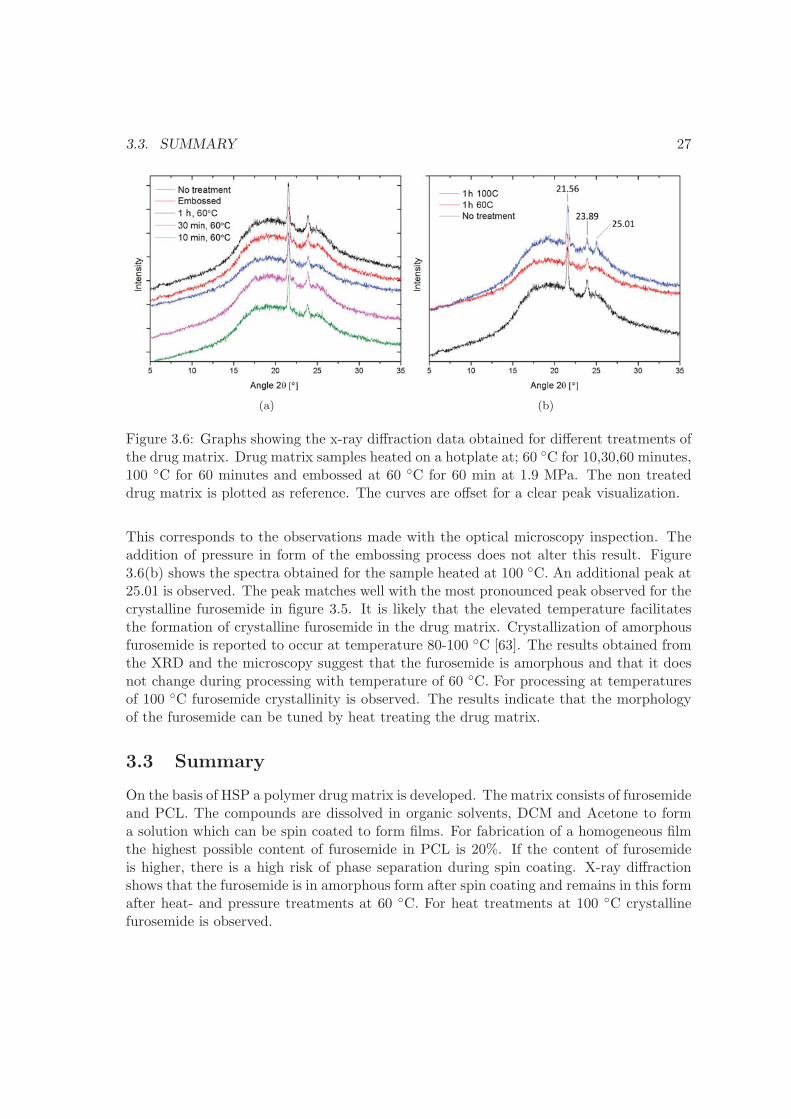
Figure 3.6: Graphs showing the x-ray diffraction data obtained for different treatments ofthe drug matrix. Drug matrix samples heated on a hotplate at; 60 ◦C for 10,30,60 minutes,100 ◦C for 60 minutes and embossed at 60 ◦C for 60 min at 1.9 MPa. The non treateddrug matrix is plotted as reference. The curves are offset for a clear peak visualization.
This corresponds to the observations made with the optical microscopy inspection. Theaddition of pressure in form of the embossing process does not alter this result. Figure3.6(b) shows the spectra obtained for the sample heated at 100 ◦C. An additional peak at25.01 is observed. The peak matches well with the most pronounced peak observed for thecrystalline furosemide in figure 3.5. It is likely that the elevated temperature facilitatesthe formation of crystalline furosemide in the drug matrix. Crystallization of amorphousfurosemide is reported to occur at temperature 80-100 ◦C [63]. The results obtained fromthe XRD and the microscopy suggest that the furosemide is amorphous and that it doesnot change during processing with temperature of 60 ◦C. For processing at temperaturesof 100 ◦C furosemide crystallinity is observed. The results indicate that the morphologyof the furosemide can be tuned by heat treating the drug matrix.
3.3 Summary
On the basis of HSP a polymer drug matrix is developed. The matrix consists of furosemideand PCL. The compounds are dissolved in organic solvents, DCM and Acetone to forma solution which can be spin coated to form films. For fabrication of a homogeneous filmthe highest possible content of furosemide in PCL is 20%. If the content of furosemideis higher, there is a high risk of phase separation during spin coating. X-ray diffractionshows that the furosemide is in amorphous form after spin coating and remains in this formafter heat- and pressure treatments at 60 ◦C. For heat treatments at 100 ◦C crystallinefurosemide is observed.

28 CHAPTER 3. POLYMER DRUG MATRIX
Chapter 4
Stamps
This chapter covers all the stamps fabricated in this project, from fabrication process todurability. Many stamps have been fabricated in the project in three different materials,SU-8, silicon and nickel. First, the fabrication processes are described along with thedesign, then a comparison of the stamps is given along with recommendations. Thedevelopment of deep reactive ion etches (DRIE) enabling the fabrication of nickel andsilicon stamps is then described.
4.1 Fabrication
The following sections contain a description of the processes used for fabricating stampswhile the detailed process flows for each stamp fabrication can be found in appendix G,H, I. The stamps are fabricated at the DTU Danchip cleanroom facilities. The techniquesused for the fabrication are; photolithography, wet and dry etching, metal deposition byevaporation and sputtering, electro plating, cutting and dicing. For knowledge on theoryand principles of the techniques the reader is referred to [55, 65, 56].
4.1.1 Design
The design of the stamp is based on previous experience with nano imprint lithography(NIL) and work carried out in the Nanoprobes group, where NIL was used to fabricatearrays of polymer cantilever chips [66]. The stamps are to be used in a hot embossingprocess of thick polymer films. The less material that needs to be displaced in order toobtain the wanted shape, the faster the embossing will be. For this reason it is chosento have the stamp structures ”stick out” of the stamp surface, as this will result in theleast amount of material displaced in the hot embossing process. For information on thehot embossing technique the reader is referred to [67]. Figure 4.1 shows the stamp design.The stamp is divided in 16 squares, each square with 20 by 20 individual units. With eachsquare containing 400 units, the total amount of units is 6400. Thus the stamp designenable the fabrication of 6400 containers. Figure 4.1(b) shows an individual unit. Itconsists of two parts, an inner disc and an outer ring structure. There are three importantparameters for this unit. 1) The diameter of inner disk, which translates into the inner
29
30 CHAPTER 4. STAMPS
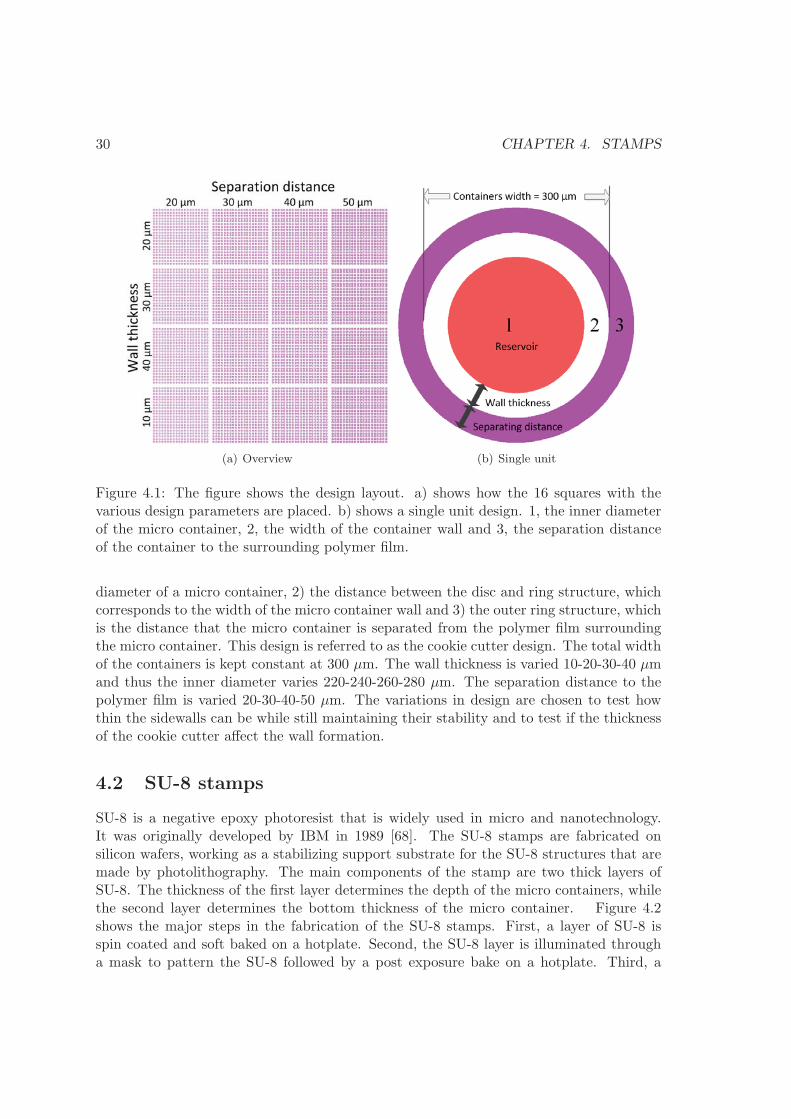
(a) Overview (b) Single unit
Figure 4.1: The figure shows the design layout. a) shows how the 16 squares with thevarious design parameters are placed. b) shows a single unit design. 1, the inner diameterof the micro container, 2, the width of the container wall and 3, the separation distanceof the container to the surrounding polymer film.
diameter of a micro container, 2) the distance between the disc and ring structure, whichcorresponds to the width of the micro container wall and 3) the outer ring structure, whichis the distance that the micro container is separated from the polymer film surroundingthe micro container. This design is referred to as the cookie cutter design. The total widthof the containers is kept constant at 300 μm. The wall thickness is varied 10-20-30-40 μmand thus the inner diameter varies 220-240-260-280 μm. The separation distance to thepolymer film is varied 20-30-40-50 μm. The variations in design are chosen to test howthin the sidewalls can be while still maintaining their stability and to test if the thicknessof the cookie cutter affect the wall formation.
4.2 SU-8 stamps
SU-8 is a negative epoxy photoresist that is widely used in micro and nanotechnology.It was originally developed by IBM in 1989 [68]. The SU-8 stamps are fabricated onsilicon wafers, working as a stabilizing support substrate for the SU-8 structures that aremade by photolithography. The main components of the stamp are two thick layers ofSU-8. The thickness of the first layer determines the depth of the micro containers, whilethe second layer determines the bottom thickness of the micro container. Figure 4.2shows the major steps in the fabrication of the SU-8 stamps. First, a layer of SU-8 isspin coated and soft baked on a hotplate. Second, the SU-8 layer is illuminated througha mask to pattern the SU-8 followed by a post exposure bake on a hotplate. Third, a
4.2. SU-8 STAMPS 31
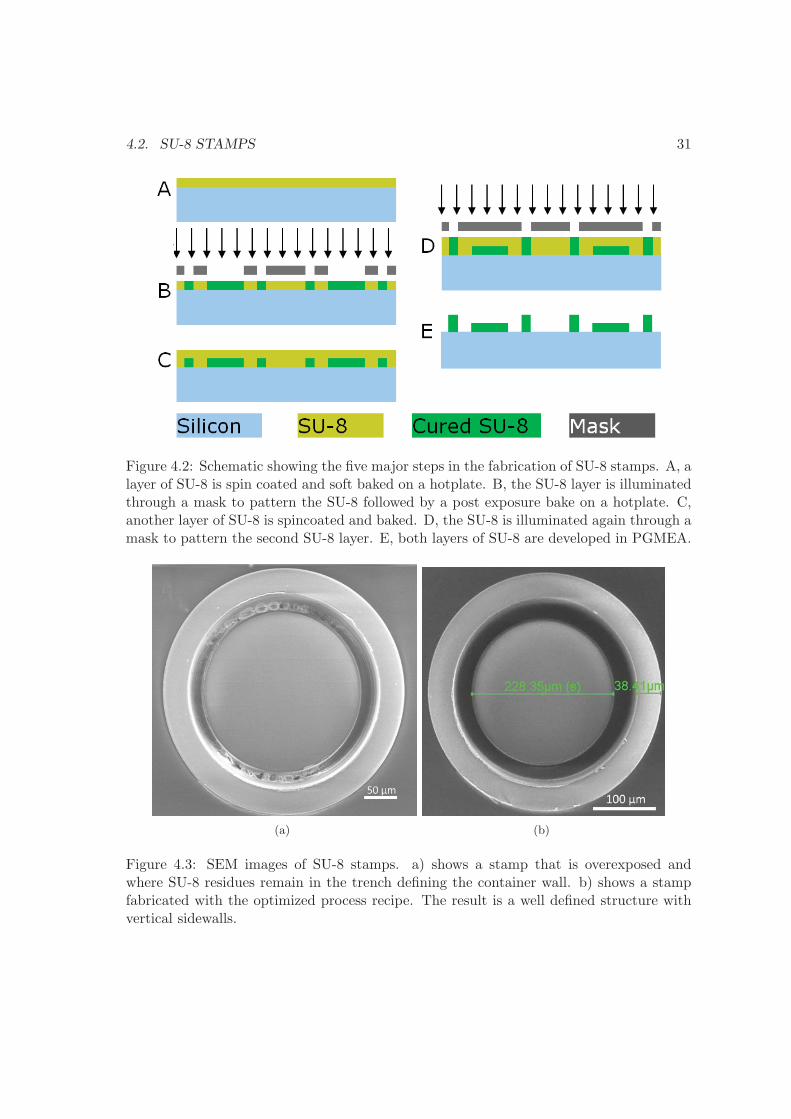
Figure 4.2: Schematic showing the five major steps in the fabrication of SU-8 stamps. A, alayer of SU-8 is spin coated and soft baked on a hotplate. B, the SU-8 layer is illuminatedthrough a mask to pattern the SU-8 followed by a post exposure bake on a hotplate. C,another layer of SU-8 is spincoated and baked. D, the SU-8 is illuminated again through amask to pattern the second SU-8 layer. E, both layers of SU-8 are developed in PGMEA.
(a) (b)
Figure 4.3: SEM images of SU-8 stamps. a) shows a stamp that is overexposed andwhere SU-8 residues remain in the trench defining the container wall. b) shows a stampfabricated with the optimized process recipe. The result is a well defined structure withvertical sidewalls.
32 CHAPTER 4. STAMPS
second SU-8 layer is spincoated and baked. Fourth, the second SU-8 layer is patternedby photolithography. Fifth, both layers of SU-8 are developed in propylene glycol methylether acetate (PGMEA). The tricky part of the fabrication is to find the right exposuredose for the SU-8. In the optimal case, the process produces vertical sidewalls which isa requirement for a successful embossing process. To achieve this, the SU-8 receives ahigh exposure dose, to ensure that the lower part of the film cross links properly. Toavoid heating of the upper part of the SU-8 film, the exposure is done in intervals with30 s cooling cycles between each exposure. Figure 4.3 shows SEM images of single SU-8stamp units. Figure 4.3(a) shows a case where the top part of the first SU-8 layer receivedsuch a high exposure dose that the inner disk is connected to the outer ring structure.Small residual structures remain in the trench. Figure 4.3(b) shows the optimized stampprocess, where vertical sidewalls and well defined structures are achieved. The detailsof the optimized process are found in appendix G. The unit shown in figure 4.3(b) hasthe following design parameters; 220 μm inner diameter, 40 μm wall thickness, 30 μmseparation distance. It is seen that the actual sizes of the SU-8 structures are larger andthat the SU-8 is overexposed by roughly 4 μm.
4.3 Silicon
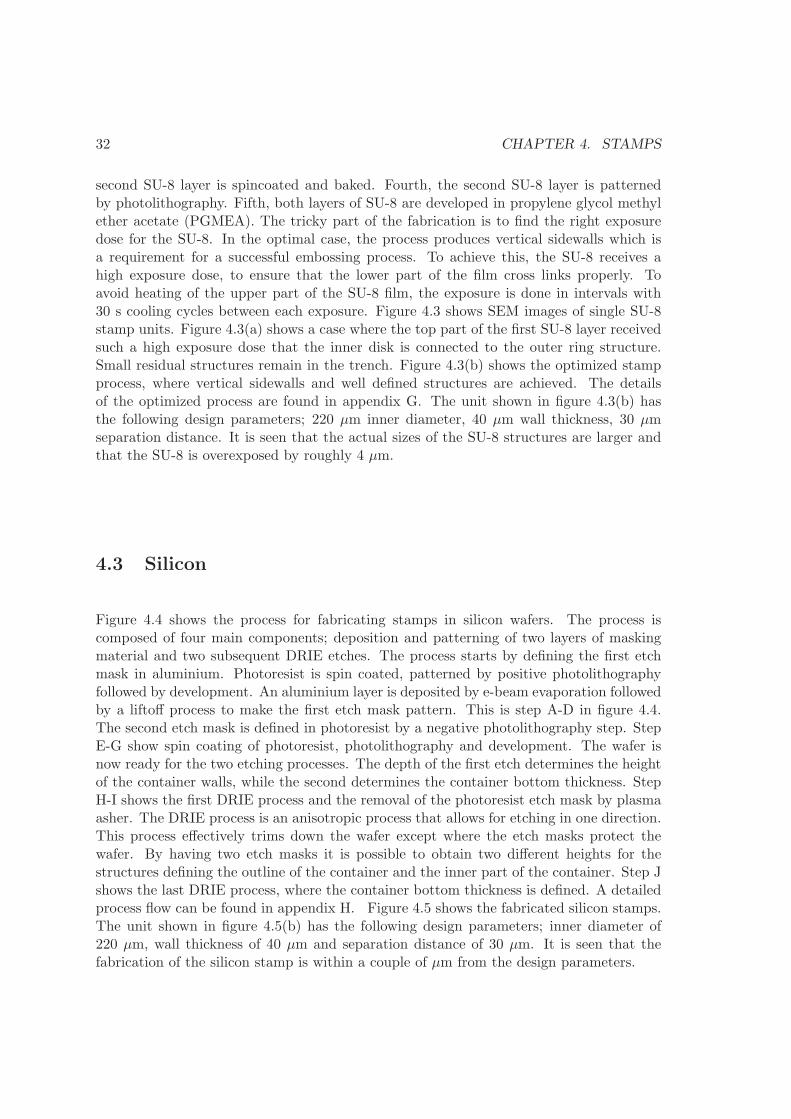
Figure 4.4 shows the process for fabricating stamps in silicon wafers. The process iscomposed of four main components; deposition and patterning of two layers of maskingmaterial and two subsequent DRIE etches. The process starts by defining the first etchmask in aluminium. Photoresist is spin coated, patterned by positive photolithographyfollowed by development. An aluminium layer is deposited by e-beam evaporation followedby a liftoff process to make the first etch mask pattern. This is step A-D in figure 4.4.The second etch mask is defined in photoresist by a negative photolithography step. StepE-G show spin coating of photoresist, photolithography and development. The wafer isnow ready for the two etching processes. The depth of the first etch determines the heightof the container walls, while the second determines the container bottom thickness. StepH-I shows the first DRIE process and the removal of the photoresist etch mask by plasmaasher. The DRIE process is an anisotropic process that allows for etching in one direction.This process effectively trims down the wafer except where the etch masks protect thewafer. By having two etch masks it is possible to obtain two different heights for thestructures defining the outline of the container and the inner part of the container. Step Jshows the last DRIE process, where the container bottom thickness is defined. A detailedprocess flow can be found in appendix H. Figure 4.5 shows the fabricated silicon stamps.The unit shown in figure 4.5(b) has the following design parameters; inner diameter of220 μm, wall thickness of 40 μm and separation distance of 30 μm. It is seen that thefabrication of the silicon stamp is within a couple of μm from the design parameters.
4.3. SILICON 33
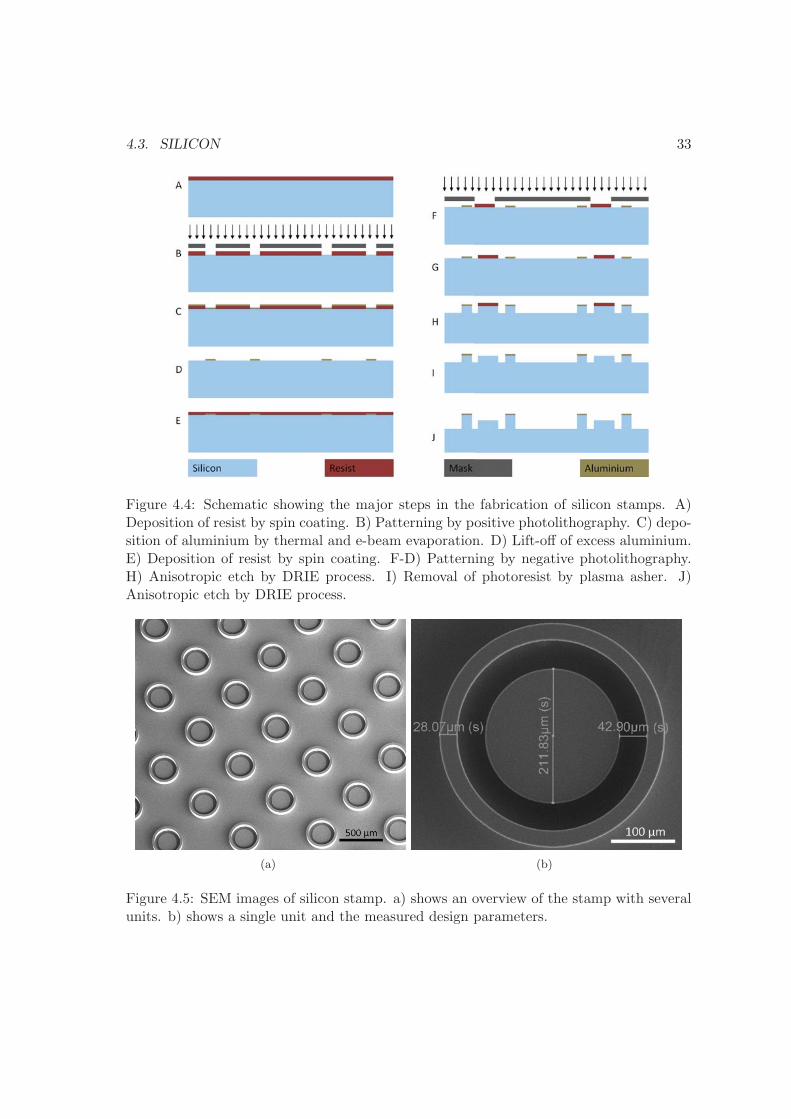
Figure 4.4: Schematic showing the major steps in the fabrication of silicon stamps. A)Deposition of resist by spin coating. B) Patterning by positive photolithography. C) depo-sition of aluminium by thermal and e-beam evaporation. D) Lift-off of excess aluminium.E) Deposition of resist by spin coating. F-D) Patterning by negative photolithography.H) Anisotropic etch by DRIE process. I) Removal of photoresist by plasma asher. J)Anisotropic etch by DRIE process.
(a) (b)
Figure 4.5: SEM images of silicon stamp. a) shows an overview of the stamp with severalunits. b) shows a single unit and the measured design parameters.
34 CHAPTER 4. STAMPS
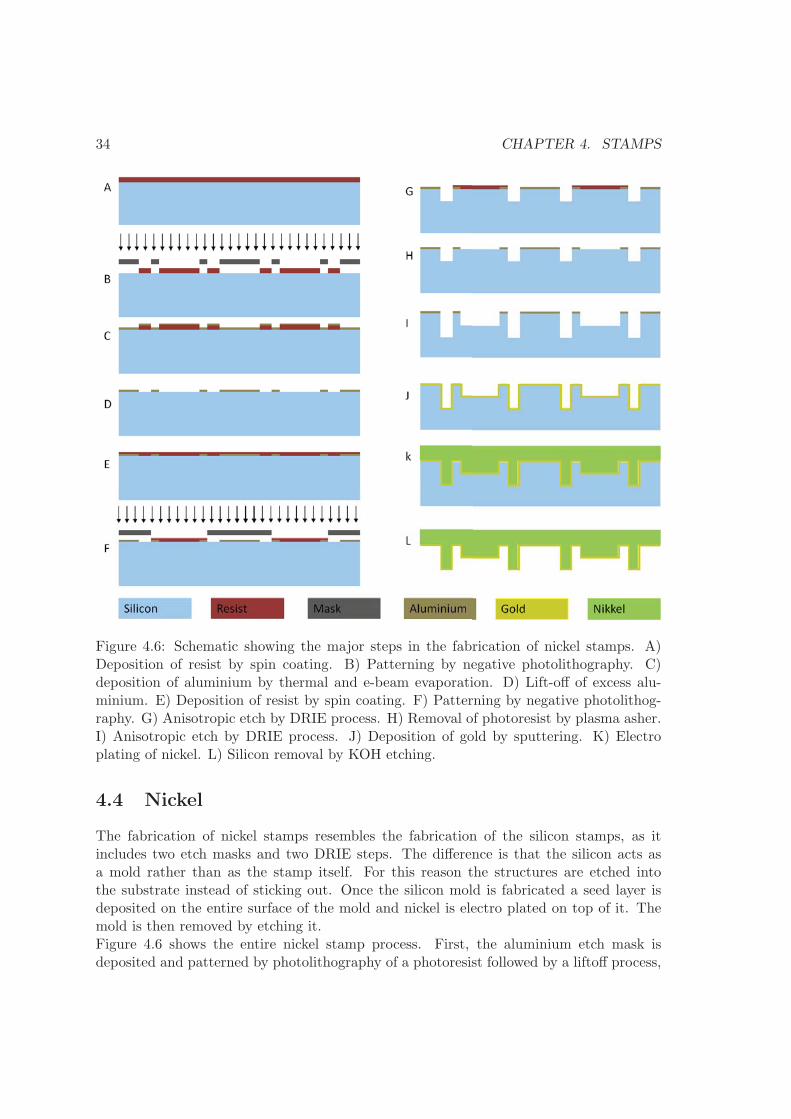
Figure 4.6: Schematic showing the major steps in the fabrication of nickel stamps. A)Deposition of resist by spin coating. B) Patterning by negative photolithography. C)deposition of aluminium by thermal and e-beam evaporation. D) Lift-off of excess alu-minium. E) Deposition of resist by spin coating. F) Patterning by negative photolithog-raphy. G) Anisotropic etch by DRIE process. H) Removal of photoresist by plasma asher.I) Anisotropic etch by DRIE process. J) Deposition of gold by sputtering. K) Electroplating of nickel. L) Silicon removal by KOH etching.
4.4 Nickel
The fabrication of nickel stamps resembles the fabrication of the silicon stamps, as itincludes two etch masks and two DRIE steps. The difference is that the silicon acts asa mold rather than as the stamp itself. For this reason the structures are etched intothe substrate instead of sticking out. Once the silicon mold is fabricated a seed layer isdeposited on the entire surface of the mold and nickel is electro plated on top of it. Themold is then removed by etching it.Figure 4.6 shows the entire nickel stamp process. First, the aluminium etch mask isdeposited and patterned by photolithography of a photoresist followed by a liftoff process,
4.5. STAMP COMPARISON 35
step A-D. Second, the photoresist mask is spun and patterned by photolithography, stepE-F. Third, DRIE process and removal of photoresist etch mask, step G-H. Fourth, secondDRIE process. The silicon mold is now complete and the electro plating of the nickel canstart. A gold seed layer is sputtered on the entire mold surface and the mold is submergedin a nickel plating bath, step J-K. Once the electro plating is complete, the wafer is rinsedin water and submerged into a KOH bath, where the silicon is etched away. Occasionally,a heightened edge arises from the electro plating process which is removed by cutting awaythe outer 1 cm of the nickel stamp. This marks the end of the fabrication and the stampis ready for use after rinse in water.
4.5 Stamp comparison
As described stamps in three materials, SU-8, silicon and nickel are produced. SU-8stamps are good for prototyping as they are fast to produce and many can be producedrapidly with a simple photolithography process. The downside of the SU-8 stamps arethat they quickly build up a significant amount of flaws during the embossing process.This can for example be delamination of single or multiple units during the release of thestamp after embossing or minor deformations. The addition of an anti-sticking coatingonly provides a minor prolongation of the lifetime of the SU-8 stamps. Adding a thinSU-8 layer below the two layers containing the structures decreases the delamination ofstructures. Generally, the SU-8 stamps can be used for 5-10 experiments. Silicon is astrong material and is widely used for stamps in the NIL industry. The fabrication ofthe silicon stamps is longer than for SU-8 and not as suitable for a large production asit contains several single wafer processes. Especially the deposition of aluminium andthe DRIE processes are time consuming. Unfortunately, the silicon stamps turned outto be very fragile and cracking of stamps during the separation of stamp and embossedfilm occurred frequently, contrary to expectations. The reason for the cracking is believedto be caused by the relative large amount of silicon removed during the DRIE process,exposing defects and/or creating them in the silicon wafer. Cracking of the silicon wafersis not observed for the support wafers used for the SU-8 stamps and thus the processingof the silicon must weaken the strength of the material. Due to the cracking problem,the silicon stamps perform poorly and can generally only be used for 1-2 experiments.A better and stronger solution than both the silicon and the SU-8 is desired for stableand repeatable container embossing process. For this reason the attention is turned tonickel which is a very strong material without the brittle properties of silicon. It is used inindustry for replication of DVD’s among other processes requiring a very high throughputand thus durability. It incorporates well in the developed silicon technology used for thesilicon stamp and nickel can be deposited / grown by electroplating on a seed layer. Thefabrication process of a nickel stamp resembles the silicon stamp process with an extradeposition of a seed layer followed by electro plating and removal of the silicon mold. Thusthe process is more time consuming, though the final result is a highly durable stamp withprecision of silicon fabrication technology. The strength of the nickel stamps depends onthe speed of the electro plating process. The slower the deposition of nickel is, the more

36 CHAPTER 4. STAMPS
Table 4.1: Comparison of SU-8, silicon and nickel stamps. Precision denotes deviation ofthe actual fabricated structures from the mask design.Material Precision Fabrication time Anti-sticking coating Durability
SU-8 +4 μm < 1 week Minimal improvement < 5-10 experimentsSilicon +2 μm < 2 weeks Minimal improvement < 2 experimentsNickel +3 μm < 3 weeks Not needed >50 experiments
dense and stiff the nickel will be. The deposition of 500 μm nickel can be done in 4 hours,though it is recommended to do this over a 12-24 hours period to achieve a denser andmore stiff nickel. This lowers the risk of stamp deformation in the final cutting process.The nickel stamps fabricated remain without noteworthy faults after many embossingexperiments. Table 4.1 summarizes the three different stamp materials and their respectiveperformances. The precision describes the difference between fabricated structure size andmask design. Some of the processes will inevitably result in a different size than that ofthe mask design and is by no means a measure of a bad process. The information providesa basis to design structures of desired dimensions if one are to follow the given processes.The fabrication time provides a realistic time frame for fabrication of the stamps at theDanchip cleanroom facilities. Faster fabrication is possible, though delays often occurdue to machine use and service. Anti-sticking coatings developed by Keller et al. [62]and from a ”Applied Microstructures MVD 100 system” are tested for the SU-8 andsilicon stamps. The coatings improve the separation process after embossing, but do notextend the lifetime of the stamps significantly. The durability summarizes the number ofexperiments that one can expect from the given stamps. For the nickel stamp this numbercould very well be significantly higher as no faults are observed after extensive use. Forhot embossing experiments similar to the ones performed in this project with thick films itis advised to use nickel stamps as they are the most robust stamps and can be fabricatedwith the same precision as the silicon and SU-8 stamps.
4.6 DRIE process development
The deep reactive ion etch processes used in the stamp fabrication are important for thefunctionallity of the stamps. The etch must produce structures where the sidewall is eithervertical or with a slope that allows the stamp to be separated from the embossed polymerfilm without compressing the polymer in the separation. Figure 4.7 shows a graphicalrepresentation of this. Figure 4.7(a) shows a situation where separation of the stamp iseasy, as the tips of the stamp are narrower than the base structure. Figure 4.7(b) showsthe opposite situation where the tips are wider than the base structure. To separatethe stamp from the film, the film will be compressed during separation or the film willrupture if separation is even possible. Situation (a) is referred to as positive sidewallslope and situation (b) as negative sidewall slope. Two DRIE processes are developedto accommodate positively sloped sidewalls. The standard mode of operation for DRIE
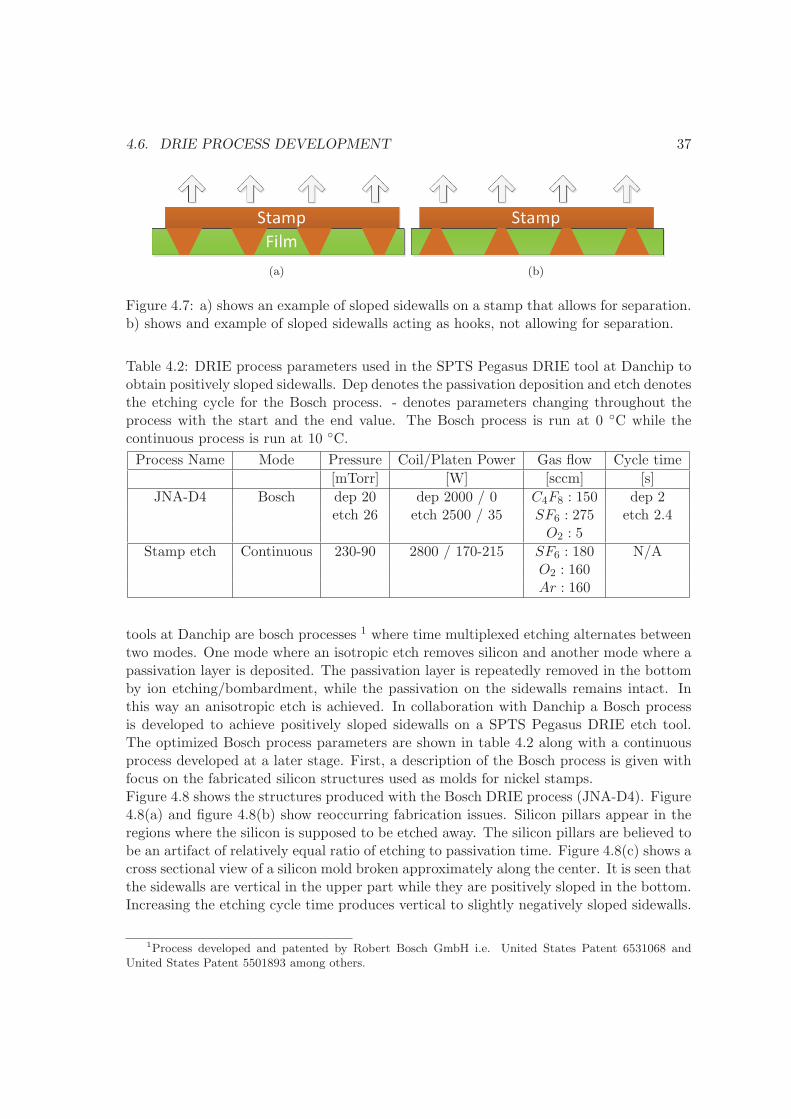
4.6. DRIE PROCESS DEVELOPMENT 37
(a) (b)
Figure 4.7: a) shows an example of sloped sidewalls on a stamp that allows for separation.b) shows and example of sloped sidewalls acting as hooks, not allowing for separation.
Table 4.2: DRIE process parameters used in the SPTS Pegasus DRIE tool at Danchip toobtain positively sloped sidewalls. Dep denotes the passivation deposition and etch denotesthe etching cycle for the Bosch process. - denotes parameters changing throughout theprocess with the start and the end value. The Bosch process is run at 0 ◦C while thecontinuous process is run at 10 ◦C.Process Name Mode Pressure Coil/Platen Power Gas flow Cycle time
[mTorr] [W] [sccm] [s]
JNA-D4 Bosch dep 20 dep 2000 / 0 C4F8 : 150 dep 2etch 26 etch 2500 / 35 SF6 : 275 etch 2.4
O2 : 5
Stamp etch Continuous 230-90 2800 / 170-215 SF6 : 180 N/AO2 : 160Ar : 160
tools at Danchip are bosch processes 1 where time multiplexed etching alternates betweentwo modes. One mode where an isotropic etch removes silicon and another mode where apassivation layer is deposited. The passivation layer is repeatedly removed in the bottomby ion etching/bombardment, while the passivation on the sidewalls remains intact. Inthis way an anisotropic etch is achieved. In collaboration with Danchip a Bosch processis developed to achieve positively sloped sidewalls on a SPTS Pegasus DRIE etch tool.The optimized Bosch process parameters are shown in table 4.2 along with a continuousprocess developed at a later stage. First, a description of the Bosch process is given withfocus on the fabricated silicon structures used as molds for nickel stamps.Figure 4.8 shows the structures produced with the Bosch DRIE process (JNA-D4). Figure4.8(a) and figure 4.8(b) show reoccurring fabrication issues. Silicon pillars appear in theregions where the silicon is supposed to be etched away. The silicon pillars are believed tobe an artifact of relatively equal ratio of etching to passivation time. Figure 4.8(c) shows across sectional view of a silicon mold broken approximately along the center. It is seen thatthe sidewalls are vertical in the upper part while they are positively sloped in the bottom.Increasing the etching cycle time produces vertical to slightly negatively sloped sidewalls.
1Process developed and patented by Robert Bosch GmbH i.e. United States Patent 6531068 andUnited States Patent 5501893 among others.
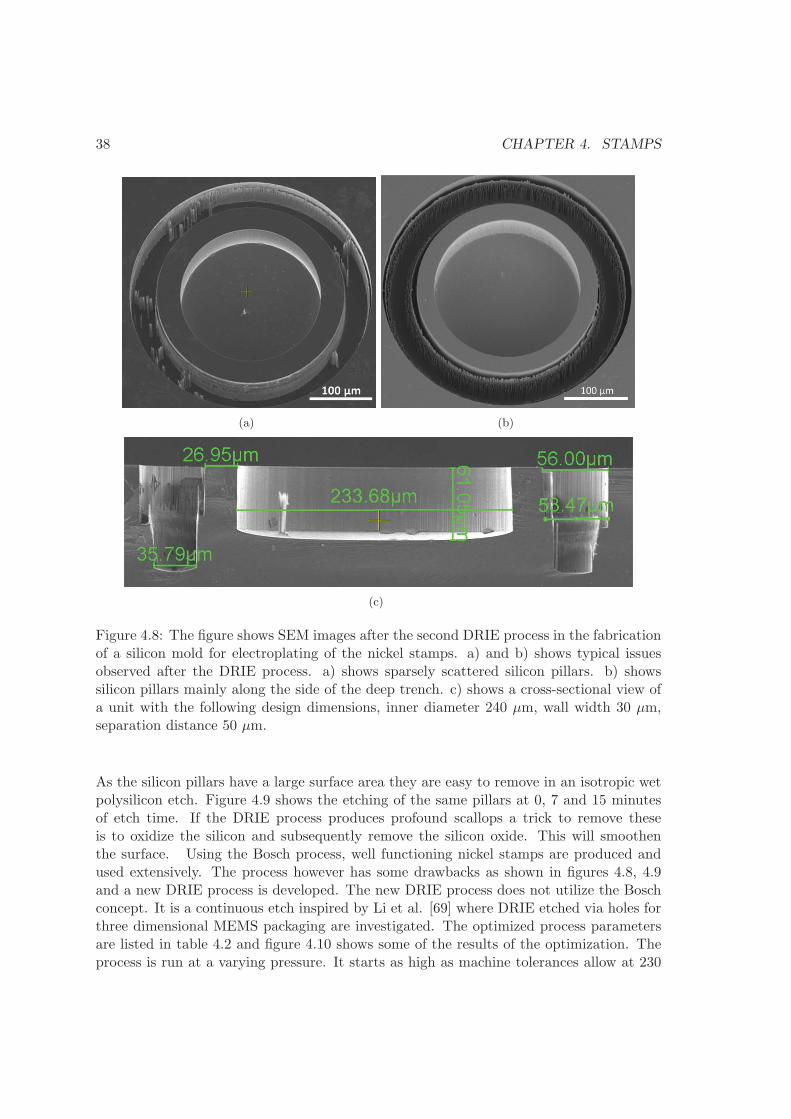
38 CHAPTER 4. STAMPS
(a) (b)
(c)
Figure 4.8: The figure shows SEM images after the second DRIE process in the fabricationof a silicon mold for electroplating of the nickel stamps. a) and b) shows typical issuesobserved after the DRIE process. a) shows sparsely scattered silicon pillars. b) showssilicon pillars mainly along the side of the deep trench. c) shows a cross-sectional view ofa unit with the following design dimensions, inner diameter 240 μm, wall width 30 μm,separation distance 50 μm.
As the silicon pillars have a large surface area they are easy to remove in an isotropic wetpolysilicon etch. Figure 4.9 shows the etching of the same pillars at 0, 7 and 15 minutesof etch time. If the DRIE process produces profound scallops a trick to remove theseis to oxidize the silicon and subsequently remove the silicon oxide. This will smoothenthe surface. Using the Bosch process, well functioning nickel stamps are produced andused extensively. The process however has some drawbacks as shown in figures 4.8, 4.9and a new DRIE process is developed. The new DRIE process does not utilize the Boschconcept. It is a continuous etch inspired by Li et al. [69] where DRIE etched via holes forthree dimensional MEMS packaging are investigated. The optimized process parametersare listed in table 4.2 and figure 4.10 shows some of the results of the optimization. Theprocess is run at a varying pressure. It starts as high as machine tolerances allow at 230
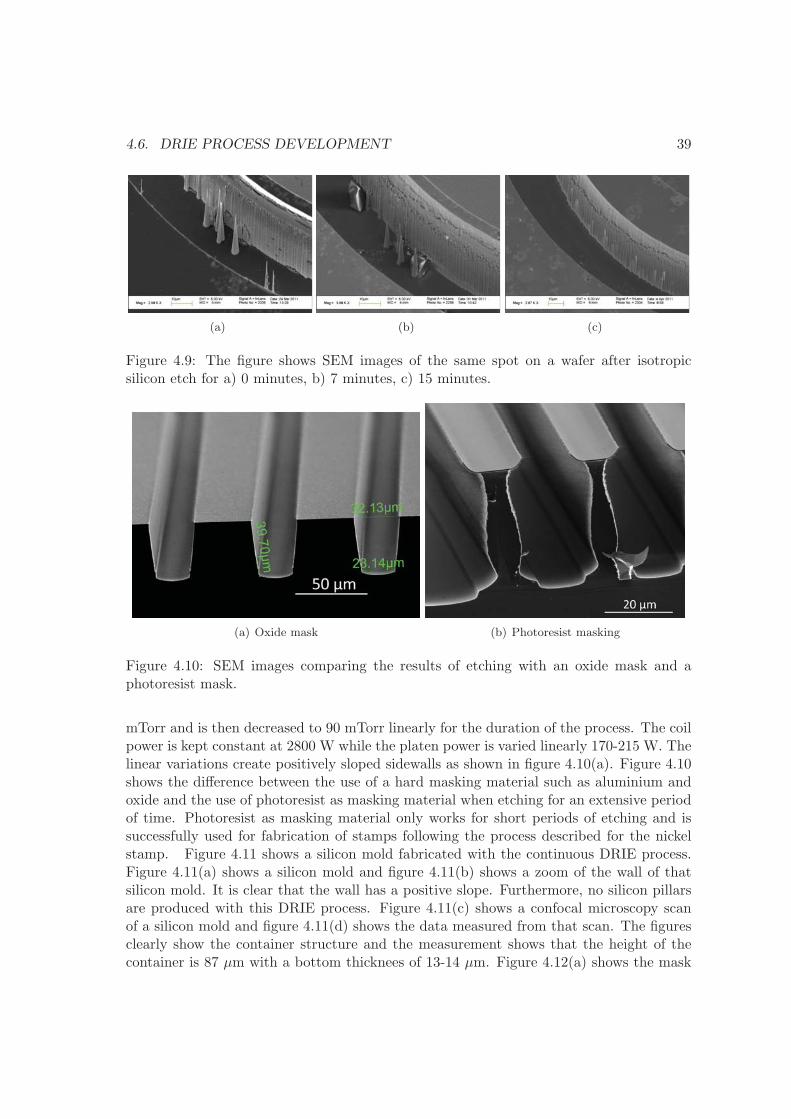
4.6. DRIE PROCESS DEVELOPMENT 39
(a) (b) (c)
Figure 4.9: The figure shows SEM images of the same spot on a wafer after isotropicsilicon etch for a) 0 minutes, b) 7 minutes, c) 15 minutes.
(a) Oxide mask (b) Photoresist masking
Figure 4.10: SEM images comparing the results of etching with an oxide mask and aphotoresist mask.
mTorr and is then decreased to 90 mTorr linearly for the duration of the process. The coilpower is kept constant at 2800 W while the platen power is varied linearly 170-215 W. Thelinear variations create positively sloped sidewalls as shown in figure 4.10(a). Figure 4.10shows the difference between the use of a hard masking material such as aluminium andoxide and the use of photoresist as masking material when etching for an extensive periodof time. Photoresist as masking material only works for short periods of etching and issuccessfully used for fabrication of stamps following the process described for the nickelstamp. Figure 4.11 shows a silicon mold fabricated with the continuous DRIE process.Figure 4.11(a) shows a silicon mold and figure 4.11(b) shows a zoom of the wall of thatsilicon mold. It is clear that the wall has a positive slope. Furthermore, no silicon pillarsare produced with this DRIE process. Figure 4.11(c) shows a confocal microscopy scanof a silicon mold and figure 4.11(d) shows the data measured from that scan. The figuresclearly show the container structure and the measurement shows that the height of thecontainer is 87 μm with a bottom thicknees of 13-14 μm. Figure 4.12(a) shows the mask

40 CHAPTER 4. STAMPS
(a) (b) (c)
(d)
Figure 4.11: The figure shows SEM images of a silicon mold fabricated with the stampetch process and a confocal microscopy scan of a silicon mold and the data obtained. Itis seen that the sidewalls are positively sloped. The confocal microscopy scan shows thatthe bottom thickness of the container is roughly 13-14 μm and that the reservoir depth is73-74 μm.
(a) (b)
Figure 4.12: The figure shows a mask design and a SEM image of a silicon wafer etchedwith the continues DRIE process. a) the mask design consists of squares of 300 μm by300 μm. b) shows a cross-sectional view of a wafer broken along one of the etch lines.
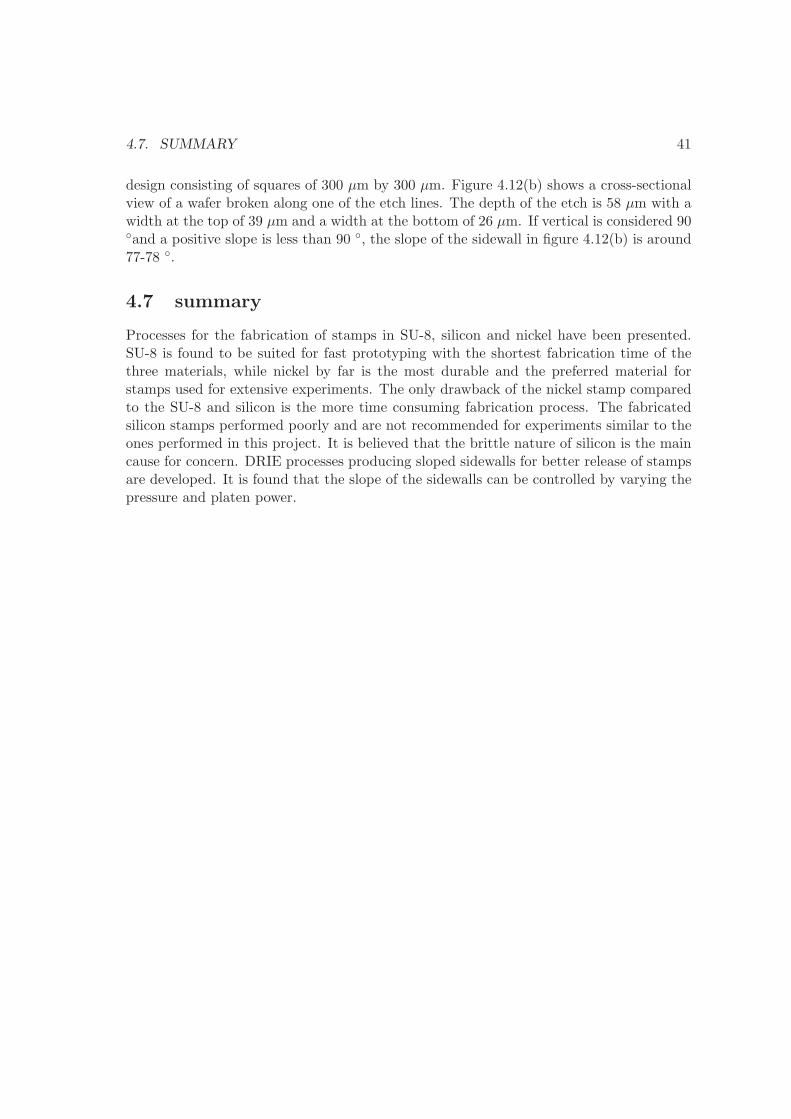
4.7. SUMMARY 41
design consisting of squares of 300 μm by 300 μm. Figure 4.12(b) shows a cross-sectionalview of a wafer broken along one of the etch lines. The depth of the etch is 58 μm with awidth at the top of 39 μm and a width at the bottom of 26 μm. If vertical is considered 90◦and a positive slope is less than 90 ◦, the slope of the sidewall in figure 4.12(b) is around77-78 ◦.
4.7 summary
Processes for the fabrication of stamps in SU-8, silicon and nickel have been presented.SU-8 is found to be suited for fast prototyping with the shortest fabrication time of thethree materials, while nickel by far is the most durable and the preferred material forstamps used for extensive experiments. The only drawback of the nickel stamp comparedto the SU-8 and silicon is the more time consuming fabrication process. The fabricatedsilicon stamps performed poorly and are not recommended for experiments similar to theones performed in this project. It is believed that the brittle nature of silicon is the maincause for concern. DRIE processes producing sloped sidewalls for better release of stampsare developed. It is found that the slope of the sidewalls can be controlled by varying thepressure and platen power.

42 CHAPTER 4. STAMPS
Chapter 5
Micro containers
This chapter covers the different micro containers fabricated in this project. First, theSU-8 container fabrication is described along with examples of different container designs.A short review of possible fabrication technologies is given along with arguments of whytechnologies are chosen or discarded. Then the micro containers fabricated in the FDAapproved biopolymers polycaprolactone and polylactide acid [70] are described along withthe hot embossing process used to do so.
5.1 SU-8 micro containers
The first prototypes of the micro containers are fabricated in the photosensitive epoxyresist SU-8. The process resembles the one described for the fabrication of SU-8 stamps insection 4.2. Figure 5.1 shows the fabrication process. A layer of SU-8 is spin coated on asilicon wafer and baked. The layer is then patterned by photolithography. The thicknessof this layer defines the bottom thickness of the micro containers. A second layer of SU-8is spin coated and patterned by photolithography. The thickness of this layer defines theheight of the micro container walls. The patterning of the container in the two SU-8 lay-ers is now complete and the SU-8 is developed in propylene glycol methyl ether acetate.The development removes the non exposed SU-8 leaving behind the micro containers ona silicon wafer. The exact process details for the containers are described in appendixF. Micro containers with different design parameters are fabricated to meet experimentcriteria and to showcase different possibilities. The most used design is containers with anouter diameter of 300 μm and an inner diameter of 200-260, thus varying the wall thicknessfrom 20-50 μm. The height of the fabricated containers is varied as well and containerswith a total height ranging 85-300 μm are realized. The SU-8 micro container process isa very flexible process and various geometries can be fabricated with it. Figure 5.2 showssome of the possibilities of the process. Figure 5.2(a) shows micro containers with fourdifferent diameters of 50,100,150,300 μm and multiple compartments in the case of thesquared containers with compartments sizes of 20,40,60,120 μm. As seen in the figurethe three largest container sizes are mechanically stable, while the smallest container isleaning a bit. Figure 5.2(b) shows containers with a diameter of 300 μm and varying wall
43

44 CHAPTER 5. MICRO CONTAINERS
Figure 5.1: Schematic showing the five major steps for the fabrication of SU-8 microcontainers. A, a layer of SU-8 is spin coated on a silicon wafer. B, the bottom containerlayer is exposed. C, another layer of SU-8 is spin coated. D, the container sidewalls areexposed. E, the redundant SU-8 is removed in propylene glycol methyl ether acetate.
thickness. The wall thickness needs to be thicker than 5 μm for a container to maintainits stability and avoid buckling. Figure 5.3 shows the typical micro container designwith an outer diameter of 300 μm. The wall thickness of the containers shown is 40 μmby design although the actual size is slightly larger. The SU-8 prototype containers aremainly used by collaborators to test various drug delivery aspects involving filling of microcontainers and spacial confinement of drugs [71] [72]. In this work, SU-8 micro containersare used to test wafer scale filling of micro containers with a solid polymer drug matrixby embossing. This method enables filling of thousands of micro containers in one processand is described in section 6.1 and appendix A.
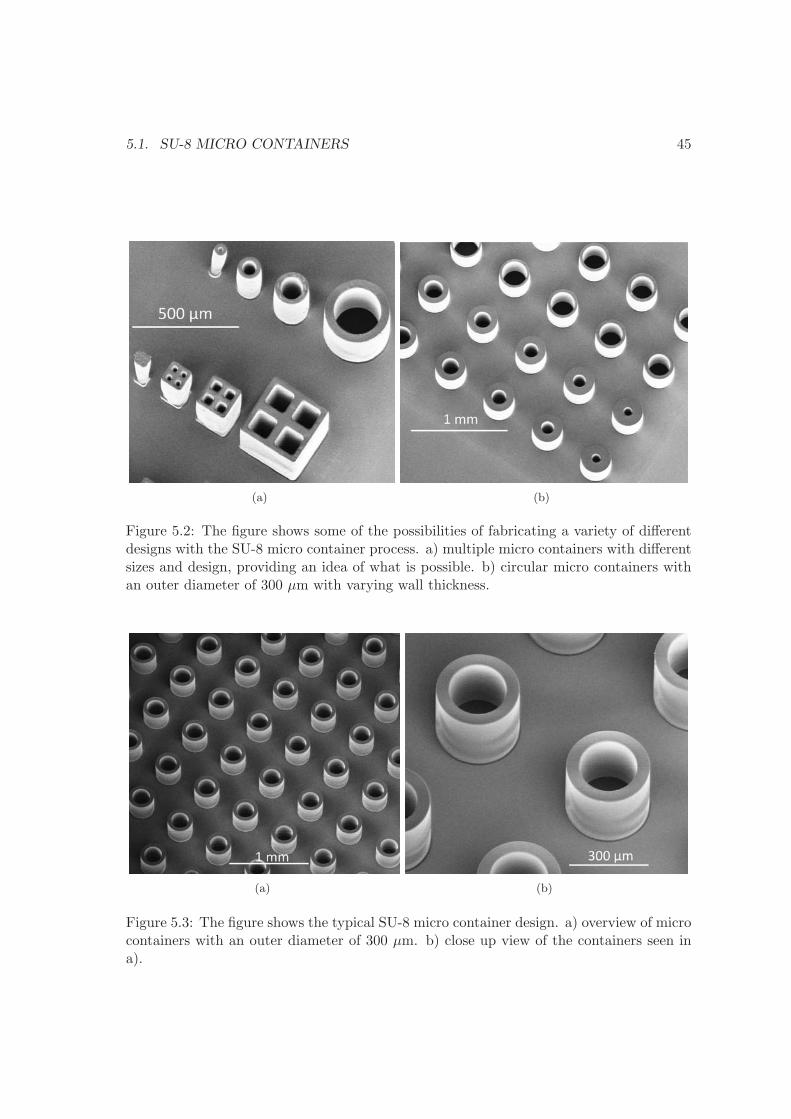
5.1. SU-8 MICRO CONTAINERS 45
(a) (b)
Figure 5.2: The figure shows some of the possibilities of fabricating a variety of differentdesigns with the SU-8 micro container process. a) multiple micro containers with differentsizes and design, providing an idea of what is possible. b) circular micro containers withan outer diameter of 300 μm with varying wall thickness.
(a) (b)
Figure 5.3: The figure shows the typical SU-8 micro container design. a) overview of microcontainers with an outer diameter of 300 μm. b) close up view of the containers seen ina).
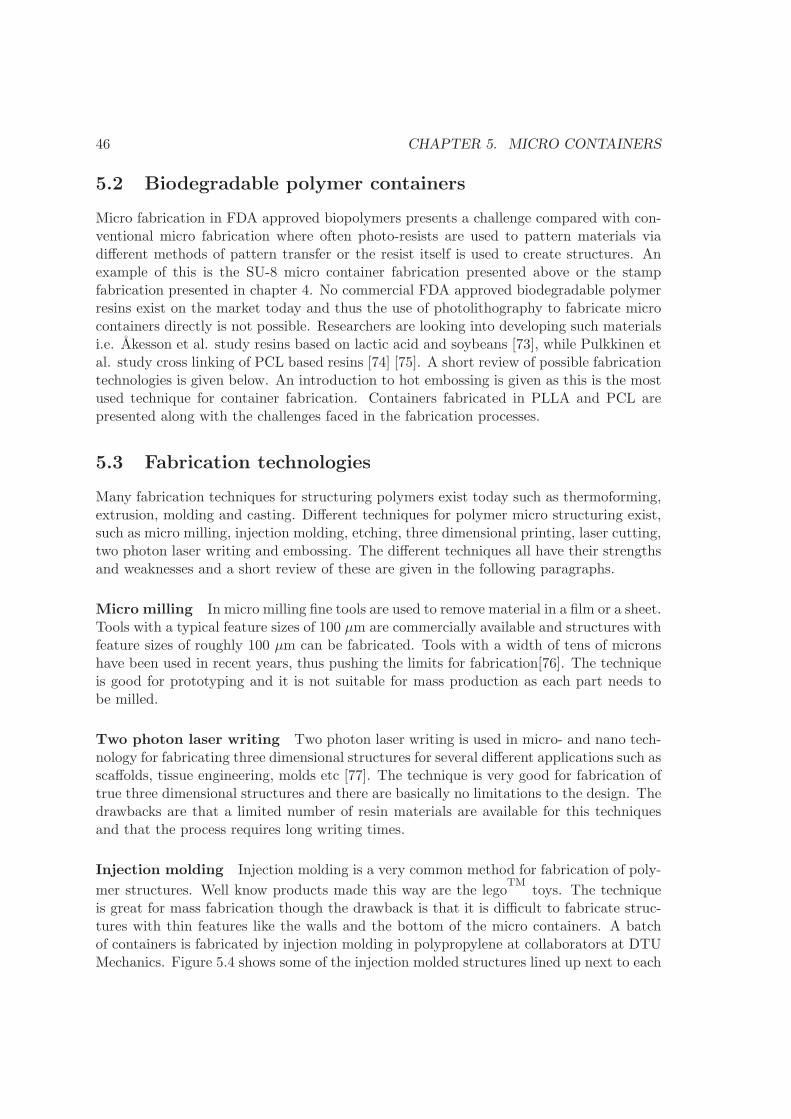
46 CHAPTER 5. MICRO CONTAINERS
5.2 Biodegradable polymer containers
Micro fabrication in FDA approved biopolymers presents a challenge compared with con-ventional micro fabrication where often photo-resists are used to pattern materials viadifferent methods of pattern transfer or the resist itself is used to create structures. Anexample of this is the SU-8 micro container fabrication presented above or the stampfabrication presented in chapter 4. No commercial FDA approved biodegradable polymerresins exist on the market today and thus the use of photolithography to fabricate microcontainers directly is not possible. Researchers are looking into developing such materialsi.e. Akesson et al. study resins based on lactic acid and soybeans [73], while Pulkkinen etal. study cross linking of PCL based resins [74] [75]. A short review of possible fabricationtechnologies is given below. An introduction to hot embossing is given as this is the mostused technique for container fabrication. Containers fabricated in PLLA and PCL arepresented along with the challenges faced in the fabrication processes.
5.3 Fabrication technologies
Many fabrication techniques for structuring polymers exist today such as thermoforming,extrusion, molding and casting. Different techniques for polymer micro structuring exist,such as micro milling, injection molding, etching, three dimensional printing, laser cutting,two photon laser writing and embossing. The different techniques all have their strengthsand weaknesses and a short review of these are given in the following paragraphs.
Micro milling In micro milling fine tools are used to remove material in a film or a sheet.Tools with a typical feature sizes of 100 μm are commercially available and structures withfeature sizes of roughly 100 μm can be fabricated. Tools with a width of tens of micronshave been used in recent years, thus pushing the limits for fabrication[76]. The techniqueis good for prototyping and it is not suitable for mass production as each part needs tobe milled.
Two photon laser writing Two photon laser writing is used in micro- and nano tech-nology for fabricating three dimensional structures for several different applications such asscaffolds, tissue engineering, molds etc [77]. The technique is very good for fabrication oftrue three dimensional structures and there are basically no limitations to the design. Thedrawbacks are that a limited number of resin materials are available for this techniquesand that the process requires long writing times.
Injection molding Injection molding is a very common method for fabrication of poly-
mer structures. Well know products made this way are the legoTM
toys. The techniqueis great for mass fabrication though the drawback is that it is difficult to fabricate struc-tures with thin features like the walls and the bottom of the micro containers. A batchof containers is fabricated by injection molding in polypropylene at collaborators at DTUMechanics. Figure 5.4 shows some of the injection molded structures lined up next to each
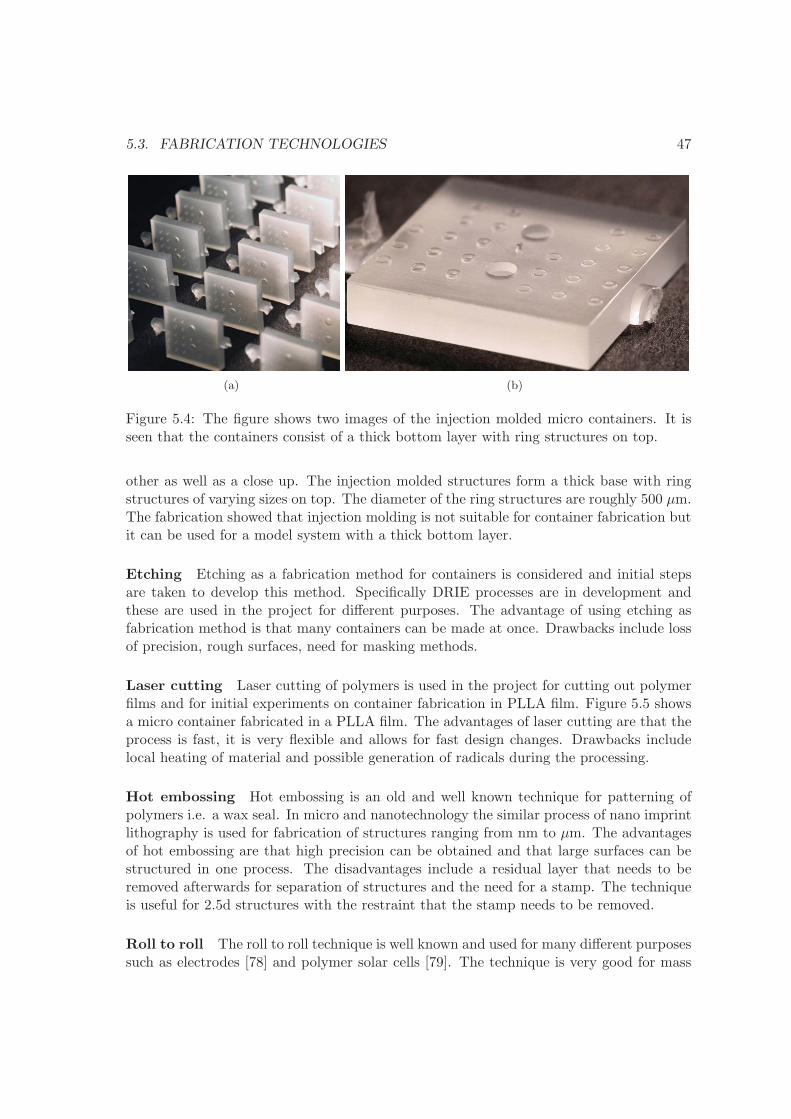
5.3. FABRICATION TECHNOLOGIES 47
(a) (b)
Figure 5.4: The figure shows two images of the injection molded micro containers. It isseen that the containers consist of a thick bottom layer with ring structures on top.
other as well as a close up. The injection molded structures form a thick base with ringstructures of varying sizes on top. The diameter of the ring structures are roughly 500 μm.The fabrication showed that injection molding is not suitable for container fabrication butit can be used for a model system with a thick bottom layer.
Etching Etching as a fabrication method for containers is considered and initial stepsare taken to develop this method. Specifically DRIE processes are in development andthese are used in the project for different purposes. The advantage of using etching asfabrication method is that many containers can be made at once. Drawbacks include lossof precision, rough surfaces, need for masking methods.
Laser cutting Laser cutting of polymers is used in the project for cutting out polymerfilms and for initial experiments on container fabrication in PLLA film. Figure 5.5 showsa micro container fabricated in a PLLA film. The advantages of laser cutting are that theprocess is fast, it is very flexible and allows for fast design changes. Drawbacks includelocal heating of material and possible generation of radicals during the processing.
Hot embossing Hot embossing is an old and well known technique for patterning ofpolymers i.e. a wax seal. In micro and nanotechnology the similar process of nano imprintlithography is used for fabrication of structures ranging from nm to μm. The advantagesof hot embossing are that high precision can be obtained and that large surfaces can bestructured in one process. The disadvantages include a residual layer that needs to beremoved afterwards for separation of structures and the need for a stamp. The techniqueis useful for 2.5d structures with the restraint that the stamp needs to be removed.
Roll to roll The roll to roll technique is well known and used for many different purposessuch as electrodes [78] and polymer solar cells [79]. The technique is very good for mass

48 CHAPTER 5. MICRO CONTAINERS
Figure 5.5: Optical image of a micro container made by laser cutting of a PLLA film. Theimage show the light reflecting of the sloped sidewalls of the container.
production and a good candidate for commercialization of micro containers. The drawbackis that large quantities of material are required for the development of a working process.
5.4 Comparison of methods
When deciding which fabrication method to go with it is important to keep in mind whatthe potential volume of containers is and what requirements one has to the dimensions ofthe containers. In the case of the model drug furosemide, a dose of 20 mg - 40 mg is commonfor the treatment of edema. If a 20 mg furosemide dose is to fit inside containers withoutany excipient the following amount of containers are needed, assuming a cylindrical shapewith an inner diamter of 200 μm and a height of 100 μm.
# containers =0.020g · 1.6 g
cm3
π · (0.01cm)2 · 0.01cm ≈ 10000 containers (5.1)
With a need for thousands of containers some of the fabrication methods can be elim-inated. Two photon laser writing as well as micro milling do not offer an acceptablevolume production. Etching could be possible though several aspect of this technique re-main uncertain. As for laser writing and embossing, both techniques offer medium volumeproduction and are possible condidates. Roll to roll and injection molding are both highvolume production techniques. Roll to roll facilities are not accessible to the Nanoprobesgroup and thus this technique has not been explored. Injection molding is possible thoughinitial experiments showed extensive challenges to overcome with respect to size and pre-cision of container production and thus this method is discarded. This leaves embossingand laser cutting as candidates. Embossing is chosen as the main fabrication method asthis technique offers medium production and high precision fabrication. Laser cutting
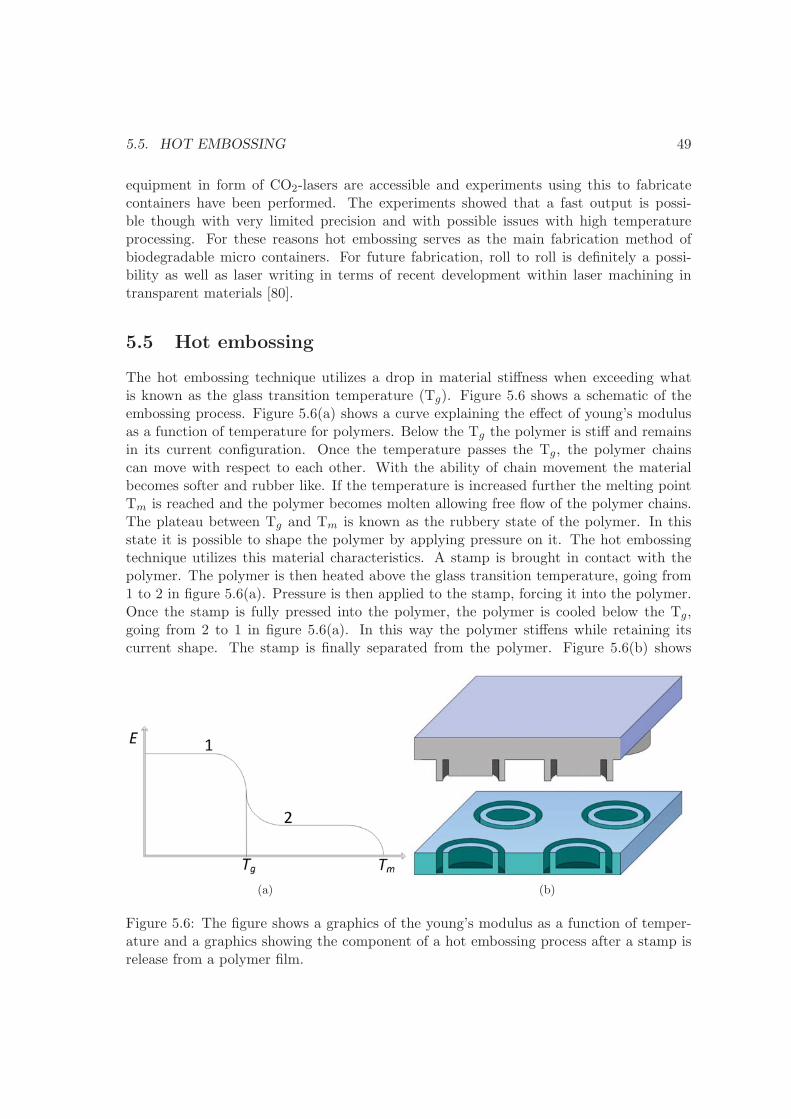
5.5. HOT EMBOSSING 49
equipment in form of CO2-lasers are accessible and experiments using this to fabricatecontainers have been performed. The experiments showed that a fast output is possi-ble though with very limited precision and with possible issues with high temperatureprocessing. For these reasons hot embossing serves as the main fabrication method ofbiodegradable micro containers. For future fabrication, roll to roll is definitely a possi-bility as well as laser writing in terms of recent development within laser machining intransparent materials [80].
5.5 Hot embossing
The hot embossing technique utilizes a drop in material stiffness when exceeding whatis known as the glass transition temperature (Tg). Figure 5.6 shows a schematic of theembossing process. Figure 5.6(a) shows a curve explaining the effect of young’s modulusas a function of temperature for polymers. Below the Tg the polymer is stiff and remainsin its current configuration. Once the temperature passes the Tg, the polymer chainscan move with respect to each other. With the ability of chain movement the materialbecomes softer and rubber like. If the temperature is increased further the melting pointTm is reached and the polymer becomes molten allowing free flow of the polymer chains.The plateau between Tg and Tm is known as the rubbery state of the polymer. In thisstate it is possible to shape the polymer by applying pressure on it. The hot embossingtechnique utilizes this material characteristics. A stamp is brought in contact with thepolymer. The polymer is then heated above the glass transition temperature, going from1 to 2 in figure 5.6(a). Pressure is then applied to the stamp, forcing it into the polymer.Once the stamp is fully pressed into the polymer, the polymer is cooled below the Tg,going from 2 to 1 in figure 5.6(a). In this way the polymer stiffens while retaining itscurrent shape. The stamp is finally separated from the polymer. Figure 5.6(b) shows
(a) (b)
Figure 5.6: The figure shows a graphics of the young’s modulus as a function of temper-ature and a graphics showing the component of a hot embossing process after a stamp isrelease from a polymer film.
50 CHAPTER 5. MICRO CONTAINERS
an illustration of a stamp after embossing and separation of the stamp from the polymerlayer. The structures on the stamp can either stick out of the surface or be grooved inthe surface. In this case the structures are sticking out of the surface. The reason is thatless materials needs to be move in the embossing process. The less material that needs tobe displaced in order to obtain the wanted shape, the quicker the embossing will be. Theentire process is often run in vacuum to avoid trapping of air bubbles, which can result inpoor pattern transfer. For theory on hot embossing the reader is referred to [67].
5.6 PLLA containers
For the fabrication of the PLLA containers embossing as described above is used. TheTg of PLLA is around 60 ◦C, see table 2.2, and thus embossing is carried out above thistemperature. Figure 5.7 shows the result of an experiment where embossing at 80, 100and 120 ◦C is carried out. For the experiment, SU-8 stamps are used and similar resultsare observed for the nickel stamps. Other embossing parameters such as time, pressureand ramping are kept constant at 1 hour, 1.9 MPa, 10 ◦C/min. The graph shows themeasured container wall height after embossing and the corresponding stamp height. Thefigure shows that embossing with these parameters results in partial pattern transfer for80 and 100 ◦C while a good pattern transfer is obtained at 120 ◦C. The study is publishedin Microelectronic Engineering and can be found in appendix B. Figure 5.8 shows a PLLA
0 5 10 15 20 25
45
50
55
60
65
70
Wal
lhei
ght[
µm]
Distance from center [mm]
Stamp120°C100°C80°C
Figure 5.7: The figure shows the measured wall height after embossing in PLLA polymerfilm. The blue, green and red curves show the results of embossing at 80, 100 and 120 ◦Crespectively. The black line shows the corresponding stamp height.
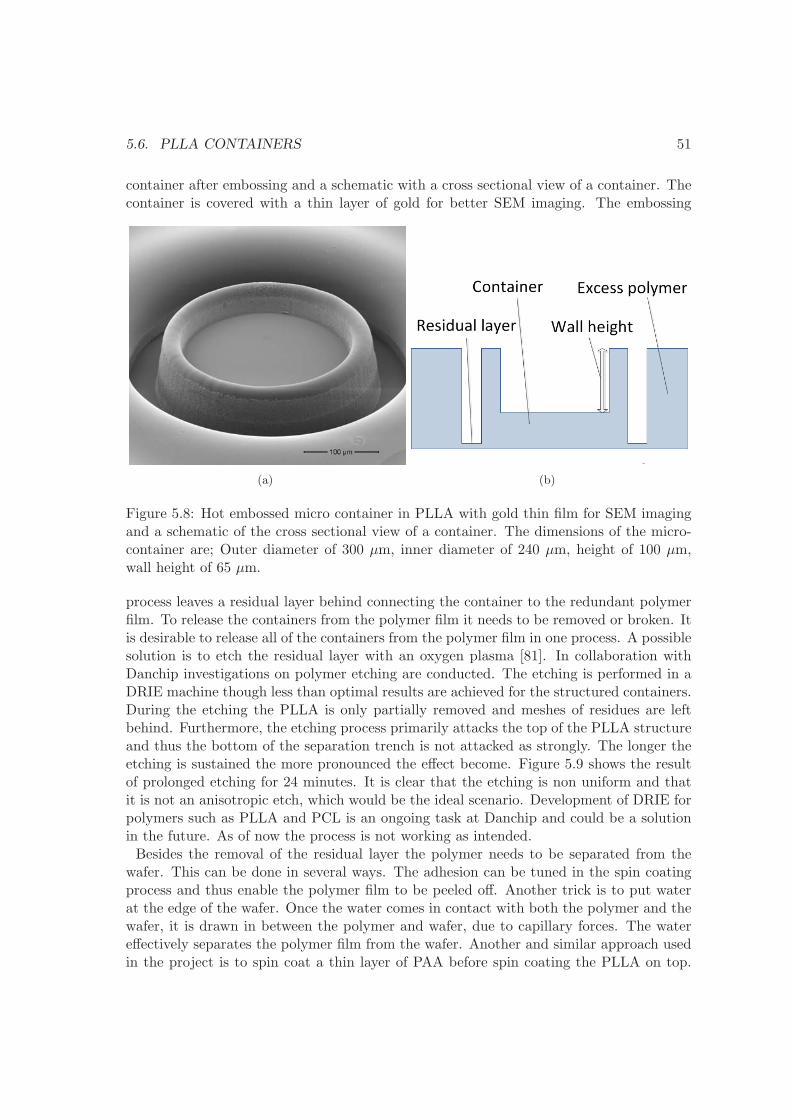
5.6. PLLA CONTAINERS 51
container after embossing and a schematic with a cross sectional view of a container. Thecontainer is covered with a thin layer of gold for better SEM imaging. The embossing
(a) (b)
Figure 5.8: Hot embossed micro container in PLLA with gold thin film for SEM imagingand a schematic of the cross sectional view of a container. The dimensions of the micro-container are; Outer diameter of 300 μm, inner diameter of 240 μm, height of 100 μm,wall height of 65 μm.
process leaves a residual layer behind connecting the container to the redundant polymerfilm. To release the containers from the polymer film it needs to be removed or broken. Itis desirable to release all of the containers from the polymer film in one process. A possiblesolution is to etch the residual layer with an oxygen plasma [81]. In collaboration withDanchip investigations on polymer etching are conducted. The etching is performed in aDRIE machine though less than optimal results are achieved for the structured containers.During the etching the PLLA is only partially removed and meshes of residues are leftbehind. Furthermore, the etching process primarily attacks the top of the PLLA structureand thus the bottom of the separation trench is not attacked as strongly. The longer theetching is sustained the more pronounced the effect become. Figure 5.9 shows the resultof prolonged etching for 24 minutes. It is clear that the etching is non uniform and thatit is not an anisotropic etch, which would be the ideal scenario. Development of DRIE forpolymers such as PLLA and PCL is an ongoing task at Danchip and could be a solutionin the future. As of now the process is not working as intended.Besides the removal of the residual layer the polymer needs to be separated from the
wafer. This can be done in several ways. The adhesion can be tuned in the spin coatingprocess and thus enable the polymer film to be peeled off. Another trick is to put waterat the edge of the wafer. Once the water comes in contact with both the polymer and thewafer, it is drawn in between the polymer and wafer, due to capillary forces. The watereffectively separates the polymer film from the wafer. Another and similar approach usedin the project is to spin coat a thin layer of PAA before spin coating the PLLA on top.
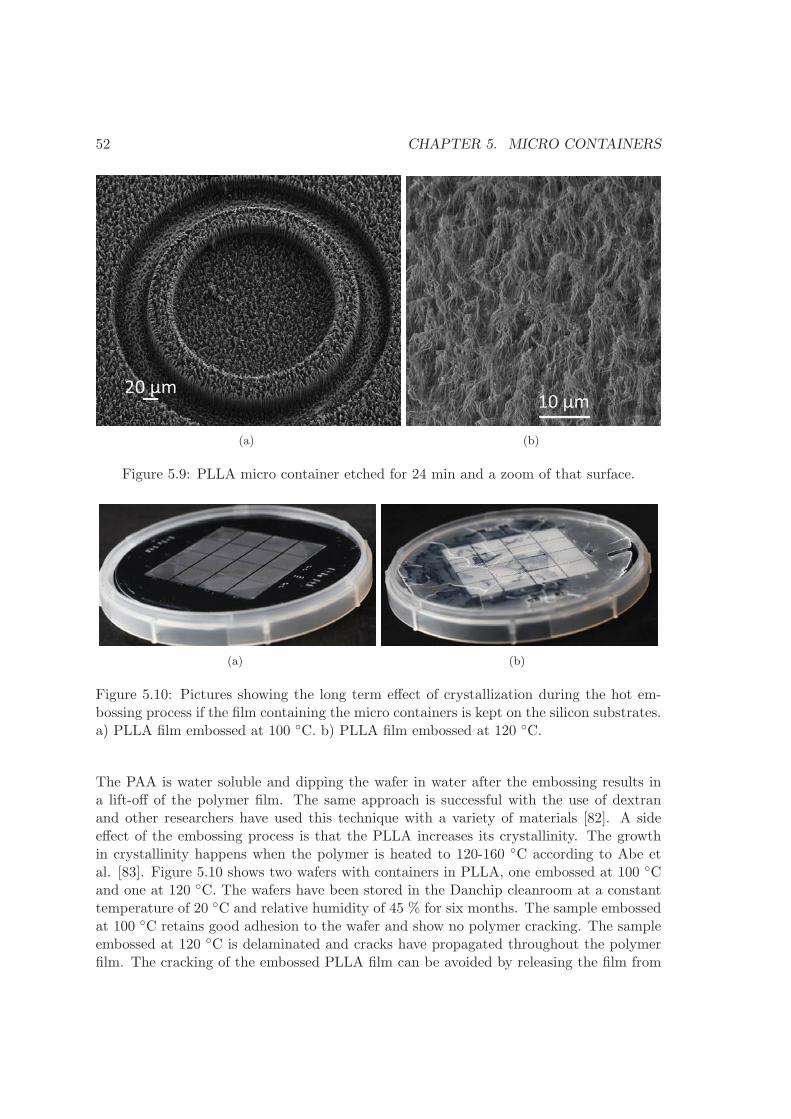
52 CHAPTER 5. MICRO CONTAINERS
(a) (b)
Figure 5.9: PLLA micro container etched for 24 min and a zoom of that surface.
(a) (b)
Figure 5.10: Pictures showing the long term effect of crystallization during the hot em-bossing process if the film containing the micro containers is kept on the silicon substrates.a) PLLA film embossed at 100 ◦C. b) PLLA film embossed at 120 ◦C.
The PAA is water soluble and dipping the wafer in water after the embossing results ina lift-off of the polymer film. The same approach is successful with the use of dextranand other researchers have used this technique with a variety of materials [82]. A sideeffect of the embossing process is that the PLLA increases its crystallinity. The growthin crystallinity happens when the polymer is heated to 120-160 ◦C according to Abe etal. [83]. Figure 5.10 shows two wafers with containers in PLLA, one embossed at 100 ◦Cand one at 120 ◦C. The wafers have been stored in the Danchip cleanroom at a constanttemperature of 20 ◦C and relative humidity of 45 % for six months. The sample embossedat 100 ◦C retains good adhesion to the wafer and show no polymer cracking. The sampleembossed at 120 ◦C is delaminated and cracks have propagated throughout the polymerfilm. The cracking of the embossed PLLA film can be avoided by releasing the film from
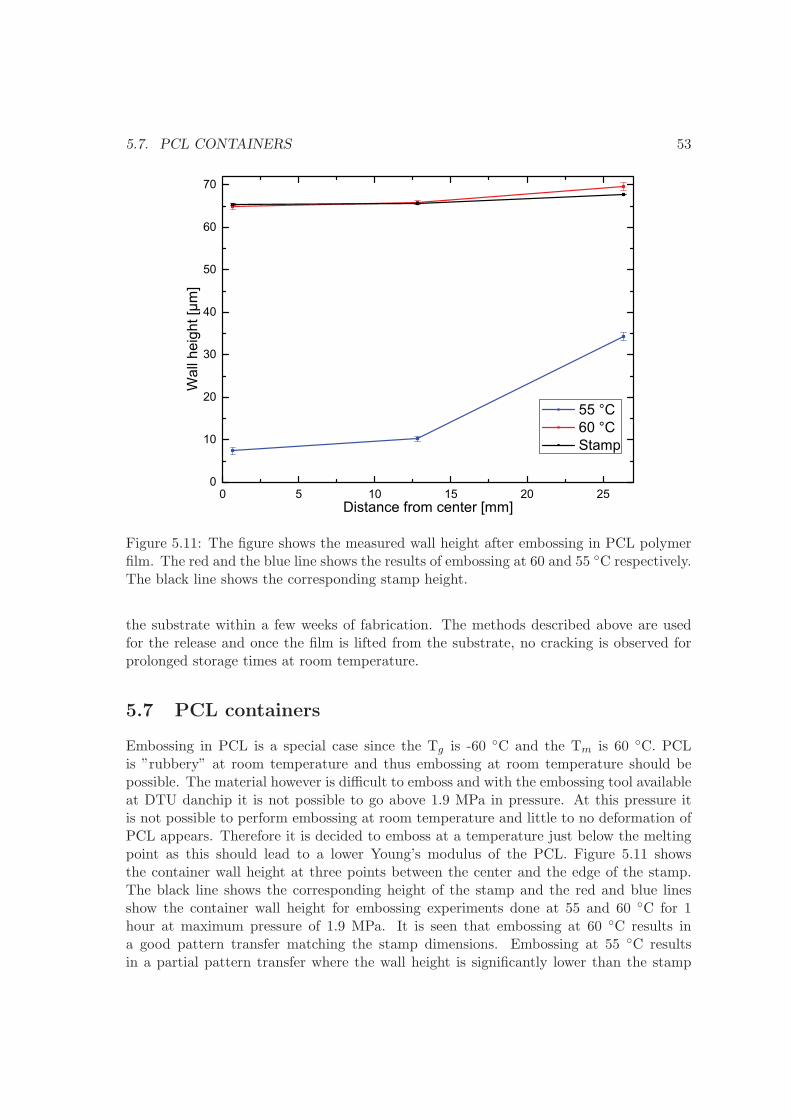
5.7. PCL CONTAINERS 53
0 5 10 15 20 250
10
20
30
40
50
60
70W
allh
eigh
t[µm
]
Distance from center [mm]
55 °C60 °CStamp
Figure 5.11: The figure shows the measured wall height after embossing in PCL polymerfilm. The red and the blue line shows the results of embossing at 60 and 55 ◦C respectively.The black line shows the corresponding stamp height.
the substrate within a few weeks of fabrication. The methods described above are usedfor the release and once the film is lifted from the substrate, no cracking is observed forprolonged storage times at room temperature.
5.7 PCL containers
Embossing in PCL is a special case since the Tg is -60 ◦C and the Tm is 60 ◦C. PCLis ”rubbery” at room temperature and thus embossing at room temperature should bepossible. The material however is difficult to emboss and with the embossing tool availableat DTU danchip it is not possible to go above 1.9 MPa in pressure. At this pressure itis not possible to perform embossing at room temperature and little to no deformation ofPCL appears. Therefore it is decided to emboss at a temperature just below the meltingpoint as this should lead to a lower Young’s modulus of the PCL. Figure 5.11 showsthe container wall height at three points between the center and the edge of the stamp.The black line shows the corresponding height of the stamp and the red and blue linesshow the container wall height for embossing experiments done at 55 and 60 ◦C for 1hour at maximum pressure of 1.9 MPa. It is seen that embossing at 60 ◦C results ina good pattern transfer matching the stamp dimensions. Embossing at 55 ◦C resultsin a partial pattern transfer where the wall height is significantly lower than the stamp
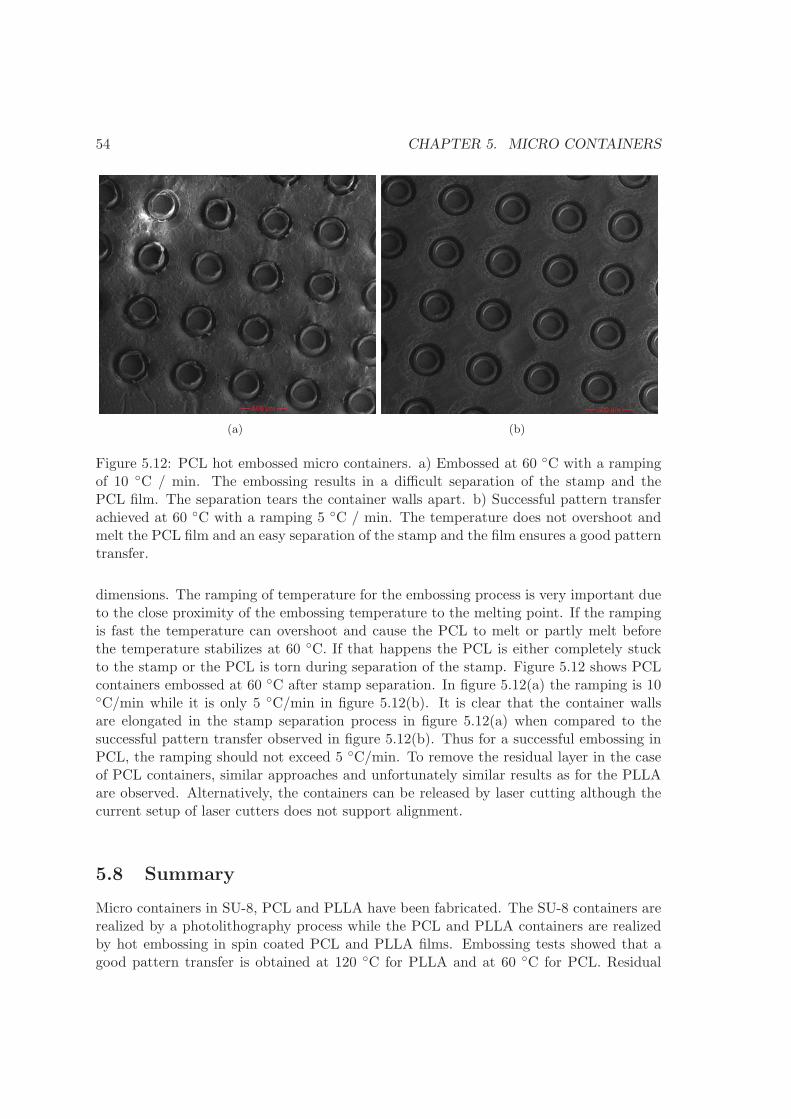
54 CHAPTER 5. MICRO CONTAINERS
(a) (b)
Figure 5.12: PCL hot embossed micro containers. a) Embossed at 60 ◦C with a rampingof 10 ◦C / min. The embossing results in a difficult separation of the stamp and thePCL film. The separation tears the container walls apart. b) Successful pattern transferachieved at 60 ◦C with a ramping 5 ◦C / min. The temperature does not overshoot andmelt the PCL film and an easy separation of the stamp and the film ensures a good patterntransfer.
dimensions. The ramping of temperature for the embossing process is very important dueto the close proximity of the embossing temperature to the melting point. If the rampingis fast the temperature can overshoot and cause the PCL to melt or partly melt beforethe temperature stabilizes at 60 ◦C. If that happens the PCL is either completely stuckto the stamp or the PCL is torn during separation of the stamp. Figure 5.12 shows PCLcontainers embossed at 60 ◦C after stamp separation. In figure 5.12(a) the ramping is 10◦C/min while it is only 5 ◦C/min in figure 5.12(b). It is clear that the container wallsare elongated in the stamp separation process in figure 5.12(a) when compared to thesuccessful pattern transfer observed in figure 5.12(b). Thus for a successful embossing inPCL, the ramping should not exceed 5 ◦C/min. To remove the residual layer in the caseof PCL containers, similar approaches and unfortunately similar results as for the PLLAare observed. Alternatively, the containers can be released by laser cutting although thecurrent setup of laser cutters does not support alignment.
5.8 Summary
Micro containers in SU-8, PCL and PLLA have been fabricated. The SU-8 containers arerealized by a photolithography process while the PCL and PLLA containers are realizedby hot embossing in spin coated PCL and PLLA films. Embossing tests showed that agood pattern transfer is obtained at 120 ◦C for PLLA and at 60 ◦C for PCL. Residual

5.8. SUMMARY 55
polymer layer left after the embossing process is difficult to remove in an efficient mannerand development is needed to successfully achieve this task.

56 CHAPTER 5. MICRO CONTAINERS
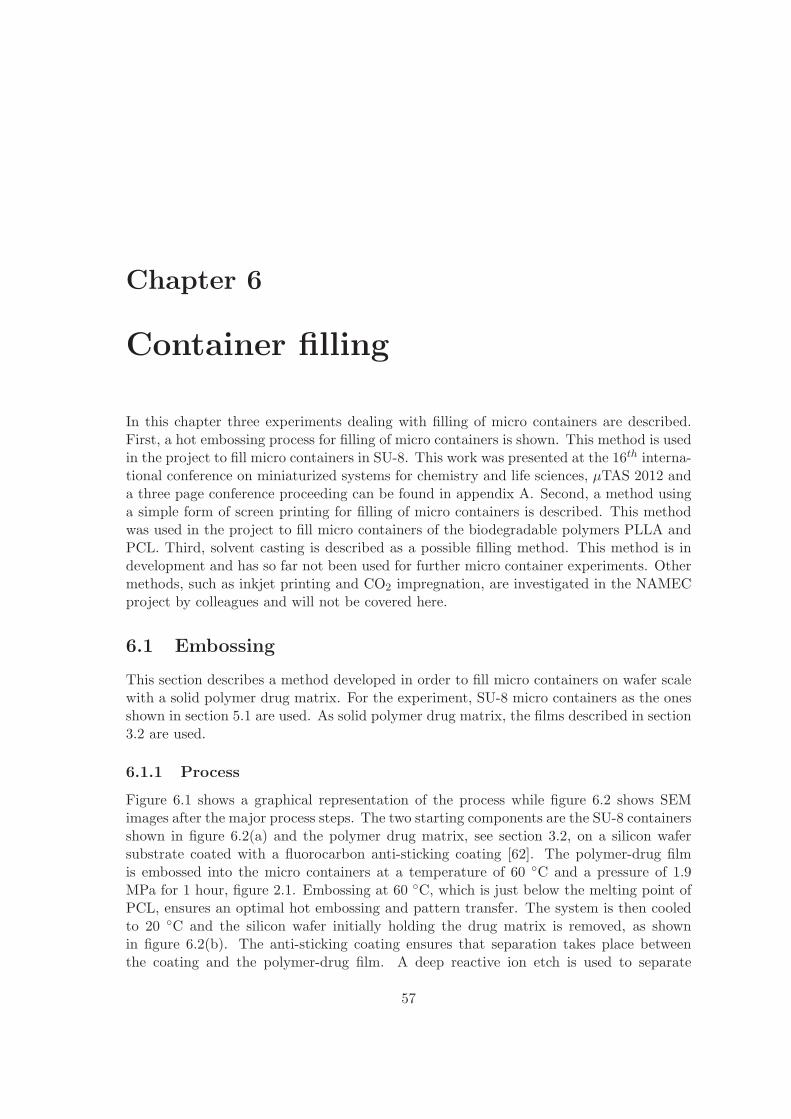
Chapter 6
Container filling
In this chapter three experiments dealing with filling of micro containers are described.First, a hot embossing process for filling of micro containers is shown. This method is usedin the project to fill micro containers in SU-8. This work was presented at the 16th interna-tional conference on miniaturized systems for chemistry and life sciences, μTAS 2012 anda three page conference proceeding can be found in appendix A. Second, a method usinga simple form of screen printing for filling of micro containers is described. This methodwas used in the project to fill micro containers of the biodegradable polymers PLLA andPCL. Third, solvent casting is described as a possible filling method. This method is indevelopment and has so far not been used for further micro container experiments. Othermethods, such as inkjet printing and CO2 impregnation, are investigated in the NAMECproject by colleagues and will not be covered here.
6.1 Embossing
This section describes a method developed in order to fill micro containers on wafer scalewith a solid polymer drug matrix. For the experiment, SU-8 micro containers as the onesshown in section 5.1 are used. As solid polymer drug matrix, the films described in section3.2 are used.
6.1.1 Process
Figure 6.1 shows a graphical representation of the process while figure 6.2 shows SEMimages after the major process steps. The two starting components are the SU-8 containersshown in figure 6.2(a) and the polymer drug matrix, see section 3.2, on a silicon wafersubstrate coated with a fluorocarbon anti-sticking coating [62]. The polymer-drug filmis embossed into the micro containers at a temperature of 60 ◦C and a pressure of 1.9MPa for 1 hour, figure 2.1. Embossing at 60 ◦C, which is just below the melting point ofPCL, ensures an optimal hot embossing and pattern transfer. The system is then cooledto 20 ◦C and the silicon wafer initially holding the drug matrix is removed, as shownin figure 6.2(b). The anti-sticking coating ensures that separation takes place betweenthe coating and the polymer-drug film. A deep reactive ion etch is used to separate
57
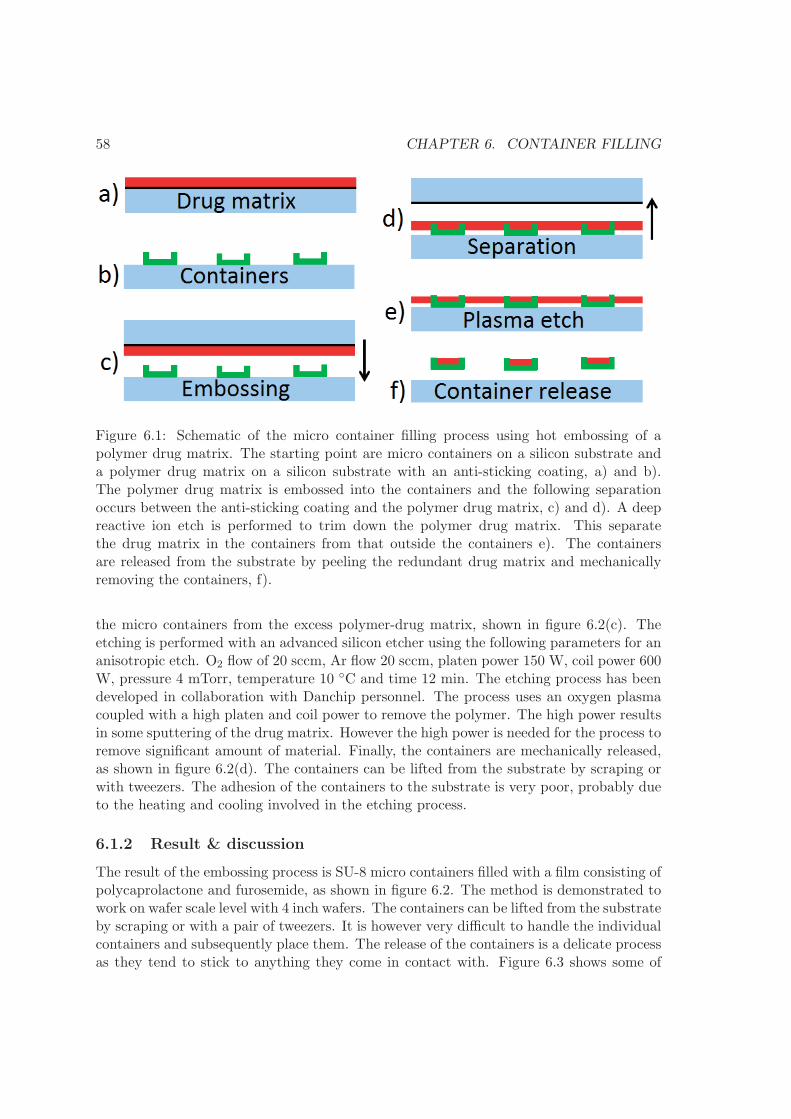
58 CHAPTER 6. CONTAINER FILLING
Figure 6.1: Schematic of the micro container filling process using hot embossing of apolymer drug matrix. The starting point are micro containers on a silicon substrate anda polymer drug matrix on a silicon substrate with an anti-sticking coating, a) and b).The polymer drug matrix is embossed into the containers and the following separationoccurs between the anti-sticking coating and the polymer drug matrix, c) and d). A deepreactive ion etch is performed to trim down the polymer drug matrix. This separatethe drug matrix in the containers from that outside the containers e). The containersare released from the substrate by peeling the redundant drug matrix and mechanicallyremoving the containers, f).
the micro containers from the excess polymer-drug matrix, shown in figure 6.2(c). Theetching is performed with an advanced silicon etcher using the following parameters for ananisotropic etch. O2 flow of 20 sccm, Ar flow 20 sccm, platen power 150 W, coil power 600W, pressure 4 mTorr, temperature 10 ◦C and time 12 min. The etching process has beendeveloped in collaboration with Danchip personnel. The process uses an oxygen plasmacoupled with a high platen and coil power to remove the polymer. The high power resultsin some sputtering of the drug matrix. However the high power is needed for the process toremove significant amount of material. Finally, the containers are mechanically released,as shown in figure 6.2(d). The containers can be lifted from the substrate by scraping orwith tweezers. The adhesion of the containers to the substrate is very poor, probably dueto the heating and cooling involved in the etching process.
6.1.2 Result & discussion
The result of the embossing process is SU-8 micro containers filled with a film consisting ofpolycaprolactone and furosemide, as shown in figure 6.2. The method is demonstrated towork on wafer scale level with 4 inch wafers. The containers can be lifted from the substrateby scraping or with a pair of tweezers. It is however very difficult to handle the individualcontainers and subsequently place them. The release of the containers is a delicate processas they tend to stick to anything they come in contact with. Figure 6.3 shows some of
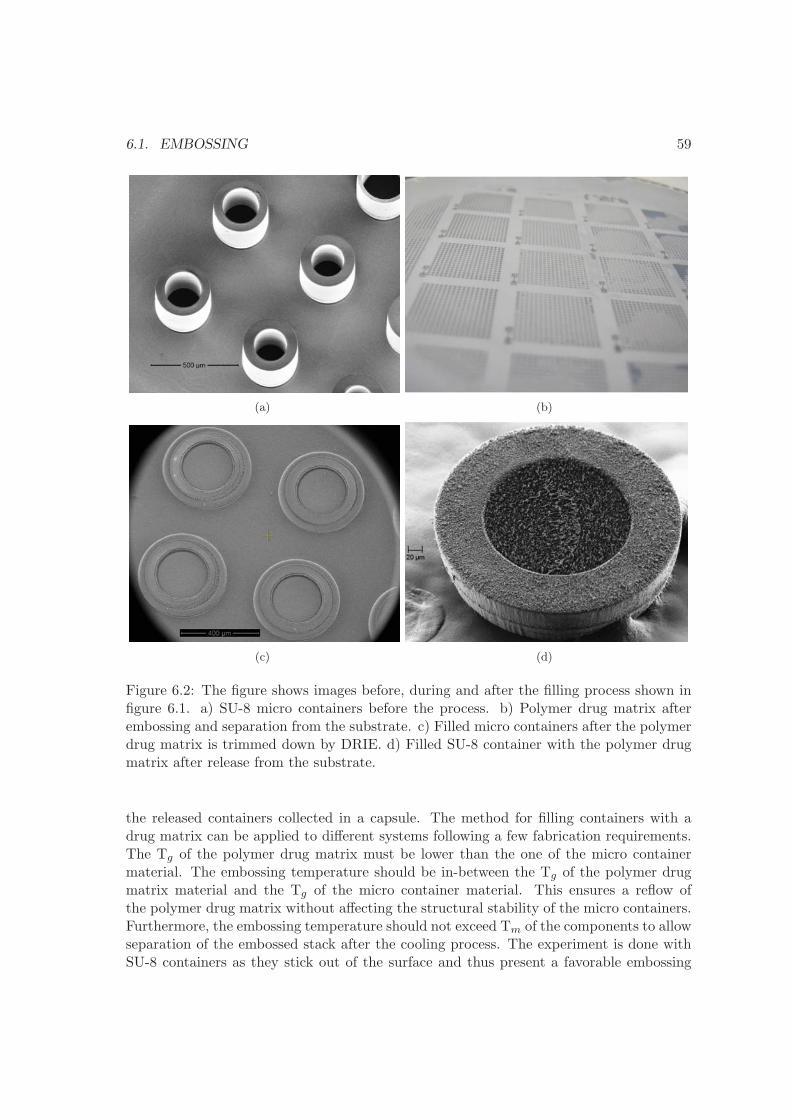
6.1. EMBOSSING 59
(a) (b)
(c) (d)
Figure 6.2: The figure shows images before, during and after the filling process shown infigure 6.1. a) SU-8 micro containers before the process. b) Polymer drug matrix afterembossing and separation from the substrate. c) Filled micro containers after the polymerdrug matrix is trimmed down by DRIE. d) Filled SU-8 container with the polymer drugmatrix after release from the substrate.
the released containers collected in a capsule. The method for filling containers with adrug matrix can be applied to different systems following a few fabrication requirements.The Tg of the polymer drug matrix must be lower than the one of the micro containermaterial. The embossing temperature should be in-between the Tg of the polymer drugmatrix material and the Tg of the micro container material. This ensures a reflow ofthe polymer drug matrix without affecting the structural stability of the micro containers.Furthermore, the embossing temperature should not exceed Tm of the components to allowseparation of the embossed stack after the cooling process. The experiment is done withSU-8 containers as they stick out of the surface and thus present a favorable embossing
60 CHAPTER 6. CONTAINER FILLING
Figure 6.3: The image shows released micro containers collected in a capsule.
case where minimal material needs to be deformed. If the process is to be performed onthe biodegradable polymer containers the situation is very different. These containers arein plane with the redundant polymer. Embossing a film into the biodegradable containersmeans that the majority of the polymer drug matrix needs to be transferred into thesmall voids of the containers. For this to work, the biodegradable containers need to beseparated from the redundant film. The separation of biodegradable containers is a processunder development, but for future applications this method could be a possibility sincethe temperature needed to emboss PLLA is higher than the 60 ◦C used for the embossingof the PCL furosemide film.
6.2 Screen printing
This section describes a filling method for containers inspired by traditional screen printingtechnique. Screen printing is a technique utilizing a woven mesh in combination with astencil mask to form open areas in the woven mesh [84]. A squeegee is used to press apaste or an ink through the mesh resulting in the stencil pattern being transferred to asubstrate.
6.2.1 Experiment
In this work a simple version of the screen printing technique is applied. A flexible stencilis fabricated in transparent foil by laser machining and used without the woven mesh. Thelaser machining is done with a CO2-laser and the exact process parameters can be foundin appendix J. The design of the stencil is made such that it contains holes matchingthe inner diameter of the micro containers with a few microns in variation. A graphical
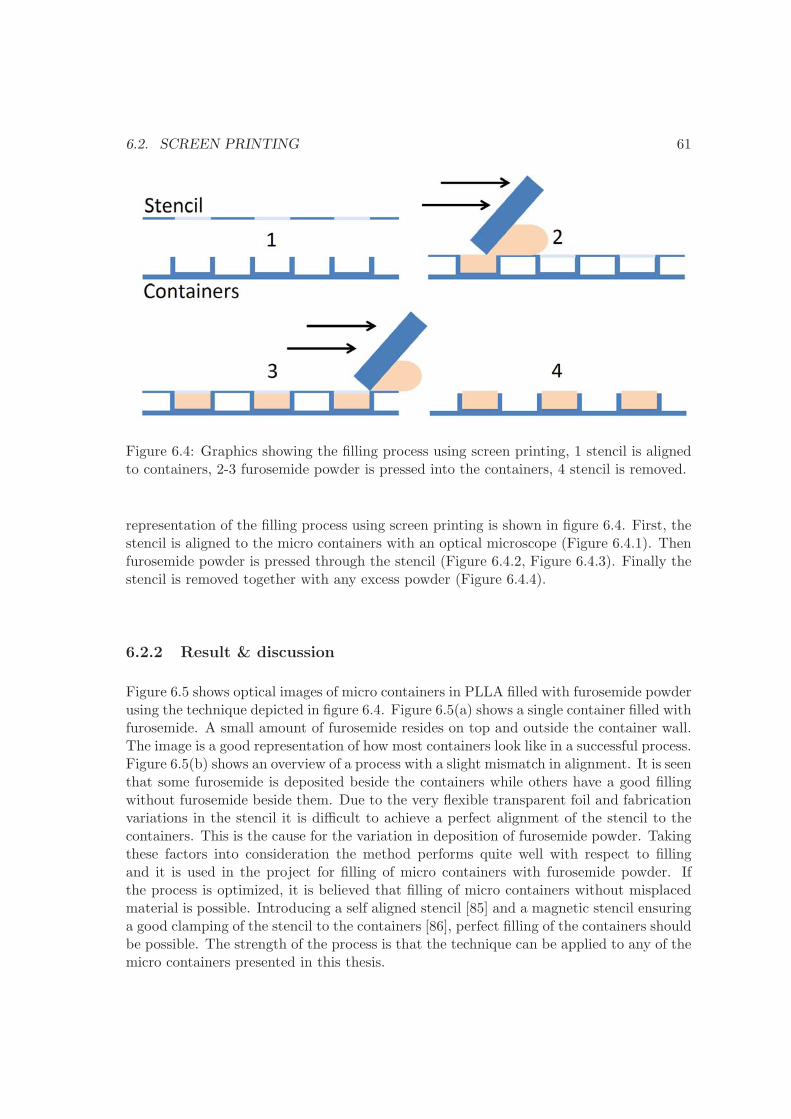
6.2. SCREEN PRINTING 61
Figure 6.4: Graphics showing the filling process using screen printing, 1 stencil is alignedto containers, 2-3 furosemide powder is pressed into the containers, 4 stencil is removed.
representation of the filling process using screen printing is shown in figure 6.4. First, thestencil is aligned to the micro containers with an optical microscope (Figure 6.4.1). Thenfurosemide powder is pressed through the stencil (Figure 6.4.2, Figure 6.4.3). Finally thestencil is removed together with any excess powder (Figure 6.4.4).
6.2.2 Result & discussion
Figure 6.5 shows optical images of micro containers in PLLA filled with furosemide powderusing the technique depicted in figure 6.4. Figure 6.5(a) shows a single container filled withfurosemide. A small amount of furosemide resides on top and outside the container wall.The image is a good representation of how most containers look like in a successful process.Figure 6.5(b) shows an overview of a process with a slight mismatch in alignment. It is seenthat some furosemide is deposited beside the containers while others have a good fillingwithout furosemide beside them. Due to the very flexible transparent foil and fabricationvariations in the stencil it is difficult to achieve a perfect alignment of the stencil to thecontainers. This is the cause for the variation in deposition of furosemide powder. Takingthese factors into consideration the method performs quite well with respect to fillingand it is used in the project for filling of micro containers with furosemide powder. Ifthe process is optimized, it is believed that filling of micro containers without misplacedmaterial is possible. Introducing a self aligned stencil [85] and a magnetic stencil ensuringa good clamping of the stencil to the containers [86], perfect filling of the containers shouldbe possible. The strength of the process is that the technique can be applied to any of themicro containers presented in this thesis.
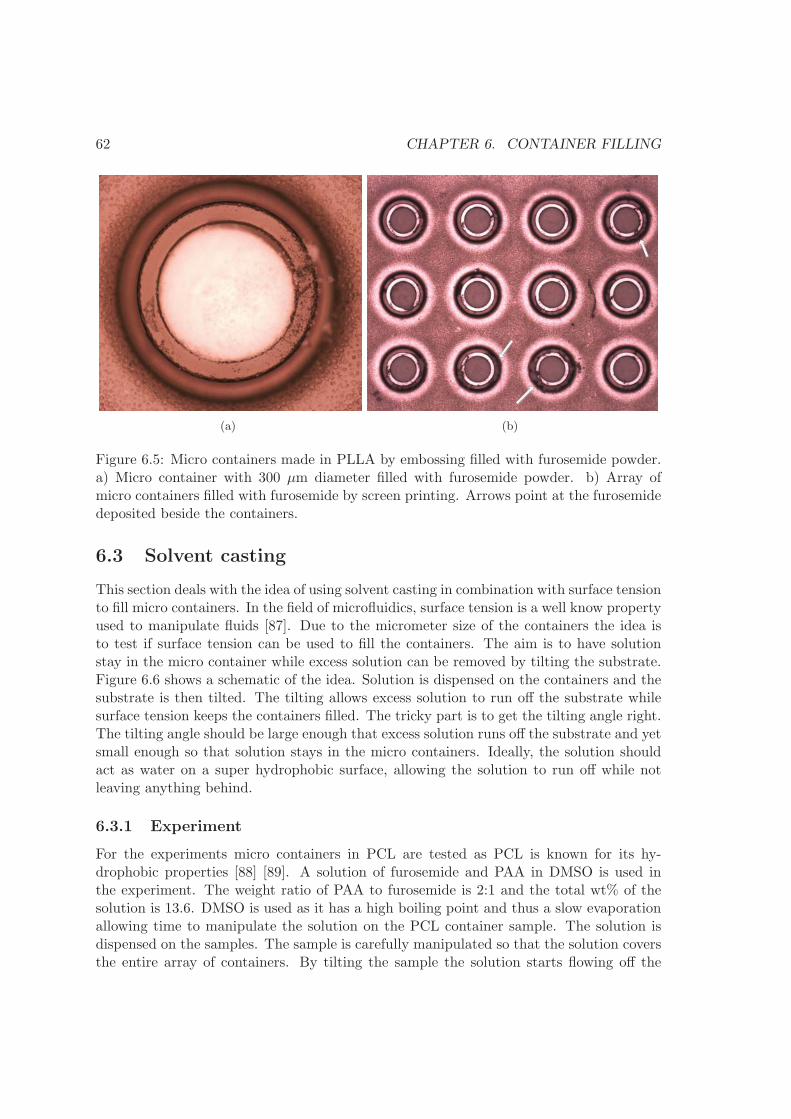
62 CHAPTER 6. CONTAINER FILLING
(a) (b)
Figure 6.5: Micro containers made in PLLA by embossing filled with furosemide powder.a) Micro container with 300 μm diameter filled with furosemide powder. b) Array ofmicro containers filled with furosemide by screen printing. Arrows point at the furosemidedeposited beside the containers.
6.3 Solvent casting
This section deals with the idea of using solvent casting in combination with surface tensionto fill micro containers. In the field of microfluidics, surface tension is a well know propertyused to manipulate fluids [87]. Due to the micrometer size of the containers the idea isto test if surface tension can be used to fill the containers. The aim is to have solutionstay in the micro container while excess solution can be removed by tilting the substrate.Figure 6.6 shows a schematic of the idea. Solution is dispensed on the containers and thesubstrate is then tilted. The tilting allows excess solution to run off the substrate whilesurface tension keeps the containers filled. The tricky part is to get the tilting angle right.The tilting angle should be large enough that excess solution runs off the substrate and yetsmall enough so that solution stays in the micro containers. Ideally, the solution shouldact as water on a super hydrophobic surface, allowing the solution to run off while notleaving anything behind.
6.3.1 Experiment
For the experiments micro containers in PCL are tested as PCL is known for its hy-drophobic properties [88] [89]. A solution of furosemide and PAA in DMSO is used inthe experiment. The weight ratio of PAA to furosemide is 2:1 and the total wt% of thesolution is 13.6. DMSO is used as it has a high boiling point and thus a slow evaporationallowing time to manipulate the solution on the PCL container sample. The solution isdispensed on the samples. The sample is carefully manipulated so that the solution coversthe entire array of containers. By tilting the sample the solution starts flowing off the
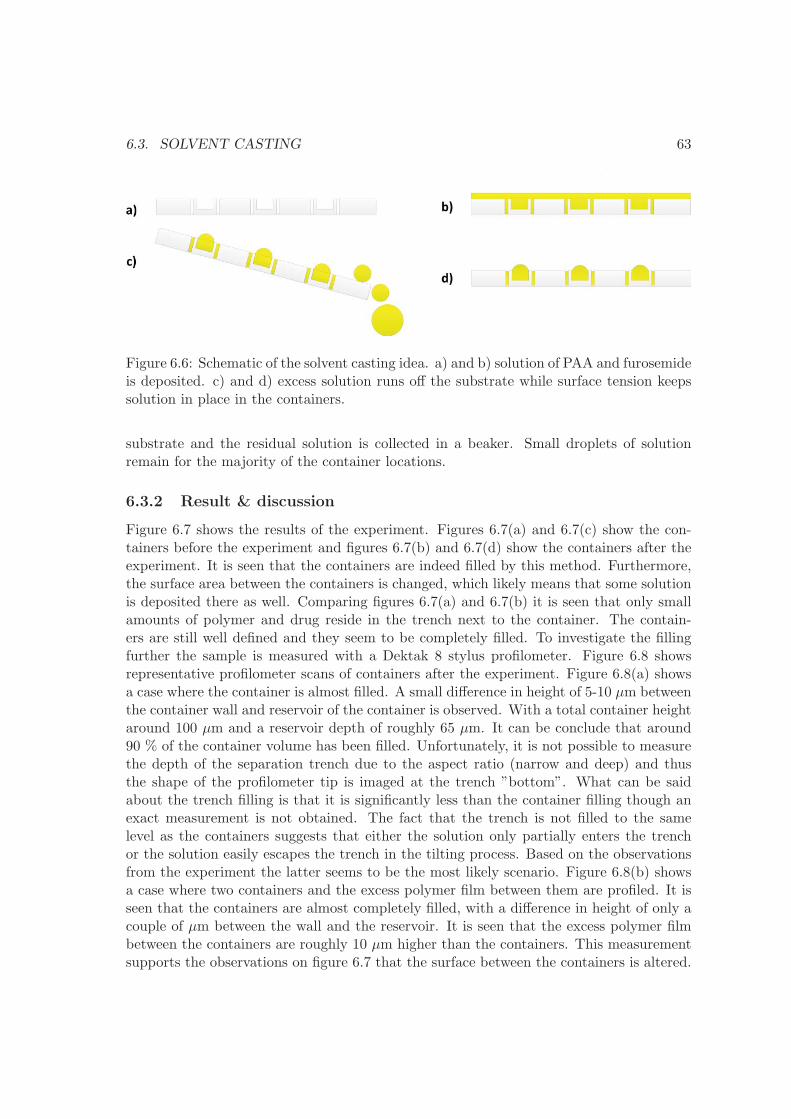
6.3. SOLVENT CASTING 63
Figure 6.6: Schematic of the solvent casting idea. a) and b) solution of PAA and furosemideis deposited. c) and d) excess solution runs off the substrate while surface tension keepssolution in place in the containers.
substrate and the residual solution is collected in a beaker. Small droplets of solutionremain for the majority of the container locations.
6.3.2 Result & discussion
Figure 6.7 shows the results of the experiment. Figures 6.7(a) and 6.7(c) show the con-tainers before the experiment and figures 6.7(b) and 6.7(d) show the containers after theexperiment. It is seen that the containers are indeed filled by this method. Furthermore,the surface area between the containers is changed, which likely means that some solutionis deposited there as well. Comparing figures 6.7(a) and 6.7(b) it is seen that only smallamounts of polymer and drug reside in the trench next to the container. The contain-ers are still well defined and they seem to be completely filled. To investigate the fillingfurther the sample is measured with a Dektak 8 stylus profilometer. Figure 6.8 showsrepresentative profilometer scans of containers after the experiment. Figure 6.8(a) showsa case where the container is almost filled. A small difference in height of 5-10 μm betweenthe container wall and reservoir of the container is observed. With a total container heightaround 100 μm and a reservoir depth of roughly 65 μm. It can be conclude that around90 % of the container volume has been filled. Unfortunately, it is not possible to measurethe depth of the separation trench due to the aspect ratio (narrow and deep) and thusthe shape of the profilometer tip is imaged at the trench ”bottom”. What can be saidabout the trench filling is that it is significantly less than the container filling though anexact measurement is not obtained. The fact that the trench is not filled to the samelevel as the containers suggests that either the solution only partially enters the trenchor the solution easily escapes the trench in the tilting process. Based on the observationsfrom the experiment the latter seems to be the most likely scenario. Figure 6.8(b) showsa case where two containers and the excess polymer film between them are profiled. It isseen that the containers are almost completely filled, with a difference in height of only acouple of μm between the wall and the reservoir. It is seen that the excess polymer filmbetween the containers are roughly 10 μm higher than the containers. This measurementsupports the observations on figure 6.7 that the surface between the containers is altered.
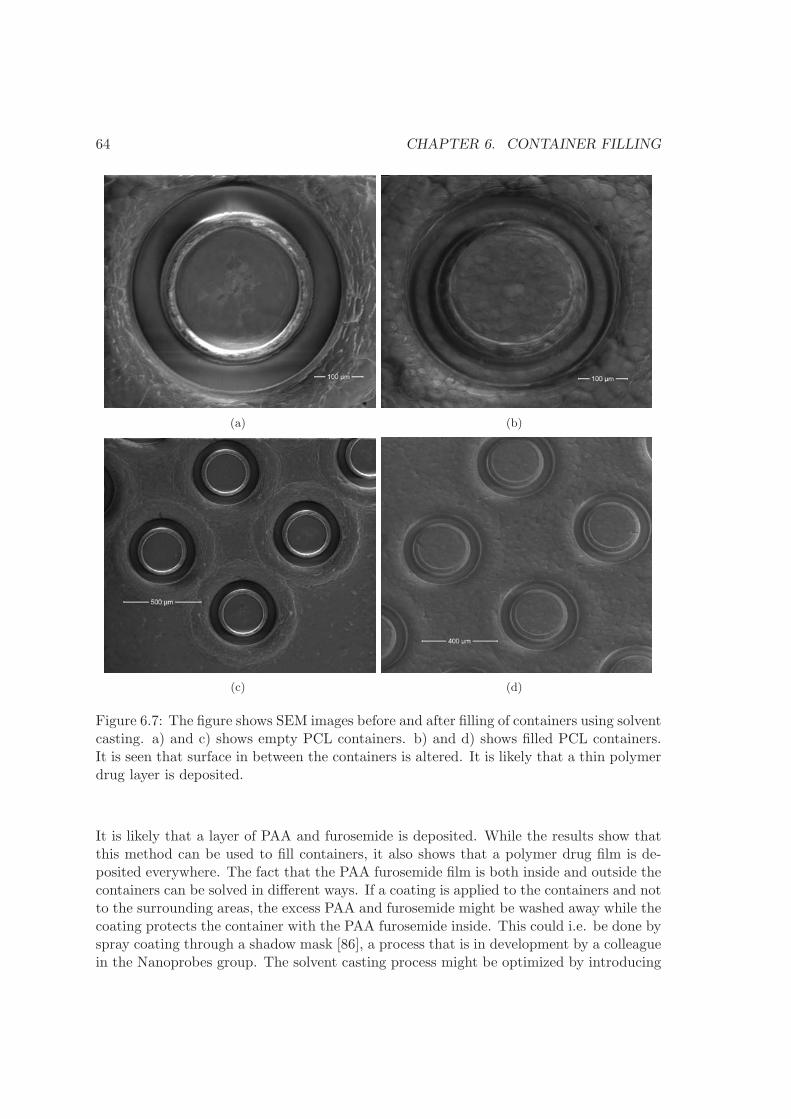
64 CHAPTER 6. CONTAINER FILLING
(a) (b)
(c) (d)
Figure 6.7: The figure shows SEM images before and after filling of containers using solventcasting. a) and c) shows empty PCL containers. b) and d) shows filled PCL containers.It is seen that surface in between the containers is altered. It is likely that a thin polymerdrug layer is deposited.
It is likely that a layer of PAA and furosemide is deposited. While the results show thatthis method can be used to fill containers, it also shows that a polymer drug film is de-posited everywhere. The fact that the PAA furosemide film is both inside and outside thecontainers can be solved in different ways. If a coating is applied to the containers and notto the surrounding areas, the excess PAA and furosemide might be washed away while thecoating protects the container with the PAA furosemide inside. This could i.e. be done byspray coating through a shadow mask [86], a process that is in development by a colleaguein the Nanoprobes group. The solvent casting process might be optimized by introducing
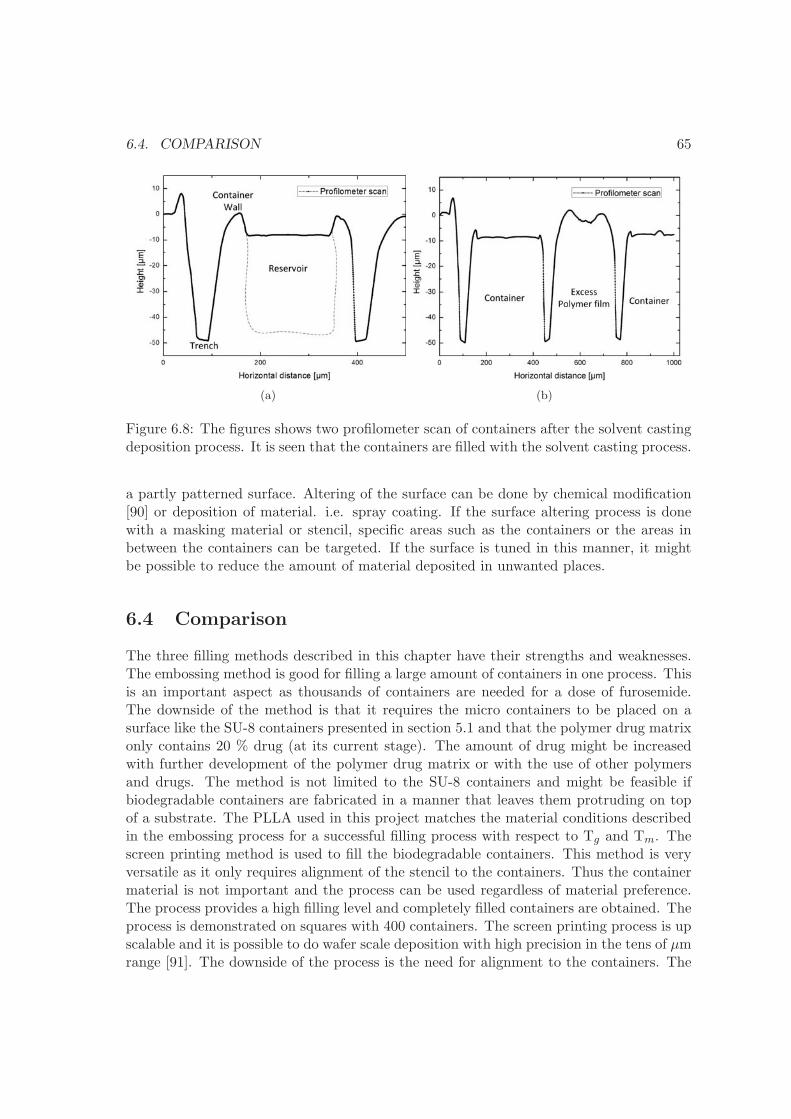
6.4. COMPARISON 65
(a) (b)
Figure 6.8: The figures shows two profilometer scan of containers after the solvent castingdeposition process. It is seen that the containers are filled with the solvent casting process.
a partly patterned surface. Altering of the surface can be done by chemical modification[90] or deposition of material. i.e. spray coating. If the surface altering process is donewith a masking material or stencil, specific areas such as the containers or the areas inbetween the containers can be targeted. If the surface is tuned in this manner, it mightbe possible to reduce the amount of material deposited in unwanted places.
6.4 Comparison
The three filling methods described in this chapter have their strengths and weaknesses.The embossing method is good for filling a large amount of containers in one process. Thisis an important aspect as thousands of containers are needed for a dose of furosemide.The downside of the method is that it requires the micro containers to be placed on asurface like the SU-8 containers presented in section 5.1 and that the polymer drug matrixonly contains 20 % drug (at its current stage). The amount of drug might be increasedwith further development of the polymer drug matrix or with the use of other polymersand drugs. The method is not limited to the SU-8 containers and might be feasible ifbiodegradable containers are fabricated in a manner that leaves them protruding on topof a substrate. The PLLA used in this project matches the material conditions describedin the embossing process for a successful filling process with respect to Tg and Tm. Thescreen printing method is used to fill the biodegradable containers. This method is veryversatile as it only requires alignment of the stencil to the containers. Thus the containermaterial is not important and the process can be used regardless of material preference.The process provides a high filling level and completely filled containers are obtained. Theprocess is demonstrated on squares with 400 containers. The screen printing process is upscalable and it is possible to do wafer scale deposition with high precision in the tens of μmrange [91]. The downside of the process is the need for alignment to the containers. The

66 CHAPTER 6. CONTAINER FILLING
Table 6.1: Comparison of the three filling methods described in the chapter. The tableshows the type of container the three filling methods have been used for. The level offilling obtained and the process level.Method Container
typeFilling Process level
Embossing SU-8 80% PCL20% Furosemide
Wafer scale
Screen printing PLLA / PCL up to 100%Furosemide
400 container squareupscalable process
Solvent casting PCL 66% PAA33% Furosemide
Wafer scale
solvent casting method presents a simple filling method for a large amount of containers.The filling level of the containers depends on the solution used. In the experiments ablend of 33 % furosemide and 66 % PAA is used. The process works well on a wafer scale,though polymer and drug is deposited outside the containers. The container filling is notlimited to a certain material, however the choice of material is likely to affect the behaviorof the solution. The three methods are summarized in their current development stagein table 6.1 The table lists the container type for which the processes are developed, thelevel of container filling and the scale of the process. Of the three processes the screenprinting method is the most versatile process as it can be applied to any container shapeand the potential filling level is 100 %. With further development, as suggested in section6.2.2, the screen printing method provides a robust method for filling of micro containers.The embossing process is a viable alternative to the screen printing process, though withcertain limitations to the filling level and requirements to container structure. The solventcasting method needs further development for it to be effective.
6.5 Summary
In this chapter it is shown that it is possible to integrate filling of micro containers aspart of the fabrication on a wafer scale level through hot embossing of a polymer drugmatrix in SU-8 containers. Filling of micro containers using a screen printing method isshown to work with furosemide powders, thus utilizing the container volume to its fullestin respect to the amount of active pharmaceutical ingredient. The method is demonstratedon PLLA containers, though the method is applicable to SU-8 containers as well. Last,a method based on surface tension for filling of the containers is investigated. Filling ofcontainers is successful however redundant polymer medicine solution is deposited outsidethe containers.

Chapter 7
Drug delivery
This chapter covers the method used to test drug release, the results of drug release fromthe drug matrix described in chapter 3 and drug release from micro containers describedin chapter 5 are shown. First, a description of the Pion μDISS profiler
TMused to test drug
release is given along with standard procedures used for the drug release experiments.Once the test method is established, the release data for the drug matrix and the microcontainers are presented. Finally, an experiment using UV imaging to validate drug releasefrom the micro containers in real time is shown.
7.1 Dissolution
This section covers the test setup used for dissolution testing of the different drug deliverysystems developed. To test release of drug a Pion μDISS profiler
TMis used. Figure 7.1
shows the Pion μDISS profiler used for the dissolution measurements. The machine iscapable of conducting six release tests simultaneously. The profiler is controlled with acomputer which is also used for data collection. Figure 7.2 shows a close up view of thetest setup. It shows the beakers used and the tip of the UV probes. The device uses UVspectroscopy to measure concentration of a solution over time. The UV probes measureabsorption of the UV light as it passes through solution. The travel distance of the UVlight is twice the distance from the UV probe to the mirror. The longer the travel lengthis, the more UV light is absorbed. To avoid full absorption at specific wavelengths, thedistance from the UV probe to the mirror is adjustable. The beaker contains a combinedmagnetic stirrer and sample holder. The magnetic stirrer ensures a good mixing of thesolution. The entire setup is placed inside a water bath to control the temperature ofthe solutions. In order to measure the concentration of a compound, standard curves aremade with known concentrations of the compound and the UV absorption is measured. Inthis way a correlation between the UV spectrum and the concentration of the solution isobtained. For the case of the drug matrix and the micro patches the following conditionsare used. The drug release is performed using biorelevant dissolution media, Fasted StateSimulated Intestinal Fluid (FaSSIF), to simulate the gastrointestinal fluids. The FaSSIFis pH adjusted to pH 6.5 before the release experiments are conducted in beakers contain-
67
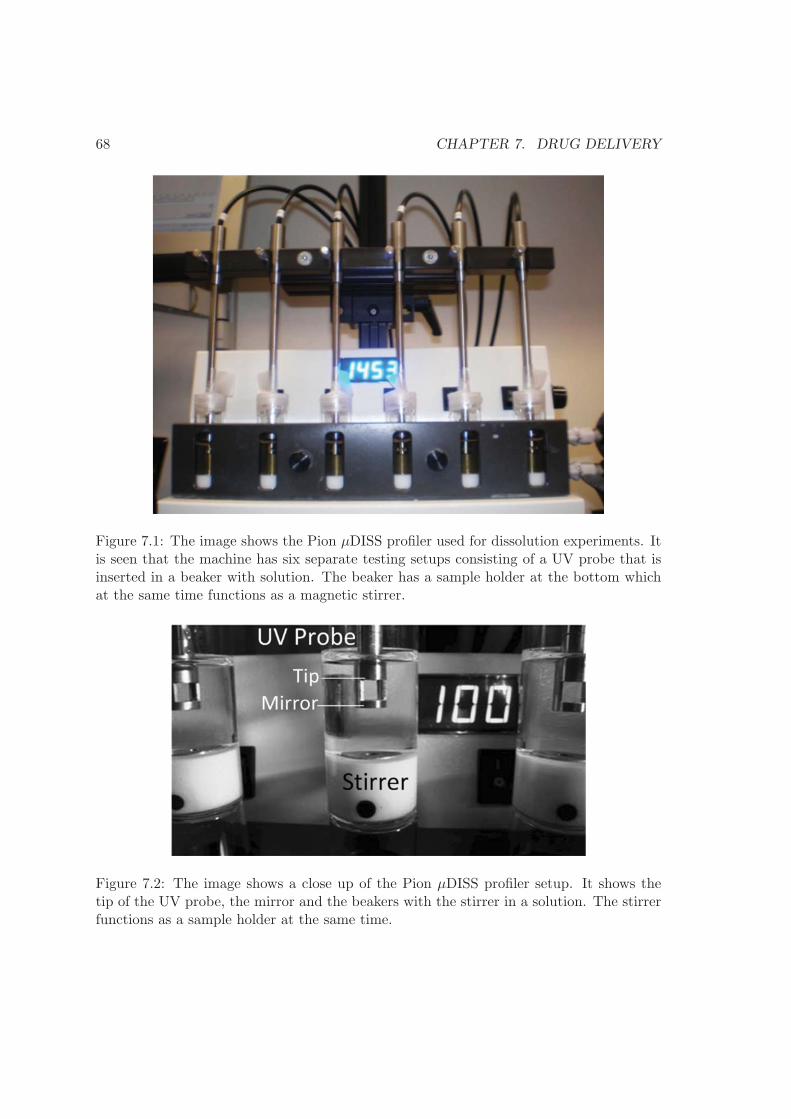
68 CHAPTER 7. DRUG DELIVERY
Figure 7.1: The image shows the Pion μDISS profiler used for dissolution experiments. Itis seen that the machine has six separate testing setups consisting of a UV probe that isinserted in a beaker with solution. The beaker has a sample holder at the bottom whichat the same time functions as a magnetic stirrer.
Figure 7.2: The image shows a close up of the Pion μDISS profiler setup. It shows thetip of the UV probe, the mirror and the beakers with the stirrer in a solution. The stirrerfunctions as a sample holder at the same time.
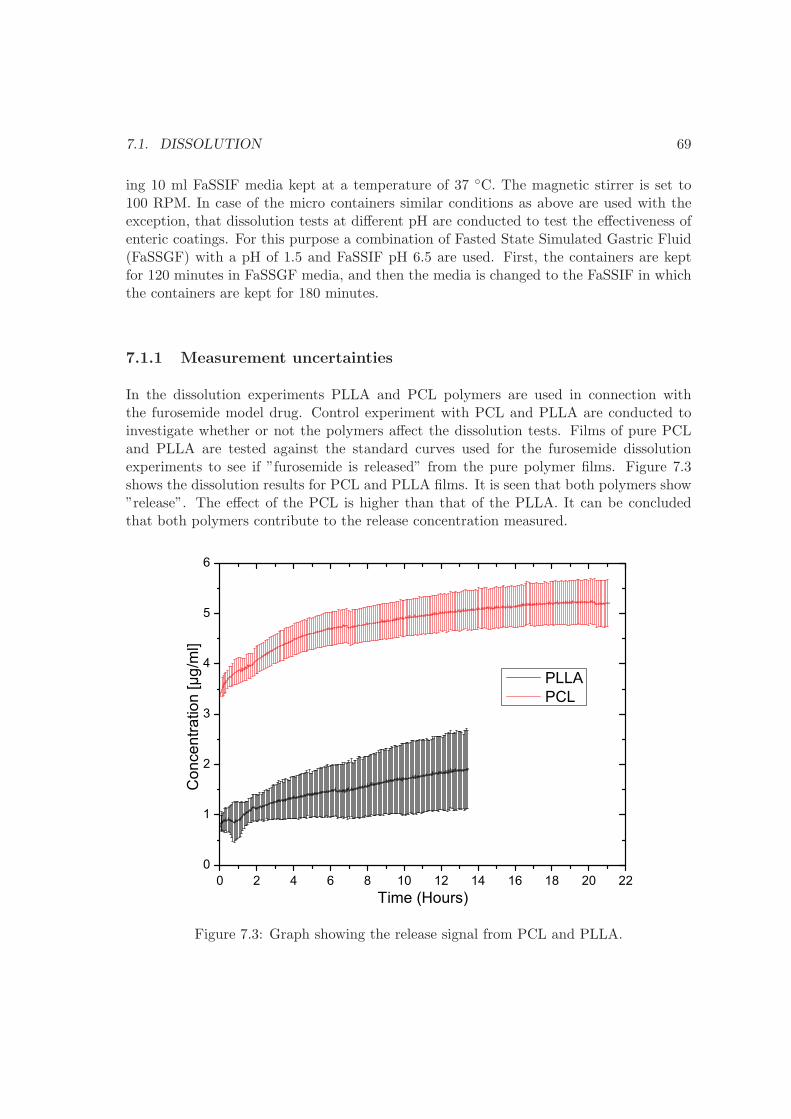
7.1. DISSOLUTION 69
ing 10 ml FaSSIF media kept at a temperature of 37 ◦C. The magnetic stirrer is set to100 RPM. In case of the micro containers similar conditions as above are used with theexception, that dissolution tests at different pH are conducted to test the effectiveness ofenteric coatings. For this purpose a combination of Fasted State Simulated Gastric Fluid(FaSSGF) with a pH of 1.5 and FaSSIF pH 6.5 are used. First, the containers are keptfor 120 minutes in FaSSGF media, and then the media is changed to the FaSSIF in whichthe containers are kept for 180 minutes.
7.1.1 Measurement uncertainties
In the dissolution experiments PLLA and PCL polymers are used in connection withthe furosemide model drug. Control experiment with PCL and PLLA are conducted toinvestigate whether or not the polymers affect the dissolution tests. Films of pure PCLand PLLA are tested against the standard curves used for the furosemide dissolutionexperiments to see if ”furosemide is released” from the pure polymer films. Figure 7.3shows the dissolution results for PCL and PLLA films. It is seen that both polymers show”release”. The effect of the PCL is higher than that of the PLLA. It can be concludedthat both polymers contribute to the release concentration measured.
0 2 4 6 8 10 12 14 16 18 20 220
1
2
3
4
5
6
Con
cent
ratio
n[µ
g/m
l]
Time (Hours)
PLLAPCL
Figure 7.3: Graph showing the release signal from PCL and PLLA.
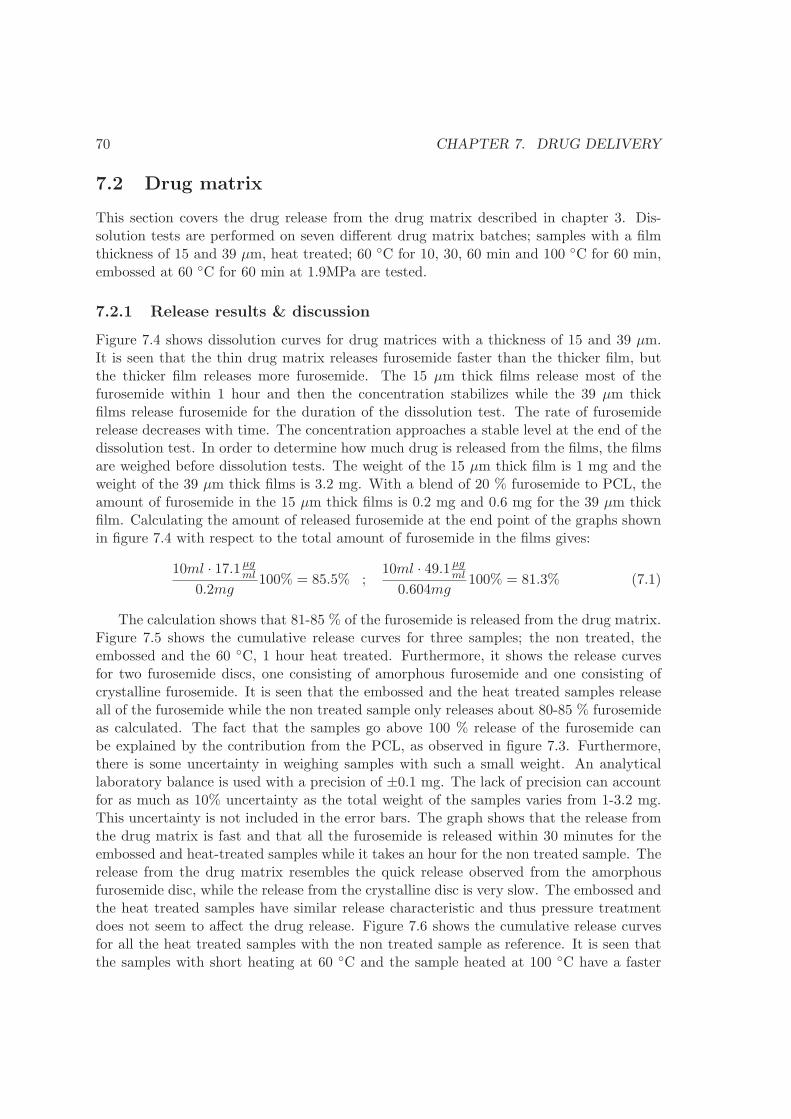
70 CHAPTER 7. DRUG DELIVERY
7.2 Drug matrix
This section covers the drug release from the drug matrix described in chapter 3. Dis-solution tests are performed on seven different drug matrix batches; samples with a filmthickness of 15 and 39 μm, heat treated; 60 ◦C for 10, 30, 60 min and 100 ◦C for 60 min,embossed at 60 ◦C for 60 min at 1.9MPa are tested.
7.2.1 Release results & discussion
Figure 7.4 shows dissolution curves for drug matrices with a thickness of 15 and 39 μm.It is seen that the thin drug matrix releases furosemide faster than the thicker film, butthe thicker film releases more furosemide. The 15 μm thick films release most of thefurosemide within 1 hour and then the concentration stabilizes while the 39 μm thickfilms release furosemide for the duration of the dissolution test. The rate of furosemiderelease decreases with time. The concentration approaches a stable level at the end of thedissolution test. In order to determine how much drug is released from the films, the filmsare weighed before dissolution tests. The weight of the 15 μm thick film is 1 mg and theweight of the 39 μm thick films is 3.2 mg. With a blend of 20 % furosemide to PCL, theamount of furosemide in the 15 μm thick films is 0.2 mg and 0.6 mg for the 39 μm thickfilm. Calculating the amount of released furosemide at the end point of the graphs shownin figure 7.4 with respect to the total amount of furosemide in the films gives:
10ml · 17.1 μgml
0.2mg100% = 85.5% ;
10ml · 49.1 μgml
0.604mg100% = 81.3% (7.1)
The calculation shows that 81-85 % of the furosemide is released from the drug matrix.Figure 7.5 shows the cumulative release curves for three samples; the non treated, theembossed and the 60 ◦C, 1 hour heat treated. Furthermore, it shows the release curvesfor two furosemide discs, one consisting of amorphous furosemide and one consisting ofcrystalline furosemide. It is seen that the embossed and the heat treated samples releaseall of the furosemide while the non treated sample only releases about 80-85 % furosemideas calculated. The fact that the samples go above 100 % release of the furosemide canbe explained by the contribution from the PCL, as observed in figure 7.3. Furthermore,there is some uncertainty in weighing samples with such a small weight. An analyticallaboratory balance is used with a precision of ±0.1 mg. The lack of precision can accountfor as much as 10% uncertainty as the total weight of the samples varies from 1-3.2 mg.This uncertainty is not included in the error bars. The graph shows that the release fromthe drug matrix is fast and that all the furosemide is released within 30 minutes for theembossed and heat-treated samples while it takes an hour for the non treated sample. Therelease from the drug matrix resembles the quick release observed from the amorphousfurosemide disc, while the release from the crystalline disc is very slow. The embossed andthe heat treated samples have similar release characteristic and thus pressure treatmentdoes not seem to affect the drug release. Figure 7.6 shows the cumulative release curvesfor all the heat treated samples with the non treated sample as reference. It is seen thatthe samples with short heating at 60 ◦C and the sample heated at 100 ◦C have a faster
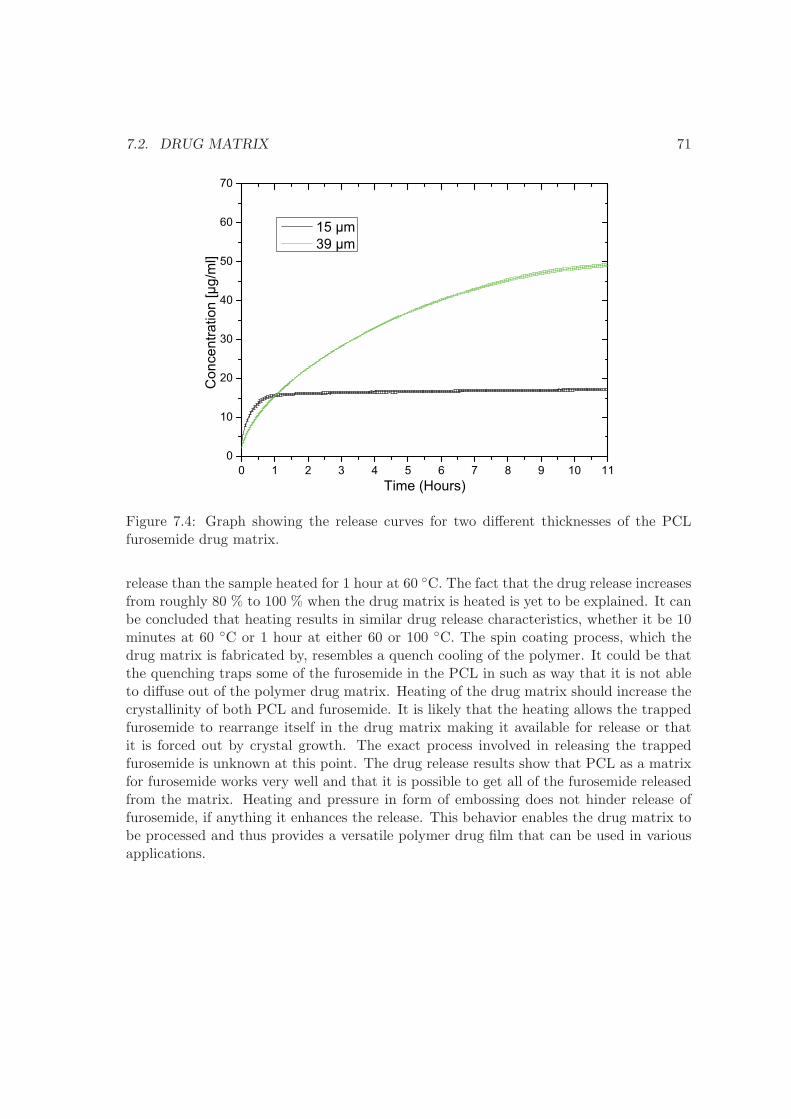
7.2. DRUG MATRIX 71
0 1 2 3 4 5 6 7 8 9 10 110
10
20
30
40
50
60
70
Con
cent
ratio
n[µ
g/m
l]
Time (Hours)
15 µm39 µm
Figure 7.4: Graph showing the release curves for two different thicknesses of the PCLfurosemide drug matrix.
release than the sample heated for 1 hour at 60 ◦C. The fact that the drug release increasesfrom roughly 80 % to 100 % when the drug matrix is heated is yet to be explained. It canbe concluded that heating results in similar drug release characteristics, whether it be 10minutes at 60 ◦C or 1 hour at either 60 or 100 ◦C. The spin coating process, which thedrug matrix is fabricated by, resembles a quench cooling of the polymer. It could be thatthe quenching traps some of the furosemide in the PCL in such as way that it is not ableto diffuse out of the polymer drug matrix. Heating of the drug matrix should increase thecrystallinity of both PCL and furosemide. It is likely that the heating allows the trappedfurosemide to rearrange itself in the drug matrix making it available for release or thatit is forced out by crystal growth. The exact process involved in releasing the trappedfurosemide is unknown at this point. The drug release results show that PCL as a matrixfor furosemide works very well and that it is possible to get all of the furosemide releasedfrom the matrix. Heating and pressure in form of embossing does not hinder release offurosemide, if anything it enhances the release. This behavior enables the drug matrix tobe processed and thus provides a versatile polymer drug film that can be used in variousapplications.
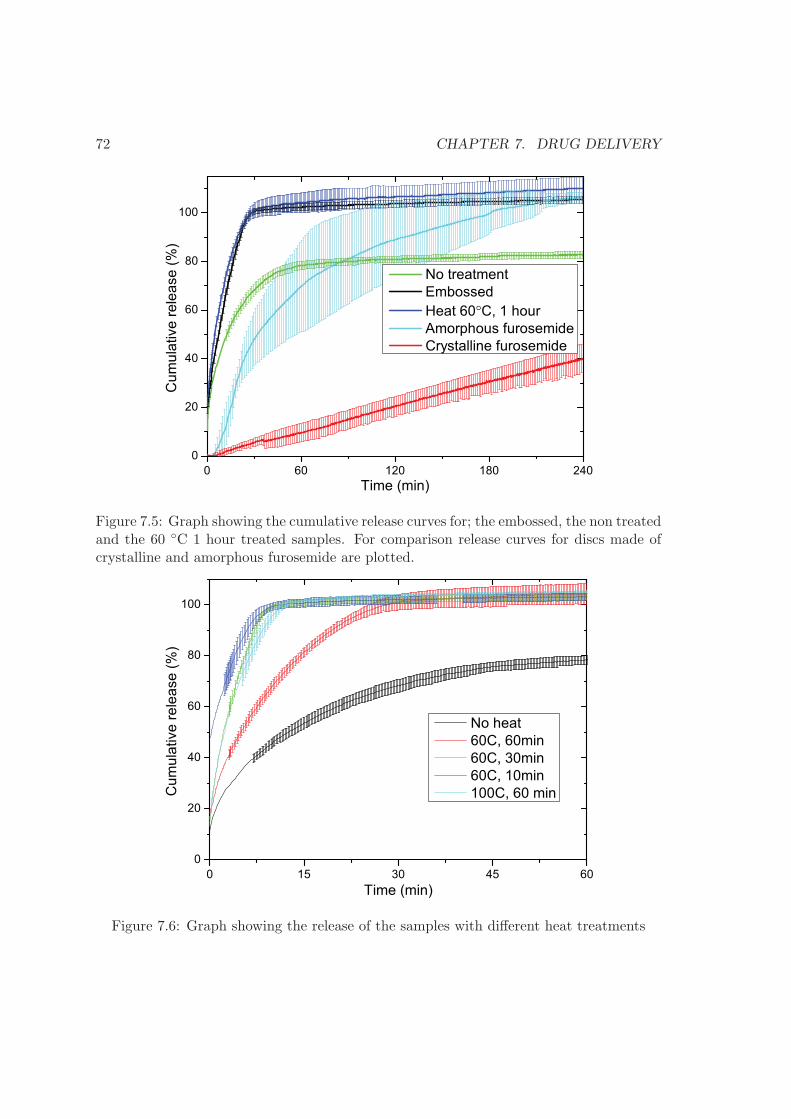
72 CHAPTER 7. DRUG DELIVERY
0 60 120 180 2400
20
40
60
80
100
No treatmentEmbossedHeat 60°C, 1 hourAmorphous furosemideCrystalline furosemide
Cum
ulat
ive
rele
ase
(%)
Time (min)
Figure 7.5: Graph showing the cumulative release curves for; the embossed, the non treatedand the 60 ◦C 1 hour treated samples. For comparison release curves for discs made ofcrystalline and amorphous furosemide are plotted.
0 15 30 45 600
20
40
60
80
100
Cum
ulat
ive
rele
ase
(%)
Time (min)
No heat60C, 60min60C, 30min60C, 10min100C, 60 min
Figure 7.6: Graph showing the release of the samples with different heat treatments
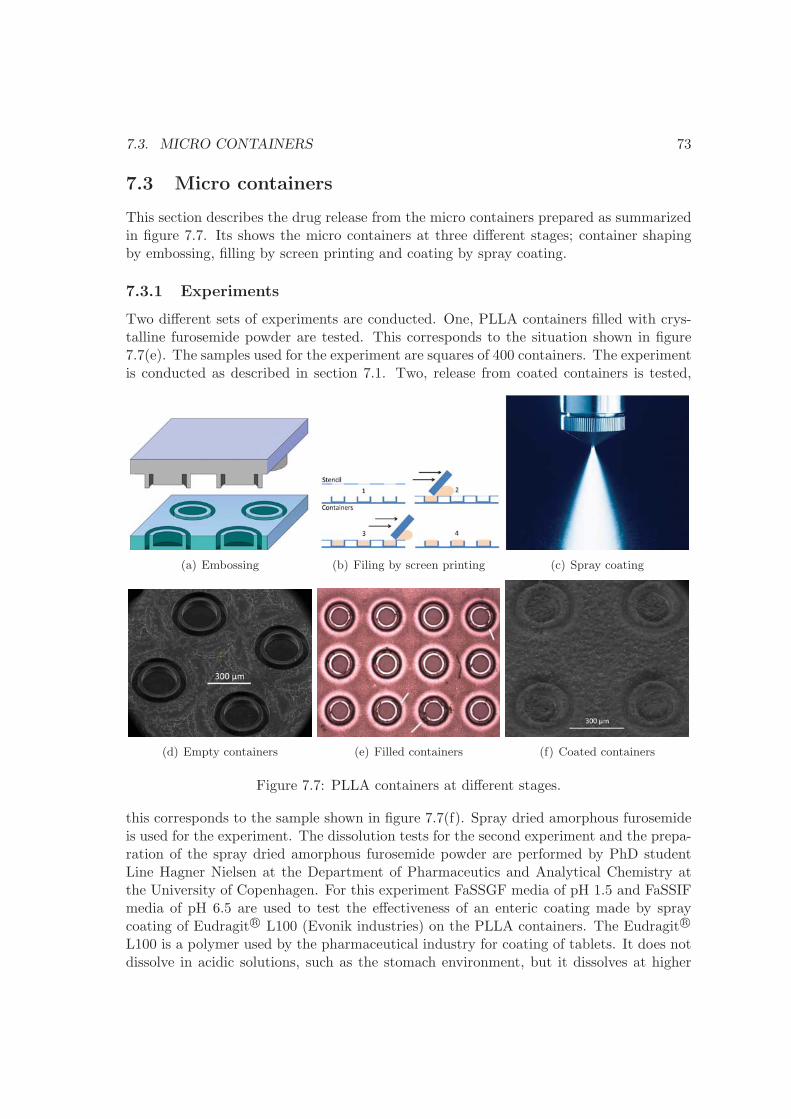
7.3. MICRO CONTAINERS 73
7.3 Micro containers
This section describes the drug release from the micro containers prepared as summarizedin figure 7.7. Its shows the micro containers at three different stages; container shapingby embossing, filling by screen printing and coating by spray coating.
7.3.1 Experiments
Two different sets of experiments are conducted. One, PLLA containers filled with crys-talline furosemide powder are tested. This corresponds to the situation shown in figure7.7(e). The samples used for the experiment are squares of 400 containers. The experimentis conducted as described in section 7.1. Two, release from coated containers is tested,
(a) Embossing (b) Filing by screen printing (c) Spray coating
(d) Empty containers (e) Filled containers (f) Coated containers
Figure 7.7: PLLA containers at different stages.
this corresponds to the sample shown in figure 7.7(f). Spray dried amorphous furosemideis used for the experiment. The dissolution tests for the second experiment and the prepa-ration of the spray dried amorphous furosemide powder are performed by PhD studentLine Hagner Nielsen at the Department of Pharmaceutics and Analytical Chemistry atthe University of Copenhagen. For this experiment FaSSGF media of pH 1.5 and FaSSIFmedia of pH 6.5 are used to test the effectiveness of an enteric coating made by spraycoating of Eudragit R© L100 (Evonik industries) on the PLLA containers. The Eudragit R©
L100 is a polymer used by the pharmaceutical industry for coating of tablets. It does notdissolve in acidic solutions, such as the stomach environment, but it dissolves at higher
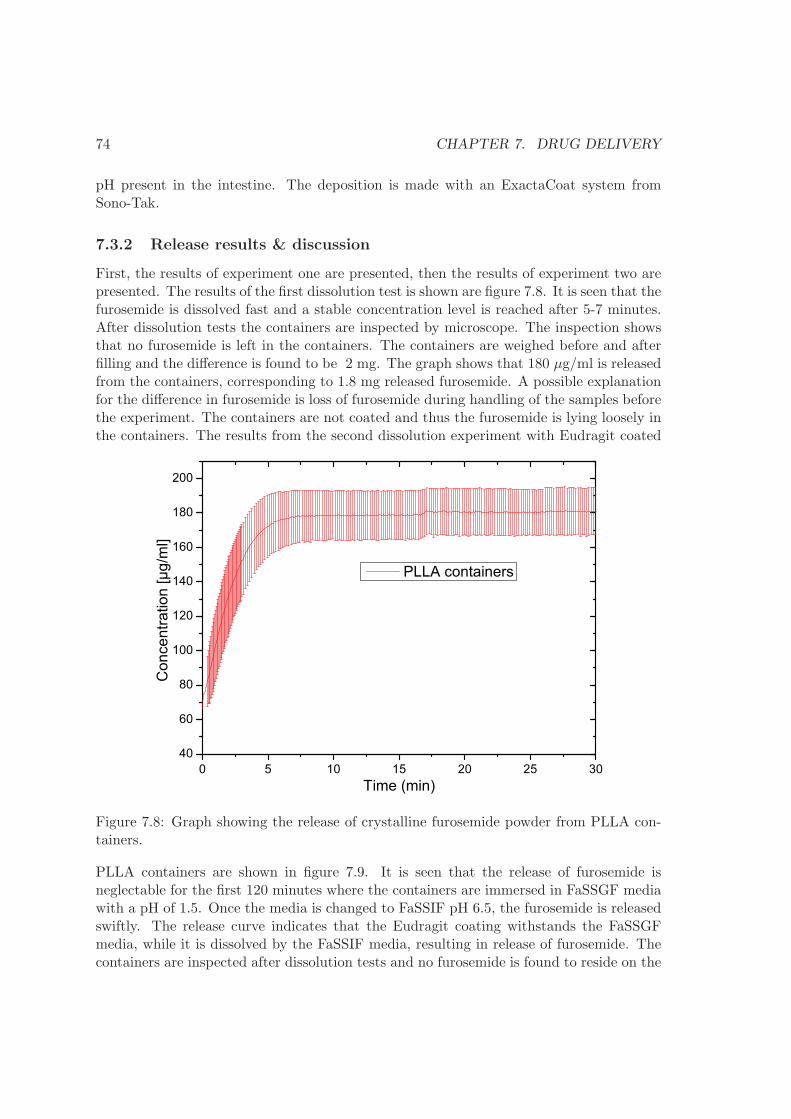
74 CHAPTER 7. DRUG DELIVERY
pH present in the intestine. The deposition is made with an ExactaCoat system fromSono-Tak.
7.3.2 Release results & discussion
First, the results of experiment one are presented, then the results of experiment two arepresented. The results of the first dissolution test is shown are figure 7.8. It is seen that thefurosemide is dissolved fast and a stable concentration level is reached after 5-7 minutes.After dissolution tests the containers are inspected by microscope. The inspection showsthat no furosemide is left in the containers. The containers are weighed before and afterfilling and the difference is found to be 2 mg. The graph shows that 180 μg/ml is releasedfrom the containers, corresponding to 1.8 mg released furosemide. A possible explanationfor the difference in furosemide is loss of furosemide during handling of the samples beforethe experiment. The containers are not coated and thus the furosemide is lying loosely inthe containers. The results from the second dissolution experiment with Eudragit coated
0 5 10 15 20 25 3040
60
80
100
120
140
160
180
200
Con
cent
ratio
n[µ
g/m
l]
Time (min)
PLLA containers
Figure 7.8: Graph showing the release of crystalline furosemide powder from PLLA con-tainers.
PLLA containers are shown in figure 7.9. It is seen that the release of furosemide isneglectable for the first 120 minutes where the containers are immersed in FaSSGF mediawith a pH of 1.5. Once the media is changed to FaSSIF pH 6.5, the furosemide is releasedswiftly. The release curve indicates that the Eudragit coating withstands the FaSSGFmedia, while it is dissolved by the FaSSIF media, resulting in release of furosemide. Thecontainers are inspected after dissolution tests and no furosemide is found to reside on the
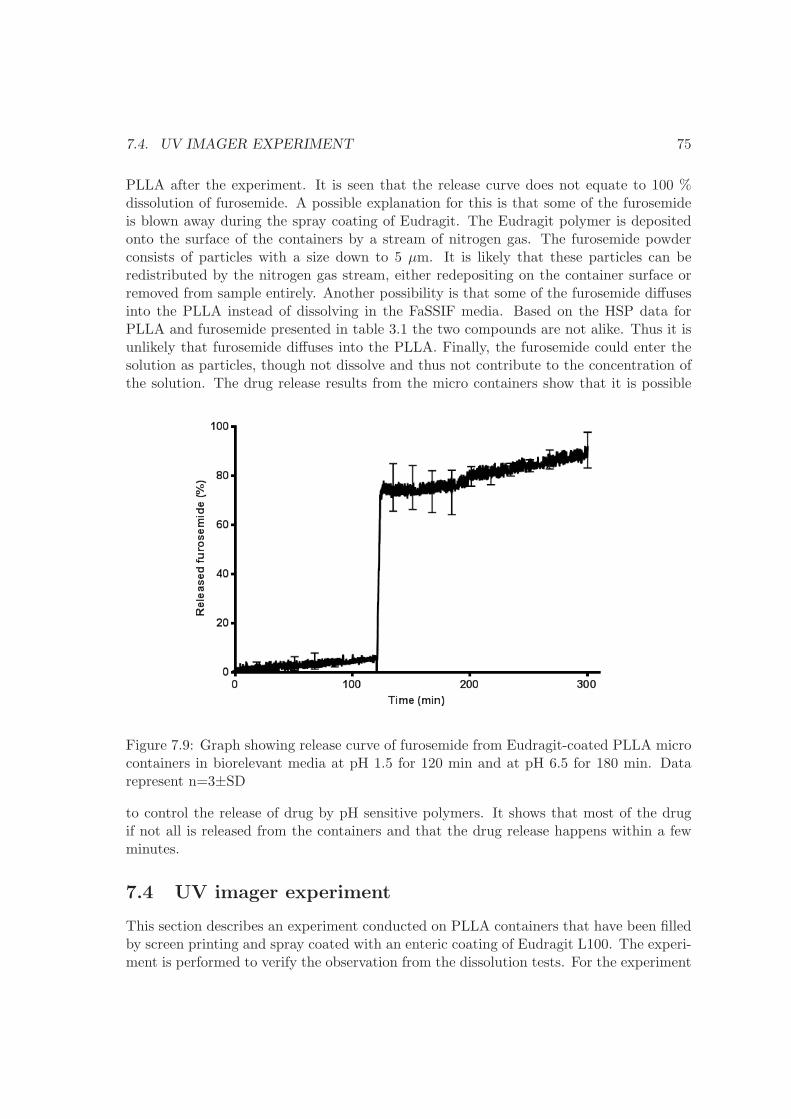
7.4. UV IMAGER EXPERIMENT 75
PLLA after the experiment. It is seen that the release curve does not equate to 100 %dissolution of furosemide. A possible explanation for this is that some of the furosemideis blown away during the spray coating of Eudragit. The Eudragit polymer is depositedonto the surface of the containers by a stream of nitrogen gas. The furosemide powderconsists of particles with a size down to 5 μm. It is likely that these particles can beredistributed by the nitrogen gas stream, either redepositing on the container surface orremoved from sample entirely. Another possibility is that some of the furosemide diffusesinto the PLLA instead of dissolving in the FaSSIF media. Based on the HSP data forPLLA and furosemide presented in table 3.1 the two compounds are not alike. Thus it isunlikely that furosemide diffuses into the PLLA. Finally, the furosemide could enter thesolution as particles, though not dissolve and thus not contribute to the concentration ofthe solution. The drug release results from the micro containers show that it is possible
Figure 7.9: Graph showing release curve of furosemide from Eudragit-coated PLLA microcontainers in biorelevant media at pH 1.5 for 120 min and at pH 6.5 for 180 min. Datarepresent n=3±SD
to control the release of drug by pH sensitive polymers. It shows that most of the drugif not all is released from the containers and that the drug release happens within a fewminutes.
7.4 UV imager experiment
This section describes an experiment conducted on PLLA containers that have been filledby screen printing and spray coated with an enteric coating of Eudragit L100. The experi-ment is performed to verify the observation from the dissolution tests. For the experiment
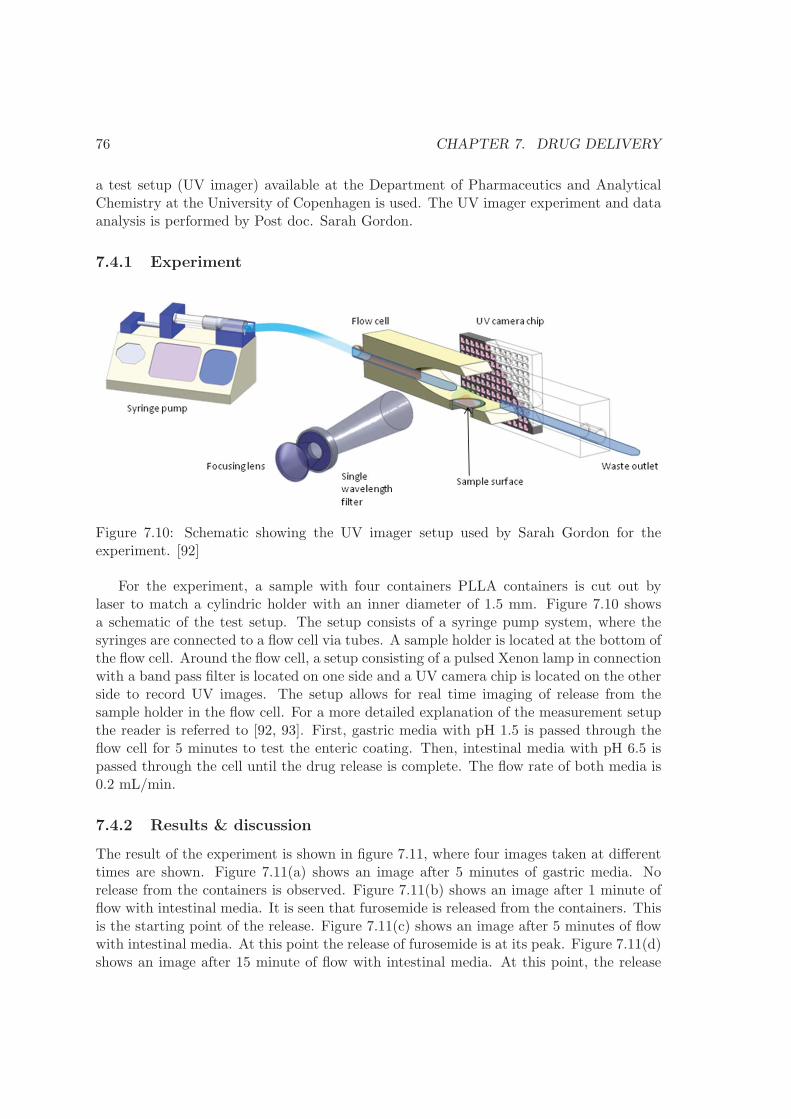
76 CHAPTER 7. DRUG DELIVERY
a test setup (UV imager) available at the Department of Pharmaceutics and AnalyticalChemistry at the University of Copenhagen is used. The UV imager experiment and dataanalysis is performed by Post doc. Sarah Gordon.
7.4.1 Experiment
Figure 7.10: Schematic showing the UV imager setup used by Sarah Gordon for theexperiment. [92]
For the experiment, a sample with four containers PLLA containers is cut out bylaser to match a cylindric holder with an inner diameter of 1.5 mm. Figure 7.10 showsa schematic of the test setup. The setup consists of a syringe pump system, where thesyringes are connected to a flow cell via tubes. A sample holder is located at the bottom ofthe flow cell. Around the flow cell, a setup consisting of a pulsed Xenon lamp in connectionwith a band pass filter is located on one side and a UV camera chip is located on the otherside to record UV images. The setup allows for real time imaging of release from thesample holder in the flow cell. For a more detailed explanation of the measurement setupthe reader is referred to [92, 93]. First, gastric media with pH 1.5 is passed through theflow cell for 5 minutes to test the enteric coating. Then, intestinal media with pH 6.5 ispassed through the cell until the drug release is complete. The flow rate of both media is0.2 mL/min.
7.4.2 Results & discussion
The result of the experiment is shown in figure 7.11, where four images taken at differenttimes are shown. Figure 7.11(a) shows an image after 5 minutes of gastric media. Norelease from the containers is observed. Figure 7.11(b) shows an image after 1 minute offlow with intestinal media. It is seen that furosemide is released from the containers. Thisis the starting point of the release. Figure 7.11(c) shows an image after 5 minutes of flowwith intestinal media. At this point the release of furosemide is at its peak. Figure 7.11(d)shows an image after 15 minute of flow with intestinal media. At this point, the release
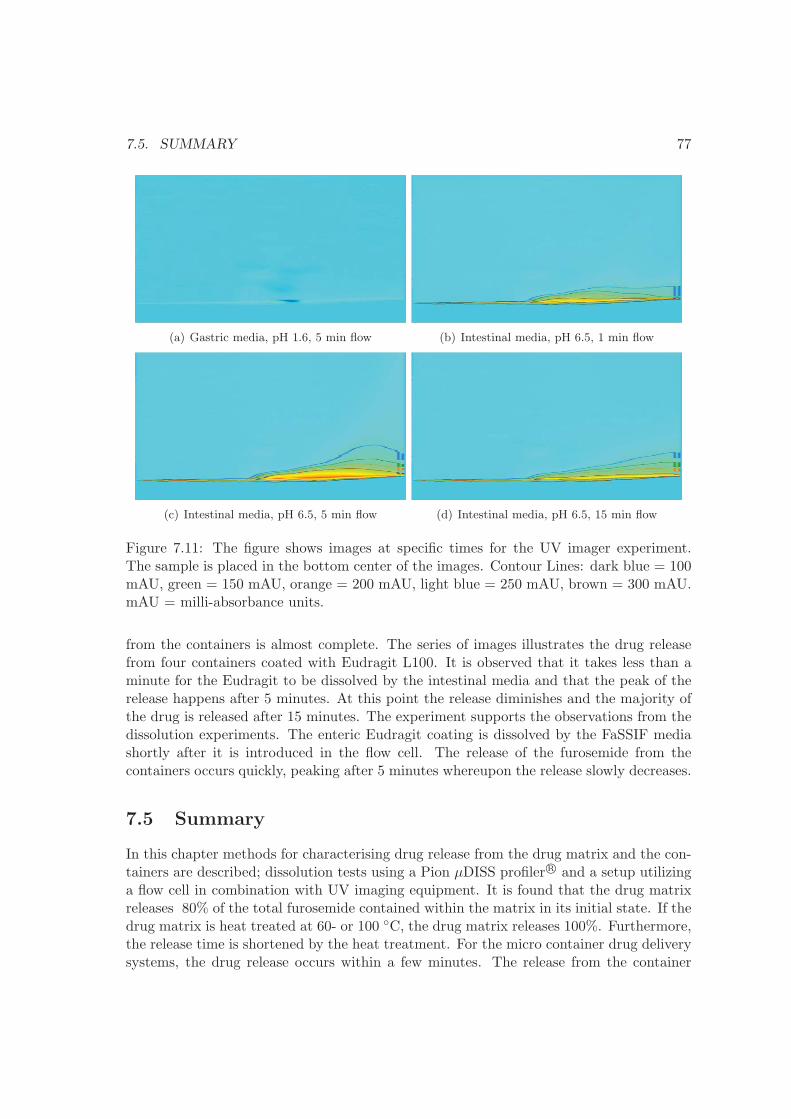
7.5. SUMMARY 77
(a) Gastric media, pH 1.6, 5 min flow (b) Intestinal media, pH 6.5, 1 min flow
(c) Intestinal media, pH 6.5, 5 min flow (d) Intestinal media, pH 6.5, 15 min flow
Figure 7.11: The figure shows images at specific times for the UV imager experiment.The sample is placed in the bottom center of the images. Contour Lines: dark blue = 100mAU, green = 150 mAU, orange = 200 mAU, light blue = 250 mAU, brown = 300 mAU.mAU = milli-absorbance units.
from the containers is almost complete. The series of images illustrates the drug releasefrom four containers coated with Eudragit L100. It is observed that it takes less than aminute for the Eudragit to be dissolved by the intestinal media and that the peak of therelease happens after 5 minutes. At this point the release diminishes and the majority ofthe drug is released after 15 minutes. The experiment supports the observations from thedissolution experiments. The enteric Eudragit coating is dissolved by the FaSSIF mediashortly after it is introduced in the flow cell. The release of the furosemide from thecontainers occurs quickly, peaking after 5 minutes whereupon the release slowly decreases.
7.5 Summary
In this chapter methods for characterising drug release from the drug matrix and the con-tainers are described; dissolution tests using a Pion μDISS profiler R© and a setup utilizinga flow cell in combination with UV imaging equipment. It is found that the drug matrixreleases 80% of the total furosemide contained within the matrix in its initial state. If thedrug matrix is heat treated at 60- or 100 ◦C, the drug matrix releases 100%. Furthermore,the release time is shortened by the heat treatment. For the micro container drug deliverysystems, the drug release occurs within a few minutes. The release from the container

78 CHAPTER 7. DRUG DELIVERY
system can be controlled by enteric coatings. Experiments show that an Eudragit L100polymer coating can prevent drug release in acidic media, FaSSGF pH 1.5. Changing themedia to FaSSIF pH 6.5 dissolves the coating and drug release from the container systemis observed. The experiments show that it is possible to tune the release of drug throughcoatings.
Chapter 8
Conclusion
The goal of this project has been to develop techniques for micro fabrication in biodegrad-able polymer and to use these techniques to realize biodegradable micro containers for oraldrug delivery. This has successfully been achieved by fabrication of micro containers fordrug delivery by hot embossing in biodegradable polymer films made of PLLA and PCL.
Polymer solutions have been developed using the theory of Hansen’s solubility param-eters. The solutions are used to deposit films which are used in the fabrication of themicro container. The films are made by spin coating and experiments have shown that itis possible to fabricate uniform and homogeneous PCL and PLLA films with a thicknessup to 110 μm. While it is possible to realize thicker films, the thickness variation in in-creases drastically as the film thickness increases.It is found that the adhesion of the PCL and PLLA films to silicon substrates can betuned by heat treatment following the spin coating process. If a strong adhesion is desiredthe heat treatment should exceed the melting temperature of the polymer. Following theheat treatment, the polymer should be cooled slowly to room temperature to avoid stresscaused by differences in thermal expansion of polymer and substrate. This procedure canbe used to remove potential bubbles in the polymer films. A poor adhesion is obtained byheat treatment below the melting point or no treatment at all.
Solutions consisting of both polymer and pharmaceuticals have been developed using theHansen’s solubility parameters. Drug matrices have been fabricated by spin coating thesesolutions. It is found that organic solvents should have similar boiling points and thussimilar evaporation rates if more than one solvent is used. If the evaporation rates differ,the solvent composition changes with time which can result in precipitation of either poly-mer or pharmaceutical. Homogenous drug matrices are obtained with solvents having alow boiling point and thus a fast evaporation rate. A drug matrix consisting of PCL andfurosemide has been developed. It is found that the highest weight ratio of furosemideto PCL is 1:4 to achieve homogenous films. A blend of DCM and Acetone is used in avolume ratio of 1:2 to dissolve both compounds. Microscopy characterization of the PCLfurosemide matrix has shown that the matrix contains porous structures with a size of
79
80 CHAPTER 8. CONCLUSION
5-10 μm. Experiments have shown that the porous structures can be removed by heatingabove the melting temperature of the polymer or by performing an embossing at 1.9 MPaabove the Tg. The morphology of the drug matrix has been studied by X-ray diffrac-tion and experiments show that furosemide is amorphous after spin coating. Experimentsshow that the furosemide remains amorphous after the drug matrix is heat treated at60◦C and after embossing at 1.9 MPa at 60 ◦C. If the drug matrix is heat treated at100◦C, the furosemide starts to crystallize. The experiments show that the PCL remainssemi crystalline for all kinds of treatment. Drug release from the drug matrix is tested bydissolution. Experiments show that the drug matrix releases 80% of the total furosemidecontained within the matrix. If the drug matrix is heat treated at 60 ◦C or 100 ◦C, thedrug matrix releases 100% and the drug release is shortened. Pressure such as the oneapplied during embossing has no effect on the drug release.
Hot embossing processes have been developed for fabrication of micro containers withthe biodegradable polymers PCL and PLLA. A stamp is pressed into a spin coated poly-mer film of PCL or PLLA. A successful pattern transfer from stamp to polymer film isachieved at 60 ◦C and a pressure of 1.9 MPa for 1 hour for the PCL films. For the PLLA,a successful pattern transfer is obtained at 120 ◦C and a pressure of 1.9 MPa for 1 hour.Embossing experiments show that a residual layer connects the micro containers to thesurrounding polymer film after embossing and that the residual layer is difficult to removein an efficient manner. Crystallization of PLLA is observed during the embossing and toavoid cracking of the PLLA film it should be lifted from the substrate after embossing.No cracking is observed for the PCL film.
For the embossing process, stamps in three different materials have been fabricated. SU-8stamps have been fabricated by a two step photo lithography process. Silicon stamps havebeen fabricated by a two step DRIE process. Nickel stamps have been fabricated by a twostep DRIE process followed by an electroplating process. Both silicon and SU-8 stampshave shown limited durability, with SU-8 having the better performance of the two. Thebrittle nature of silicon causes severe damage to the stamps during embossing. For theSU-8, the lack of durability is believed to be caused by a lack of material strength. Thenickel stamps have shown impeccable durability and are recommended for further work.DRIE processes capable of producing positively sloped side walls have been developed. Itis found that by varying the chamber pressure and platen power, the slope of the sidewallscan be controlled. The sloped sidewalls enable an easy release of stamps from polymerfilms.
Besides the micro containers fabricated in the biodegradable polymers PCL and PLLA,micro containers have been fabricated in SU-8. The containers are made by a two stepphoto lithography process. The SU-8 micro containers serve as a model system for testingfilling methods for micro containers and initial studies on micro containers as drug deliverydevices.
Three different ways of filling micro containers with drug have been tested; embossing
81
of polymer drug matrix, solvent casting and screen printing. The embossing of polymerdrug matrix to fill micro containers has been tested on SU-8 containers. The filling methodhas been shown to work on a wafer scale. The method is not limited to the SU-8 contain-ers and might be feasible as filling method for the biodegradable containers, if they arefabricated in a manner that leaves them sitting out of plane with the polymer film. Thedrug loading is related to the ratio of drug to polymer used in the drug matrix. At itscurrent state, this means a filling level of 20 %. Solvent casting is another method used tofill micro containers. The method works on a wafer level, although polymer and drug isdeposited outside the micro containers as well as inside. In the experiments a blend of 33% furosemide and 66 % PAA was used and thus a filling level of 33 % is currently possible.Screen printing is another method used to fill micro container and this method is the oneused for drug release experiments carried out with the micro containers. The methodutilizes a stencil fabricated by laser cutting of a transparent foil. The foil is aligned to themicro containers whereafter the containers are filled by scraping drug across the stencil.The foil is removed along with excess drug. If pure drug powder is used, the method allowsfor up to 100 % filling level. The method is tested on squares containing 400 biodegradablemicro containers. The method is not limited to the biodegradable containers and can beused for the SU-8 containers as well. The method is up scalable and is recommended forfilling of micro containers.
Drug release experiments with furosemide showed that release from the micro contain-ers take place within a few minutes and that most of the furosemide is able to exit thecontainer and dissolve in simulated intestinal media. It is shown that the drug release ofthe containers can be controlled by adding polymeric coatings. Experiments show that anEudragit L100 polymer coating prevents drug release in simulated gastric media, pH 1.5while it dissolves in simulated intestinal media, pH 6.5 and enables drug release from thecontainers.
In conclusion micro systems for drug delivery have been developed. To achieve this, poly-mer films have been fabricated by spin coating of solutions consisting of PCL and PLLAin organic solvents. Defining of micro structures by hot embossing processes has been de-veloped. The processes enable large scale fabrication of micro containers in biodegradablepolymers. Large scale filling methods have been developed for the biodegradable microcontainers. Enclosed micro container drug delivery devices capable of releasing drug bychange in pH have been demonstrated by spray coating of enteric coatings. A drug matrixhas been developed by spin coating solutions consisting of both polymer and drug.

82 CHAPTER 8. CONCLUSION
Chapter 9
Outlook
Micro containers present progress towards the vision described in section 1.1 further im-provements are needed. Separating containers and handling of individual devices hasproven to be difficult. Therefore imminent improvements within these areas are needed.A possibility is to use laser machining equipment to fabricate the entire device or to cutout the micro containers after embossing. Another option is to introduce a sacrificial layeron which the micro containers can be fabricated. The sacrificial layer can then be cut intopieces containing a desired amount of containers needed for a dose. Once the containersneed to be released, this can be done by dissolving the sacrificial layer. One possibility isto use a water soluble polymer layer, like the PAA used in this work.
At this stage, the drug matrix consists of a polymer and a drug that are not alike ac-cording to HSP. The principle of the HSP is that ”like dissolve like”, thus it could beinteresting to match polymers and drugs by HSP values. This could be a way to increasethe amount of drug that can be homogeneously distributed in the polymer film. Anotherpossibility is to investigate if the introduction of surfactants to the drug matrix couldincrease the drug loading.
A lot of research has been put into the development of micro devices for oral drug delivery,as detailed in section 1.5 and in this work. It has shown that a large number of devices,thousands to hundred thousands, are needed for the delivery of a dose. Thus, fabricationof these devices needs to be up scaled to accommodate this. It means that fabricationtechniques capable of fabricating millions, if not billions are needed. Additionally, themicro devices have to be able to compete with other drug delivery systems such as con-ventional tablets and pills. This means that the fabrication must be cheap. These factorspoint in the direction of mass production.
The state of art of micro devices for oral drug delivery is as follows; proof of concepthas been shown for; protection of drug by container and outer layers, mucoadhesion bysurface chemistry modification or polymeric coatings, controlled release by enteric coat-ings and unidirectional release by design. To advance the concept of micro devices for oral
83

84 CHAPTER 9. OUTLOOK
drug delivery the following needs to be accomplished; clinical trials where micro devicesare used for treatment and where features (drug protection, mucoadhesion, unidirectionalrelease) of micro devices proves critical for the success of the treatment. Furthermore,fabrication techniques enabling mass production of devices are crucial; large amounts ofdevices are needed for a dose and many doses are needed in order to conduct clinical trials.
Bibliography
[1] F.J. Martin and C. Grove. Microfabricated drug delivery systems: concepts to im-prove clinical benefit. Biomedical Microdevices, 3(2):97–108, 2001.
[2] X. Zhang, H. He, C. Yen, W. Ho, and L.J. Lee. A biodegradable, immunoprotective,dual nanoporous capsule for cell-based therapies. Biomaterials, 29(31):4253–4259,2008.
[3] H. Takeuchi, J. Thongborisute, Y. Matsui, H. Sugihara, H. Yamamoto, andY. Kawashima. Novel mucoadhesion tests for polymers and polymer-coated parti-cles to design optimal mucoadhesive drug delivery systems. Advanced drug deliveryreviews, 57(11):1583–1594, 2005.
[4] A. Ahmed, C. Bonner, and T.A. Desai. Bioadhesive microdevices with multiplereservoirs: a new platform for oral drug delivery. Journal of Controlled Release,81(3):291–306, 2002.
[5] C.J.H. Porter, N.L. Trevaskis, and W.N. Charman. Lipids and lipid-based formula-tions: optimizing the oral delivery of lipophilic drugs. Nature Reviews Drug Discovery,6(3):231–248, 2007.
[6] J. Brouwers, M.E. Brewster, and P. Augustijns. Supersaturating drug delivery sys-tems: The answer to solubility-limited oral bioavailability? Journal of pharmaceuticalsciences, 98(8):2549–2572, 2009.
[7] T. Vasconcelos, B. Sarmento, and P. Costa. Solid dispersions as strategy to improveoral bioavailability of poor water soluble drugs. Drug discovery today, 12(23):1068–1075, 2007.
[8] C. Leuner and J. Dressman. Improving drug solubility for oral delivery using soliddispersions. European Journal of Pharmaceutics and Biopharmaceutics, 50(1):47–60,2000.
[9] G.G. Liversidge and K.C. Cundy. Particle size reduction for improvement of oralbioavailability of hydrophobic drugs: I. absolute oral bioavailability of nanocrystallinedanazol in beagle dogs. International journal of pharmaceutics, 125(1):91–97, 1995.
85

86 BIBLIOGRAPHY
[10] L. Engelen, R.A. de Wijk, A. van der Bilt, J.F. Prinz, A.M. Janssen, and F. Bosman.Relating particles and texture perception. Physiology & behavior, 86(1):111–117,2005.
[11] J. Guan, H. He, L.J. Lee, and D.J. Hansford. Fabrication of particulate reservoir-containing, capsulelike, and self-folding polymer microstructures for drug delivery.small, 3(3):412–418, 2007.
[12] HV Chavda, CN Patel, IS Anand, et al. Biopharmaceutics classification system.Systematic Reviews in Pharmacy, 1(1):62, 2010.
[13] S. Stegemann, F. Leveiller, D. Franchi, H. De Jong, and H. Linden. When poorsolubility becomes an issue: from early stage to proof of concept. European journalof pharmaceutical sciences, 31(5):249–261, 2007.
[14] Furosemid, pro.medicin.dk @online jan 2013. http://pro.medicin.dk/Medicin/Praeparater/4004.
[15] Furosemide at www. drugs.com @online jan 2013.http://www.drugs.com/furosemide.html.
[16] M.H. Cohen, K. Melnik, A.A. Boiarski, M. Ferrari, and F.J. Martin. Microfabri-cation of silicon-based nanoporous particulates for medical applications. BiomedicalMicrodevices, 5(3):253–259, 2003.
[17] A.B. Foraker, R.J. Walczak, M.H. Cohen, T.A. Boiarski, C.F. Grove, and P.W.Swaan. Microfabricated porous silicon particles enhance paracellular delivery of in-sulin across intestinal caco-2 cell monolayers. Pharmaceutical research, 20(1):110–116,2003.
[18] S.L. Tao and T.A. Desai. Gastrointestinal patch systems for oral drug delivery. Drugdiscovery today, 10(13):909–915, 2005.
[19] S. Sant, S.L. Tao, O. Fisher, Q. Xu, N.A. Peppas, and A. Khademhosseini. Mi-crofabrication technologies for oral drug delivery. Advanced drug delivery reviews,2011.
[20] P. Colombo, F. Sonvico, G. Colombo, and R. Bettini. Novel platforms for oral drugdelivery. Pharmaceutical research, 26(3):601–611, 2009.
[21] H.D. Chirra and T.A. Desai. Emerging microtechnologies for the development of oraldrug delivery devices. Advanced Drug Delivery Reviews, 2012.
[22] D. Teutonico and G. Ponchel. Patches for improving gastrointestinal absorption: anoverview. Drug discovery today, 16(21):991–997, 2011.
[23] H.D. Chirra and T.A. Desai. Multi-reservoir bioadhesive microdevices for independentrate-controlled delivery of multiple drugs. Small, 2012.
BIBLIOGRAPHY 87
[24] D.A. Canelas, K.P. Herlihy, and J.M. DeSimone. Top-down particle fabrication: con-trol of size and shape for diagnostic imaging and drug delivery. Wiley InterdisciplinaryReviews: Nanomedicine and Nanobiotechnology, 1(4):391–404, 2009.
[25] N. Venkatesan, K. Uchino, K. Amagase, Y. Ito, N. Shibata, and K. Takada. Gastro-intestinal patch system for the delivery of erythropoietin. Journal of controlled release,111(1):19–26, 2006.
[26] A. Ahmed, C. Bonner, and T.A. Desai. Bioadhesive microdevices for drug delivery:a feasibility study. Biomedical Microdevices, 3(2):89–96, 2001.
[27] S.L. Tao, M.W. Lubeley, and T.A. Desai. Bioadhesive poly (methyl methacrylate)microdevices for controlled drug delivery. Journal of controlled release, 88(2):215–228,2003.
[28] S.L. Tao and T.A. Desai. Microfabrication of multilayer, asymmetric, polymericdevices for drug delivery. Advanced Materials, 17(13):1625–1630, 2005.
[29] K.M. Ainslie, C.M. Kraning, and T.A. Desai. Microfabrication of an asymmetric,multi-layered microdevice for controlled release of orally delivered therapeutics. LabChip, 8(7):1042–1047, 2008.
[30] K.M. Ainslie, R.D. Lowe, T.T. Beaudette, L. Petty, E.M. Bachelder, and T.A. Desai.Microfabricated devices for enhanced bioadhesive drug delivery: Attachment to andsmall-molecule release through a cell monolayer under flow. Small, 5(24):2857–2863,2009.
[31] S.E.A. Gratton, P.D. Pohlhaus, J. Lee, J. Guo, M.J. Cho, and J.M. DeSimone.Nanofabricated particles for engineered drug therapies: A preliminary biodistribu-tion study of print nanoparticles. Journal of Controlled Release, 121(1):10–18, 2007.
[32] S.E.A. Gratton, S.S. Williams, M.E. Napier, P.D. Pohlhaus, Z. Zhou, K.B. Wiles,B.W. Maynor, C. Shen, T. Olafsen, E.T. Samulski, et al. The pursuit of a scalablenanofabrication platform for use in material and life science applications. Accountsof chemical research, 41(12):1685–1695, 2008.
[33] A. Garcia, P. Mack, S. Williams, C. Fromen, T. Shen, J. Tully, J. Pillai, P. Kuehl,M. Napier, J.M. DeSimone, et al. Microfabricated engineered particle systems forrespiratory drug delivery and other pharmaceutical applications. Journal of DrugDelivery, 2012, 2012.
[34] S. Eiamtrakarn, Y. Itoh, J. Kishimoto, Y. Yoshikawa, N. Shibata, M. Murakami, andK. Takada. Gastrointestinal mucoadhesive patch system (gi-maps) for oral adminis-tration of g-csf, a model protein. Biomaterials, 23(1):145–152, 2002.
[35] S. Eaimtrakarn, YV Rama Prasad, S.P. Puthli, Y. Yoshikawa, N. Shibata, andK. Takada. Possibility of a patch system as a new oral delivery system. Interna-tional journal of pharmaceutics, 250(1):111–117, 2003.
88 BIBLIOGRAPHY
[36] Y. Ito, Y. Ochii, K. Fukushima, N. Sugioka, and K. Takada. Three-layered microcap-sules as a long-term sustained release injection preparation. International journal ofpharmaceutics, 384(1):53–59, 2010.
[37] J. Guan, H. He, D.J. Hansford, and L.J. Lee. Self-folding of three-dimensional hy-drogel microstructures. The Journal of Physical Chemistry B, 109(49):23134–23137,2005.
[38] J. Guan, N. Ferrell, L. James Lee, and D.J. Hansford. Fabrication of polymericmicroparticles for drug delivery by soft lithography. Biomaterials, 27(21):4034–4041,2006.
[39] H. He, V. Grignol, V. Karpa, C. Yen, K. LaPerle, X. Zhang, N.B. Jones, M.I. Liang,G.B. Lesinski, WS Ho, and L.J. Lee. Use of a nanoporous biodegradable miniaturedevice to regulate cytokine release for cancer treatment. Journal of Controlled Release,151(3):239–245, 2011.
[40] H. He, X. Cao, and L.J. Lee. Design of a novel hydrogel-based intelligent system forcontrolled drug release. Journal of controlled release, 95(3):391–402, 2004.
[41] Gert R. Strobl. The physics of polymers: concepts for understanding their structuresand behavior. Springer, 1997.
[42] Charles m. hansen ::: The official hansen solubility parameters website.http://www.hansen-solubility.com/index.php?id=25.
[43] Charles M. Hansen. Hansens solubility parameters: a user’s handbook, volume 2007.CRC Press, second edition edition, jun 2007.
[44] D.W Van Krevelen. Properties of polymers, volume 1990. Elsevier, third editionedition, 1990.
[45] Charles m. hansen ::: The official hansen solubility parameters website.http://www.hansen-solubility.com/index.php?id=25.
[46] European bioplastics organization, fact sheets, bioplastics @online dec 2012.http://en.european-bioplastics.org/multimedia/.
[47] N. Umeki, T. Sato, M. Harada, J. Takeda, S. Saito, Y. Iwao, and S. Itai. Preparationand evaluation of biodegradable films containing the potent osteogenic compoundbfb0261 for localized delivery. International journal of pharmaceutics, 404(1):10–18,2011.
[48] R. Shi and H.M. Burt. Amphiphilic dextran-graft-poly ε-caprolactone) films for thecontrolled release of paclitaxel. International journal of pharmaceutics, 271(1):167–179, 2004.
BIBLIOGRAPHY 89
[49] ZG Tang, RA Black, JM Curran, JA Hunt, NP Rhodes, and DF Williams. Surfaceproperties and biocompatibility of solvent-cast poly ε-caprolactone] films. Biomate-rials, 25(19):4741–4748, 2004.
[50] T.K. Dash and V.B. Konkimalla. Poly-ε-caprolactone based formulations for drugdelivery and tissue engineering: A review. Journal of Controlled Release, 158(1):15–33, 2012.
[51] RRM Bos, FB Rozema, G. Boering, AJ Nijenhius, AJ Pennings, AB Verwey,P. Nieuwenhuis, and HWB Jansen. Degradation of and tissue reaction to biodegrad-able poly (l-lactide) for use as internal fixation of fractures: a study in rats. Bioma-terials, 12(1):32–36, 1991.
[52] K. Van de Velde and P. Kiekens. Biopolymers: overview of several properties andconsequences on their applications. Polymer Testing, 21(4):433–442, 2002.
[53] NG Semaltianos. Spin-coated pmma films. Microelectronics journal, 38(6):754–761,2007.
[54] Stephan Keller. Fabrication of an autonomous surface stress sensor with the polymerSU-8. PhD thesis, Technical University of Denmark, 2008.
[55] C. Mack. Fundamental principles of optical lithography: the science of microfabrica-tion. Wiley, 2011.
[56] G.S. May and S.M. Sze. Fundamentals of semiconductor fabrication. Wiley, 2004.
[57] PSI. Paul scherrer institut, materials group @ONLINE dec, 2012. http://
materials.web.psi.ch/Research/Thin_Films/Methods/Spin.htm.
[58] M.M. Crowley, F. Zhang, M.A. Repka, S. Thumma, S.B. Upadhye, S. Kumar Battu,J.W. McGinity, and C. Martin. Pharmaceutical applications of hot-melt extrusion:part i. Drug development and industrial pharmacy, 33(9):909–926, 2007.
[59] M.A. Repka, S.K. Battu, S.B. Upadhye, S. Thumma, M.M. Crowley, F. Zhang,C. Martin, and J.W. McGinity. Pharmaceutical applications of hot-melt extrusion:Part ii. Drug development and industrial pharmacy, 33(10):1043–1057, 2007.
[60] M. Belmares, M. Blanco, WA Goddard, RB Ross, G. Caldwell, S.H. Chou, J. Pham,PM Olofson, and C. Thomas. Hildebrand and hansen solubility parameters frommolecular dynamics with applications to electronic nose polymer sensors. Journal ofcomputational chemistry, 25(15):1814–1826, 2004.
[61] S.C. Shin and J. Kim. Physicochemical characterization of solid dispersion offurosemide with tpgs. International journal of pharmaceutics, 251(1):79–84, 2003.
[62] S. Keller, D. Haefliger, and A. Boisen. Optimized plasma-deposited fluorocarboncoating for dry release and passivation of thin su-8 cantilevers. Journal of VacuumScience & Technology B: Microelectronics and Nanometer Structures, 25(6):1903–1908, 2007.

90 BIBLIOGRAPHY
[63] Y. MATSUDA, M. OTSUKA, M. ONOE, and E. TATSUMI. Amorphism and physic-ochemical stability of spray-dried frusemide. Journal of pharmacy and pharmacology,44(8):627–633, 1992.
[64] BC Ng, HY Wong, KW Chew, and Z. Osman. Development and characterization ofpoly-ε-caprolactone-based polymer electrolyte for lithium rechargeable battery. Int.J. Electrochem. Sci, 6:4355–4364, 2011.
[65] M.J. Madou. Fundamentals of microfabrication: the science of miniaturization. CRC,2002.
[66] Anders Greve. Fabrication of polymer microcantilevers by nanoimprint lithography.PhD thesis, Technical University of Denmark, 2009.
[67] M. Worgull. Hot embossing: theory and technology of microreplication. WilliamAndrew Pub, 2009.
[68] J.D. Gelorme, R.J. Cox, and S.A.R. Gutierrez. Photoresist composition and printedcircuit boards and packages made therewith, November 21 1989. US Patent 4,882,245.
[69] R. Li, Y. Lamy, WFA Besling, F. Roozeboom, and PM Sarro. Continuous deepreactive ion etching of tapered via holes for three-dimensional integration. Journal ofMicromechanics and Microengineering, 18(12):125023, 2008.
[70] R.C. Rowe, P.J. Sheskey, and S.C. Owen. Handbook of pharmaceutical excipients.Pharmaceutical press London, 2006.
[71] L.H. Nielsen, S.S. Keller, K.C. Gordon, A. Boisen, T. Rades, and A. Mullertz. Spatialconfinement can lead to increased stability of amorphous indomethacin. EuropeanJournal of Pharmaceutics and Biopharmaceutics, 2012.
[72] Paolo Marizza. Inkjet printing as a technique for filling of micro-wells with bio-compatible polymers. Submitted to Journal of Microelectronic Engineering, 2012.
[73] D. Akesson, M. Skrifvars, S. Lv, W. Shi, K. Adekunle, J. Seppala, and M. Turunen.Preparation of nanocomposites from biobased thermoset resins by uv-curing. Progressin Organic Coatings, 67(3):281–286, 2010.
[74] M. Pulkkinen, M. Malin, T. Tarvainen, T. Saarimaki, J. Seppala, and K. Jarvinen.Effects of block length on the enzymatic degradation and erosion of oxazoline linkedpoly-ε-caprolactone. European journal of pharmaceutical sciences, 31(2):119–128,2007.
[75] M. Pulkkinen, M. Malin, J. Bohm, T. Tarvainen, T. Wirth, J. Seppala, andK. Jarvinen. ¡ i¿ in vivo¡/i¿ implantation of 2, 2’-bis (oxazoline)-linked poly-ε-caprolactone: Proof for enzyme sensitive surface erosion and biocompatibility. Euro-pean Journal of Pharmaceutical Sciences, 36(2):310–319, 2009.
BIBLIOGRAPHY 91
[76] J. Wang, Y. Gong, G. Abba, J. Cao, J. Shi, and G. Cai. Micro milling technolo-gies for mems. In Perspective Technologies and Methods in MEMS Design, 2007.MEMSTECH 2007. International Conference on, pages 86–95. IEEE, 2007.
[77] A.M. Greiner, B. Richter, and M. Bastmeyer. Micro-engineered 3d scaffolds for cellculture studies. Macromolecular Bioscience, 2012.
[78] S. Bae, H. Kim, Y. Lee, X. Xu, J.S. Park, Y. Zheng, J. Balakrishnan, T. Lei, H.R.Kim, Y.I. Song, et al. Roll-to-roll production of 30-inch graphene films for transparentelectrodes. Nature nanotechnology, 5(8):574–578, 2010.
[79] F.C. Krebs, T. Tromholt, and M. Jørgensen. Upscaling of polymer solar cell fabrica-tion using full roll-to-roll processing. Nanoscale, 2(6):873–886, 2010.
[80] R.R. Gattass and E. Mazur. Femtosecond laser micromachining in transparent ma-terials. Nature Photonics, 2(4):219–225, 2008.
[81] S.S. Keller, N. Feidenhans’l, N. Fisker-Bødker, D. Soulat, A. Greve, D.V. Plackett,and A. Boisen. Fabrication of biopolymer cantilevers using nanoimprint lithography.Microelectronic Engineering, 88(8):2294–2296, 2011.
[82] V. Linder, B.D. Gates, D. Ryan, B.A. Parviz, and G.M. Whitesides. Water-solublesacrificial layers for surface micromachining. Small, 1(7):730–736, 2005.
[83] H. Abe, Y. Kikkawa, Y. Inoue, and Y. Doi. Morphological and kinetic analyses ofregime transition for poly [(s)-lactide] crystal growth. Biomacromolecules, 2(3):1007–1014, 2001.
[84] A. Stromquist. Simple screenprinting: basic techniques & creative projects. LarkBooks, 2005.
[85] Gyuman Kim, Beomjoon Kim, and Jurgen Brugger. All-photoplastic microstencilwith self-alignment for multiple layer shadow-mask patterning. Sensors and ActuatorsA: Physical, 107(2):132–136, 2003.
[86] A. Boisen S.S. Keller, F.G. Bosco. Ferromagnetic shadow mask for spray coating ofpolymer patterns. Submitted to Journal of Microelectronic Engineering, 2012.
[87] H. Bruus. Theoretical microfluidics, volume 18. Oxford University Press, USA, 2007.
[88] AK Bassi, JE Gough, M. Zakikhani, and S. Downes. The chemical and physicalproperties of poly (ε-caprolactone) scaffolds functionalised with poly (vinyl phospho-nic acid-co-acrylic acid). Journal of tissue engineering, 2(1), 2011.
[89] ZG Tang, RA Black, JM Curran, JA Hunt, NP Rhodes, and DF Williams. Surfaceproperties and biocompatibility of solvent-cast poly ε-caprolactone films. Biomateri-als, 25(19):4741–4748, 2004.
92 BIBLIOGRAPHY
[90] T.I. Croll, A.J. O’Connor, G.W. Stevens, and J.J. Cooper-White. Controllable sur-face modification of poly (lactic-co-glycolic acid)(plga) by hydrolysis or aminolysis i:Physical, chemical, and theoretical aspects. Biomacromolecules, 5(2):463–473, 2004.
[91] S. Pranonsatit and S. Lucyszyn. Micromachined screen printing (masprint) technol-ogy for rf mems applications. In High Frequency Postgraduate Student Colloquium,2005, pages 3–6. IEEE, 2005.
[92] J. Østergaard, E. Meng-Lund, S.W. Larsen, C. Larsen, K. Petersson, J. Lenke, andH. Jensen. Real-time uv imaging of nicotine release from transdermal patch. Phar-maceutical research, 27(12):2614–2623, 2010.
[93] S. Gordon, K. Naelapaa, J. Rantanen, A. Selen, A. Mullertz, and J. Østergaard.Real-time dissolution behavior of furosemide in biorelevant media as determined byuv imaging. Pharmaceutical Development and Technology, (00):1–10, 2012.

BIBLIOGRAPHY 93
List of scientific contributions
This appendix lists the scientific contributions presented during the PhD study. First oralpresentation are listed, the poster presentations and lastly published works is listed.
Oral presentations
The 3rd Biomaterials Symposium ”Biointerfaces”, ”3D microstructuring of biopolymers”at iNANO, Aarhus University, November 4th, 2010.
38th International Micro and Nano Engineering Conference, ”Micro containers with solidpolymer drug matrix for oral drug delivery”, Toulouse, 2012.
Poster presentations
36th International Micro and Nano Engineering Conference, ”3D Microstructuring ofbiodegradable polymers”, Genoa, 2010.
48th Nordic Polymer Days, ”Biopolymer micro wells”, Stockholm, KTH, Royal Instituteof Technology, 2011.
American Association of Pharmaceutical Scientists Annual Meeting and Exposition 2012,”Spin coated films for use in micro patch drug delivery system”, Chicago, 2012.
16th International Conference on Miniaturized Systems for Chemistry and Life Sciences,”Micro Containers with Solid Polymer Drug Matrix for Oral Drug Delivery” Japan 2012.
Publications
”3D microstructuring of biodegradable polymers”, J. Nagstrup, S. S. Keller, K. Almdal,A. Boisen, Journal of Microelectronic Engineering, volume 88, 2342-2344, 2011.
”Micro containers with solid polymer drug matrix for oral drug delivery” J. Nagstrup,S. S. Keller, A. Mullertz and A. Boisen, 16th International Conference on MiniaturizedSystems for Chemistry and Life Sciences, 978-0-9798064-5-2/μTAS 2012/$20 c©12CBMS-0001, (2012)

94 BIBLIOGRAPHY

Appendix A
95
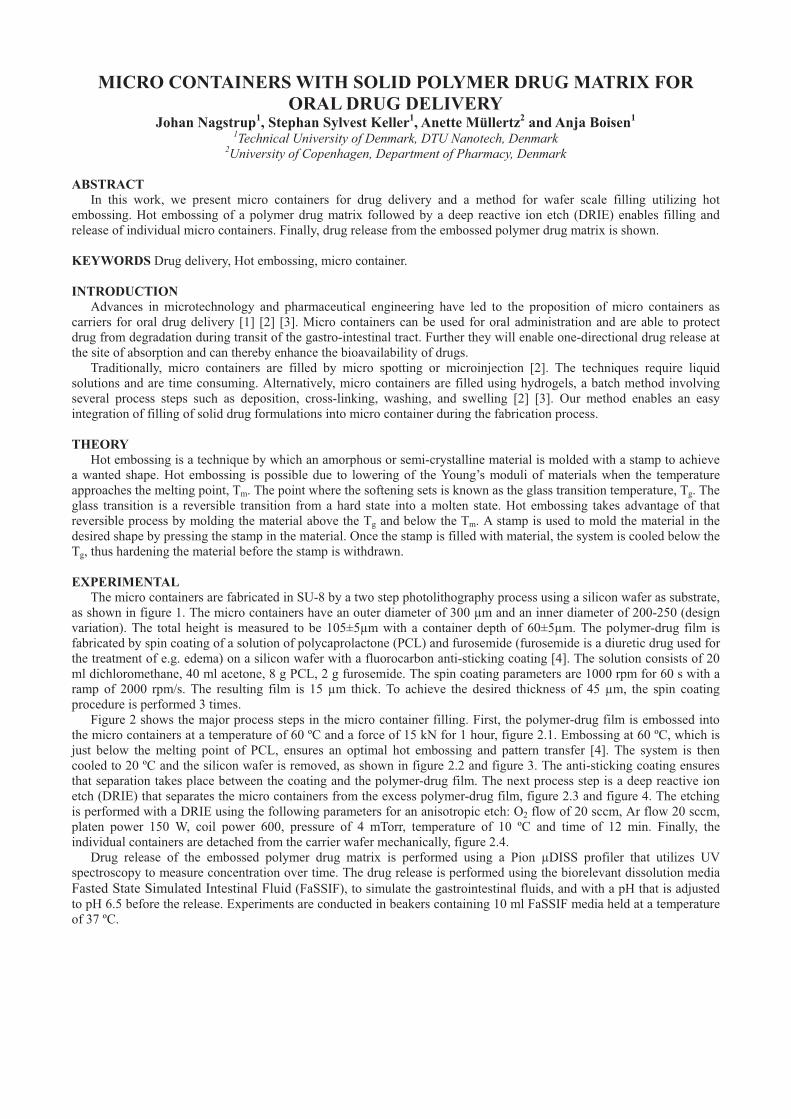
MICRO CONTAINERS WITH SOLID POLYMER DRUG MATRIX FOR ORAL DRUG DELIVERY
Johan Nagstrup1, Stephan Sylvest Keller1, Anette Müllertz2 and Anja Boisen1 1Technical University of Denmark, DTU Nanotech, Denmark
2University of Copenhagen, Department of Pharmacy, Denmark ABSTRACT
In this work, we present micro containers for drug delivery and a method for wafer scale filling utilizing hot embossing. Hot embossing of a polymer drug matrix followed by a deep reactive ion etch (DRIE) enables filling and release of individual micro containers. Finally, drug release from the embossed polymer drug matrix is shown. KEYWORDS Drug delivery, Hot embossing, micro container. INTRODUCTION
Advances in microtechnology and pharmaceutical engineering have led to the proposition of micro containers as carriers for oral drug delivery [1] [2] [3]. Micro containers can be used for oral administration and are able to protect drug from degradation during transit of the gastro-intestinal tract. Further they will enable one-directional drug release at the site of absorption and can thereby enhance the bioavailability of drugs.
Traditionally, micro containers are filled by micro spotting or microinjection [2]. The techniques require liquid solutions and are time consuming. Alternatively, micro containers are filled using hydrogels, a batch method involving several process steps such as deposition, cross-linking, washing, and swelling [2] [3]. Our method enables an easy integration of filling of solid drug formulations into micro container during the fabrication process.
THEORY
Hot embossing is a technique by which an amorphous or semi-crystalline material is molded with a stamp to achieve a wanted shape. Hot embossing is possible due to lowering of the Young’s moduli of materials when the temperature approaches the melting point, Tm. The point where the softening sets is known as the glass transition temperature, Tg. The glass transition is a reversible transition from a hard state into a molten state. Hot embossing takes advantage of that reversible process by molding the material above the Tg and below the Tm. A stamp is used to mold the material in the desired shape by pressing the stamp in the material. Once the stamp is filled with material, the system is cooled below the Tg, thus hardening the material before the stamp is withdrawn.
EXPERIMENTAL
The micro containers are fabricated in SU-8 by a two step photolithography process using a silicon wafer as substrate, as shown in figure 1. The micro containers have an outer diameter of 300 μm and an inner diameter of 200-250 (design variation). The total height is measured to be 105±5μm with a container depth of 60±5μm. The polymer-drug film is fabricated by spin coating of a solution of polycaprolactone (PCL) and furosemide (furosemide is a diuretic drug used for the treatment of e.g. edema) on a silicon wafer with a fluorocarbon anti-sticking coating [4]. The solution consists of 20 ml dichloromethane, 40 ml acetone, 8 g PCL, 2 g furosemide. The spin coating parameters are 1000 rpm for 60 s with a ramp of 2000 rpm/s. The resulting film is 15 μm thick. To achieve the desired thickness of 45 μm, the spin coating procedure is performed 3 times.
Figure 2 shows the major process steps in the micro container filling. First, the polymer-drug film is embossed into the micro containers at a temperature of 60 ºC and a force of 15 kN for 1 hour, figure 2.1. Embossing at 60 ºC, which is just below the melting point of PCL, ensures an optimal hot embossing and pattern transfer [4]. The system is then cooled to 20 ºC and the silicon wafer is removed, as shown in figure 2.2 and figure 3. The anti-sticking coating ensures that separation takes place between the coating and the polymer-drug film. The next process step is a deep reactive ion etch (DRIE) that separates the micro containers from the excess polymer-drug film, figure 2.3 and figure 4. The etching is performed with a DRIE using the following parameters for an anisotropic etch: O2 flow of 20 sccm, Ar flow 20 sccm, platen power 150 W, coil power 600, pressure of 4 mTorr, temperature of 10 ºC and time of 12 min. Finally, the individual containers are detached from the carrier wafer mechanically, figure 2.4.
Drug release of the embossed polymer drug matrix is performed using a Pion μDISS profiler that utilizes UV spectroscopy to measure concentration over time. The drug release is performed using the biorelevant dissolution media Fasted State Simulated Intestinal Fluid (FaSSIF), to simulate the gastrointestinal fluids, and with a pH that is adjusted to pH 6.5 before the release. Experiments are conducted in beakers containing 10 ml FaSSIF media held at a temperature of 37 ºC.

RESULTS & DISCUSSION
The result of the fabrication process is SU-8 micro containers filled with a film consisting of polycaprolactone and furosemide, as shown in figure 5. The method is demonstrated to work on wafer scale level with 4 inch wafers. Our method for filling containers with a drug matrix can be applied to any polymeric drug that presents the following fabrication requirements. . The Tg of the polymer drug matrix must be lower than the one of the micro container material. The embossing temperature should be in-between the Tg polymer drug matrix material and the Tg of micro container material. This ensures a reflow of the polymer drug matrix without effect on the structural stability of the micro containers. Furthermore, the embossing temperature should not exceed Tm of the components to allow separation of the embossed stack following the cooling process.
Drug release test is performed on the embossed drug matrix, as shown in figure 6 together with the release curve for crystalline furosemide powder and an amorphous spray dried furosemide powder. For the embossed polymer drug matrix more than 95% of the furosemide is released within the first 30 minutes. The release of the embossed polymer matrix shows improved drug release compared with crystalline furosemide. The release resembles the fast release seen from the amorphous furosemide. It is known that amorphous furosemide dissolves faster than crystalline [6], thus the furosemide in the embossed filmed exhibits amorphous characteristics. X-ray diffraction spectroscopy confirms the morphology and shows that the PCL furosemide films are amorphous before and after the embossing.
1
2
3
4
1
2
3
4
Figure 3. Wafer with micro containers after polymer drug matrix embossing.
Figure 4. SEM image showing polymer drug matrix embossed into micro containers and etched by DRIE.
Figure 1. SEM image showing micro containers fabricated in SU-8 by a two step photolithography process
Figure 2. Micro container filling process. 1-2 Embossing polymer drug matrix into containers and removing the carrier wafer. 3 Etching of polymer drug matrix. 4 Mechanical release of containers
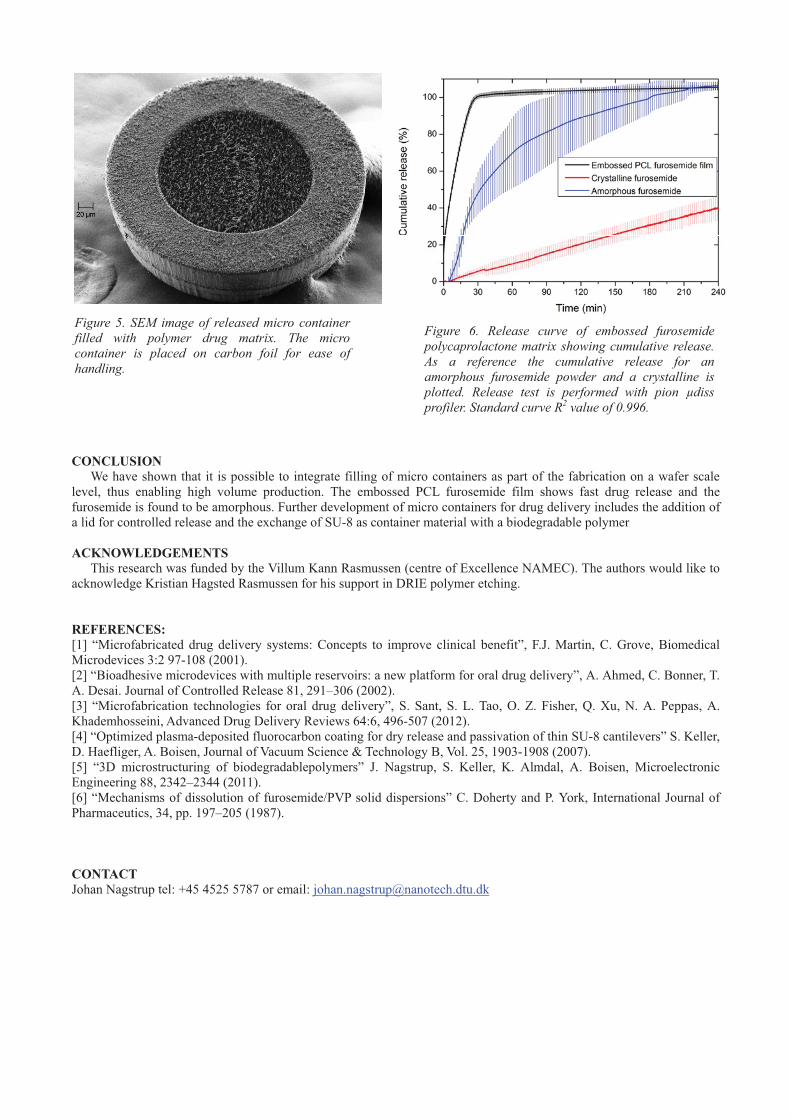
CONCLUSION
We have shown that it is possible to integrate filling of micro containers as part of the fabrication on a wafer scale level, thus enabling high volume production. The embossed PCL furosemide film shows fast drug release and the furosemide is found to be amorphous. Further development of micro containers for drug delivery includes the addition of a lid for controlled release and the exchange of SU-8 as container material with a biodegradable polymer
ACKNOWLEDGEMENTS
This research was funded by the Villum Kann Rasmussen (centre of Excellence NAMEC). The authors would like to acknowledge Kristian Hagsted Rasmussen for his support in DRIE polymer etching.
REFERENCES: [1] “Microfabricated drug delivery systems: Concepts to improve clinical benefit”, F.J. Martin, C. Grove, Biomedical Microdevices 3:2 97-108 (2001). [2] “Bioadhesive microdevices with multiple reservoirs: a new platform for oral drug delivery”, A. Ahmed, C. Bonner, T. A. Desai. Journal of Controlled Release 81, 291–306 (2002). [3] “Microfabrication technologies for oral drug delivery”, S. Sant, S. L. Tao, O. Z. Fisher, Q. Xu, N. A. Peppas, A. Khademhosseini, Advanced Drug Delivery Reviews 64:6, 496-507 (2012). [4] “Optimized plasma-deposited fluorocarbon coating for dry release and passivation of thin SU-8 cantilevers” S. Keller, D. Haefliger, A. Boisen, Journal of Vacuum Science & Technology B, Vol. 25, 1903-1908 (2007). [5] “3D microstructuring of biodegradablepolymers” J. Nagstrup, S. Keller, K. Almdal, A. Boisen, Microelectronic Engineering 88, 2342–2344 (2011). [6] “Mechanisms of dissolution of furosemide/PVP solid dispersions” C. Doherty and P. York, International Journal of Pharmaceutics, 34, pp. 197–205 (1987). CONTACT Johan Nagstrup tel: +45 4525 5787 or email: [email protected]
Figure 5. SEM image of released micro container filled with polymer drug matrix. The micro container is placed on carbon foil for ease of handling.
Figure 6. Release curve of embossed furosemide polycaprolactone matrix showing cumulative release. As a reference the cumulative release for an amorphous furosemide powder and a crystalline is plotted. Release test is performed with pion μdiss profiler. Standard curve R2 value of 0.996.

Appendix B
99
3D microstructuring of biodegradable polymers
Johan Nagstrup ⇑, Stephan Keller, Kristoffer Almdal, Anja BoisenDepartment of Micro- and Nanotechnology, Technical University of Denmark, DTU Nanotech, Building 345 East, DK-2800 Kongens Lyngby, Denmark
a r t i c l e i n f o
Article history:Available online 13 December 2010
Keywords:Biodegradable polymersEmbossingMicrostructuresSpin coatingThick films
a b s t r a c t
Biopolymer films with a thickness of 100 lm are prepared using spin coating technique with solutionsconsisting of 25 wt.% polycaprolactone or poly-L-lactide in dichloromethane. SU-8 stamps are fabricatedusing three photolithography steps. The stamps are used to emboss 3Dmicrostructures in the biopolymerfilms. It is found that the best pattern transfer for the polycaprolactone films is achieved just below themelting point at 60 �C. For the poly-L-lactide films the best pattern transfer is achieved at 120 �C.
� 2010 Elsevier B.V. All rights reserved.
1. Introduction
Combining MEMS and NEMS with pharmaceutical research hasled to propositions of a number of new medical solutions [1].Examples of these are the use of micro tablets for enhanced drugdelivery [2], and the fabrication of biodegradable polymer tubesfor tissue engineering [3]. The next step in developing newmedicalsolutions is to replace classical micro fabrication materials such assilicon and SU-8 with biodegradable polymers. In order to success-fully do this, methods for fabricating 3D microstructures inbiodegradable polymers need to be developed.
In this work, we present 3Dmicrostructures fabricated in biode-gradable polymer films with a thickness of 105 lm. The polymermicrostructures are fabricated using hot embossing. The fabricatedstructures have a shape like a well and could be used as drugcontainers following the concept presented by Ainslie and co-workers [2]. For the fabrication of the micro wells, thick films ofbiodegradable polymers in both polycaprolactone (PCL) and poly-L-lactide (PLLA) are fabricated. Both PCL and PLLA are approvedby the food and drug administration (FDA) which makes themobvious candidates for biomedical applications. PCL and PLLA arenew materials within the field of micro fabrication and previouswork mainly revolves around mechanical property tests [4,5], deg-radation studies [6–8] and tissue engineering [3,7,8]. Food scienceis another area where biopolymers films are of interest [9].
2. General method
The technique used to microstructure PLLA and PCL films is hotembossing with a stack as shown in Fig. 1. It consists of a biopoly-
mer film on a silicon wafer and a SU-8 stamp on a silicon wafer.The stamp is pressed into the preheated substrate. Subsequently,substrate and stamp are cooled before separation.
3. Preparation of biopolymer films
For biopolymer thick film deposition by spin coating, PCLgranulate from Sigma–Aldrich (Mn/(kg/mol) = 70–90) and PLLAgranulate from Nature Works LLC, 2002D are used. The biopolymergranulate is dissolved in dichloromethane (DCM) (25 wt.% poly-mer) facilitated by heating to 50 �C. The polymer solution ismanually dispensed onto a silicon wafer followed by accelerationto the final spin-speed which is maintained for 50 s. The PCL filmsare baked on a hotplate (90 �C; 1 h) to remove the solvent resultingin a flat and even film without bubbles. The PLLA films aredegassed for 2 h before baking (220 �C; 1 h) to avoid bubbleformation. 220 �C is well above the melting point of PLLA which al-low the polymer to reflow and to smoothen the surface.
The spin curves for both PCL and PLLA solutions are shown inFig. 2. Polymer films are characterized by a profilometer and filmthicknesses of 40–110 lm are achieved. For the embossing exper-iments polymer films with a thickness of 100–110 lm are used.
4. Stamp fabrication
The stamp for the hot embossing is fabricated in SU-8. Thefabrication of the stamp is realized using a three step photolithog-raphy process. First, a 2 lm thin SU-8 adhesion layer is spin coatedand flood exposed with 250 mJ/cm2. The stamp structures arethen defined with two subsequent thick SU-8 layers. A 40 lmSU-8 layer is spincoated and softbaked for 2 h at 50 �C. The SU-8is exposed with 2 � 250 mJ/cm2 with a 30 s wait time andpost-exposure-baked for 6 h at 50 �C. A second 65 lm thick SU-8
0167-9317/$ - see front matter � 2010 Elsevier B.V. All rights reserved.doi:10.1016/j.mee.2010.12.014
⇑ Corresponding author.E-mail address: [email protected] (J. Nagstrup).
Microelectronic Engineering 88 (2011) 2342–2344
Contents lists available at ScienceDirect
Microelectronic Engineering
journal homepage: www.elsevier .com/locate /mee
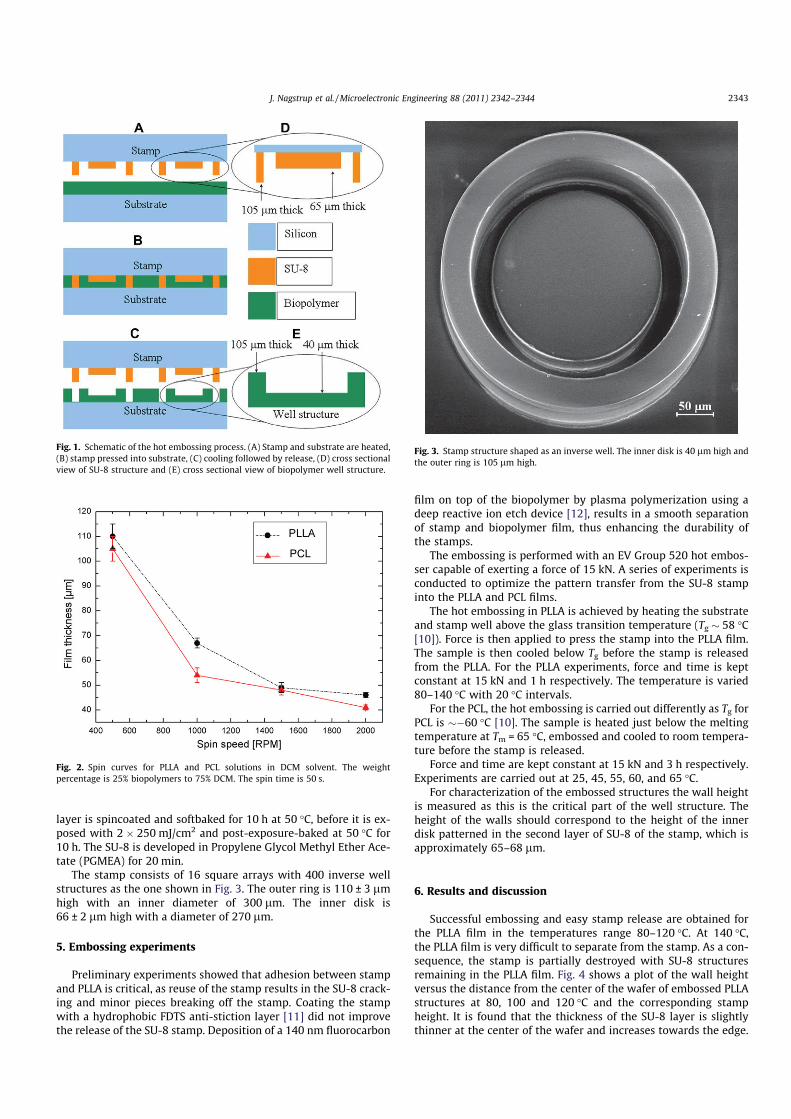
layer is spincoated and softbaked for 10 h at 50 �C, before it is ex-posed with 2 � 250 mJ/cm2 and post-exposure-baked at 50 �C for10 h. The SU-8 is developed in Propylene Glycol Methyl Ether Ace-tate (PGMEA) for 20 min.
The stamp consists of 16 square arrays with 400 inverse wellstructures as the one shown in Fig. 3. The outer ring is 110 ± 3 lmhigh with an inner diameter of 300 lm. The inner disk is66 ± 2 lm high with a diameter of 270 lm.
5. Embossing experiments
Preliminary experiments showed that adhesion between stampand PLLA is critical, as reuse of the stamp results in the SU-8 crack-ing and minor pieces breaking off the stamp. Coating the stampwith a hydrophobic FDTS anti-stiction layer [11] did not improvethe release of the SU-8 stamp. Deposition of a 140 nm fluorocarbon
film on top of the biopolymer by plasma polymerization using adeep reactive ion etch device [12], results in a smooth separationof stamp and biopolymer film, thus enhancing the durability ofthe stamps.
The embossing is performed with an EV Group 520 hot embos-ser capable of exerting a force of 15 kN. A series of experiments isconducted to optimize the pattern transfer from the SU-8 stampinto the PLLA and PCL films.
The hot embossing in PLLA is achieved by heating the substrateand stamp well above the glass transition temperature (Tg � 58 �C[10]). Force is then applied to press the stamp into the PLLA film.The sample is then cooled below Tg before the stamp is releasedfrom the PLLA. For the PLLA experiments, force and time is keptconstant at 15 kN and 1 h respectively. The temperature is varied80–140 �C with 20 �C intervals.
For the PCL, the hot embossing is carried out differently as Tg forPCL is ��60 �C [10]. The sample is heated just below the meltingtemperature at Tm = 65 �C, embossed and cooled to room tempera-ture before the stamp is released.
Force and time are kept constant at 15 kN and 3 h respectively.Experiments are carried out at 25, 45, 55, 60, and 65 �C.
For characterization of the embossed structures the wall heightis measured as this is the critical part of the well structure. Theheight of the walls should correspond to the height of the innerdisk patterned in the second layer of SU-8 of the stamp, which isapproximately 65–68 lm.
6. Results and discussion
Successful embossing and easy stamp release are obtained forthe PLLA film in the temperatures range 80–120 �C. At 140 �C,the PLLA film is very difficult to separate from the stamp. As a con-sequence, the stamp is partially destroyed with SU-8 structuresremaining in the PLLA film. Fig. 4 shows a plot of the wall heightversus the distance from the center of the wafer of embossed PLLAstructures at 80, 100 and 120 �C and the corresponding stampheight. It is found that the thickness of the SU-8 layer is slightlythinner at the center of the wafer and increases towards the edge.
Fig. 1. Schematic of the hot embossing process. (A) Stamp and substrate are heated,(B) stamp pressed into substrate, (C) cooling followed by release, (D) cross sectionalview of SU-8 structure and (E) cross sectional view of biopolymer well structure.
Fig. 2. Spin curves for PLLA and PCL solutions in DCM solvent. The weightpercentage is 25% biopolymers to 75% DCM. The spin time is 50 s.
Fig. 3. Stamp structure shaped as an inverse well. The inner disk is 40 lm high andthe outer ring is 105 lm high.
J. Nagstrup et al. /Microelectronic Engineering 88 (2011) 2342–2344 2343
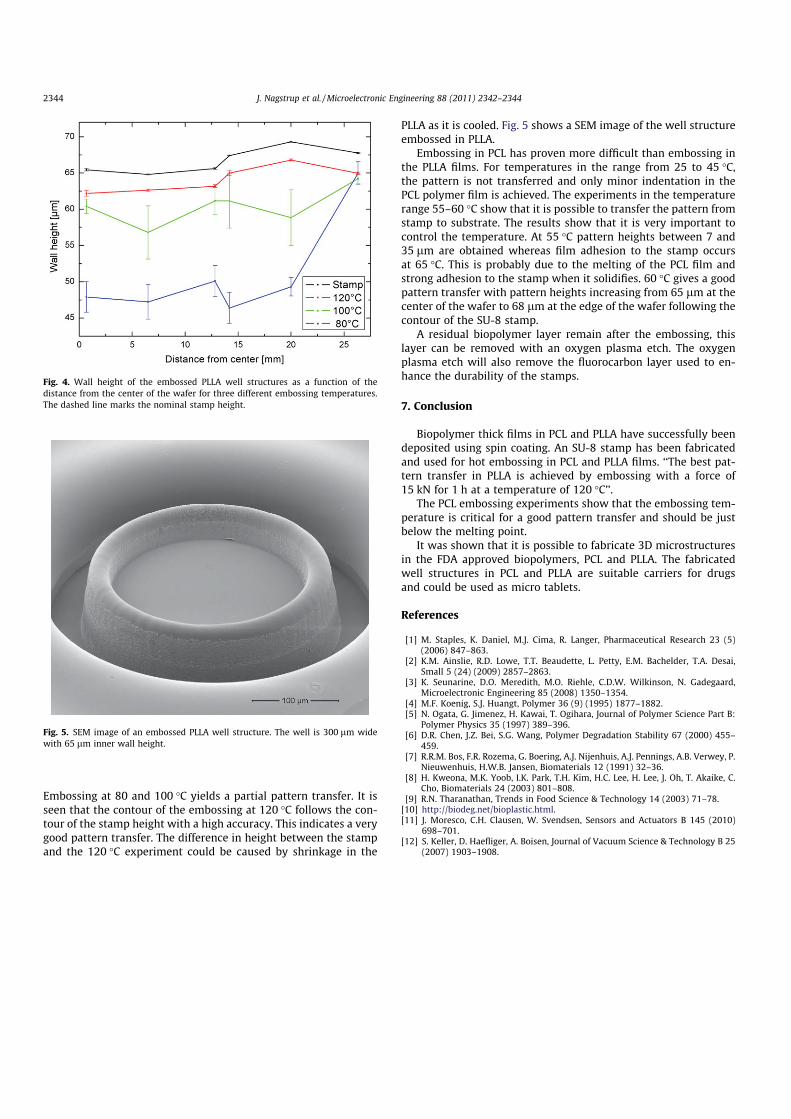
Embossing at 80 and 100 �C yields a partial pattern transfer. It isseen that the contour of the embossing at 120 �C follows the con-tour of the stamp height with a high accuracy. This indicates a verygood pattern transfer. The difference in height between the stampand the 120 �C experiment could be caused by shrinkage in the
PLLA as it is cooled. Fig. 5 shows a SEM image of the well structureembossed in PLLA.
Embossing in PCL has proven more difficult than embossing inthe PLLA films. For temperatures in the range from 25 to 45 �C,the pattern is not transferred and only minor indentation in thePCL polymer film is achieved. The experiments in the temperaturerange 55–60 �C show that it is possible to transfer the pattern fromstamp to substrate. The results show that it is very important tocontrol the temperature. At 55 �C pattern heights between 7 and35 lm are obtained whereas film adhesion to the stamp occursat 65 �C. This is probably due to the melting of the PCL film andstrong adhesion to the stamp when it solidifies. 60 �C gives a goodpattern transfer with pattern heights increasing from 65 lm at thecenter of the wafer to 68 lm at the edge of the wafer following thecontour of the SU-8 stamp.
A residual biopolymer layer remain after the embossing, thislayer can be removed with an oxygen plasma etch. The oxygenplasma etch will also remove the fluorocarbon layer used to en-hance the durability of the stamps.
7. Conclusion
Biopolymer thick films in PCL and PLLA have successfully beendeposited using spin coating. An SU-8 stamp has been fabricatedand used for hot embossing in PCL and PLLA films. ‘‘The best pat-tern transfer in PLLA is achieved by embossing with a force of15 kN for 1 h at a temperature of 120 �C’’.
The PCL embossing experiments show that the embossing tem-perature is critical for a good pattern transfer and should be justbelow the melting point.
It was shown that it is possible to fabricate 3D microstructuresin the FDA approved biopolymers, PCL and PLLA. The fabricatedwell structures in PCL and PLLA are suitable carriers for drugsand could be used as micro tablets.
References
[1] M. Staples, K. Daniel, M.J. Cima, R. Langer, Pharmaceutical Research 23 (5)(2006) 847–863.
[2] K.M. Ainslie, R.D. Lowe, T.T. Beaudette, L. Petty, E.M. Bachelder, T.A. Desai,Small 5 (24) (2009) 2857–2863.
[3] K. Seunarine, D.O. Meredith, M.O. Riehle, C.D.W. Wilkinson, N. Gadegaard,Microelectronic Engineering 85 (2008) 1350–1354.
[4] M.F. Koenig, S.J. Huangt, Polymer 36 (9) (1995) 1877–1882.[5] N. Ogata, G. Jimenez, H. Kawai, T. Ogihara, Journal of Polymer Science Part B:
Polymer Physics 35 (1997) 389–396.[6] D.R. Chen, J.Z. Bei, S.G. Wang, Polymer Degradation Stability 67 (2000) 455–
459.[7] R.R.M. Bos, F.R. Rozema, G. Boering, A.J. Nijenhuis, A.J. Pennings, A.B. Verwey, P.
Nieuwenhuis, H.W.B. Jansen, Biomaterials 12 (1991) 32–36.[8] H. Kweona, M.K. Yoob, I.K. Park, T.H. Kim, H.C. Lee, H. Lee, J. Oh, T. Akaike, C.
Cho, Biomaterials 24 (2003) 801–808.[9] R.N. Tharanathan, Trends in Food Science & Technology 14 (2003) 71–78.[10] http://biodeg.net/bioplastic.html.[11] J. Moresco, C.H. Clausen, W. Svendsen, Sensors and Actuators B 145 (2010)
698–701.[12] S. Keller, D. Haefliger, A. Boisen, Journal of Vacuum Science & Technology B 25
(2007) 1903–1908.
Fig. 4. Wall height of the embossed PLLA well structures as a function of thedistance from the center of the wafer for three different embossing temperatures.The dashed line marks the nominal stamp height.
Fig. 5. SEM image of an embossed PLLA well structure. The well is 300 lm widewith 65 lm inner wall height.
2344 J. Nagstrup et al. /Microelectronic Engineering 88 (2011) 2342–2344
Appendix C
Table of Polymers
103
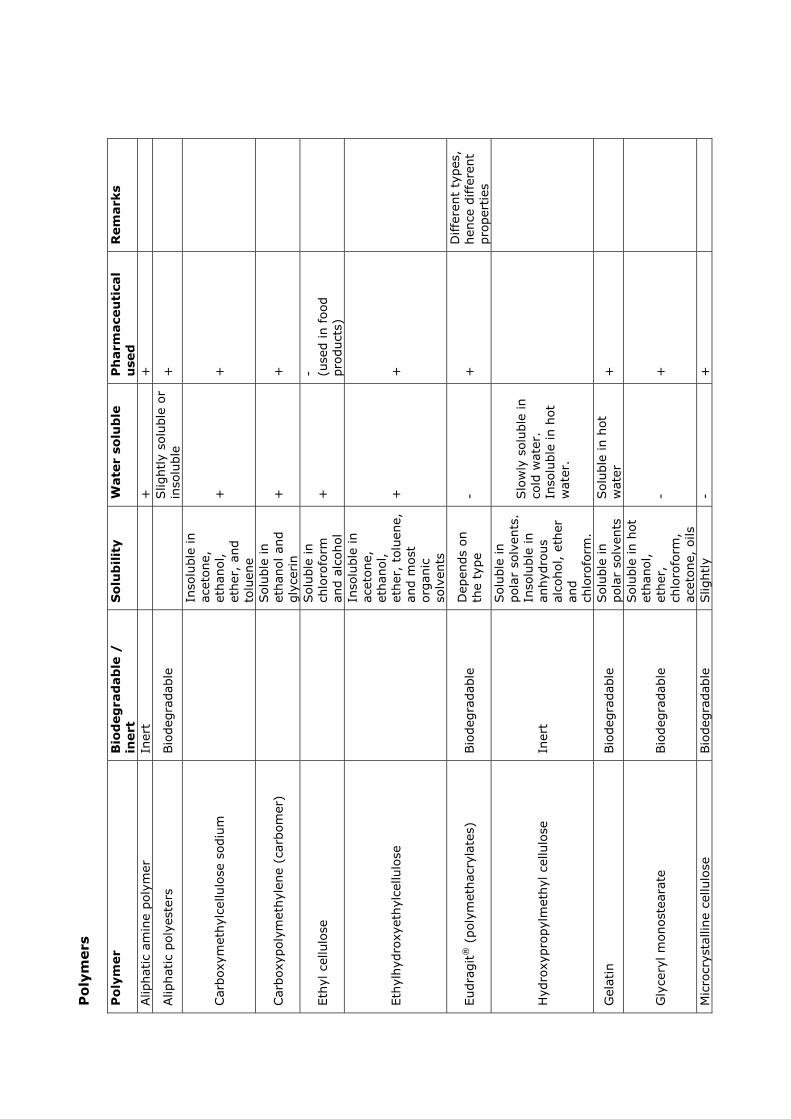
Pol
ymer
s
Pol
ymer
Bio
deg
rad
able
/
iner
tS
olu
bili
tyW
ater
sol
ub
leP
har
mac
euti
cal
use
dR
emar
ks
Alip
hatic
am
ine
poly
mer
Iner
t+
+
Alip
hatic
pol
yest
ers
Bio
degr
adab
leSlig
htly
sol
uble
or
inso
lubl
e +
Car
boxy
met
hylc
ellu
lose
sod
ium
Inso
lubl
e in
ac
eton
e,
etha
nol,
ethe
r, a
nd
tolu
ene
++
Car
boxy
poly
met
hyle
ne (
carb
omer
)Sol
uble
in
etha
nol a
nd
glyc
erin
++
Ethy
l cel
lulo
seSol
uble
in
chlo
rofo
rm
and
alco
hol
+- (u
sed
in foo
d pr
oduc
ts)
Ethy
lhyd
roxy
ethy
lcel
lulo
se
Inso
lubl
e in
ac
eton
e,
etha
nol,
ethe
r, t
olue
ne,
and
mos
t or
gani
c so
lven
ts
++
Eudr
agit®
Bio
degr
adab
le
(pol
ymet
hacr
ylat
es)
Dep
ends
on
the
type
-+
Diff
eren
t ty
pes,
he
nce
differ
ent
pr
oper
ties
Hyd
roxy
prop
ylm
ethy
l cel
lulo
seIn
ert
Sol
uble
in
pola
r so
lven
ts.
Inso
lubl
e in
an
hydr
ous
alco
hol,
ethe
ran
d ch
loro
form
.
Slo
wly
sol
uble
in
cold
wat
er.
Inso
lubl
e in
hot
w
ater
.
Gel
atin
Bio
degr
adab
leSol
uble
in
pola
r so
lven
tsSol
uble
in h
ot
wat
er+
Gly
cery
l mon
oste
arat
eBio
degr
adab
le
Sol
uble
in h
ot
etha
nol,
ethe
r,
chlo
rofo
rm,
acet
one,
oils
-+
Mic
rocr
ysta
lline
cel
lulo
seBio
degr
adab
leSlig
htly
-
+
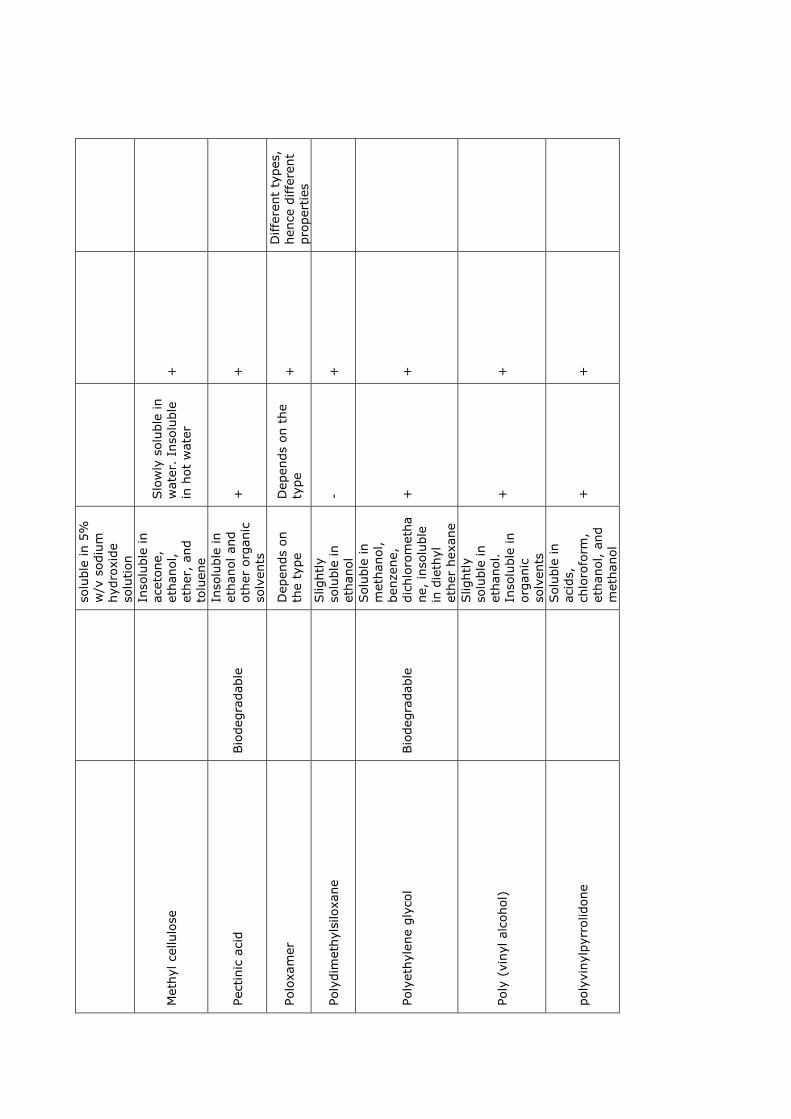
solu
ble
in 5
%
w/v
sod
ium
hy
drox
ide
solu
tion
Met
hyl c
ellu
lose
Inso
lubl
e in
ac
eton
e,
etha
nol,
ethe
r, a
nd
tolu
ene
Slo
wly
sol
uble
in
wat
er.
Inso
lubl
e in
hot
wat
er+
Pect
inic
aci
dBio
degr
adab
le
Inso
lubl
e in
et
hano
l and
ot
her
orga
nic
solv
ents
++
Polo
xam
erD
epen
ds o
n th
e ty
peD
epen
ds o
n th
e ty
pe+
Diff
eren
t ty
pes,
he
nce
differ
ent
pr
oper
ties
Poly
dim
ethy
lsilo
xane
Slig
htly
so
lubl
e in
et
hano
l-
+
Poly
ethy
lene
gly
col
Bio
degr
adab
le
Sol
uble
in
met
hano
l, be
nzen
e,
dich
loro
met
hane
, in
solu
ble
in d
ieth
yl
ethe
r he
xane
++
Poly
(vi
nyl a
lcoh
ol)
Slig
htly
so
lubl
e in
et
hano
l. In
solu
ble
in
orga
nic
solv
ents
++
poly
viny
lpyr
rolid
one
Sol
uble
in
acid
s,
chlo
rofo
rm,
etha
nol,
and
met
hano
l
++

106 APPENDIX C. TABLE OF POLYMERS
Appendix D
PLLA datasheet
107
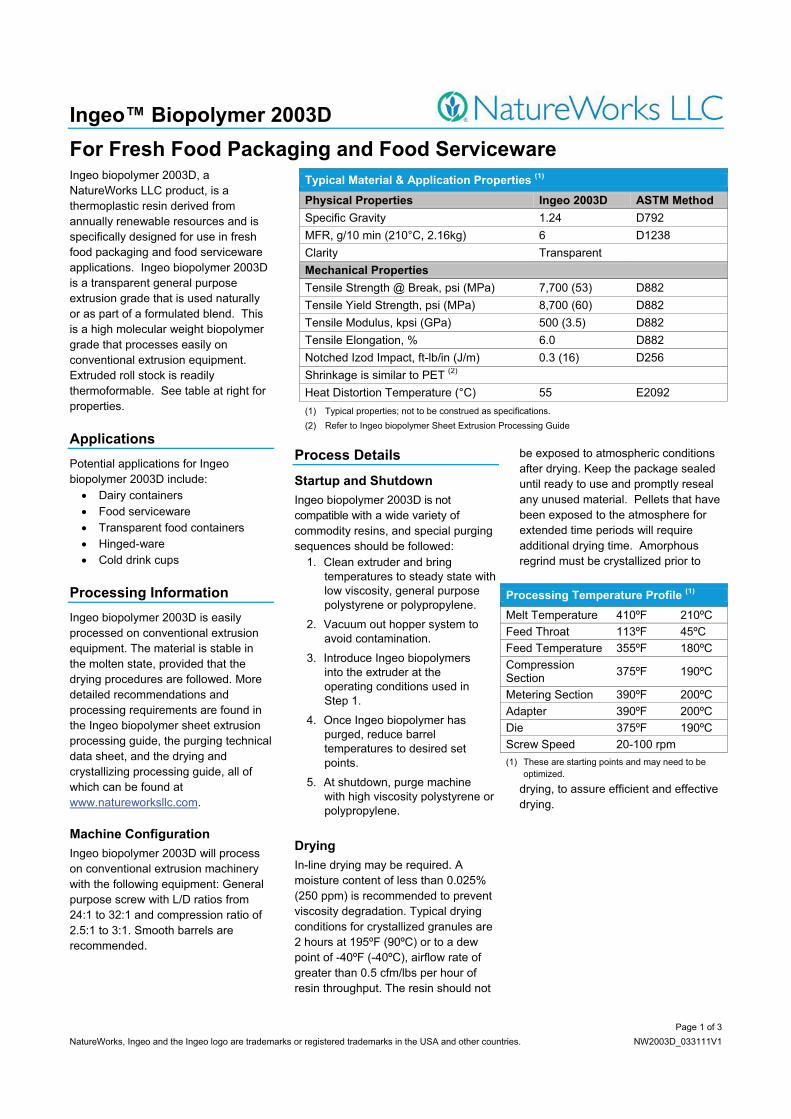
Ingeo™ Biopolymer 2003D
Page 1 of 3NatureWorks, Ingeo and the Ingeo logo are trademarks or registered trademarks in the USA and other countries. NW2003D_033111V1
For Fresh Food Packaging and Food ServicewareIngeo biopolymer 2003D, a NatureWorks LLC product, is a thermoplastic resin derived from annually renewable resources and is specifically designed for use in fresh food packaging and food servicewareapplications. Ingeo biopolymer 2003D is a transparent general purpose extrusion grade that is used naturally or as part of a formulated blend. This is a high molecular weight biopolymer grade that processes easily on conventional extrusion equipment. Extruded roll stock is readily thermoformable. See table at right for properties.
ApplicationsPotential applications for Ingeobiopolymer 2003D include:� Dairy containers� Food serviceware� Transparent food containers� Hinged-ware� Cold drink cups
Processing InformationIngeo biopolymer 2003D is easily processed on conventional extrusion equipment. The material is stable in the molten state, provided that the drying procedures are followed. More detailed recommendations and processing requirements are found in the Ingeo biopolymer sheet extrusion processing guide, the purging technical data sheet, and the drying and crystallizing processing guide, all of which can be found at www.natureworksllc.com.
Machine ConfigurationIngeo biopolymer 2003D will process on conventional extrusion machinery with the following equipment: General purpose screw with L/D ratios from 24:1 to 32:1 and compression ratio of 2.5:1 to 3:1. Smooth barrels are recommended.
Process Details
Startup and ShutdownIngeo biopolymer 2003D is not compatible with a wide variety of commodity resins, and special purging sequences should be followed:
1. Clean extruder and bring temperatures to steady state with low viscosity, general purpose polystyrene or polypropylene.
2. Vacuum out hopper system to avoid contamination.
3. Introduce Ingeo biopolymersinto the extruder at the operating conditions used in Step 1.
4. Once Ingeo biopolymer has purged, reduce barrel temperatures to desired set points.
5. At shutdown, purge machine with high viscosity polystyrene or polypropylene.
DryingIn-line drying may be required. Amoisture content of less than 0.025% (250 ppm) is recommended to prevent viscosity degradation. Typical drying conditions for crystallized granules are 2 hours at 195ºF (90ºC) or to a dew point of -40ºF (-40ºC), airflow rate of greater than 0.5 cfm/lbs per hour of resin throughput. The resin should not
be exposed to atmospheric conditions after drying. Keep the package sealed until ready to use and promptly reseal any unused material. Pellets that have been exposed to the atmosphere for extended time periods will require additional drying time. Amorphous regrind must be crystallized prior to
drying, to assure efficient and effective drying.
Typical Material & Application Properties (1)
Physical Properties Ingeo 2003D ASTM MethodSpecific Gravity 1.24 D792MFR, g/10 min (210°C, 2.16kg) 6 D1238Clarity TransparentMechanical PropertiesTensile Strength @ Break, psi (MPa) 7,700 (53) D882Tensile Yield Strength, psi (MPa) 8,700 (60) D882Tensile Modulus, kpsi (GPa) 500 (3.5) D882Tensile Elongation, % 6.0 D882Notched Izod Impact, ft-lb/in (J/m) 0.3 (16) D256Shrinkage is similar to PET (2)
Heat Distortion Temperature (°C) 55 E2092(1) Typical properties; not to be construed as specifications.(2) Refer to Ingeo biopolymer Sheet Extrusion Processing Guide
Processing Temperature Profile (1)
Melt Temperature 410ºF 210ºCFeed Throat 113ºF 45ºCFeed Temperature 355ºF 180ºCCompressionSection 375ºF 190ºC
Metering Section 390ºF 200ºCAdapter 390ºF 200ºCDie 375ºF 190ºCScrew Speed 20-100 rpm(1) These are starting points and may need to be
optimized.
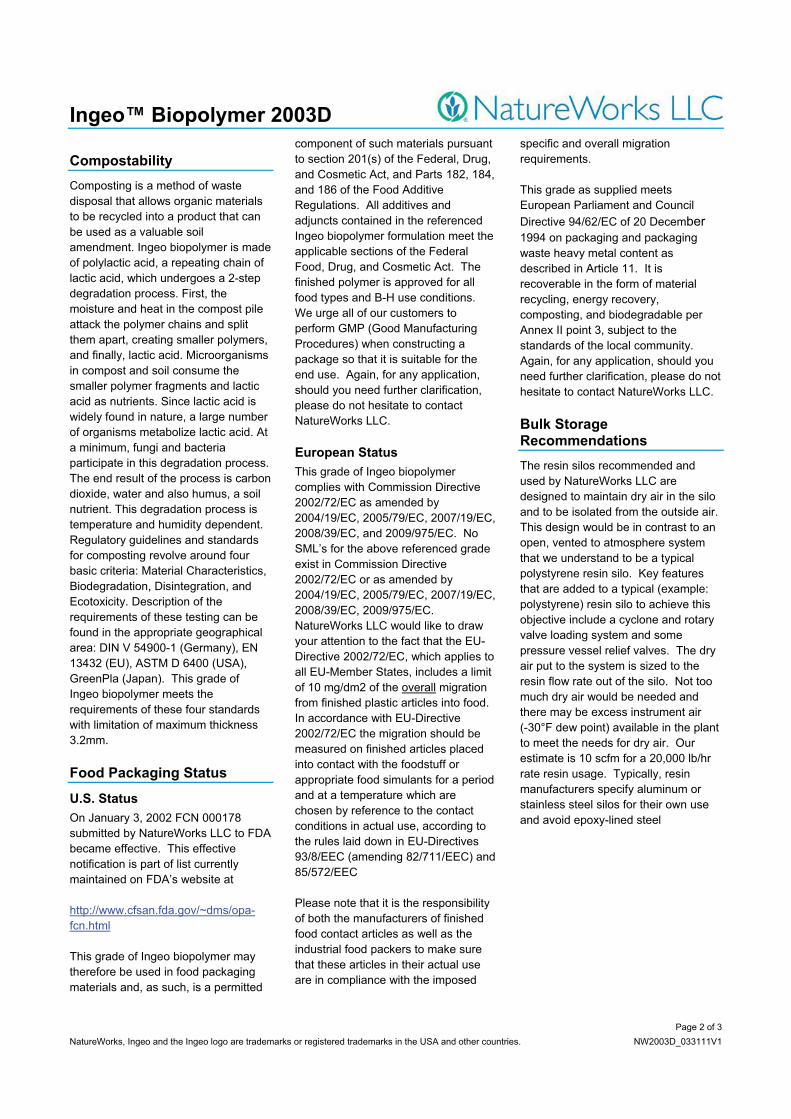
Ingeo™ Biopolymer 2003D
Page 2 of 3NatureWorks, Ingeo and the Ingeo logo are trademarks or registered trademarks in the USA and other countries. NW2003D_033111V1
CompostabilityComposting is a method of waste disposal that allows organic materials to be recycled into a product that can be used as a valuable soil amendment. Ingeo biopolymer is made of polylactic acid, a repeating chain of lactic acid, which undergoes a 2-step degradation process. First, the moisture and heat in the compost pile attack the polymer chains and split them apart, creating smaller polymers, and finally, lactic acid. Microorganisms in compost and soil consume the smaller polymer fragments and lactic acid as nutrients. Since lactic acid is widely found in nature, a large number of organisms metabolize lactic acid. At a minimum, fungi and bacteria participate in this degradation process.The end result of the process is carbon dioxide, water and also humus, a soil nutrient. This degradation process is temperature and humidity dependent. Regulatory guidelines and standards for composting revolve around four basic criteria: Material Characteristics, Biodegradation, Disintegration, and Ecotoxicity. Description of the requirements of these testing can be found in the appropriate geographical area: DIN V 54900-1 (Germany), EN 13432 (EU), ASTM D 6400 (USA), GreenPla (Japan). This grade of Ingeo biopolymer meets therequirements of these four standards with limitation of maximum thickness 3.2mm.
Food Packaging Status
U.S. StatusOn January 3, 2002 FCN 000178 submitted by NatureWorks LLC to FDA became effective. This effective notification is part of list currently maintained on FDA’s website at
http://www.cfsan.fda.gov/~dms/opa-fcn.html
This grade of Ingeo biopolymer may therefore be used in food packaging materials and, as such, is a permitted
component of such materials pursuant to section 201(s) of the Federal, Drug, and Cosmetic Act, and Parts 182, 184, and 186 of the Food Additive Regulations. All additives and adjuncts contained in the referenced Ingeo biopolymer formulation meet the applicable sections of the Federal Food, Drug, and Cosmetic Act. The finished polymer is approved for all food types and B-H use conditions. We urge all of our customers to perform GMP (Good Manufacturing Procedures) when constructing a package so that it is suitable for the end use. Again, for any application, should you need further clarification, please do not hesitate to contact NatureWorks LLC.
European StatusThis grade of Ingeo biopolymer complies with Commission Directive 2002/72/EC as amended by 2004/19/EC, 2005/79/EC, 2007/19/EC, 2008/39/EC, and 2009/975/EC. No SML’s for the above referenced grade exist in Commission Directive 2002/72/EC or as amended by 2004/19/EC, 2005/79/EC, 2007/19/EC, 2008/39/EC, 2009/975/EC.NatureWorks LLC would like to draw your attention to the fact that the EU-Directive 2002/72/EC, which applies to all EU-Member States, includes a limit of 10 mg/dm2 of the overall migration from finished plastic articles into food. In accordance with EU-Directive 2002/72/EC the migration should be measured on finished articles placed into contact with the foodstuff or appropriate food simulants for a period and at a temperature which are chosen by reference to the contact conditions in actual use, according to the rules laid down in EU-Directives 93/8/EEC (amending 82/711/EEC) and 85/572/EEC
Please note that it is the responsibility of both the manufacturers of finished food contact articles as well as the industrial food packers to make sure that these articles in their actual use are in compliance with the imposed
specific and overall migration requirements.
This grade as supplied meets European Parliament and Council Directive 94/62/EC of 20 December 1994 on packaging and packaging waste heavy metal content as described in Article 11. It is recoverable in the form of material recycling, energy recovery, composting, and biodegradable per Annex II point 3, subject to the standards of the local community. Again, for any application, should you need further clarification, please do not hesitate to contact NatureWorks LLC.
Bulk StorageRecommendationsThe resin silos recommended and used by NatureWorks LLC are designed to maintain dry air in the silo and to be isolated from the outside air. This design would be in contrast to an open, vented to atmosphere system that we understand to be a typical polystyrene resin silo. Key features that are added to a typical (example: polystyrene) resin silo to achieve this objective include a cyclone and rotary valve loading system and some pressure vessel relief valves. The dry air put to the system is sized to the resin flow rate out of the silo. Not too much dry air would be needed and there may be excess instrument air (-30°F dew point) available in the plant to meet the needs for dry air. Our estimate is 10 scfm for a 20,000 lb/hr rate resin usage. Typically, resin manufacturers specify aluminum or stainless steel silos for their own use and avoid epoxy-lined steel
Ingeo™ Biopolymer 2003D
Page 3 of 3NatureWorks, Ingeo and the Ingeo logo are trademarks or registered trademarks in the USA and other countries. NW2003D_033111V1
Safety and Handling ConsiderationsMaterial Safety Data (MSD) sheets for Ingeo biopolymers are available from NatureWorks LLC. MSD sheets areprovided to help customers satisfy their own handling, safety, and disposal needs, and those that may be required by locally applicable health and safety regulations, such as OSHA (U.S.A.), MAK (Germany), or WHMIS (Canada). MSD sheets are updated regularly; therefore, please request and review the most current MSD sheets before handling or using any product.
The following comments apply only to Ingeobiopolymers; additives and processing aids used in fabrication and other materials used in finishing steps have their own safe-use profile and must be investigated separately.
Hazards and Handling PrecautionsIngeo biopolymers have a very low degree of toxicity and, under normal conditions of use, should pose no unusual problems from incidental ingestion, or eye and skin contact. However, caution is advised when handling, storing, using, or disposing of these resins, and good housekeeping and controlling of dusts are necessary for safe handling of product. Workers should be protected from the possibility of contact with molten resin during fabrication. Handling and fabrication of resins can result in the generation of vapors and dusts that may cause irritation to eyes and the upper respiratory tract. In dusty atmospheres, use an approved dust respirator. Pellets or beads may present a slipping hazard. Good general ventilation of the polymer processing area is recommended. At temperatures exceeding the polymer melt temperature (typically 170ºC), polymer can release fumes, which may contain fragments of the polymer, creating a potential to irritate eyes and mucous membranes. Good general ventilation should be sufficient for most conditions.
Local exhaust ventilation is recom-mended for melt operations. Use safety glasses if there is a potential for exposure to particles which could cause mechanical injury to the eye. If vapor exposure causes eye discomfort, use a full-face respirator. No other precautions other than clean, body-covering clothing should be needed for handling Ingeo biopolymers. Use gloves with insulation for thermal protection when exposure to the melt is localized.
CombustibilityIngeo biopolymers will burn. Clear to white smoke is produced when product burns. Toxic fumes are released under conditions of incomplete combustion. Do not permit dust to accumulate. Dust layers can be ignited by spontaneous combustion or other ignition sources. When suspended in air, dust can pose an explosion hazard. Firefighters should wear positive-pressure, self-contained breathing apparatuses and full protective equipment. Water or water fog is the preferred extinguishing medium. Foam, alcohol-resistant foam, carbon dioxide or dry chemicals may also be used. Soak thoroughly with water to cool and prevent re-ignition.
DisposalDO NOT DUMP INTO ANY SEWERS, ON THE GROUND, OR INTO ANY BODY OF WATER. For unused or uncontaminated material, the preferred options include recycling into the process or sending to an industrial composting facility, if available; otherwise, send to an incinerator or other thermal destruction device. For used or contaminated material, the disposal options remain the same, although additional evaluation is required. (For example, in the U.S.A., see 40 CFR, Part 261, “Identification and Listing of Hazardous Waste.”) All disposal methods must be in compliance with Federal, State/Provincial, and local laws and regulations.
Environmental ConcernsGenerally speaking, lost pellets are not a problem in the environment except under unusual circumstances when they enter the marine environment. They are benign in terms of their physical environmental impact, but if ingested by waterfowl or aquatic life, they may mechanically causeadverse effects. Spills should be minimized, and they should be cleaned up when they happen. Plastics should not be discarded into the ocean or any other body of water.
Product StewardshipNatureWorks LLC has a fundamental duty to all those that make and use our products, and for the environment in which we live. This duty is the basis for our Product Stewardship philosophy, by which we assess the health and environmental information on our products and their intended use, then take appropriate steps to protect the environment and the health of our employees and the public.
Customer NoticeNatureWorks LLC encourages its customers and potential users of its products to review their applications for such products from the standpoint of human health and environmental quality. To help ensure our products are not used in ways for which they were not intended or tested, our personnel will assist customers in dealing with ecological and product safety considerations. Your sales representative can arrange the proper contacts. NatureWorks LLC literature, including Material Safety Data sheets, should be consulted prior to the use of the company’s products. These are available from your NatureWorks LLC representative.
NOTICE: No freedom from any patent owned by NatureWorks LLC or others is to be inferred. Because use conditions and applicable laws may differ from one location to another and may change with time, Customer is responsible for determining whether products and the information in this document are appropriate for Customer’s use and for ensuring that Customer’s workplace and disposal practices are in compliance with applicable laws and other governmental enactments. NatureWorks LLC assumes no obligation or liability for the information in this document. NO WARRANTIES ARE GIVEN; ALL IMPLIED WARRANTIES OF MERCHANTABILITY OR FITNESS FOR A PARTICULAR USE ARE EXPRESSLY EXCLUDED.
NOTICE REGARDING PROHIBITED USE RESTRICTIONS: NatureWorks LLC does not recommend any of its products, including samples, for use as: Components of, or packaging for, tobacco products; Components of products where the end product is intended for human or animal consumption; In any application that is intended for any internal contact with human body fluids or body tissues; As a critical component in any medical device that supports or sustains human life; In any product that is designed specifically for ingestion or internal use by pregnant women; and in any application designed specifically to promote or interfere with human reproduction.
For additional information please contact NatureWorks via our website on the tab called FAQ’s or by clicking here. 15305 Minnetonka Blvd., Minnetonka, MN 55345

Appendix E
PCL datasheet
111
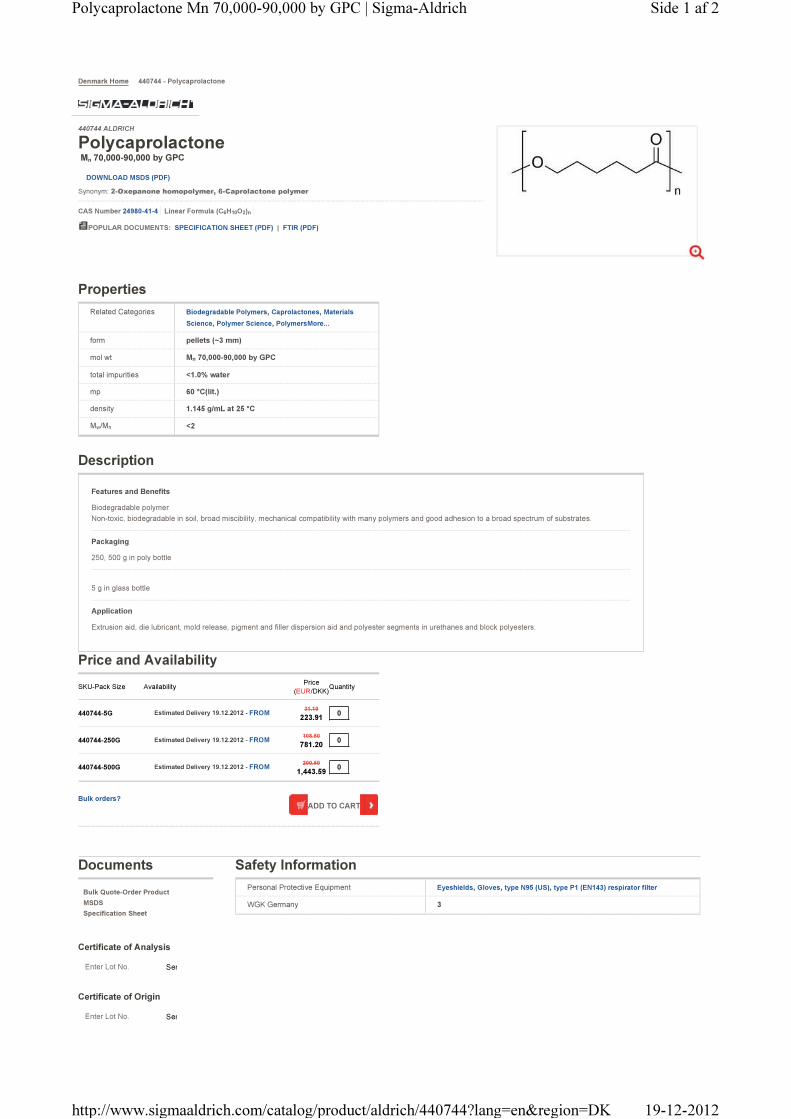
Denmark Home 440744 - Polycaprolactone
Description
Features and Benefits
Biodegradable polymer
Non-toxic, biodegradable in soil, broad miscibility, mechanical compatibility with many polymers and good adhesion to a broad spectrum of substrates.
Packaging
250, 500 g in poly bottle
5 g in glass bottle
Application
Extrusion aid, die lubricant, mold release, pigment and filler dispersion aid and polyester segments in urethanes and block polyesters.
Properties
Related Categories Biodegradable Polymers, Caprolactones, Materials
Science, Polymer Science, PolymersMore...
form pellets (~3 mm)
mol wt Mn 70,000-90,000 by GPC
total impurities <1.0% water
mp 60 °C(lit.)
density 1.145 g/mL at 25 °C
Mw/M
n <2
Documents
Bulk Quote-Order Product
MSDS
Specification Sheet
Certificate of Analysis
Certificate of Origin
Safety Information
Personal Protective Equipment Eyeshields, Gloves, type N95 (US), type P1 (EN143) respirator filter
WGK Germany 3
Price and Availability
SKU-Pack Size Availability
Price
(EUR/DKK)
Quantity
440744-5G Estimated Delivery 19.12.2012 - FROM
31.10
223.91
0
440744-250G Estimated Delivery 19.12.2012 - FROM
108.50
781.20
0
440744-500G Estimated Delivery 19.12.2012 - FROM
200.50
1,443.59
0
440744 ALDRICH
Polycaprolactone
Mn
70,000-90,000 by GPC
DOWNLOAD MSDS (PDF)
Synonym: 2-Oxepanone homopolymer, 6-Caprolactone polymer
CAS Number 24980-41-4 Linear Formula (C6H10O2)n
POPULAR DOCUMENTS: SPECIFICATION SHEET (PDF) | FTIR (PDF)
Bulk orders?
ADD TO CART
Enter Lot No. Sen
Enter Lot No. Sen
Side 1 af 2Polycaprolactone Mn 70,000-90,000 by GPC | Sigma-Aldrich
19-12-2012http://www.sigmaaldrich.com/catalog/product/aldrich/440744?lang=en®ion=DK

Appendix F
SU-8 containers
113
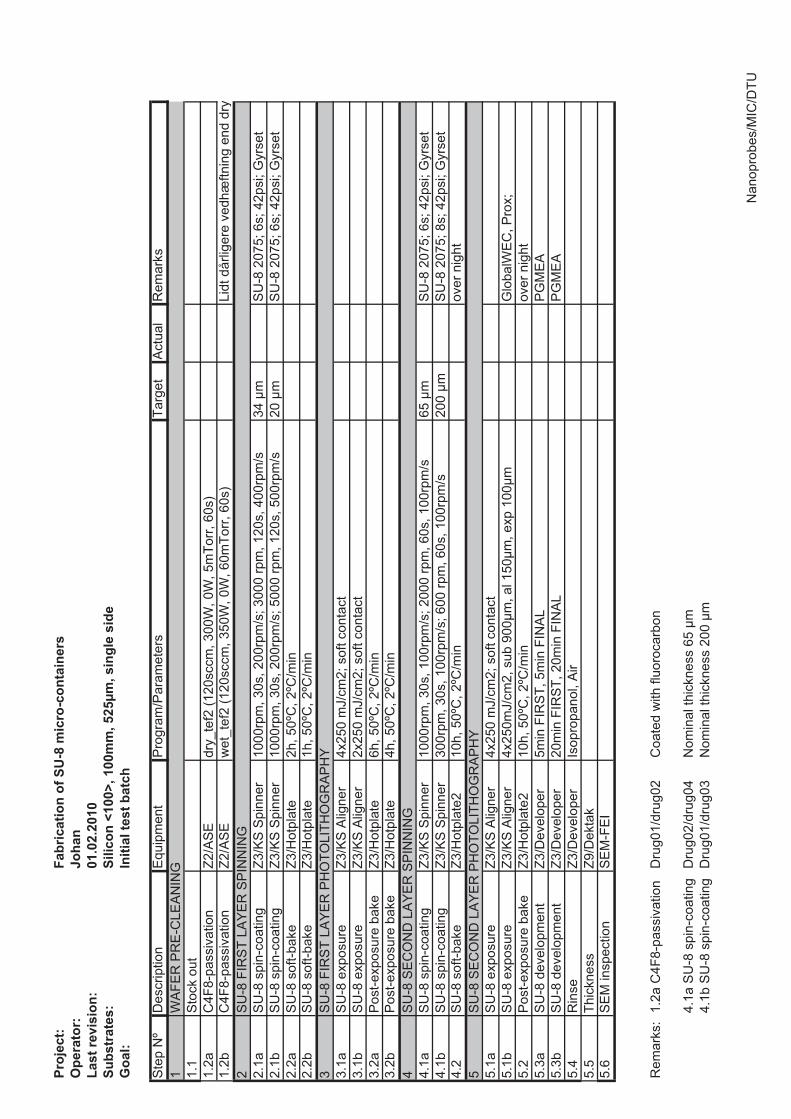
Last
revi
sion
:Su
bstr
ates
:G
oal:
Initi
al te
st b
atch
Ste
p N
ºD
escr
iptio
nE
quip
men
tP
rogr
am/P
aram
eter
sTa
rget
Act
ual
Rem
arks
1 1.1
Sto
ck o
ut1.
2aC
4F8-
pass
ivat
ion
Z2/A
SE
dry_
tef2
(120
sccm
, 300
W, 0
W, 5
mTo
rr, 6
0s)
1.2b
C4F
8-pa
ssiv
atio
nZ2
/AS
Ew
et_t
ef2
(120
sccm
, 350
W, 0
W, 6
0mTo
rr, 6
0s)
Lidt
dår
liger
e ve
dhæ
ftnin
g en
d dr
y2 2.
1aS
U-8
spi
n-co
atin
gZ3
/KS
Spi
nner
1000
rpm
, 30s
, 200
rpm
/s; 3
000
rpm
, 120
s, 4
00rp
m/s
34 µ
mS
U-8
207
5; 6
s; 4
2psi
; Gyr
set
2.1b
SU
-8 s
pin-
coat
ing
Z3/K
S S
pinn
er10
00rp
m, 3
0s, 2
00rp
m/s
; 500
0 rp
m, 1
20s,
500
rpm
/s20
µm
SU
-8 2
075;
6s;
42p
si; G
yrse
t2.
2aS
U-8
sof
t-bak
eZ3
/Hot
plat
e2h
, 50º
C, 2
ºC/m
in2.
2bS
U-8
sof
t-bak
eZ3
/Hot
plat
e1h
, 50º
C, 2
ºC/m
in3 3.
1aS
U-8
exp
osur
eZ3
/KS
Alig
ner
4x25
0 m
J/cm
2; s
oft c
onta
ct3.
1bS
U-8
exp
osur
eZ3
/KS
Alig
ner
2x25
0 m
J/cm
2; s
oft c
onta
ct3.
2aP
ost-e
xpos
ure
bake
Z3/H
otpl
ate
6h, 5
0ºC
, 2ºC
/min
3.2b
Pos
t-exp
osur
e ba
keZ3
/Hot
plat
e4h
, 50º
C, 2
ºC/m
in4 4.
1aS
U-8
spi
n-co
atin
gZ3
/KS
Spi
nner
1000
rpm
, 30s
, 100
rpm
/s; 2
000
rpm
, 60s
, 100
rpm
/s65
µm
SU
-8 2
075;
6s;
42p
si; G
yrse
t4.
1bS
U-8
spi
n-co
atin
gZ3
/KS
Spi
nner
300r
pm, 3
0s, 1
00rp
m/s
; 600
rpm
, 60s
, 100
rpm
/s20
0 µm
SU
-8 2
075;
8s;
42p
si; G
yrse
t4.
2S
U-8
sof
t-bak
eZ3
/Hot
plat
e210
h, 5
0ºC
, 2ºC
/min
over
nig
ht5 5.
1aS
U-8
exp
osur
eZ3
/KS
Alig
ner
4x25
0 m
J/cm
2; s
oft c
onta
ct5.
1bS
U-8
exp
osur
eZ3
/KS
Alig
ner
4x25
0mJ/
cm2,
sub
900
µm, a
l 150
µm, e
xp 1
00µm
Glo
balW
EC
, Pro
x;5.
2P
ost-e
xpos
ure
bake
Z3/H
otpl
ate2
10h,
50º
C, 2
ºC/m
inov
er n
ight
5.3a
SU
-8 d
evel
opm
ent
Z3/D
evel
oper
5min
FIR
ST,
5m
in F
INA
LP
GM
EA
5.3b
SU
-8 d
evel
opm
ent
Z3/D
evel
oper
20m
in F
IRS
T, 2
0min
FIN
AL
PG
ME
A5.
4R
inse
Z3/D
evel
oper
Isop
ropa
nol,
Air
5.5
Thic
knes
sZ9
/Dek
tak
5.6
SE
M in
spec
tion
SE
M-F
EI
Rem
arks
:1.
2a C
4F8-
pass
ivat
ion
Dru
g01/
drug
02C
oate
d w
ith fl
uoro
carb
on
4.1a
SU
-8 s
pin-
coat
ing
Dru
g02/
drug
04N
omin
al th
ickn
ess
65 µ
m4.
1b S
U-8
spi
n-co
atin
gD
rug0
1/dr
ug03
Nom
inal
thic
knes
s 20
0 µm
Proj
ect:
Ope
rato
r:Fa
bric
atio
n of
SU
-8 m
icro
-con
tain
ers
Joha
n
SU
-8 S
EC
ON
D L
AY
ER
PH
OTO
LITH
OG
RA
PH
Y
WA
FER
PR
E-C
LEA
NIN
G
SU
-8 F
IRS
T LA
YE
R S
PIN
NIN
G
SU
-8 F
IRS
T LA
YE
R P
HO
TOLI
THO
GR
AP
HY
SU
-8 S
EC
ON
D L
AY
ER
SP
INN
ING
01.0
2.20
10Si
licon
<10
0>, 1
00m
m, 5
25µm
, sin
gle
side
Nan
opro
bes/
MIC
/DTU

Appendix G
SU-8 stamps
115
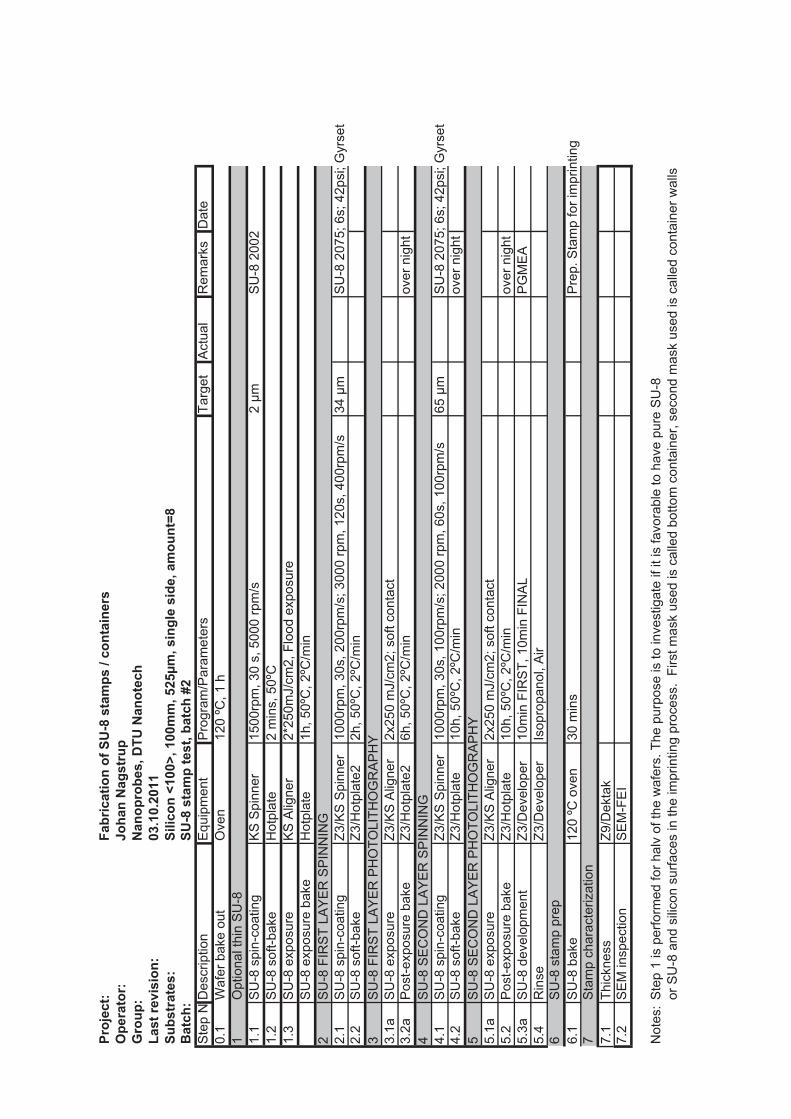
Gro
up:
Nan
opro
bes,
DTU
Nan
otec
hLa
st re
visi
on:
Subs
trat
es:
Bat
ch:
SU-8
sta
mp
test
, bat
ch #
2S
tep
NºD
escr
iptio
nE
quip
men
tP
rogr
am/P
aram
eter
sTa
rget
Act
ual
Rem
arks
Dat
e0.
1W
afer
bak
e ou
tO
ven
120
ºC, 1
h1
Opt
iona
l thi
n S
U-8
1.1
SU
-8 s
pin-
coat
ing
KS
Spi
nner
1500
rpm
, 30
s, 5
000
rpm
/s2
µmS
U-8
200
21.
2S
U-8
sof
t-bak
eH
otpl
ate
2 m
ins,
50º
C1.
3S
U-8
exp
osur
eK
S A
ligne
r2*
250m
J/cm
2, F
lood
exp
osur
eS
U-8
exp
osur
e ba
keH
otpl
ate
1h, 5
0ºC
, 2ºC
/min
2 2.1
SU
-8 s
pin-
coat
ing
Z3/K
S S
pinn
er10
00rp
m, 3
0s, 2
00rp
m/s
; 300
0 rp
m, 1
20s,
400
rpm
/s34
µm
SU
-8 2
075;
6s;
42p
si; G
yrse
t2.
2S
U-8
sof
t-bak
eZ3
/Hot
plat
e22h
, 50º
C, 2
ºC/m
in3 3.
1aS
U-8
exp
osur
eZ3
/KS
Alig
ner
2x25
0 m
J/cm
2; s
oft c
onta
ct3.
2aP
ost-e
xpos
ure
bake
Z3/H
otpl
ate2
6h, 5
0ºC
, 2ºC
/min
over
nig
ht4 4.
1S
U-8
spi
n-co
atin
gZ3
/KS
Spi
nner
1000
rpm
, 30s
, 100
rpm
/s; 2
000
rpm
, 60s
, 100
rpm
/s65
µm
SU
-8 2
075;
6s;
42p
si; G
yrse
t4.
2S
U-8
sof
t-bak
eZ3
/Hot
plat
e10
h, 5
0ºC
, 2ºC
/min
over
nig
ht5 5.
1aS
U-8
exp
osur
eZ3
/KS
Alig
ner
2x25
0 m
J/cm
2; s
oft c
onta
ct5.
2P
ost-e
xpos
ure
bake
Z3/H
otpl
ate
10h,
50º
C, 2
ºC/m
inov
er n
ight
5.3a
SU
-8 d
evel
opm
ent
Z3/D
evel
oper
10m
in F
IRS
T, 1
0min
FIN
AL
PG
ME
A5.
4R
inse
Z3/D
evel
oper
Isop
ropa
nol,
Air
6S
U-8
sta
mp
prep
6.1
SU
-8 b
ake
120
ºC o
ven
30 m
ins
Pre
p. S
tam
p fo
r im
prin
ting
7S
tam
p ch
arac
teriz
atio
n7.
1Th
ickn
ess
Z9/D
ekta
k7.
2S
EM
insp
ectio
nS
EM
-FE
I
Not
es:
Ste
p 1
is p
erfo
rmed
for h
alv
of th
e w
afer
s. T
he p
urpo
se is
to in
vest
igat
e if
it is
favo
rabl
e to
hav
e pu
re S
U-8
or
SU
-8 a
nd s
ilico
n su
rface
s in
the
impr
intin
g pr
oces
s. F
irst m
ask
used
is c
alle
d bo
ttom
con
tain
er, s
econ
d m
ask
used
is c
alle
d co
ntai
ner w
alls
Proj
ect:
Fabr
icat
ion
of S
U-8
sta
mps
/ co
ntai
ners
Ope
rato
r:Jo
han
Nag
stru
p
SU
-8 S
EC
ON
D L
AY
ER
SP
INN
ING
SU
-8 S
EC
ON
D L
AY
ER
PH
OTO
LITH
OG
RA
PH
Y
03.1
0.20
11Si
licon
<10
0>, 1
00m
m, 5
25µm
, sin
gle
side
, am
ount
=8
SU
-8 F
IRS
T LA
YE
R S
PIN
NIN
G
SU
-8 F
IRS
T LA
YE
R P
HO
TOLI
THO
GR
AP
HY
Appendix H
Silicon stamps
117
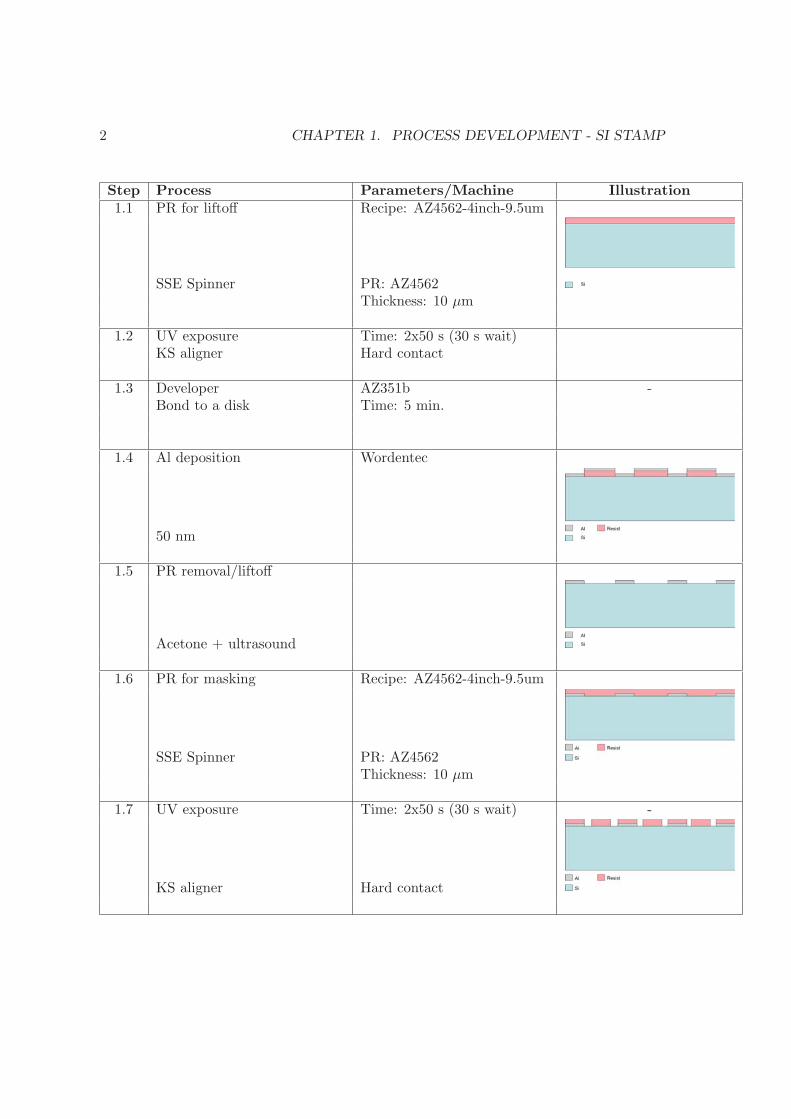
2 CHAPTER 1. PROCESS DEVELOPMENT - SI STAMP
Step Process Parameters/Machine Illustration1.1 PR for liftoff Recipe: AZ4562-4inch-9.5um
SSE Spinner PR: AZ4562Thickness: 10 μm
1.2 UV exposure Time: 2x50 s (30 s wait)KS aligner Hard contact
1.3 Developer AZ351b -Bond to a disk Time: 5 min.
1.4 Al deposition Wordentec
50 nm
1.5 PR removal/liftoff
Acetone + ultrasound
1.6 PR for masking Recipe: AZ4562-4inch-9.5um
SSE Spinner PR: AZ4562Thickness: 10 μm
1.7 UV exposure Time: 2x50 s (30 s wait) -
KS aligner Hard contact

3
2.1 ASE/pegasus etch Deep trench -
Etch depth: 60-200 μm
2.2 PR removal O2 flow: 300 mL/min
Plasma Asher N2 flow: 50 mL/minTime: 30 minPower 1000W
2.3 ASE/pegasus etch Deep trench -
Etch depth: 60 μm
2.4 Al removalH2O:H3PO4 1:2 50 ◦C
Etch rate 100nm/min 1 min etch time
2.5 Oxidation Bohr-drive-inwet1100 50 mintemp: 1100◦C Thickness 600nm
2.6 Oxide removal HF-dipBHF etch rate : 75 nm/min 10 mins
2.5 MVD coating

120 APPENDIX H. SILICON STAMPS
Appendix I
Nikkel stamps
121
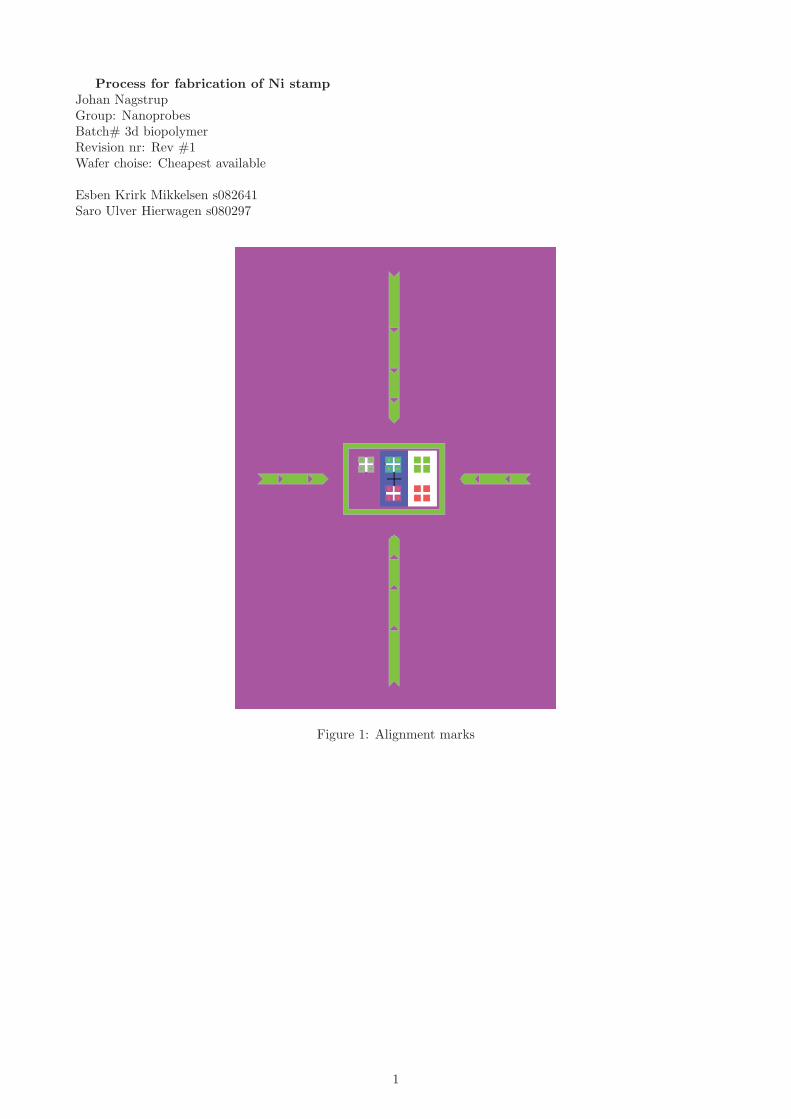
Process for fabrication of Ni stampJohan NagstrupGroup: NanoprobesBatch# 3d biopolymerRevision nr: Rev #1Wafer choise: Cheapest available
Esben Krirk Mikkelsen s082641Saro Ulver Hierwagen s080297
Figure 1: Alignment marks
1
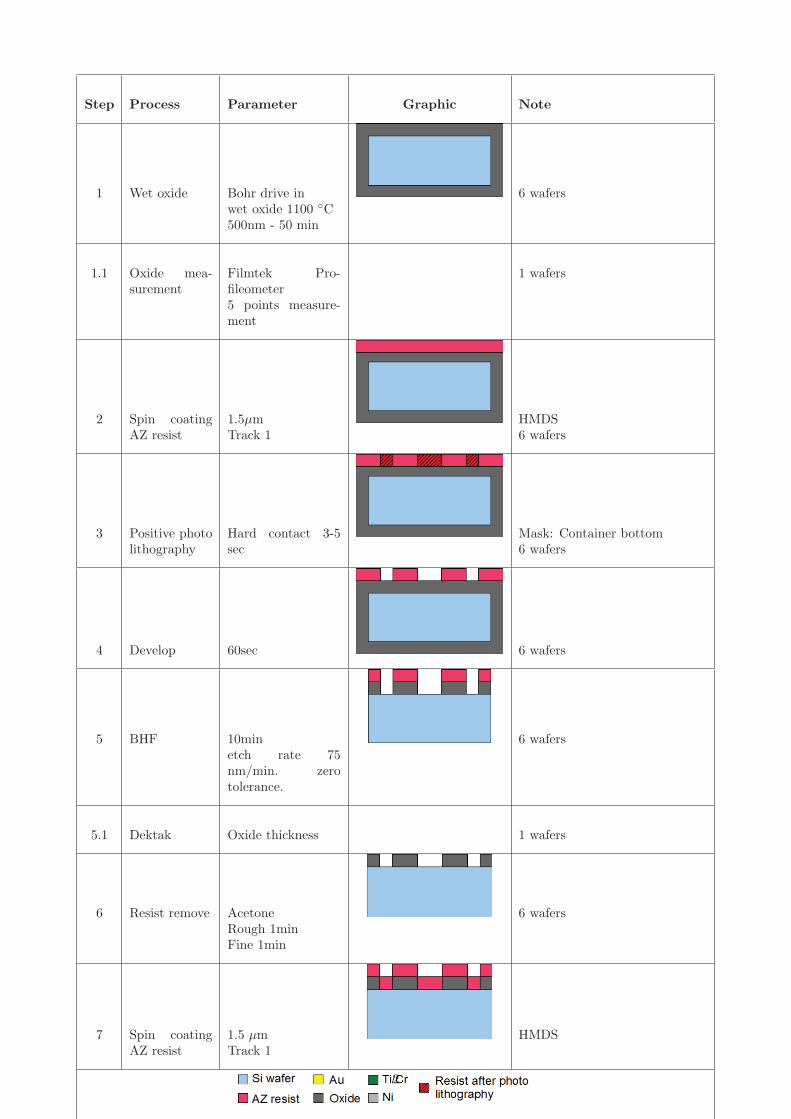
Step Process Parameter Graphic Note
1 Wet oxide Bohr drive inwet oxide 1100 ◦C500nm - 50 min
6 wafers
1.1 Oxide mea-surement
Filmtek Pro-fileometer5 points measure-ment
1 wafers
2 Spin coatingAZ resist
1.5μmTrack 1
HMDS6 wafers
3 Positive photolithography
Hard contact 3-5sec
Mask: Container bottom6 wafers
4 Develop 60sec 6 wafers
5 BHF 10minetch rate 75nm/min. zerotolerance.
6 wafers
5.1 Dektak Oxide thickness 1 wafers
6 Resist remove AcetoneRough 1minFine 1min
6 wafers
7 Spin coatingAZ resist
1.5 μmTrack 1
HMDS
2
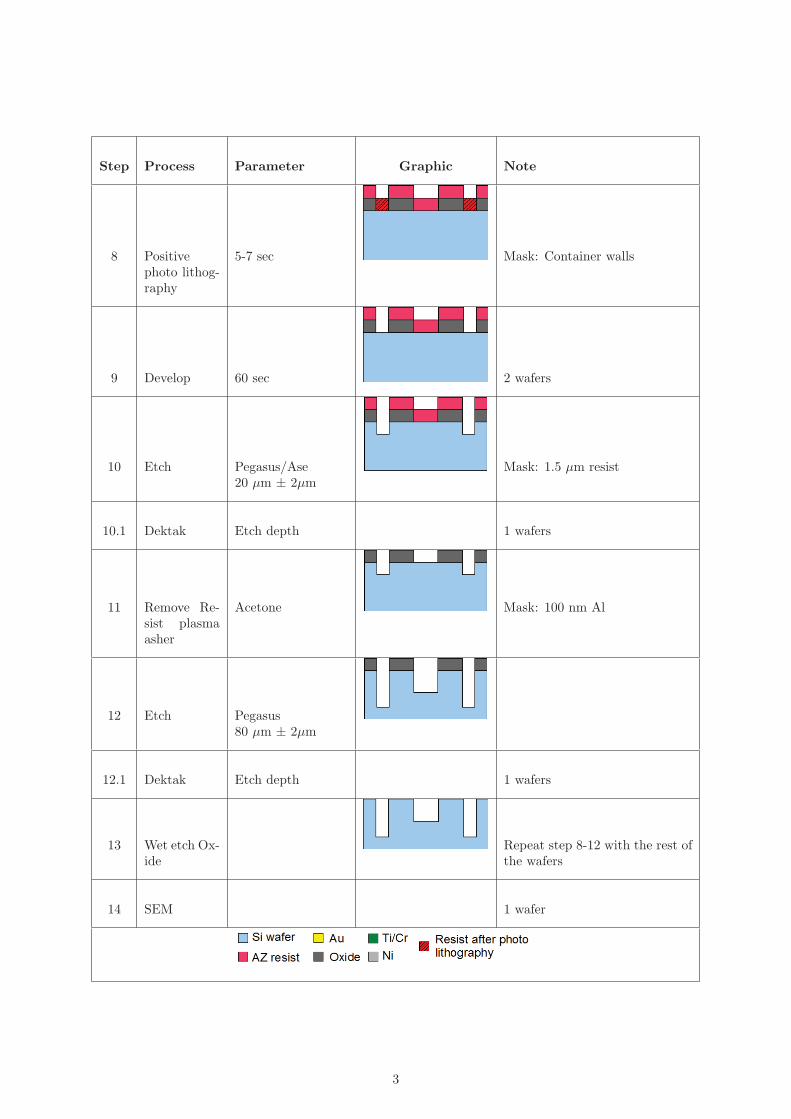
Step Process Parameter Graphic Note
8 Positivephoto lithog-raphy
5-7 sec Mask: Container walls
9 Develop 60 sec 2 wafers
10 Etch Pegasus/Ase20 μm ± 2μm
Mask: 1.5 μm resist
10.1 Dektak Etch depth 1 wafers
11 Remove Re-sist plasmaasher
Acetone Mask: 100 nm Al
12 Etch Pegasus80 μm ± 2μm
12.1 Dektak Etch depth 1 wafers
13 Wet etch Ox-ide
Repeat step 8-12 with the rest ofthe wafers
14 SEM 1 wafer
3
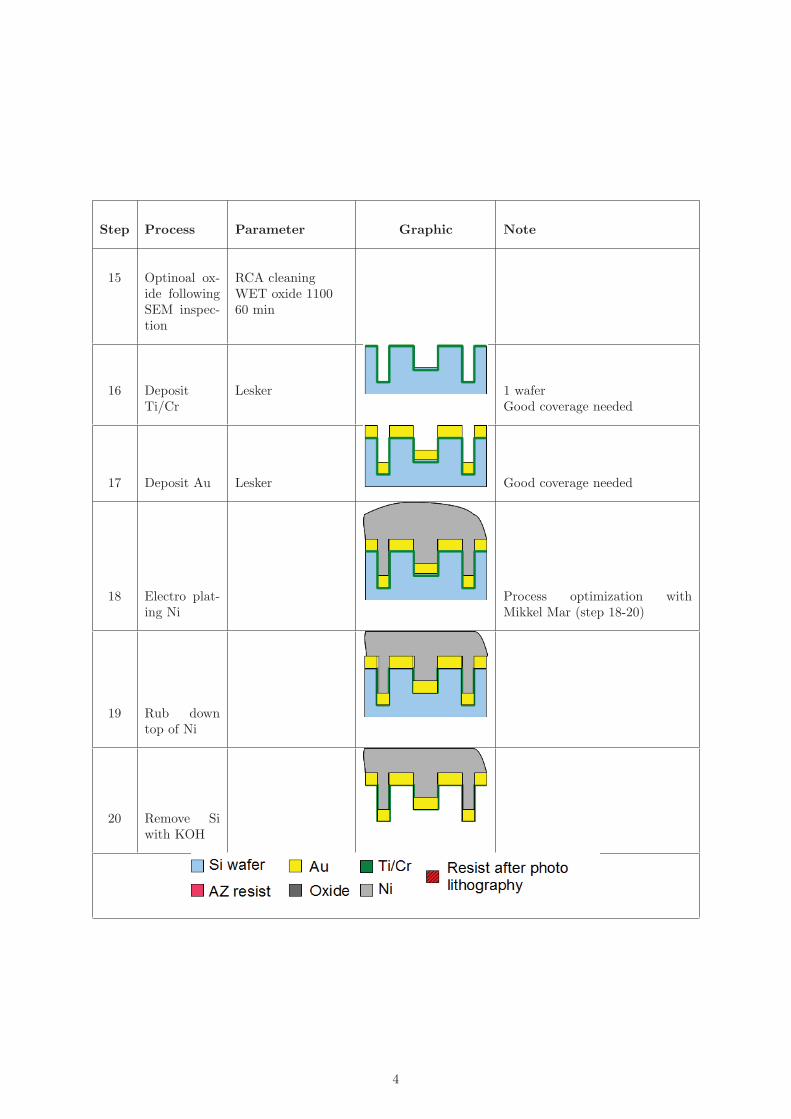
Step Process Parameter Graphic Note
15 Optinoal ox-ide followingSEM inspec-tion
RCA cleaningWET oxide 110060 min
16 DepositTi/Cr
Lesker 1 waferGood coverage needed
17 Deposit Au Lesker Good coverage needed
18 Electro plat-ing Ni
Process optimization withMikkel Mar (step 18-20)
19 Rub downtop of Ni
20 Remove Siwith KOH
4

126 APPENDIX I. NIKKEL STAMPS
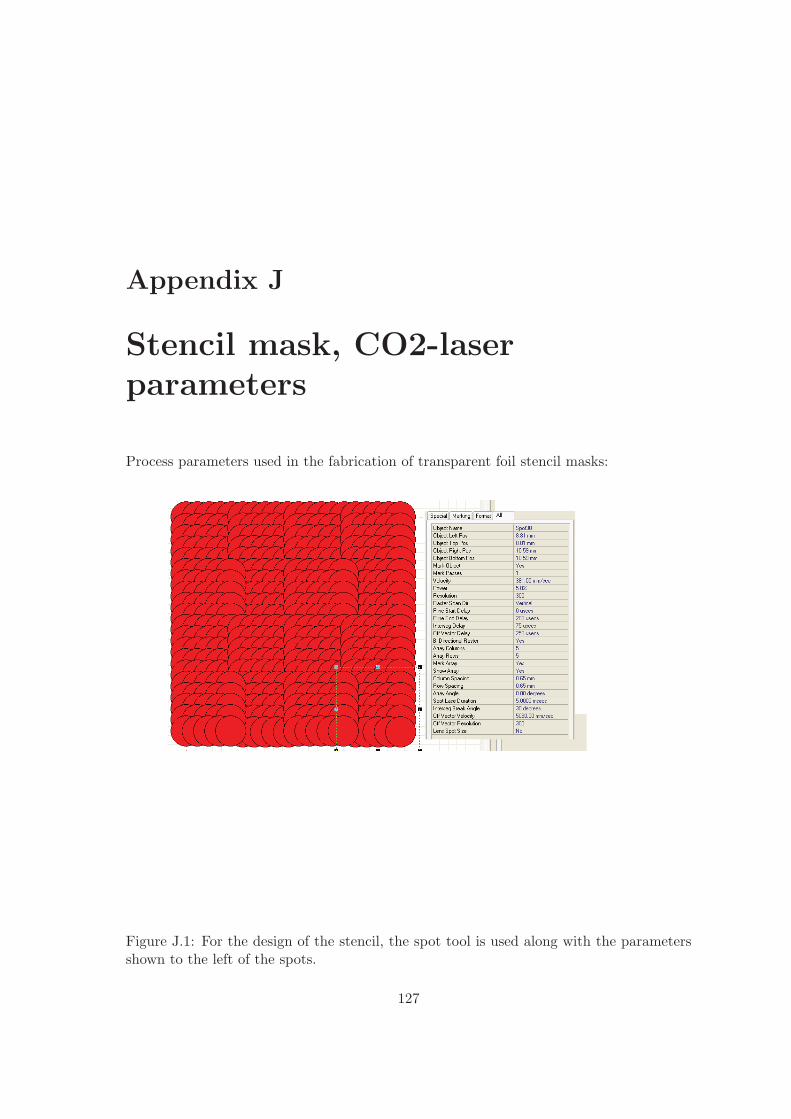
Appendix J
Stencil mask, CO2-laserparameters
Process parameters used in the fabrication of transparent foil stencil masks:
Figure J.1: For the design of the stencil, the spot tool is used along with the parametersshown to the left of the spots.
127