micro-credit and repayment rates: a case … ajit_submission_60.pdf · 1. micro-credit and...
TRANSCRIPT

1
MICRO-CREDIT AND REPAYMENT RATES: A CASE STUDY OF KUDUMBASHREE MICRO-ENTERPRISE PROGRAMME IN KERALA - 2006
D. Ajit Assistant Professor in Economics,
University of Northern British Columbia 3333 University Way, Price George, BC, Canada, V2N 4Z9
Email: [email protected]
R. Sunil Microfinance and SME Consultant
(Formerly with National Bank for Agriculture and Rural Development, Mumbai, India)
Email: [email protected]
& K. Ravi Raman
School of Social Sciences, University of Manchester,
Oxford Road, Manchester, M13 9PL Email: [email protected]

2
ABSTRACT
The attempts in India to promote microfinance since early 1990s in India was in the background of growing evidence of indebtedness among farmers and and credit starvation to the poor. With the withdrawal of state activism in credit markets in India since 1992, an increasing role was envisaged for private sector in credit dispensation to the poor in the form of microfinance under the umbrella of Bank-Self Help Group programme. Although its outreach has increased substantially, the predominant commercial model of microfinance has recently encountered hostility of poor borrowers because of their high lending rates and loan shark type behaviour.
An alternative to the commercial model of microfinance is the Kudumbashree
program initiated in 1998 by the Government of Kerala, in India. Based on a primary survey of households under the Kudumbashree in four villages in Kerala in 2006, the study examines the dynamics of high repayment rates.
The study found that repayment rates are relatively lower in non-agricultural
activities because of the marketing problems (resulting from the creation of non-tradables), while it is relatively successful in the agricultural sector. High repayment rates are found to be propelled by dynamic incentives like prospect of loan renewal. Finally, the study found that borrowers did considerable double-dipping (borrowing from other microfinance programs) and borrowed from non-institutional sources raising their indebtedness. The study found that micro-credit programmes are not a universal success in improving the livelihood of the poor especially in non-agricultural sectors. The study argues for an analytical framework which examines the interaction of labour, credit and product market to understand the livelihood of the poor. Keywords: Microfinance; Group lending; Repayment rate. JEL Classification: O16; O17; G21.

3
World-wide micro-credit programmes have evolved into microfinance
programmes which include insurance and other services. The impact of micro-credit has
been viewed from different perspectives. Traditionally, it has been studied from the point
of view of the lender, focusing on factors determining the high repayment rates
(Khandker, Khalily and Khan, 1995, Khalily et al., 2002). In Bangladesh, where the
Grameen Bank was initially studied, most of the studies have evaluated the impact at the
household level (Khandker, 1988; Zohir et al., 2001; Pitt and Khandker, 1998; Mustafa et
al., 1996; Husain, 1998). It is now well known that micro-credit institutions worldwide
have generated high repayment rates making lending to the poor profitable and a
sustainable proposition for the lenders (Cull, Demigüc-Kunt and Murdoch, 2006). At the
theoretical level, the explanations for high repayment rates have been peer monitoring,
joint liability, the possibility of repeat lending (contingent renewal) etc ( Murdoch ,1999;
Ghatak and Guinnane ,1999; and Armendariz de Aghion and Murdoch, 2005).
In India, increasing credit access to the poor through financial inclusion is a
crucial component of the Indian economic planning and fight against poverty. The
nationalization of major banks in 1969 and mandated directed credit programme to the
priority sector since the early 1970s was part of the push for financial deepening and
inclusion. But the economic reforms since 1992 with emphasis on deregulation and
efficiency had a profound impact on the financial landscape especially the access of
credit to the poor. Studies have shown that access of rural households to institutional
sources of finance has declined since 1992 and the share of debt of rural households
especially from non-institutional sources has increased (Shetty, 2005; Swaminathan,
2007). In India, the promotion of the microfinance delivery through Bank-Self Help
Group (SHG) model by the Reserve Bank of India and National Bank for Agriculture
and Rural Development (NABARD) since 1992 is to replace the state activism of the
1970s and 1980s by private sector (microfinance) entities to promote financial inclusion.
After a series of farmers' suicides in the country which are linked to rising indebtedness,
all banks are being urged to adopt ‘financial inclusion’ as an operational policy1.
1 For an overview of the Indian literature, see Ghate (2007), Basu and Srivastava (2005), Nair, T.S (2001).
4
Although the outreach of microfinance in India has increased from a modest 33 thousand
SHGs 1992 to 2.9 million SHGs by 2007, the biggest driver of this expansion – the
commercial model (based on profits) received some setbacks in March 2006 with
borrowers in the state of Andhra Pradesh (with the highest microfinance density in India)
showing considerable hostility to these entities on the ground that they behave like loan
sharks (Ghate, 2007 and Shylendra, 2006). It is in this background there is a search for
alternative delivery models of microfinance. The Kudumbashree program in the state of
Kerala, represent an alternative delivery to the commercial model of delivery and
embraces a number of elements: micro-enterprises, insurance, education, old-age
assistance, etc. Like microfinance programs worldwide, Kudumbashree is hailed as a
success because of its high (94.5) repayment rates (Government of Kerala, 2005b).
In the literature on economic impact, there is increasing evidence that
microfinance programmes has low-income impact but generate high repayment rate
(Copestake, Bhalotra and Johnson, 2001; MkNelly and Dunford, 1998, 1999; Mosley,
2001; Sebstad and Chen, 1996; Todd, 2000). Further, recent research have provided
evidences of microfinance leading to more debts and borrowers getting locked into a
process of loan recycling (Todd, 1996; Murdoch, 1998, Rahman, 1999; Huq, 2001). In
India, the expansion of microfinance on a large scale since 1992 has been accompanied
by increasing evidence of indebtedness of farmers, which is a paradox. A study of the
dynamics of repayment rates of micro-credit enterprises could provide insights into this
paradox. Although there are some attempts to study the Kudumbashree programme
(Anand, 2002, John & Chathukulam, 2002; Kadiyala, 2004; Pat, 2005, Devika and
Thampi, 2007 ), they have not examined the dynamics of the high repayment rate of
micro-credit programmes. The main aim of the present study is to contribute to this
literature by examining the dynamics of the repayment rate of the Kudumbashree micro-
credit program using a primary survey of borrowers in four villages (panchayats) in
Kerala. Based on the empirical results, the study recommends an integrated analytical
framework which incorporates linkages and dynamics of labour, credit and product
markets to evaluate micro-credit programmes.

5
The present study contributes to the literature in many ways. First, Kerala is ahead
of almost all Indian states in social indicators at low levels of economic growth2. But
recently several factors have contributed to fueling much political and social tension in
the state: large scale unemployment, mainly among the educated; deterioration in
agriculture, especially the large drop in the total area under cultivation (including
recently, the plantation sector); unfavorable credit scenario (low credit-deposit ratio); and
the underdevelopment of the industry sector. As a result close to 2,000 farmers
committed suicide in the state (Government of Kerala, 2006, Vaidyanathan, 2006;
Jeromi, 2007). These factors have also put poverty into the focus of public policy
debates and Kudumbashree could represent an alternative model of economic
advancement. Secondly, it is increasingly recognized that women share a grater burden of
poverty within the household. Kudumbashree being a women-centered micro-credit
program, it is interesting to examine how such a program contributes to the removal of
gender inequalities and empowerment of women. Lastly, Kerala being a state with
relatively low credit-deposit ratio and the poor depending on non-institutional sources of
finance, the impact of microfinance borrowing on the indebtedness of borrowers,
especially the issue of loan recycling and the vulnerability of the poor, is an interesting
area of investigation.
The study is organized as follows: Section II briefly reviews the theoretical
literature on the subject. Section III examines briefly the evolution of microfinance
program in India. Section IV examines the Kudumbashree program in Kerala. Section V
empirically examine the dynamics of repayment rates of the micro-enterprise program of
Kudumbashree based on the survey of households of four panchayats in Kerala: and
Section VI summarises the conclusions from the study.
2 Kerala had a relatively lower poverty ratio (9 percent) as compared with the other states, the national average ratio being of 26 percent in 2003 (Government of Kerala, 2005b). This was achieved without commensurate economic development and this experience referred to in the literature as the ‘Kerala model of economic development’ illustrates the role of public action in providing social goods and services even at low levels of economic growth. The sustainability of this model has been questioned by a number of researchers (See Kannan, 1990; George, 1993; Tharamangalam, 1998).

6
Section 1I: Review of Literature – A Brief Review
In the theoretical literature, the asymmetric information framework provides the
standard explanation of why poor are excluded from credit market: poor lack collateral
and other visible assets and therefore are difficult to monitor which cause them to be
more credit rationed or credit denied. Recent theoretical works have provided explanation
of how such information asymmetries could be avoided in credit markets3. One such
explanation is the micro-lending based on ‘group lending’. We review below some of the
theoretical explanations for the success of group lending.
Stiglitz (1990), Varian (1990), and Becker (1991) provide explanations based on
‘peer monitoring’. Using results from contract theory, they argue that since loans are
given to a ‘group’ rather than to an ‘individual’ (as in the traditional lending
arrangement), group members have an incentive to monitor their peers. Since group
members have better information compared to lenders, peer monitoring would be
relatively cheaper compared to bank monitoring, leading to greater monitoring and
greater rates of repayment.
Banerjee, Besley and Guinnane (1994), Besley and Coate (1995), Conning
(1996), Madajewicz (1998), Stiglitz (1990), Armendariz de Aghion (1999) and Ghatak
and Guinnane (1999) also argue that compared to other explanations, arguments based on
peer monitoring are more successful in explaining the success of group lending schemes.
They illustrate how imposing joint liability on borrowers can alleviate adverse and more
hazard problems. However, the variables they emphasize in order to demonstrate peer
monitoring are slightly different.
Ghatak (1999, 2000) and Tassel (1999) argue that group lending could lead to
homogenous group formation. They affirm that joint liability and self-selection in credit
could lead to positive assertive matching so that borrowers of the same type club
together. Safe borrowers will form credit cooperatives and risky borrowers will be left
aside.
3 For a complete review of literature, see the following efforts which are devoted to this subject: Murdoch (1999), Ghatak and Guinnane (1999) and Armendariz de Aghion and Murdoch (2005).

7
Besley and Coate (1995) analyze a strategic repayment game with joint liability
and demonstrate that successful group members may have an incentive to repay the loans
of the less successful ones. They also highlight the effects of social collateral in enforcing
prompt repayment.
Another explanation for the success of group lending is the ‘contingent renewal
explanation’. Contingent renewal of loans is one kind of positive incentive to repay. It
refers to the feature that in case of default by a group, no member of this group will
receive future loans. In case of prompt repayment, there is repeat lending. As a result, the
probability of moral hazard is reduced. This is achieved by introducing joint-liability
contracts which transfers the risk from the lender to the borrower. Studies by Besley and
Coate (1995), Khandker, Khalily and Khan (1995), Ray (1999) and Rai and Sjöström
(2004) emphasize the ‘domino effect’ of the group being excluded from future loans (in
the case of a member defaulting on loan) as a potential incentive mechanism to enforce
repayment of the group. The contingent renewal implies that the selection of borrowers is
credit history dependent.
In recent times, attempts have been made to answer the question whether group
lending is a complete financial tool or whether there are possible alternatives or
improvements to develop. Some of the new innovative ideas include smaller but more
frequent repayment installments and replacing the joint-liability clause with requirement
of public repayment4.
The new microfinance literature highlights the gender by emphasizing the role of
women in the microfinance revolution. Traditionally women have less access to credit.
However, they are more likely to repay their debts than men. Women are more concerned
with household improvement, children’s education and their health than are the male
family members. Some of the new lending schemes like higher loan amounts over time
and easy installments are important tools to attract female borrowers.
4 For a review of recent ideas, see Armendariz de Aghion and Murdoch (2005), chapter 5.

8
Section III Progress of Microfinance Program in India. India Financial Development: A Brief history.
The organized financial system in India consists of commercial and co-operative
banks, capital market institutions, non-banks and a number of indigenous banking and
financial institutions. The organized sector consists of commercial banks and co-
operative banks which are organized on the ‘unit’ banking principle are mainly rural
based. Besides, government-owned post offices mobilize deposits but they do not
undertake any lending activity. The unorganized sector consists of indigenous bankers,
moneylenders, chit funds. At the financial services side, institutions like Unit Trust of
India (UTI), Life Insurance Corporation of India (LIC), General Insurance Corporation
(GIC) were also created under public ownership.
Table 1: Purpose-Wise Distribution of Bank Credit by Scheduled Commercial Banks: 1968-2005
(Amount in Rs. Crore) March 1968 March 1991 March 2005 Sectors Amount In% Amount In% Amount In%
1. Gross Bank Credit 3,064 1,24,202 11,52,468 2. Food Procurement Credit 109 4,216 40,039 3. Non-Food Gross Bank
Credit 2,955 100.0 1,19,986 100.0 11,12,429 100.0
Of which to 3.1. Priority Sectors 325 11.0 39,123 32.6 2,50,887 22.63.2 Industry (Medium
and Large) 1,857 62.8 51,356 42.8 3,93,600 35.4
3.3. Wholesale Trade 432 14.7 11,493 9.6 73,518 6.63.4. Others 341 11.5 18,014 15.0 39,44,24 35.5
Memorandum Item (A) Industrial Credit (Small, Medium and Large)
2,068 59,093 4,46,825
(B) Priority Sector as a Proportion of Net Bank Credit
14.0 38.0 37.0
Source: Reserve Bank of India, Banking Statistics (Various Issues).
Scheduled commercial banks constitute about 97 per cent of the total deposits of
the banking system in March 1951. At the time of independence, nearly 93 per cent of

9
debt of rural household’s (which constitute of two-third of the population in India) was
provided by the informal sector including money lenders. During the post-independence
period, banks were primarily located in metropolitan and urban areas and catered to the
needs of industrial sector. For example, agricultural sector which contributed nearly 56
per cent of national income received only 2 per cent of bank credit in 1951. Such
asymmetries and increasing political climate for interventionist policies resulting in
nationalization of major banks in 1969.
During the post-1969 period, the banking system experienced a phenomenal
expansion of branches in semi-urban and rural areas of the country. The post-bank
nationalization saw the emergence of ‘social banking’ and was essentially ‘supply
oriented’ ( Shetty, 1978). Through the branch licensing regulation, the Reserve Bank of
India (RBI) put pressure on banks through branch licensing policy to open bank branches
in semi-urban and rural areas5. Thus the population per bank office which was around
64 thousand in 1969 showed a dramatic decline and was around 14,000 by 1991. The
dramatic expansion of bank branches in rural and semi-urban areas was made possible by
This substantially boosted savings in the form of financial assets (especially currency
and bank deposits as proportion of savings) from 5 per cent in 1969 to 15 per cent in
1991. During the social phase of bank interest rates on deposits and loans were
administered with priority sector including informal sector getting a lower interest rate
prescription. Banks were required to lend 40 per cent of their credit to ‘priority sectors’
(agriculture, small-scale industry, retail trade etc). The lending to private corporate sector
were greatly restricted using the inventory and receivable norms prescribed under the
Credit Authorisation Scheme administered by the Reserve Bank of India (the central bank
as well as its financial regulator). Banks were compensated for the below the market
lending rates on priority loans through a cob-web of compensatory finances including
refinances and payments of interest on bank’s cash reserve holdings with the central
bank. During the social phase of banking, monetary policy was increasingly conducted
5 The ‘branch licensing’ policy implemented by RBI which granted licenses for opening of new branches mainly in rural and semi-urban areas.
10
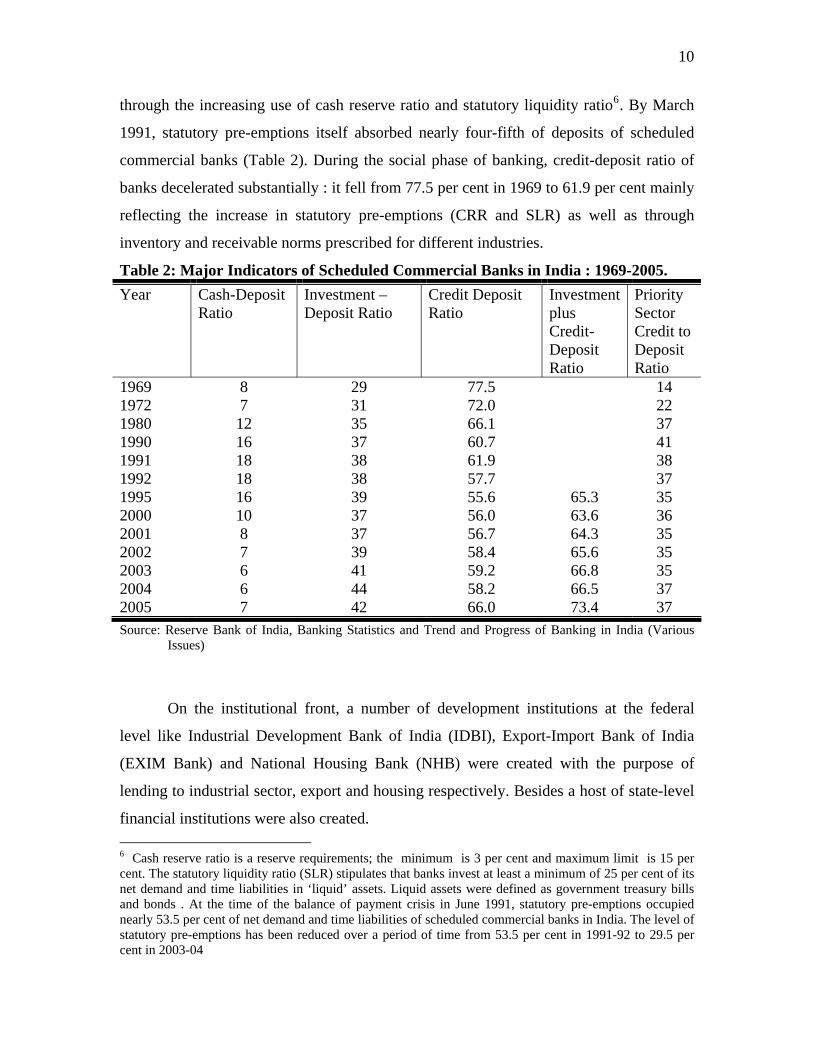
through the increasing use of cash reserve ratio and statutory liquidity ratio6. By March
1991, statutory pre-emptions itself absorbed nearly four-fifth of deposits of scheduled
commercial banks (Table 2). During the social phase of banking, credit-deposit ratio of
banks decelerated substantially : it fell from 77.5 per cent in 1969 to 61.9 per cent mainly
reflecting the increase in statutory pre-emptions (CRR and SLR) as well as through
inventory and receivable norms prescribed for different industries.
Table 2: Major Indicators of Scheduled Commercial Banks in India : 1969-2005. Year Cash-Deposit
Ratio Investment –Deposit Ratio
Credit Deposit Ratio
Investment plus Credit-Deposit Ratio
Priority Sector Credit to Deposit Ratio
1969 8 29 77.5 14 1972 7 31 72.0 22 1980 12 35 66.1 37 1990 16 37 60.7 41 1991 18 38 61.9 38 1992 18 38 57.7 37 1995 16 39 55.6 65.3 35 2000 10 37 56.0 63.6 36 2001 8 37 56.7 64.3 35 2002 7 39 58.4 65.6 35 2003 6 41 59.2 66.8 35 2004 6 44 58.2 66.5 37 2005 7 42 66.0 73.4 37 Source: Reserve Bank of India, Banking Statistics and Trend and Progress of Banking in India (Various
Issues)
On the institutional front, a number of development institutions at the federal
level like Industrial Development Bank of India (IDBI), Export-Import Bank of India
(EXIM Bank) and National Housing Bank (NHB) were created with the purpose of
lending to industrial sector, export and housing respectively. Besides a host of state-level
financial institutions were also created. 6 Cash reserve ratio is a reserve requirements; the minimum is 3 per cent and maximum limit is 15 per cent. The statutory liquidity ratio (SLR) stipulates that banks invest at least a minimum of 25 per cent of its net demand and time liabilities in ‘liquid’ assets. Liquid assets were defined as government treasury bills and bonds . At the time of the balance of payment crisis in June 1991, statutory pre-emptions occupied nearly 53.5 per cent of net demand and time liabilities of scheduled commercial banks in India. The level of statutory pre-emptions has been reduced over a period of time from 53.5 per cent in 1991-92 to 29.5 per cent in 2003-04

11
Economic Reform and Financial Exclusion
The social banking phase was broken by the economic crisis in India in June 1991
when the country faced severe balance of payments problem resulting in the country
seeking a loan from International Monetary Fund (IMF) which in turn triggered a host of
reforms in fiscal, monetary, real and financial sector areas. The financial sector
reforms introduced in the country in 1992 based on the recommendations of the
Committee on Financial Sector Reforms (popularly known as Narasimham
Commmittee) Report (1991) substantially changed the financial landscape in India.
During this phase, the administrative interest rate structure was dismantled and banks
were given greater freedom in taking decisions on their balance sheets and promoting
efficiency. Besides a number of prudential measures including the introduction of capital
adequacy, income recognition and asset classification based on international norms were
introduced as part of the financial sector reforms in India.
Chart 1: Share of Small Borrowal Accounts in Total Credit Accounts and outsanding bank credit in India :1975-2005
10
20
30
40
50
60
70
80
90
100
110
75 80 90 91 92 93 94 95 96 97 98 99 2000 01 02 03 04 05Year
%
Credit
Accounts

12
Chart 2: Excess(+) Holding of Investment by Scheduled Commercial Banks in Approved Governemnt Securities in India: 1969-2005
-4-202468
1012141618
69 72 80 90 91 92 93 94 95 00 05
The capital accord regime associated with financial sector reforms altered
substantially the behaviour of banks7. Firstly, given the 100 per cent risk-weights for
loans, made loans as an ‘inferior’ asset in the portfolio of banks. Banks instead preferred
the low risk weighted assets like investment in government securities to expand their
balance sheets. This resulted in substantial decline in credit-deposit ratio of banks in India
- from 61.9 per cent in 1991 to 56 per cent in 20008 (see Table 2). An analysis of banks
excess investments in government bonds ( defined as actual to mandatory investment
requirement) was considerably high during the reform period accounting for as high as 18
per cent of deposits in 1995-96 (Chart 2). The excess investment in government bonds
(called SLR investments) by banks was clearly at the expense of bank credit. Secondly,
the high non-performing assets of banks especially from priority sector (estimated at 50
per cent of priority sector credit), provided banks to cut-back on lending to the poor. This
is evident from huge decline in small-borrowal accounts since the economic reforms. .
On the eve of financial sector reforms, small borrowal accounts on an averaged around
7 To promote financial stability, one of the important instruments advocated by Narasimham Committee Report was the internationally accepted capital adequacy norm. Banks were advised to meet the capital adequacy of 8 per cent of their risk-weighted assets by 1995. On the monetary side, the RBI scaled down the statutory pre-emptions in the form of cash reserve ratio and statutory liquidity ratio mainly with the idea of providing additional liquidity to banks for their lending 8 . The official explanation provided by RBI was that the credit market was ‘sluggish’ and one has to look for a more broadened definition of credit which include banks investments in money and capital market instruments like Certificate of Deposits , Commercial Paper etc. But the beneficiaries of such investments was the well-established corporates rather than small borrowers and cannot be construed as a rise in the overall supply in the economy.

13
95 per cent of the borrowal accounts and around 23 per cent of outstanding bank credit.
These proportions fell dramatically post-financial sector reform period : the share of
small borrowal accounts in total borrowal accounts fell from 95 per cent in 1992 to as
low as 90.1 per cent and that of credit outstanding from 22 per cent in 1992 to 12.5 per
cent in 1998 (Chart 2). Thirdly, the flexibility provided to banks in meeting their priority
sector targets also contributed to cut-backs in priority sector lending: banks were
provided with a separate window to invest any shortfall in meeting priority sector
targets (vis-à-vis) in a Rural Infrastructure Development Fund (RIDF) bond (since 1995-
96) with a fixed return which was considerably higher than the priority sector loan return.
The fourth major factor responsible for sluggish lending to priority sector was the
withdrawal of credit guarantee on small loans by DICGIC since 1993. This reduced the
incentive of banks to lend to the small-scale industries which are in banks eyes ‘risky’.
The cumulative effect of all these developments was the ‘credit starvation’ experienced in
the Indian economy and in particular the poor (Shetty, S.L, 2005). A corroborative
evidence of increasing vulnerability of the poor is the increasing share of moneylenders
in borrowing of cultivator households (Chart 3a). Similarly, the share of informal sector
(including moneylenders ) in total debt of farming households was as high as 43 per cent
in 2003 (Chart 3b).
Chart 3a: Share of Moneylenders in Borrowing of Cultivator Households in India:1951-2002
0
10
20
30
40
50
60
70
80
51 61 71 81 91 02
Year
%
Souce: NSSO, CSO, India
Chart 3b: Share of Formal and Informal Sector in total debt of rural farming households in
India:2003
0 10 20 30 40 50 60 70
2003
Year
%
Informal
Formal

14
During the social phase of banking (1969-1991), there were numerous attempts
to address the market failure problem in the credit markets especially lending to the poor
and their financial exclusion. The main foundation of the Indian Government’s
interventions in rural areas as part of its anti-poverty programs in the last four decades is
the self-employment program in rural areas called the Integrated Rural Development
Program (IRDP)9 which concentrated on providing credit (and/or subsidy) to individuals
for their self-employment activities. The program included a skill development
component and also a provision for the promotion of marketing of products/services. The
underlying assumption was that the lack of productive assets was responsible for the poor
being unable to ameliorate their lot. The other anti-poverty program in India was the rural
public works program called the National Food for Work Program. Over the years, there
were enhanced outlays on these programs. The banking system was given targets to lend
to the rural poor under priority sector credit target dispensation and sometimes promoted
through high profile ‘loan melas’. The expansion of banking system to the rural areas was
promoted through the branch licensing system under which banks which new licenses
were allowed only in semi-urban and rural areas. But this system often accentuated the
moral hazard problems in the credit market in India resulting in poor repayments and the
emergence of large non-performing assets (NPAs) in the portfolios of the
banks(especially public sector banks), consequently affecting the financial viability and
sustainability of the formal financial system. The second initiative was the expansion of
co-operative banking system in India on a large scale in the rural areas. However, the
major weakness of the credit union is the limited availability of local resources as well as
substantial non-repayment of loans which constrained its lending ability. At the informal
sector, there existed a number of insititutions similar to the Rotating Savings and Credit
Association (ROSCA) like chit funds, nidhis etc. Under this informal scheme, a group of
friends and acquaintances pool their resources to help each other in buying big-ticket
items to meet consumption and small business needs. If a member fails to meet his or her
obligations, then the rest of the group will likely bear the loss and the defaulting member
could be expelled from the group. ROSCA has the advantage of helping low-income
9 The IRDP program was launched in 1980.

15
participants but it is organized on the premise of savers eventually becoming borrowers.10
Moreover, this type of arrangement is relatively rigid because of its very limited
flexibility in loan size and timing.
After the introduction of the financial sector reforms in 1991 in India, as
discussed in the preceding paragraphs, lending to the poor especially to the priority sector
had suffered with banks reducing the small-loan accounts and showing less interest in
lending under the programs. Instead, banks were enthusiastic of keeping the shortfall in
priority sector lending in RIDF scheme. It is in this context that there is a growing
interest in alternative credit delivery mechanisms like microfinance programs. In the
delivery of small loans to the poor (micro-credit) there are five distinct approaches: In
India the National Bank for Rural Development (NABARD) and the Reserve Bank of
India (RBI) has actively promoted it by providing increasing funding to micro-finance
institutions (MFIs)11. Under the NABARD’s Self-Help Group (SHG) – Bank linkage
model (which is different from the Grameen Bank model), SHGs bring together about 10-
20 women who pool their savings for a few months, allocate them to members who need
small amounts temporarily, thus making them eligible for a bank loan.
In India, micro-credit is provided through (a) Bank-led model (Bank-SHG linkage
model) of delivery as well as through (b) Commercial model. The commercial model is
based on funding of micro-finance institutions (MFIs) which comprise of non-
governmental organizations (NGOs), non-banking financial institutions (NBFCs),
charities and co-operatives (like SEWA in Gujarat). In the commercial model, there are
two variants: (1) Bank-MFI model and (2) Partnership Model pioneered by ICICI bank12.
The SHG-Bank linkage model was introduced in 1991-92 with a pilot project of
linking 500 SHGs with banks which increased to more than 16 lakh by the end of March
2005. Cumulatively, these SHGs have accessed credit of Rs. 6,898 crore from banks 10 This is only one type of ROSCA. For other types of ROSCA encountered around the world, see The Poor and Their Money, by Rutherford (2000). 11 NABARD provides refinance to bank lending to MFIs and these are classified as priority sector lending . This method has been successful. Indeed, it is said about NABARD that it might be “the largest micro-credit program in the world with an outreach to nearly 24 million poor women” that have cumulatively received loans over Indian Rupees (Rs.) 68 billions from banks (Mahajan, 2005). 12 For a discussion of partnership model, see Mor and Ananth, 2007.

16
during the period. About 2.4 crore poor households have gained access to the formal
banking system through the programme. During the last six years the number of SHGs
linked to banks has gone up from 32,995 during 1998-99 to 16,18,476 during 2004-05.
(Chart 4).
Chart 4: Growth of the SHG-Bank linkage Programme in India: 1992-2005
02468
1012141618
1999 2000 2001 2002 2003 2004 2005
in la
khs
01234
5678
in th
ousa
nd c
rore
s
Cumulative number of SHGs linked to banks
Cumulative bank loans to SHGs
Notwithstanding the remarkable progress, geographically there has been a skewed
development of SHG-Bank linkage programme in India. It has been observed that the
programme has been more successful in the Southern States, particularly Andhra
Pradesh. This State alone accounted for 31 per cent of the total linkage at the end of
March 2005, while the northern and north-eastern region together accounted for just 7.4
per cent of the total programme. In section IV, we discuss the Kudumbashree programme
one of the alternatives to the commercial model.
17
Section IV Kudumbashree Programme in Kerala
The Kudumbashree program in Kerala comes under the Bank-SHG model where
the social intermediary is a state government entity (Kudumbashree). The Kudumbashree
program is classified as a Neighborhood Group (NHG). The main difference between
SHG and NHG is that SHGs are non-governmental, informal organizations promoted by
voluntary agencies. NHGs are promoted by the government for the upliftment of the poor
by bringing the activities of various departments into one umbrella. The Kudumbashree
programme is co-sponsored by the Government of Kerala, local bodies and UNICEF.
The origin of this program can be traced into the Urban Poverty Alleviation and Urban
Basic Services Programs which were launched during the Seventh Five Year Plan by the
Kerala Government that had a special emphasis on women and children. Kudumbashree
is a women-centered initiative against poverty that has been in operation in the state of
Kerala since 1998 in rural areas and since 2000 in urban areas. The community
development societies (CDS) system acts as a sub-system of the local government
(panchayat and municipalities) and takes decentralization of power further down to the
grassroots level13. The program was initially implemented in 13 towns in the districts of
Alleppey and Ernakulam, and later extended during the Eighth Five Year Plan to 16 more
towns and then to the entire Malappuram district. The coverage of the program was
extended to all gram panchayats in a phased manner in 2000-2001. The basic thrust of the
program is women as they are more likely to be credit constrained, have restricted access
to the wage labor market and have an inequitable share of power in household decision
making.
Principal objectives of the Kudumbashree program are (i) facilitating self-
identification of poor families through a poverty risk index, (ii) empowering the women
of the poor strata to improve their individual and collective capabilities by organizing
13 The government in India is organized in a three-tier structure: Central (federal), State (provincial) and local. The local government in India (the lower tier of the government) is divided as Corporation, Municipality and Panchayat. The classification of local government as Corporation, Municipality and Panchayat is based on population. Local governments with large population (mostly urban centers) are named as Corporation followed by Municipality and Panchayat.

18
themselves into NHGs, (iii) encouraging thrift and investment through credit by
developing community development societies to work as informal banks of the poor, (iv)
improving incomes of the poor through upgrades of vocational and managerial skills and
the creation of opportunities for self-employment and wage employment, (v) ensuring
access to basic amenities like safe drinking water, sanitary facilities, improved shelter and
healthy living environment and (vii) promoting functional literacy among the poor and
supporting continuing education. Thus, the program covers not only credit but also a
number of non-credit services (like insurance, vocational training, literacy, leadership
skills, social empowerment, etc.)14.
One unique feature of the Kudumbashree program is the method used to identify
the poor. In India, poverty estimates are based on consumption survey conducted by the
National Sample Survey Organization (NSSO) every 5 years. These figures are available
for the 1974 to 2000 period. Since the seminal work of Amartya Sen (1979, 1985, 1987),
it is increasingly recognized that poverty is a multi-dimensional phenomenon.
Kudumbashree uses this multi-dimensional concept to gauge poverty, rather than just
judging via a shortfall in income or consumption of a family. This methodology was
introduced in the early 1990s under the pilot of the Urban Basic Services Program in
Alleppey town. The Alleppey methodology is believed to be superior to the conventional
head count ratio as it captures the multi-dimensional characteristics of poverty (beyond
the simple income poverty) and leads to the identification of the most vulnerable families.
To identify the poor, Kudumbashree carries out a baseline survey with the help of
the local government. A household is considered poor if it possesses four or more of the
nine non-monetary indicators, each reflecting a different kind of deprivation (See
Annexure 1). The combination of any four risk factors provides 126 possible ways of
finding a poor household. In the case of a ‘destitute family’, all the risk factors or at least
eight out of nine are to be positive. The multi-index of poverty is based on the argument
that poverty expresses itself in multi-dimensional outcomes. The outcome indicators
relate to the various dimensions of poverty, viz., lack of food, clothing, housing, health,
14 For more details, see www.kudumbashree.org.
19
education as well as psychosocial indicators. They argue that poverty is a complex set of
instances of social exclusion that stretches out over numerous areas of individual and
collective existence. Therefore, this results in the poor being separated from the generally
accepted living patterns in society which make them unable to bridge this gap on their
own. In the literature the debate regarding measurement of poverty has been based on
resources (income) versus outcomes (living conditions).
The Kudumbashree program works under the traditional Bank-SHG model where
the NGO who does the social intermediation happens to be the state government as
shown in Chart 5. Kudumbashree units, like other micro-credit programs, start with
mobilization of thrifts. Each household contributes a minimum of Rs. 10 per month,
which form the basis of the savings pool of the NHG and these are normally deposited in
a bank in the name of the NHG. The NHG volunteers for income generations collect
thrift (small savings) from members every week. The thrift raised by the NHGs is given
back to its members as loan for meeting consumption purposes as well as for meeting
contingent needs such as medical treatment, birth delivery, death, education of children,
marriage, repayment of old debt, etc. The repayment of the loans (principal and interests)
along with regular thrifts enlarge the working fund of SHGs. Notwithstanding, the
generated working fund may not be sufficient to meet all types of credit needs for all
members. During this period, groups are expected to open a savings account with a
financial intermediary in order to meet the growing demand for credit and especially to
meet the needs of strengthening/diversification and starting of income generation
activities (like micro-enterprises). NHGs act as an effective MFI and are the grassroots
level unit of the poor women which promotes thrift among poor families.

20
Chart 5: Models of Delivery – Bank-NHG (Kudumbashree) model
Bank
Branch
NGO
SHG
Table 3: Progress of Kudumbashree Program in Kerala: 1999-2006
Informal amount of Thrift
Amount of Loan
No. of NHGs No. of ADS
No of Families Covered
(in million Rs.)
Velocity of
Internal lending
1999-00 7,538 - - 883.9 561.4 0.63 2002-03 113,675 13,423 2,210,033 1,634.9 1,695.9 1.04 2003-04 125,735 13,766 2,645,369 2,528.3 3,925.0 1.55 2004-05 147,989 13,262 2,923,425 5,330.1 13,078.7 2.45 2005-06 167,907 14,574 3,381,764 6,640.0 15,352.0 2.30
Source: Kudumbashree, Annual Report (Various issues).

21
Over the years, the number of NHGs created under the Kudumbashree program
has raised from 7,538 in 1999-2000 to 167,907 by 2005-06 (Table 3). The amount of
thrift collected from households has increased from Rs. 884 million to Rs. 6,640 million
during the same period – a nearly eight-fold increase. The amount of loan given to
households has increased of a nearly 27-fold during the same period (from Rs. 561
million in 1999-2000 to Rs. 15,352 million in 2005-06). The velocity of internal lending
(credit to thrift ratio) has dramatically improved from 0.63 in 1999-2000 to 2.3 in 2005-
06. Similarly, purpose-wise, the share of consumption which was as high as 98 percent in
1998 fell to 12 percent by 2004 – indicating a shift towards income-generation schemes
or micro-enterprises (Varma, 200715). The state government has claimed this program to
be a huge success in terms of its coverage, repayment rates (95%) as well as its income
and social impacts (Government of Kerala, 2005b). Other states have evinced interests in
this program (like Rajasthan, Andhra Pradesh, Delhi) as a model of poverty alleviation
and rural development. The success of this model along with the Micro-Credit Summit in
New York in 1997 inspired the Kerala government to extend the program to the entire
state, initially as SHGs and later under the special program “Kudumbashree” in 1998.
Another unique feature of Kudumbashree is the community participation in this
anti-poverty program. The organization of the community is based on a three-tier
structure. At the grassroots level, the poor are organized into NHGs that can rank up to 40
women members from different poor families, but generally count between 10 and 20
members. These households are usually from the same neighborhood. In the event of
some NHGs having more than 20 households, either a new NHG is formed or some
households are encouraged to join other NHGs. The poor do not form groups on their
own accord; rather they are initiated and coordinated by outsiders (either an NGO or an
elected official of the local self-government (at the panchayat level) and most often by
Kudumbashree officials. Case in point, interviews revealed that many of the present day
NHGs were found to be initially organized as SHGs (under the banner of private NGOs)
which later converted to NHGs under Kudumbashree, presumably to take advantage of
the subsidy provided by the Kudumbashree program.
15 See Varma’s article at http://www.financialexpress.com/fe_full_story.php?content_id=92310.

22
Once the NHG gets the approval of the bank, it is given a loan which can
theoretically go up to eight times the thrift mobilized by the group. From our field
experience, we found the loan to be about two to three times the thrift which the group is
able to mobilize. We also found that banks lend at a rate of interest of 8 to 10 percent
with a maturity of 3 years. However, the NHGs lend to their members adding a spread of
1.5 to 2 percent to their cost of funds from banks. The profits arising out of such mark-up
lending is shared by members of the NHGs16. Bank lending to NHGs/SHGs are classified
as priority sector lending and qualify for refinance from NABARD.
The Kudumbashree program has a subsidy element which is back-loaded in the
repayment schedule in the sense that members of NHGs receive the subsidy only after the
full repayment of bank loans sans the subsidy amount. This is presumably to prevent
willful defaults at the initial stage. The subsidy is subject to a ceiling of Rs. 100,000 with
a ceiling of Rs. 10,000 per person for each family. In the event of default of loan by the
group (which could be triggered by default of one or more of members), the group stand
to lose the subsidy. This induces the non-defaulting members of the group to make-up for
the defaults of individual members. The eligibility criteria for enjoying subsidy are that
NHGs should have undertaken the relevant training provided by
Kudumbashree/government. In fact, the subsidy variable is very crucial in the dynamics
of the repayment record as it will be discussed in the following chapters. SHGs linked
with banks do not enjoy this facility (subsidy).
The group also lends from the resources (loans) from banks to its members and
the interest rates are normally higher (10 to 60 percent). Loans are taken from banks in
the group’s name but the assets bought (like agricultural animals) are shared individually
and each member conducts his or her business individually. There are cases of loans
serving a group activity as well, but they are a minority.
16 Kudumbashree program has been criticized for charging a mark-up (profiteering). However, such profits are shared among members. Hence, the argument that it is like any other financial intermediary does not hold good.

23
In case a member defaults, she is often given some grace period to repay. The
peer-pressure built by other group members is often so much that the defaulting member
is often forced to borrow from other sources (like chit funds, moneylenders, other micro-
credit units, etc.) to repay for the loan taken from the group.
The Bank-NHG-Borrower model of Kudumbashree is most cost effective for the
ultimate borrowers. Most of the time, onlending is done without any margins being
loaded to the lending rates by the NHG. Even in cases where the NHG charges -1 to 2 per
cent margin , this money goes to the corpus fund of the NHG. In many NHGs, profits
earned out of lending are distributed to the household members as dividends.
The Kudumbashree programme is built on the facilitation and volunteer work of
(a) Kudumbashree officials and (b) volunteers working at NHG, ADS and CDS levels
along with the support of local government officials. Although members of the
Kudumbashree programme and local government is paid by the respective governments
but not counted in the social intermediation cost. The work done at the three-tier structure
of Kudumbashree programme contribute to the solidarity, cohesion, bonding of the
households are basically unremunerated. In fact, at the local level, they perform many of
the banking functions as well – upkeep of records at the bank branch level, customer
support etc. In the following section, we examine the results of the survey data of
Kudumbashree micro-enterprise programme.
Section V: Dynamics of Repayment Rate – Empirical Analysis of Kudumbashree Programme
In this chapter, we present the empirical results of primary survey conducted on
households under Kudumbashree programme in four villages (panchayat) in Kerala in
June 2006. The focus of the empirical investigation is the factors driving the high
repayment rate in micro-credit programmes like Kudumbashree.
Database
The study is based on both (a) secondary data (provided by the Kudumbashree
organization) and (b) primary data based on a survey of NHGs in four panchayats.

24
(a) Secondary Data
The economic data about the four panchayats (Thazhava and Kuluthupuzha in
Kollam district and Kumily and Peerumeedu in Idukki districts respectively) were
provided by the panchayats as well as by the Kudumbashree organization.
Concerning the information on households under NHGs, the Kudumbashree
organization maintains household level information at the ward, panchayat and at district
levels. These data provide a host of information about the socio-economic characteristics
– like age, education, level of poverty, size of the project, etc. – of the households under
the program. Besides, Kudumbashree also conducts periodic (normally annual)
evaluations (called bench-mark surveys) about changes in the socio-economic
characteristics of these households. These data provided the initial database for our
primary investigation.
(b) Primary Data
A survey of households NHGs under the Kudumbashree program was done in
four different panchayats (Thazhava and Kuluthpuzha in Kollam district and Kumily and
Peerumeedu in Idukki district) of Kerala in June 2006. All the four panchyats are
predominantly rural and agriculture based for livelihood and broadly reflects the
economic structure of Kerala economy. Even in the Kudumbashree programme, more
three-fifths of their outreach is in rural areas. The basic data on households under NHGs
under the micro-credit programme is maintained by the Kudumbashree organization(at
the regional and district level). These data formed the base for our initial investigation.
First, we stratified all households under NHGs under the different wards in a panchayat
into those undertaking micro-enterprises and those undertaking other activities. Then, we
selected 50 households each from each panchayat having micro-enterprises using a
simple random number table. Thus, we covered 200 households from each four
panchayats. This sample represents approximately around 10 per cent of the households
under micro-enterprise programme. We collected the data through a structured
questionnaire. While designing the questionnaire, we consulted the focus groups
(Kudumbashree officials, NHGs, banks etc). Households were interviewed individually
as well as in a group so as to cross-validate the data. The focus of the investigation is the
dynamics of repayment rate and social impacts. In order to gauge their performance, we
25
supplemented the data wherever possible from the surveys conducted by the
Kudumbashree district offices. We chose these panchayats for the study as they (NHGs)
had a fairly good record of existence (2 – 4 years) and because of the fact that they are in
the south and central parts of Kerala which reflects the geographical diversity of the state.
We did not choose any households from NHG from the northern part of Kerala as they
were relatively new (of less than two years of existence).
Table 4 : Basic Parameters of the Sample Sl no.
Parameters Thazhava (Kollam)
Kuluthupuzha (Kollam)
Peerumeedue (Idukki)
Kumily (Idukki)
1
Total Area (Sq. Kms.) 23.58 424.06 114.75 795.28
2 Total Population 38,488 34,376 25768 34,558 Male 18,347 16176 12837 17,377 Female 20,141 18,200 12931 17,181
Sex Ratio (Female to Male Ratio)
1097 1125 1017 988
3 Density of population per square kilometers
1,632 81 225 42
4 Literacy rate Male 93.8 85.0 91 79.05
Female 85.9 79.0 78 71.07
5 Total Number of Families 9,005 8193 6398 8060 No of BPL Families 5,501 3686 3,198 4,251
% of BPL Families 61 45 50 52
6 (a)No of families covered under Kudumbashree
5,515 2389 2242 6,820
(b) % coverage
81 65 70 84
7 Amount of thrift (in million Rupees)
119.9 20.59 0.75 171.1
8 Amount of Loan (in million Rupees.)
350.5 23.12 0.43 379.2
9 Velocity of internal lending 2.92 1.12 0.57 2.22 Source: Kudumbashree and Lead Banks17 of these districts.
17 In India, a bank is assigned the status of lead bank in a district. The bank designated as the lead bank has the task of assuming leadership role rural lending programs in the district (called as Lead Bank program).
26
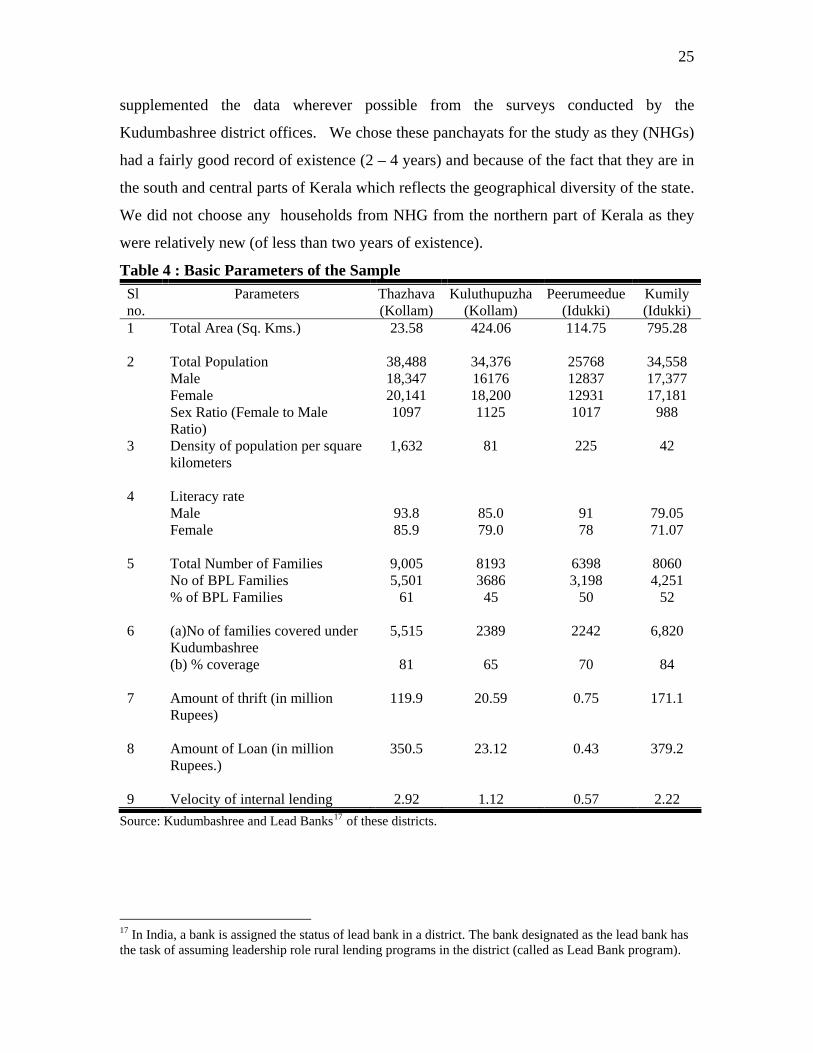
The basic economic and social parameters of the panchayats in the sample is
given in Table 4. As is evident from Table 4, the economic and social characteristics of
the four panchayats is quite varied. The density of population in Thazhava panchayat is
quite high (1632) as compared with other panchayats. In most the panchayats the sex
ratio is favourable to female (except Kumily) as is the general pattern in the state of
Kerala. It may be recalled Kerala is one of the few states in India where women
outnumber men.
The literacy rate (both female and male) in all the panchayats in the sample are
high reflecting the literacy status of the state (Kerala). But the number of families below
the poverty line (BPL) is relatively high in all panchyats (in the range of 45 to 61 per
cent). The coverage of Kudumbashree programme of these BPL families is also relatively
high (65 to 84 per cent). A crude indicator of the intensity of Bank-NHG-borrower
relationship is the ratio of thrifts (savings) to bank loan: a ratio of one would indicate that
for every one rupee saved by these groups, it gets an additional one rupee loan from the
banking system. This ratio is relatively high except for Peerumeedu panchyat.
In all the panchyats the households under Kudumbashree programme were wage
labourers and micro-enterprises was an income supplementing activity. The lack of
adequate employment activity (in rural areas) is the primary reason for their poverty:
most of them could hardly manage to get five days of wage labour in a month.
Methodology
The data is analyzed using descriptive statistics – measures of central tendency
and measures of dispersion (like range, standard deviation, variance, etc.). In order to
facilitate a more meaningful analysis, we supplemented the descriptive statistics with
analytical data analysis.

27
Table: 5: Basic Descriptive Statistics of the Sample Statistics Total
investment Bank Borrowing
Borrowing from other sources
Average interest burden
Gross income
Net income
Minimum 16,000 6,400 0 960 10,000 -78,560Maximum 31,000 12,400 2,60,000 94,560 4,00,000 3,27,040Range 15,000 6,000 2,60,000 93,600 3,90,000 4,05,600Mean 26,440 10,566 24,706 10,101 36,095 25,994Median 30,000 12,000 6,000 3600 27,500 19,220Mode 30,000 12,000 6,000 960 21,000 1,560Standard Deviation 4798 1917 34,128 12193 34875 34558Kurtosis -1.26 -1.27 15.03 15.25 65.91 36.78Skewness -0.72 -0.71 2.97 2.97 7.04 4.67
Source: Sample Survey
Descriptive Statistics of the Sample
The median loan size of households in the sample is estimated at Rs.12,000
(Table 5).. This comes to around 40 per cent of the total investment in micro-enterprise.
The median size of ‘borrowing from other sources’ (which include institutional and non-
institutional sources) at Rs.6,000 is nearly one half of bank borrowing and comes to 20
per cent of the total investment. The median interest burden at Rs.3,600 per household
comes to 20 per cent of the median total borrowing (banks plus other sources).
The median net income of households in the sample at Rs.19,220 is estimated to
yield a rate of return (to total investment) of 64 per cent per annum. However the range in
net income among households are quite varied. The least(minimum) was a negative of
Rs. 78,560 and maximum of Rs.3,27,040 which shows that the net income among
households in the sample varies quite widely. This is also evident from the high standard
deviation for this variable in the sample.
28
Empirical Analysis Repayment Rate and its Determinants
Repayment Rate: Sector-wise Performance
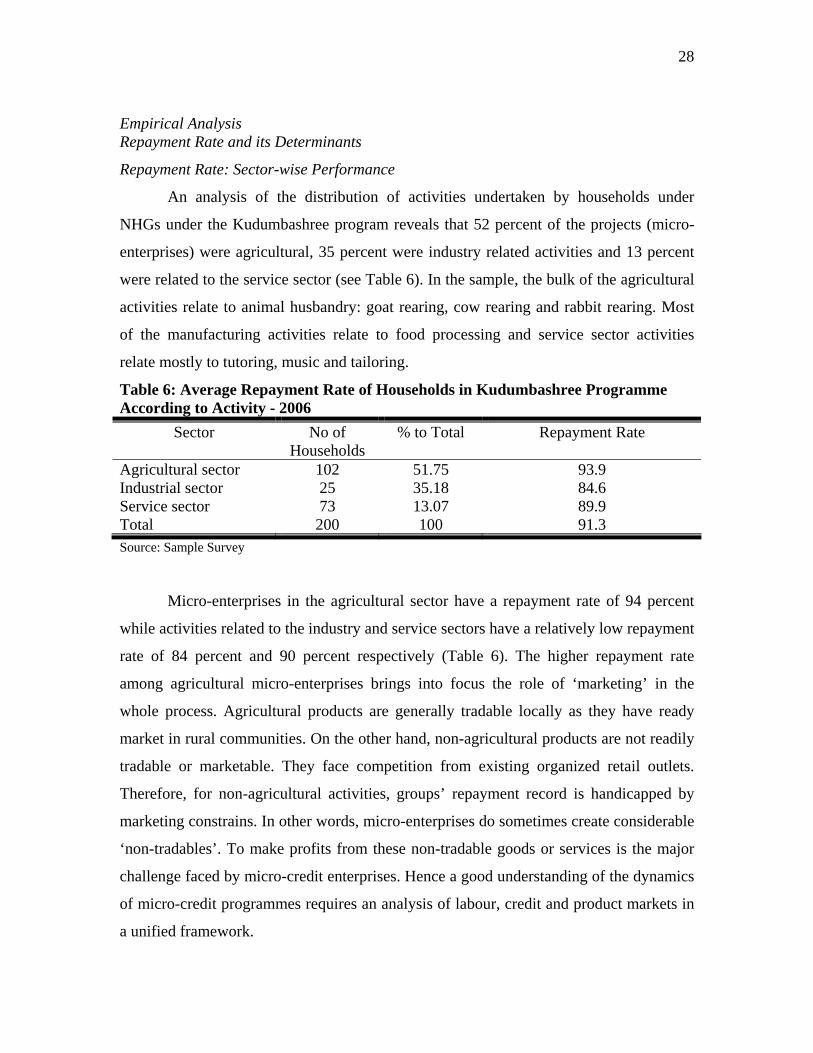
An analysis of the distribution of activities undertaken by households under
NHGs under the Kudumbashree program reveals that 52 percent of the projects (micro-
enterprises) were agricultural, 35 percent were industry related activities and 13 percent
were related to the service sector (see Table 6). In the sample, the bulk of the agricultural
activities relate to animal husbandry: goat rearing, cow rearing and rabbit rearing. Most
of the manufacturing activities relate to food processing and service sector activities
relate mostly to tutoring, music and tailoring.
Table 6: Average Repayment Rate of Households in Kudumbashree Programme According to Activity - 2006
Sector No of Households
% to Total Repayment Rate
Agricultural sector 102 51.75 93.9 Industrial sector 25 35.18 84.6 Service sector 73 13.07 89.9 Total 200 100 91.3 Source: Sample Survey
Micro-enterprises in the agricultural sector have a repayment rate of 94 percent
while activities related to the industry and service sectors have a relatively low repayment
rate of 84 percent and 90 percent respectively (Table 6). The higher repayment rate
among agricultural micro-enterprises brings into focus the role of ‘marketing’ in the
whole process. Agricultural products are generally tradable locally as they have ready
market in rural communities. On the other hand, non-agricultural products are not readily
tradable or marketable. They face competition from existing organized retail outlets.
Therefore, for non-agricultural activities, groups’ repayment record is handicapped by
marketing constrains. In other words, micro-enterprises do sometimes create considerable
‘non-tradables’. To make profits from these non-tradable goods or services is the major
challenge faced by micro-credit enterprises. Hence a good understanding of the dynamics
of micro-credit programmes requires an analysis of labour, credit and product markets in
a unified framework.

29
Repayment Rate and Poverty
The Kudumbashree program considers households between four and five to be
moderately poor while households having a score of six or higher were considered
severely poor. The average poverty score of households in the sample was five. An
analysis of the repayment record based on poverty score reveals interesting results. The
severe poor (with poverty score of six and above) had a comparatively lower repayment
rate (86.1 percent) as compared with the moderate poor (92.5 percent) (Table 7). This
evidence shows that severity of poverty was not a significant factor explaining repayment
behaviour of households under Kudumbashree programme.
Table 7: Average Repayment Rate of Households in Kudumbashree Programme According to Poverty Score - 2006
NHGs Poverty Score Repayment rate Number % to total
4 – 5 92.3 166 83 6 and above 86.1 34 17
Source: Sample Survey
Repayment Rate and Group Meetings
Another effect of the weekly meetings is that they act as a formal mechanism to
document their group and social interactions. Group members formally interact with each
other through these meetings. The agenda for each meeting includes discussions on thrift,
amount of loan, norms for loan disbursal, etc., that are recorded. These documents act as
evidences of their in-group solidarity and mutual insurance for lenders (banks).
Group meetings provide an opportunity to assess the repayment of its members.
Individual defaults are easily identified and discussed collectively. One can identify two
types of peer pressure working on individual defaulters – ex-ante and ex-post peer
pressure. The ex-ante peer pressure reinforces an individual’s desire to repay her portion
of the loan. Normally defaulting members are given a grace period and are encouraged to
find alternative sources of funds. If the individual is not in a position to repay, the group
can then exert ex-post pressure. The ex-post pressure can take a number of forms
including village gossip, social boycott, seizure of assets, etc. The empirical evidence
reported in Table 8 shows that repayment record of those households who attend group
meetings regularly is better than those with irregular attendance.

30
Table 8: Average Repayment Rate of Households in Kudumbashree Programme According to their presence in Mandatory Meetings - 2006
NHGs Presence to the meetings Repayment Rate (%) Number of NHGs % to total
Regular attendance 92.8 115 57.5 Irregular attendance 89.3 85 42.5 Average and total 91.3 200 100 Source: Sample Survey
Pre-Repayment of the Loan
An analysis of the repayment record of borrowers under the Kudumbashree
program in the sample reveal that about 30 percent of households under NHGs had pre-
repayment, i.e. they were ahead of their repayment schedules. It is important to analyze
the reasons for this pre-repayment. Although this is an intriguing financial behavior, it
can easily be explained with the two positives incentives provided by Kudumbashree: (a)
to secure future loans – the contingent renewal explanation and (b) pre-repayment
enables the borrowing households to secure subsidies earlier18.
The promise of securing a higher future loan acts as a powerful incentive to fully
repay their loan. As evident from Table 3 the internal velocity of households’ credit
under Kudumbashree program was more than 2. This implies that they are able to secure
loans more than their thrift from banks. In fact, some of the households in the sample
were at their second loan from banks.
Competitive Microfinance
The issue of competitive microfinance is widely discussed in the literature and is
of recent origin (Besley and Coate, 1995; Marquez, 2002; McIntosh, Janvry and
Sadoulet, 2005, McIntosh & Wydick, 2005). Competitive microfinance occurs when
multiple lenders exist and they are overlapping in their geographical area. In such a
situation many borrowers may be taking loans from several lenders simultaneously or
‘double dipping’. Double dipping is meant to smoothen the timing of the repayment of
loans and to maintain cash flow. In the presence of double dipping, the ability of the 18 It must be noted that subsidies are treated in the installment of the loan.

31
lenders to use dynamic incentives to secure repayment is limited (McIntosh, Janvry and
Sadoulet, 2005, McIntosh & Wydick, 2005).
In our sample, NHGs members are often found to be members of other
microfinance programs as well. In fact, 50 percent of households were found to also be
members of other microfinance entities that are competing on the same geographical
area19. Apart from other microfinance entities, many households were found to be
borrowing from other non-bank entities that have higher interest rates (money lenders,
chit funds, etc.) to repay their loans. This cross borrowing situation could lead to a high
repayment of their borrowings with the Kudumbashree program. However, by availing
cross financing, the financial indebtedness only worsens. The fact that many
microfinance programs (especially agricultural based) generate surplus in net income
underscores the utility of the program despite of some borrowers availing of cross
financing and indulging in double dipping.
Section VI Conclusion
The policy regime with respect to financial inclusion in India has undergone
dramatic changes since 1950s. The nationalization of major banks in India in 1969 and
the consequent social banking phase placed financial inclusion and economic
development as the cornerstone of Indian economic planning. This regime was essentially
supply-oriented and the focus was to link credit planning with national economic
planning. The economic reforms since 1992 with emphasis on deregulation and
efficiency had led severe credit starvation of the poor, rising indebtedness of farmers and
farmer suicides.
The scaling up of microfinance on an accelerated platform since 1992 under
Bank-SHG model was step to replace the state activism in the pre-1992 period with
enhanced role for private sector in credit delivery for the poor. Although the outreach of
Bank-SHG programme has increased substantially in the post-1992 period, it has
19 Kudumbashree evolves in an environment where several microfinance programs are competing against each other. This competition situation is normally one that lowers the repayment rate as it is suspected to raise the level of indebtedness of the borrowers (Wright and Rippey (2003), Vogelgesang (2001) and McIntosh and Wydick (2005).

32
generated considerable issues in the course of its outreach. One of the issues is the large
scale borrower revolt (especially in the state of Andhra Pradesh which has the highest
microfinance penetration) on the ground of usurious interest rates charged by MFIs. An
alternative model of delivery to the commercial model is the Kudumbashree program in
Kerala.
The poverty eradication mission called Kudumbashree is a women-centered anti-
poverty program initiated in 1998 by the Government of Kerala, in India. Based on a
primary survey of two hundred households in four communities in Kerala, the study
examines the dynamics of high repayment rate. The motivation for seeking micro-credit
is the lack of adequate employment in the rural sector. The access to micro-credit is part
of the endeavour of the household to supplement wage income. This income
supplemental (micro-credit) activity is performed by members of the household
individually or as a group(of households). Repayment rate is not a good indicator of
performance of micro-credit activities as it conceals the dynamic interaction of labour,
credit and product markets in a rural setting.
Micro-enterprises do create considerable non-tradables (output which cannot be
marketed). This would have implication for repayment rate. Micro-enterprises which are
agriculture based have high repayment record as opposed to non-agricultural micro-
enterprises. Non-agricultural micro-enterprises have substantial marketing problems
which lead to default, non-repayment or low repayment of loans.
Most of the households (around 50 percent) were found to have multiple
memberships in other micro-credit organizations. This enables them to double dip and to
smoothen the timing of the repayment. Thus, the availability of funds from other micro-
credit organizations raises questions about whether micro-credit reduces the vulnerability
of the poor. It is suffice to say that the availability of micro-credit widens the borrowing
possibilities of the poor. In the absence of positive returns from micro-enterprises (as in
the case of many non-agricultural activities), it could lead to more indebtedness among
borrowers. Households were also found to borrow outside the micro-credit set up from
informal sector (like moneylenders, local chit funds, etc.). Thus, the repayment record

33
per se does not reveal the true picture of micro-enterprises.Micro-credit programs like
Kudumbashree should not be solely judged in terms of repayment records, it should also
be judged in terms of its social impacts which we are addressing in a separate paper.

34
Annexure 1: Nine Points Poverty Index Rural Urban 1 Family with no land /less than 10 cents of
land. 1 Families with no/limited (less than 5
cents) of land. 2 Family with no house/dilapidated house. 2 Family with no house/dilapidated
house. 3 Family with no access to sanitary latrines. 3 No access to safe drinking water
(within 150 meters). 4 No access to safe drinking water (within
300 meters). 4 No access to sanitary latrine.
5 Women headed household/presence of widow, divorcee/abandoned lady/unwed mother.
5 Family with no stable employment (less than 10 days in a month).
6 Family with no regularly employed person.
6 Family with women as the breadwinner and/or women who is widowed/divorced or family with unwed mother.
7 Family who has a physically challenged/mentally challenged/chronically ill member.
7 Family who is physically challenged/mentally challenged/other disabilities
8 Socially disadvantaged groups like Scheduled Caste/Scheduled Tribe.
8 Socially disadvantaged groups like Scheduled Caste/Scheduled Tribe.
9 Families with an illiterate adult member. 9 At least a member of the family is addict to alcohol or drug.*
* Since 2000, this criterion was replaced with “Family with no color T.V”. Source: Government of Kerala, 2005c; Kudumbashree website.

35
References
Abrams, J. and Damian von Stauffenberg (2007) Loan Reversal: Are Public Development
Instituions Crowding Out Private Investments in Microfinance?, MicroRate, February.
Sen, A. K. (1979) ‘Personal Utilities and Public Judgement: or What’s Wrong with
Welfare Economics’, Economic Journal, 89, pp.537-58. ---------(1985) Commodities and Capabilities. Amsterdam: North-Holland. ---------(1987) ‘The Standard of Living: Lecture II, Lives and Capabilities’, The Standard
of Living, Ed. G. Hawthorn, 20-38. Cambridge: Cambridge University Press. Anand, J. S (2002) ‘Self-Help Groups in Empowering Women: Case Study of Selected
SHGs and NHGs’, Discussion Paper No. 38, Centre for Development Studies, Thiruvanthapuram.
Armendariz de Aghion, Beatriz (1999) ‘On the Design of a Credit Agreement With Peer
Monitoring’, Journal of Development Economics, 60, pp.79-104. Armendariz de Aghion, Beatriz and Jonathan Murdoch (2005) The Economics of
Microfinance. Cambridge, M.A: MIT Press. Banerjee, A, Timothy Besley and Tomothy Guinnane (1994) ‘The Neighbor’s Keeper:
The Design of a Credit Cooperative with Theory and a Test’, Quarterly Journal of Economics, 109, pp. 491-515.
Basu, P and Pradeep Srivastava (2005) ‘Exploring Possibilities: Microfinance and Rural
Credit Access for the Poor in India’, Economic and Political Weekly, 40, pp. 1747-1755.
Becker, Gary (1991) A Treatise on the Family. Cambridge, Harvard University.
Besley, T and Stephen Coate (1995) ‘Group Lending: Repayment Incentives and Social
Collateral’, Journal of Development Economics, 46, pp: 1-18.
Conning, J (1996) Group Lending, Moral Hazard and the Creation of Social Collateral. IRIS working Paper #165. University of Maryland at College Park: Center for Institutional Reform and the Informal Sector.
Copestake, J, Sonia Bhalotra and Susan Johnson (2001) ‘Assessing the Impact of
Microcredit: A Zambian Case Study’, Journal of Development Studies, 37, pp. 81-100.

36
Cull, R, Asli Demigüt-Kunt and Jonathan Murdoch (2006) ‘Financial Performance and Outreach: A Global Analysis of Leading Microbanks.’ World Bank Policy Research Working Paper. Washington D.C.: The World Bank.
Devika, J and Binitha V. Thampi (2007) ‘ Between ‘Empowerment’ and ‘Liberation’:
The Kudumbashree Initiative in Kerala’, Indian Journal of Gender Studies, 14, pp.33-60.
Dowla, A and Dipal Barua (2006) The Poor Always Pay Back: The Grameen II Story.
Bloomfield (USA): Kumarian Press Inc. George, K.K. (1993) Limits to Kerala Model of Development: An Analysis of Fiscal
Crisis and Its Implication. Center for Development Studies, Thiruvananthapuram. ---------(1998) ‘Historical Roots of the Kerala Model and its Present Crisis’, Bulleting of
Concerned Asian Scholars, 30, pp.35-40. Ghatak, M (1999) ‘Group Lending, Local Information and Peer Selection’, Journal of
Development Economics, 60 , pp.27-50. ---------(2000) ‘Screening by the Company You Keep: Joint Liability Lending and the
Peer Selection Effect’, Economic Journal, 110, pp.601-631. Ghatak, M and Timothy W. Guinnane (1999) ‘The Economics of Lending with Joint
Liability: Theory and Practice’, Journal of Development Economics, 60, pp. 195-228.
Ghate, P (2007a) Microfinance in India – A State of the Report, 2006, Microfinance
India, New Delhi. _____(2007b) Indian Microfinance: The Challenges of Rapid Growth, New Delhi, Sage. Government of Kerala (1996) Kerala Economic Survey 1995-96. Thiruvananthapuram:
State Planning Board. ---------(2005a) Economic Review 2004-2005. Ministry of Finance, Thiruvanthapuram. ---------(2005b) Human Development Report 2005. Thiruvananthapuram, State Planning
Board. ---------(2005c) Statistics for Planning 2005. Thiruvananthapuram: State Planning Board. --------(2006) Draft Approach Paper for Kerala’s Eleventh Five Year Plan, State
Planning Board, Thiruvananthapuram. Hoff, K and Joseph Stiglitz (1993) ‘Imperfect Information and Rural Credit Market:
Puzzles and Policy Perspectives’, in The Economics of Rural Organization, eds. Karla Hoff, Avishay Braverman and Joseph Stiglitz. Oxford: Oxford University Press.
37
Husain, M (1998) Poverty Alleviation and Empowerment – The Second Impact Assessment Study of BRAC’s Rural Development Programme. BRAC, Research and Evaluation Division, Bangladesh.
Jeromi, P.D (2007) ‘Farmers’ Indebtedness and Suicides: Impact of Agricultural Trade
Liberalisation in Kerala’, Economic and Political Weekly, 42, pp.3241-3247. John, M.S and Jos Chathukulam (2002) ‘Building Social Capital Through State
Initative:Participatory Planning in Kerala’, Economic and Political Weekly, 37, pp. 1939-1948.
Kadiyala, S (2004) Scaling Up Kudumbashree – Collective Action for Poverty Alleviation
and Women’s Empowerment. Food Consumption and Nutrition Division, FCND Discussion Paper No.180, Washington D.C.: International Food Policy Research Institute.
Kannan, K.P. (1990) ‘Kerala Economy at the Crossroads?’ Economic and Political
Weekly, 25, pp.1951-1956. Khalily, B, MA Taslim, MO Imam and SA Khan (2002) Impact of formal bank credit on
agricultural production in Bangladesh. Bangladesh Bureau of Business Research and Bangladesh Agricultural research Council.
Khandker S. R. (1998) ‘Microcredit Program Evaluation: A Critical Review’, IDS
Bulletin, 29, pp.11-20.
Khandker, S. R., Baqui Khalily and Zahed Khan (1995) Grameen Bank: Performance and Sustainability, Discussion Paper No.306, Washington D.C: The World Bank.
Madajewicz, M (1998) Capital for the Poor: The Effect of Wealth on the Optimal Loan
Contract. Working Paper. Stockholm: Stockholm School of Economics. Mahajan, Vi (2005) ‘From Microcredit to Livelihood Finance’, Economic and Political
Weekly, 60, pp. 4416-4419.
McIntosh, C and Bruce Wydick (2005) ‘Competition and Microfinance’, Journal of Development Economics, 78, pp.271-298.
McIntosh, C, Janvry, Alain de and Elisabeth Sadoulet (2005) ‘How Rising Competition
Among Microfinance Institutions Affects Incumbent Lenders’, The Economic Journal, 115, pp.987-1004.
Mor, N and Bindu Ananth (2007) ‘Inclusive Financial Systems: Some Design Principles
and a Case Study’, Economic and Political Weekly, 42, pp.1121-1126.

38
Marquez, R (2002) ‘Competition Asymmetric Information, and Information Dispersion
in the Banking Industry’, Review of Financial Studies, 15, pp. 901-926.
MkNelly, B and Christopher Dunford (1998) Impact of Credit with Education on Mothers and their young Children’s Nutrition: Lower Bra Rural Bank Credit with Education Program in Ghana. Freedom for Hunger Research Paper No.4. Davis, CA: Freedom for Hunger
---------(1999) Impact of Credit with Education on Mothers and their young Children’s Nutrition: CRECER Credit with Education Program in Bolivia. Freedom for Hunger Research Paper No.5. Davis CA: Freedom for Hunger.
Mosley, P (2001) ‘Microfinance and Poverty in Bolivia’, Journal of Development Studies, 37, pp.101-132.
Mustafa S, I Ara, D Banu, A Hossain, A Kabir, M Mohsin, A Yusuf and S Jahan (1996)
Beacon of Hope: An Impact Assessment Study of BRAC's Rural Development Program. BRAC, Research and Evaluation Division, Bangladesh
Nair, T.S (2001) ‘Institutionalising Microfinance in India: An Overview of Strategic
Issues’, Economic and Political Weekly, 36, pp.399-404. Pat, A.K. (2005) ‘Kudumbashree: A Poverty Eradication Mission in Kerala’, Economic
and Political Weekly, 40, pp. 4991-4992. Pitt, M and Shahidur Khandker (1998) ‘The Impact of Group-Based Credit Programs on
Poor Households in Bangladesh: Does the Gender of Participants Matter?’ Journal of Political Economy, 106, pp.958-996.
Rai, A. S. and Thomas Sjöström (2004) ‘Is Grameen Lending Efficient? Repayment
Incentives and Insurance in Village Economies’, Review of Economic Studies, 71: pp.217-234.
Ray, D. (1999) Development Economics. New Delhi: Oxford University Press. Reserve Bank of India, Banking Statistics (Various Issues), Mumbai: Reserve Bank of
India. ---------Handbook of Indian Economy (Various Issues) Mumbai: Reserve Bank of India. --------- Report on Trend and Progress of Banking in India(Various Issues), New Delhi. ---------(1991) Report of the Committee on the Financial System (Chairman, M.
Narasimham). Mumbai: Reserve Bank of India. Rutherford, S (2000) The Poor and Their Money. Oxford: Oxford University Press.

39
Shetty, S..L (1978) ‘ Performance of Commercial Banks Since Nationalisation of Major Banks’, Economic and Political Weekly, 13, pp.31-33.
_____(1997) ‘Financial Sector Reforms in India: An Evaluation’, Prajnan, 25, 3-4, pp.253-287.
_____(2005) ‘Regional, Sectoral and Functional Distribution of Bank Credit’, in Ramachandran, V.K and Madhura Swaminathan (Ed) (2005) Financial Liberalisation and Rural Credit in India, New Delhi, Tulika Books, pp.50-109.
Shylendra, H.S. (2006) ‘Microfinance Institutions in Andhra Pradesh: Crisis and
Diagnosis’, Economic and Political Weekly, 41, pp. 1959-1963.
Stiglitz, J.E (1990) ‘Peer Monitoring and Credit Markets’, World Bank Economic Review, 4, pp.351-366.
Stiglitz, J.E and Andrew Weiss (1981) ‘Credit Markets in Credit with Imperfect
Information’, American Economic Review, 71, pp. 393-410. Swaminathan, M (2007) ‘The Micro-credit Alternative?’, Economic and Political
Weekly, 42, pp.1171-1175. Tharamangalam, J (1998) ‘The Perils of Social Development Without Growth: The
Development Debacle of Kerala, India’, Bulletin of Concerned Asian Scholars, 30, 1: 23-34.
Tassel, Van E. (1999) ‘Group-Lending Under Asymmetric Information’,Journal of
Development Economics, 60, pp. 3-25. Todd, H (1996) Women at the Center: Grameen Bank Borrowers After One Decade.
Boulder, CO.: Westview Press. ---------(2000) Poverty Reduced through Microfinance: The Impact of ASHI in
Philippines. Washington, D.C.: USAID. Vaidyanathan, A (2006) ‘Farmers’ Suicides and the Agrarian Crisis’, Economic and
Political Weekly, 41, pp.4009-4013.
Varian, H(1990) ‘Monitoring Agents with Other Agents’ Journal of Institutional and Theoretical Economics, 146, 153-174.
Vogelgesang, U (2001) ‘Microfinance in Times of Crisis: The Effects of Competition,
Rising Indebtedness, and Economic Crisis on Repayment Behavior’, World Development, 31, pp. 2085-2114.
World Bank (1997) World Development Report 1997. Washington, D.C.: The World
Bank. ---------(2001) World Development Report, 2000-01, Attacking Poverty. New York:
Oxford University Press.

40
Wright, G.A.N. and Paul Rippey (2003) ‘The Competitive Environment in Uganda:
Implications for Microfinance Institutions and their Clients’, MicroSave September.
Zohir, S, S Mahmud, B Sen, M Asaduzzaman, J Islam, N Ahmed and AA Mamun (2001)
Monitoring and Evaluation of Microfinance Institutions. Final Report, Bangladesh: Bangladesh institute of Development Studies.