michigan's 2019 ambient air monitoring network review · michigan department of environmental...
TRANSCRIPT

Michigan Department of Environmental Quality Air Quality Division June 27, 2018
Michigan’s 2019 Ambient Air
Monitoring Network Review

Cover picture courtesy of Lisa K. Brennan, Lake Michigan near Montague, Michigan. THE DEPARTMENT OF ENVIRONMENTAL QUALITY PROVIDES EQUAL OPPORTUNITIES FOR EMPLOYMENT AND FOR ACCESS TO MICHIGAN’S NATURAL RESOURCES. STATE AND FEDERAL LAWS PROHIBIT DISCRIMINATION ON THE BASIS OF RACE, COLOR, NATIONAL ORIGIN, RELIGION, DISABILITY, AGE, MARITAL STATUS, OR SEX UNDER THE CIVIL RIGHTS ACT OF 1964 AS AMENDED, MICHIGAN (MI) PA 453 AND MI PA 220, TITLE V OF THE REHABILITATION ACT OF 1973 AS AMENDED, AND THE AMERICANS WITH DISABILITIES ACT. FOR INFORMATION OR ASSISTANCE REGARDING THIS PUBLICATION, CONTACT THE MICHIGAN DEPARTMENT OF ENVIRONMENTAL QUALITY, AIR QUALITY DIVISION, P.O. BOX 30260, LANSING, MI 48909-7760.
Printed by authority of the Michigan Department of Environmental Quality Current print costs are: $0.46 per page
Michigan Department of Environmental Quality

PAGE i
TABLE OF CONTENTS
Page Introduction ............................................................................................................................... 1 Federal Changes ............................................................................................................. 1 Recommendations for Michigan’s Air Monitoring Network in 2019 ................................... 2 Network Review Goals .................................................................................................... 3 Public Comment Process ................................................................................................ 4 Ambient Air Monitoring Network Requirements ........................................................................... 5 Other Monitoring Network Requirements ......................................................................... 7 Network Review Requirements ....................................................................................... 8 Monitor Deployment by Location ..................................................................................... 8 Quality Assurance ......................................................................................................... 10 Lead Monitoring Network .......................................................................................................... 11 Background ................................................................................................................... 11 The 2008 Lead NAAQS ................................................................................................. 11 Point Source-oriented Monitoring .................................................................................. 12 Non-source-oriented / NCore Monitoring Network Design .............................................. 12 Lead Co-location Requirements .................................................................................... 12 Waiver(s) From Lead Monitoring ................................................................................... 16 Lead Quality Assurance ............................................................................................... 16 Plans for the 2019 Lead Monitoring Network ................................................................. 16 NCore Monitoring Network ........................................................................................................ 18 Network Design ............................................................................................................. 18 Michigan NCore Sites .................................................................................................... 18 NCore Quality Assurance ............................................................................................. 19 Plans for the 2019 NCore Monitoring Network ............................................................... 19 Ozone Monitoring Network ........................................................................................................ 23 Ozone Season and Modeling ........................................................................................ 30 Ozone Quality Assurance .............................................................................................. 30 Plans for the 2019 Ozone Monitoring Network ............................................................... 31 PM2.5 FRM Monitoring Network ................................................................................................. 32 PM2.5 Quality Assurance ................................................................................................ 38 Plans for the 2018-2019 PM2.5 FRM Monitoring Network ............................................... 38 Continuous PM2.5 Monitoring Network ....................................................................................... 40 Continuous PM2.5 TEOM and FEM BAMs Quality Assurance ........................................ 42 Plans for the 2019 Continuous PM2.5 TEOM and FEM BAMs Network .......................... 43 Speciated PM2.5 Monitoring Network ......................................................................................... 44 Continuous Speciation Measurements .......................................................................... 44 Speciation Quality Assurance ........................................................................................ 44 Plans for the 2019 PM2.5 Speciation Monitoring Network ............................................... 47 PM10 Monitoring Network .......................................................................................................... 48 PM10 Quality Assurance................................................................................................. 51 Plans for the 2019 PM10 Monitoring Network ................................................................. 51 Carbon Monoxide Monitoring Network ...................................................................................... 52 CO Quality Assurance ................................................................................................... 52 Plans for the 2019 CO Monitoring Network .................................................................... 52

PAGE ii
TABLE OF CONTENTS
Page Nitrogen Dioxide and NOY Monitoring Network ......................................................................... 55 Tier 1: Near-roadway NO2 Monitors – Phase 2 .............................................................. 56 Tier 2: Area-wide NO2 Monitors ..................................................................................... 57 Tier 3: NO2 Monitors for Susceptible and Vulnerable Populations ................................. 58 NO2 Monitoring for NSR ................................................................................................ 58 NOy Monitoring .............................................................................................................. 58 NO2 and NOY Quality Assurance ................................................................................... 59 Plans for the 2019 NO2 and NOY Monitoring Network .................................................... 59 Sulfur Dioxide Monitoring Network ............................................................................................ 62 SO2 Monitoring and Modeling Requirements ................................................................. 64 SO2 Quality Assurance .................................................................................................. 64 Plans for the 2019 SO2 Monitoring Network ................................................................... 65 Trace Metal Monitoring Network ............................................................................................... 68 Trace Metal Quality Assurance ...................................................................................... 71 Plans for the 2019 Trace Metal Monitoring Network ...................................................... 71 Volatile Organic Compound Monitoring Network ....................................................................... 72 VOC Quality Assurance ................................................................................................. 72 Plans for the 2019 VOC Monitoring Network ................................................................. 72 Carbonyl Monitoring Network .................................................................................................... 74 Carbonyl Quality Assurance .......................................................................................... 74 Plans for the 2019 Carbonyl Monitoring Network ........................................................... 75 Polynuclear Aromatic Hydrocarbon Monitoring Network ............................................................ 78 PAH Quality Assurance ................................................................................................. 78 Plans for the 2019 PAH Monitoring Network .................................................................. 78 PAMS Network .......................................................................................................................... 80 Network Decision .......................................................................................................... 80 Auto GC Decision .......................................................................................................... 80 Meteorology Measurements Decision ............................................................................ 80 Other Required Measurements ..................................................................................... 80 Meteorological Measurements .................................................................................................. 81 Meteorological Equipment Quality Assurance ................................................................ 81 Plans for the 2019 Meteorological Monitoring Network .................................................. 81 Special Purpose Monitors ......................................................................................................... 85 Adequacy of Michigan’s Monitoring Sites .................................................................................. 87 Appendix A: Acronyms and Their Definitions ........................................................................... 88 Appendix B: Summary of Comments Received and Replies .................................................... 90 Appendix C: Written Comments Received ............................................................................... 91

PAGE iii
List of Tables
Page 1 Composition of Core-based Statistical Areas in Michigan ................................................ 6 2 Composition of Micropolitan Statistical Areas in Michigan ............................................... 7 3 Monitor Distribution Throughout the 2018-2019 Network in Michigan .............................. 9 4 Deployment Schedule for Lead Sites and Calculation of the Total Number of Co-located Lead Sites ............................................................................................... 13 5 Michigan’s Lead Monitoring Network ............................................................................. 14 6 Measurements Collected at the Grand Rapids–Monroe St. (260810020) NCore Site .... 20 7 Measurements Collected at the Allen Park (261630001) NCore Site ............................. 21 8 Michigan’s NCore Monitoring Network ........................................................................... 22 9 SLAMS Minimum Ozone Monitoring Requirements ....................................................... 23 10 Application of the Minimum Ozone Requirements in the October 17, 2006 Final Revision to the Monitoring Regulation to Michigan’s Ozone Network ............................ 24 11 Michigan’s Ozone Monitoring Network .......................................................................... 28 12 PM2.5 Minimum Monitoring Requirements ...................................................................... 32 13 Application of the Minimum PM2.5 Monitoring Requirements in the October 17, 2006 Final Revision to the Monitoring Regulation to Michigan’s PM2.5 FRM Network ............. 33 14 Michigan’s PM2.5 FRM Monitoring Network .................................................................... 36 15 Michigan’s Continuous PM2.5 Monitoring Network ......................................................... 41 16 Michigan’s PM2.5 Speciation Monitoring Network .......................................................... 45 17 PM10 Minimum Monitoring Requirements (Number of Stations per MSA) ...................... 48 18 Application of the Minimum PM10 Monitoring Regulations in the April 30, 2007 Correction to the October 17, 2006 Final Revision to the Monitoring Regulation to Michigan’s PM10 Network ......................................................................... 49 19 Michigan’s PM10 Monitoring Network ............................................................................. 50 20 Michigan’s CO Monitoring Network ............................................................................... 53 21 NO2 Network Design...................................................................................................... 56 22 Michigan’s NO2 and NOY Monitoring Network ................................................................ 60 23 Population Weighted Emission Index-based Monitoring Requirements ........................ 62 24 Population Weighted Emissions Index Totals for CBSAs in Michigan ............................ 63 25 Michigan’s SO2 Monitoring Network .............................................................................. 66 26 Michigan’s Trace Metal Monitoring Network .................................................................. 69 27 Michigan’s VOC Monitoring Network ............................................................................ 73 28 Michigan’s Carbonyl Monitoring Network ....................................................................... 76 29 Michigan’s PAH Monitoring Network .............................................................................. 79 30 PAMS Target Compound List ........................................................................................ 81 31 Meteorological Measurements in Michigan .................................................................... 84 32 Instruments to be Added at Gordie Howe International Bridge Project Study ................ 86 33 Summary of Waivers for Michigan’s Monitoring Network ............................................... 87
PAGE iv
List of Figures
Page 1 MSAs in Michigan’s Lower Peninsula .............................................................................. 5 2 Michigan’s Lead Monitoring Network ............................................................................. 15 3 Michigan’s NCore Monitoring Network .......................................................................... 22 4 Comparison of 4th Highest 8-Hour Ozone Values Averaged Over Three Years 2013-2015, 2014-2016 and 2015-2017 .................................................... 25 5 Ozone Design Values 2014 – 2016 ............................................................................. 27 6 Michigan’s Ozone Network ........................................................................................... 29 7 Michigan’s PM2.5 FRM Monitoring Network ................................................................... 37 8 Michigan’s Continuous PM2.5 Network ........................................................................... 42 9 Michigan’s PM2.5 Speciation (SASS) Network ................................................................ 46 10 Michigan’s PM10 Monitoring Network ............................................................................. 50 11 Michigan’s CO Monitoring Network ................................................................................ 54 12 Comparison of Eliza Howell Park Location with Other Air Monitoring Stations and Roadway Segments with High Traffic Counts ................................................................ 57 13 NO2 Emissions in Kent and Ottawa Counties ................................................................ 58 14 Michigan’s NO2 and NOY Monitoring Network ................................................................ 61 15 Michigan’s SO2 Monitoring Network .............................................................................. 67 16 Michigan’s Trace Metal Monitoring Network .................................................................. 70 17 Michigan’s VOC Monitoring Network ............................................................................. 73 18 Michigan’s Carbonyl Monitoring Network ....................................................................... 77 19 Michigan’s PAH Monitoring Network .............................................................................. 79

MICHIGAN’S 2019 ANNUAL AMBIENT AIR MONITORING NETWORK REVIEW - DRAFT
PAGE 1
INTRODUCTION The purpose of this document is to examine Michigan’s ambient air monitoring network, in operation during 2018, and recommend changes based on monitor history, population distribution, and modifications to federal monitoring requirements under the Clean Air Act (CAA), 40 Code of Federal Regulations (CFR) Part 58. Recommended changes to this network will be implemented during the 2019 calendar year contingent upon adequate levels of funding.
Federal Changes There have been numerous changes at the federal level that have impacted design of the Michigan Department of Environmental Quality’s (MDEQ) air monitoring network. These changes include revisions to the National Ambient Air Quality Standard (NAAQS) for ozone, particulate matter (PM), lead (Pb), nitrogen dioxide (NO2), sulfur dioxide (SO2), carbon monoxide (CO), and secondary NAAQS for NO2 and SO2. In addition, there were changes in the ambient air monitoring rules. On November 12, 2008, the United States Environmental Protection Agency (USEPA) modified the lead NAAQS by reducing the level of the standard from a maximum quarterly average of 1.5 micrograms per cubic meter (µg/m3) to 0.15 µg/m3 as a three-month rolling average. On February 9, 2010, the USEPA changed the NO2 NAAQS and required the deployment of a two-tiered NO2 monitoring network consisting of near-roadway and community monitors. Design of the new NO2 monitoring network is discussed in this network review. These NO2 monitors had a deployment deadline of January 1, 2013. On November 16, 2009, the USEPA proposed to modify the SO2 NAAQS and proposed the creation of a two-tiered monitoring network based on SO2 emissions, requiring a total of 12 SO2 stations in Michigan. The SO2 NAAQS became final on August 23, 2010. The network design was modified to a single tier requiring a total of five SO2 monitors in Michigan. Changes to the SO2 monitoring network are discussed in this network review. Changes to the SO2 network were required to be implemented before January 1, 2013. On August 13, 2011, the USEPA proposed to retain the CO NAAQS level while adding additional monitoring requirements. The USEPA proposed that CO monitors be added to the near-roadway sites. These CO monitors had a deployment deadline of January 1, 2014. A secondary NAAQS for NO2 and SO2 was proposed on February 12, 2010, and the final rule was effective June 4, 2012. The USEPA chose to retain the standards while adding additional monitoring requirements. On January 15, 2013, the PM NAAQS was revised and the USEPA lowered the PM2.5 annual average to 12.0 µg/m3. On October 26, 2015, the ozone NAAQS was revised and the USEPA strengthened the ozone 8-hour standard to 0.070 ppm. On April 27, 2016, the USEPA finalized revisions to CFR Part 48, which contains ambient air monitoring requirements for criteria pollutants. On December 22, 2016, the USEPA finalized a rule to remove the requirement of tier 3 near-road NO2 monitors.

MICHIGAN’S 2019 ANNUAL AMBIENT AIR MONITORING NETWORK REVIEW - DRAFT
PAGE 2
Recommendations for Michigan’s Air Monitoring Network in 2019 The following changes will be made to Michigan’s ambient air monitoring network during 2019. If funding cuts occur, additional changes to the network may need to be implemented. In August 2016, the MDEQ, Air Quality Division (AQD) established a monitoring site in the 48217 ZIP code in southwest Detroit (261630097) for a one-year study. The study was completed in September 2017. The MDEQ proposes to continue sampling at this station in 2019 for continuous PM2.5, SO2, and five metals including lead. In May 2018 the Lansing (260650012) monitoring site had to be relocated in an unanticipated move to 815 Filley Street and is now designated as Lansing Filley (260650018). The MDEQ anticipated receiving funds in 2018 to establish new air monitoring sites in the vicinity of the new Gordie Howe International Bridge. Details were not known at the time of the 2018 Network Plan. Three new sites are identified as Trinity (261630098), DP4TH (261630099) and Clemente (261630100). The monitoring sites will measure air pollution before, during, and after construction of the international bridge crossing. In addition, the Fort St. (SWHS) (261630015) site will increase monitoring to include NOx, continuous PM2.5, and black carbon. The three new monitors will include the following measurements:
• Trinity (261630098): meteorological parameters, NOx, SO2, CO, continuous PM2.5, black carbon, and five trace metals including lead.
• DP4TH (261630099): NOx, SO2, CO, continuous PM2.5, black carbon, and five trace metals including lead.
• TBD (261630100): NOx, SO2, continuous PM2.5, black carbon, and five trace metals including lead.
The revised monitoring rule (80 FR 65292; October 26, 2015) requires Photochemical Air Monitoring Station (PAMS) measurements June 1 through August 31 at NCore sites that are located in Core-based Statistical Areas (CBSAs) with populations of 1,000,000 or more. As long as federal funding is made available for Michigan to fully fund two PAMS sites, the MDEQ will implement the following changes to its network starting June 2019. The NCore sites are located in Grand Rapids (260810020) and Allen Park (261630001). The parameters for PAMS include volatile organic compound (VOC) measurement by automated gas chromatography (Auto-GC), direct NO2 measurements, carbonyl sampling, and mixing height measurement using ceilometers. By January 1, 2019, the MDEQ is proposing to add a year-round NOx monitor to the Jenison (261390005) site in lieu of a direct NO2 monitor at Grand Rapids-Monroe (260810020). This is due to delay in PAMS funding from the USEPA. This will fulfill the NO2 area wide requirement. During 2018, the MDEQ will begin to make a method change for sampling of PM2.5 in its network. A slow transition from the filter-based PM2.5 Federal Reference Method (FRM) network to a continuous beta attenuation air monitor (BAM) network will be made. The following sites will result in a method change from the FRM filter-based instruments to the continuous Federal Equivalent Monitors (FEMs):
• Flint (260490021) will be a co-located site with a primary BAM (MetOne) and a secondary PM2.5 filter FRM
• SWHS (261630015) will be a co-located site with a primary PM2.5 filter FRM and a secondary BAM (MetOne)

MICHIGAN’S 2019 ANNUAL AMBIENT AIR MONITORING NETWORK REVIEW - DRAFT
PAGE 3
• Seney (261530001)
• Houghton Lake (261130001)
• Tecumseh (260910007) By January 1, 2019, the MDEQ is proposing to eliminate the following monitors:
• PM2.5 filter-based FRMs at ▪ Livonia (261630025) ▪ Linwood (261630016) ▪ Wyandotte (261630036)
• FEM BAM replace TEOMs at ▪ Seney (261530001) ▪ Houghton Lake (261130001) ▪ Tecumseh (260910007)
• Dearborn (261630033) EC/OC
• Tecumseh (260910007) EC/OC
• Tecumseh (260910007) Speciation
• Eliza-Downwind (261630094) ▪ NOx ▪ CO ▪ Meteorological Parameters
• FIA (261630039) – due to loss of site access ▪ PM2.5 FRM ▪ PM2.5 TEOM ▪ Meteorological Parameters
Note: The Reed Street (260670002) TSP lead monitor has seen some recent elevated levels in 2018. Depending on how the concentrations look for the duration of 2018, we may elect to shut down or opt to keep it another year.
Network Review Goals The Michigan Ambient Air Monitoring Network Review will describe the ambient air monitoring network, show how the network meets the USEPA’s monitoring regulations, discuss the public comment procedure, summarize recent changes to the network, and address potential impacts of other actions in greater detail. All discussions of air monitors reference a unique 9-digit site identification code to remove all ambiguity regarding the monitor location.

MICHIGAN’S 2019 ANNUAL AMBIENT AIR MONITORING NETWORK REVIEW - DRAFT
PAGE 4
Public Comment Process The USEPA requires that the MDEQ document the process for obtaining public comments and include any comments received through the public notification process. On May 22, 2018, it was announced, through the AQD listserve, that this network review document was placed on the AQD section of the MDEQ Internet home page to solicit comments from the public and stakeholders. In addition, the public comment period will be announced in a press release. Reviewers are given 30 calendar days from the date the draft network review report is posted to provide written comments. Written comments are accepted until June 22, 2018 by e-mail and by parcel post (verbal comments are not accepted) and should be sent to:
NAVNIT K. GHUMAN MDEQ AIR QUALITY DIVISION
3058 W GRAND BLVD, SUITE 2-300 DETROIT MI 48202
All written comments that are received will be organized by topic, summarized, and addressed in the final version of the Michigan Ambient Air Monitoring Network Review. The final document will be placed on the AQD section of the MDEQ Internet home page and sent to the USEPA’s Region 5 office for approval. Hard copies of the final version will be available for inspection free of charge at the AQD offices located in Lansing (525 West Allegan Street) or Detroit (3058 West Grand Boulevard, Suite 2-300). Requests for hard copies of the plan may incur a nominal fee to cover copying and/or mailing costs. These requests should be directed to Navnit K. Ghuman, AQD, 313-456-4695, [email protected].

MICHIGAN’S 2019 ANNUAL AMBIENT AIR MONITORING NETWORK REVIEW - DRAFT
PAGE 5
AMBIENT AIR MONITORING NETWORK REQUIREMENTS The minimum network design criteria for ozone, PM2.5 (particulate matter with an aerodynamic diameter less than or equal to [≤] 2.5 micrometers) and PM10 (≤10 micrometers) are based on the 2017 Metropolitan Statistical Area (MSA) geographical borders, population totals, and historical concentrations. The MSA outlines for Michigan are shown in Figure 1.
Figure 1: MSAs in Michigan’s Lower Peninsula
To be classified as an MSA, an area must have an urban core population totaling at least 50,000 people in the most recent decennial census. Micropolitan statistical areas contain an urban core of at least 10,000 (but less than 50,000). MSAs that consist of one or more counties have a sizeable urban cluster or a high level of commuting to or from an urban cluster. MSAs and/or micropolitan areas are grouped to form consolidated statistical areas (CSAs), also shown in Figure 1. A CBSA is defined as an entity consisting of the county or counties associated with at least one urbanized area/urban cluster of at least 10,000 in population, plus adjacent counties having a high degree of social and economic integration. Changes to the metropolitan and micropolitan areas as a result of the 2010 US Census were released in 2013. The areas affected include Midland, Hillsdale, Three Rivers, Ludington, and Whitehall. However, the remainder of MSAs in the state were unaffected by the 2010 census.
MICHIGAN’S 2019 ANNUAL AMBIENT AIR MONITORING NETWORK REVIEW - DRAFT
PAGE 6
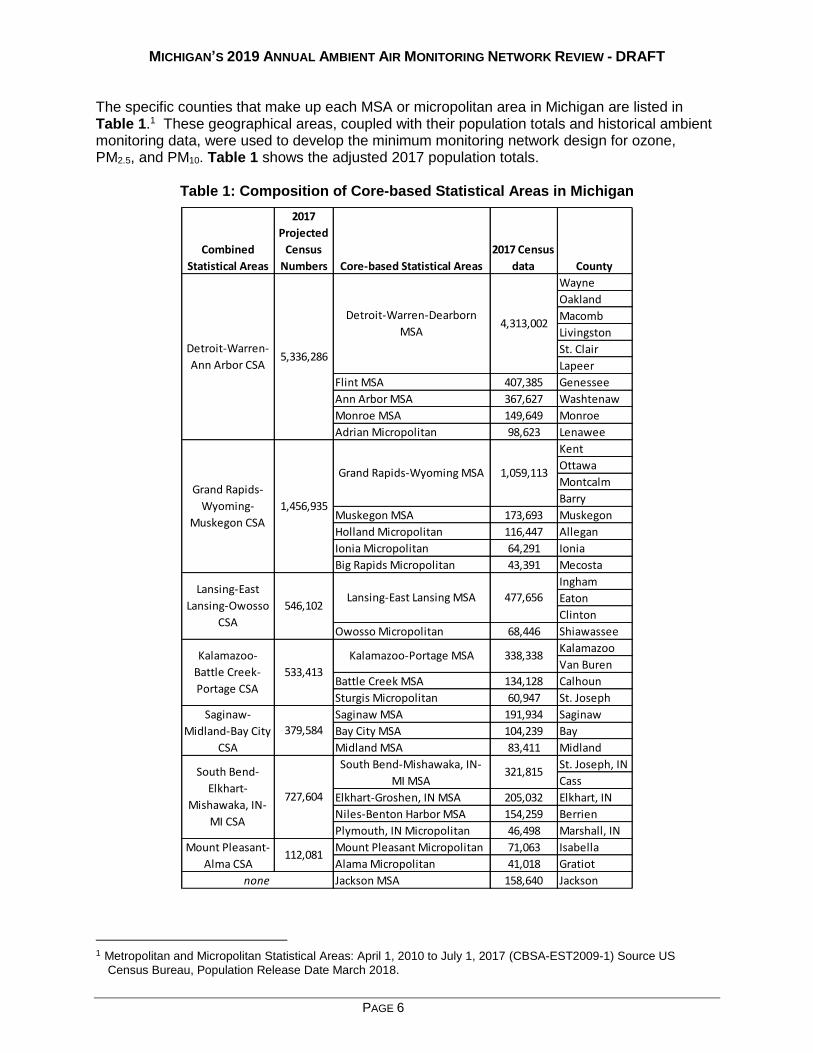
The specific counties that make up each MSA or micropolitan area in Michigan are listed in Table 1.1 These geographical areas, coupled with their population totals and historical ambient monitoring data, were used to develop the minimum monitoring network design for ozone, PM2.5, and PM10. Table 1 shows the adjusted 2017 population totals.
Table 1: Composition of Core-based Statistical Areas in Michigan
1 Metropolitan and Micropolitan Statistical Areas: April 1, 2010 to July 1, 2017 (CBSA-EST2009-1) Source US
Census Bureau, Population Release Date March 2018.
Combined
Statistical Areas
2017
Projected
Census
Numbers Core-based Statistical Areas
2017 Census
data County
Wayne
Oakland
Macomb
Livingston
St. Clair
Lapeer
Flint MSA 407,385 Genessee
Ann Arbor MSA 367,627 Washtenaw
Monroe MSA 149,649 Monroe
Adrian Micropolitan 98,623 Lenawee
Kent
Ottawa
Montcalm
Barry
Muskegon MSA 173,693 Muskegon
Holland Micropolitan 116,447 Allegan
Ionia Micropolitan 64,291 Ionia
Big Rapids Micropolitan 43,391 Mecosta
Ingham
Eaton
Clinton
Owosso Micropolitan 68,446 Shiawassee
Kalamazoo
Van Buren
Battle Creek MSA 134,128 Calhoun
Sturgis Micropolitan 60,947 St. Joseph
Saginaw MSA 191,934 Saginaw
Bay City MSA 104,239 Bay
Midland MSA 83,411 Midland
St. Joseph, IN
Cass
Elkhart-Groshen, IN MSA 205,032 Elkhart, IN
Niles-Benton Harbor MSA 154,259 Berrien
Plymouth, IN Micropolitan 46,498 Marshall, IN
Mount Pleasant Micropolitan 71,063 Isabella
Alama Micropolitan 41,018 Gratiot
Jackson MSA 158,640 Jackson
4,313,002Detroit-Warren-Dearborn
MSA
5,336,286Detroit-Warren-
Ann Arbor CSA
Grand Rapids-
Wyoming-
Muskegon CSA
1,456,935
Grand Rapids-Wyoming MSA 1,059,113
Lansing-East Lansing MSA 477,656
Kalamazoo-
Battle Creek-
Portage CSA
533,413
Kalamazoo-Portage MSA 338,338
Saginaw-
Midland-Bay City
CSA
379,584
South Bend-
Elkhart-
Mishawaka, IN-
MI CSA
727,604
Lansing-East
Lansing-Owosso
CSA
546,102
South Bend-Mishawaka, IN-
MI MSA321,815
Mount Pleasant-
Alma CSA112,081
none

MICHIGAN’S 2019 ANNUAL AMBIENT AIR MONITORING NETWORK REVIEW - DRAFT
PAGE 7
Some proposed monitoring requirements are based on micropolitan statistical areas with an urban cluster of at least 10,000 but less than 50,000 people. The total population in micropolitan areas in Michigan is shown in Table 2.
Table 2: Composition of Micropolitan Statistical Areas in Michigan
Micropolitan Area Principle Cities Counties Population
2017 Census
Adrian Micropolitan Area Adrian Lenawee 98,623
Alma Micropolitan Area Alma Gratiot 41,018
Alpena Micropolitan Area Alpena Alpena 28,462
Big Rapids Micropolitan Area Big Rapids Mecosta 43,391
Cadillac Micropolitan Area Cadillac Missaukee, Wexford 48,274
Coldwater Micropolitan Area Coldwater Branch 43,410
Escanaba Micropolitan Area Escanaba Delta 35,965
Hillsdale Micropolitan Area Hillsdale Hillsdale 45,879
Holland Micropolitan Area Holland (pt.) Allegan 116,447
Houghton Micropolitan Area Houghton Houghton, Keweenaw 38,410
Ionia Micropolitan Area Ionia Ionia 64,291
Iron Mountain Micropolitan Area Iron Mountain Dickinson, MI; Florence, WI 29,786
Ludington Micropolitan Area Ludington Mason 29,073
Marinette Micropolitan Area Marinette, WI Menominee, MI; Marinette, WI 63,356
Marquette Micropolitan Area Marquette Marquette 66,502
Mount Pleasant Micropolitan Area Mount Pleasant Isabella 71,063
Owosso Micropolitan Area Owosso Shiawassee 68,446
Sault Ste. Marie Micropolitan Area Sault Ste. Marie Chippewa 37,711
Sturgis Micropolitan Area Sturgis St. Joseph 60,947
Traverse City Micropolitan Area Traverse City Benzie, Grand Traverse,
Kalkaska, Leelanau 148,671
Other Monitoring Network Requirements National Core (NCore) sites provide a full suite of measurements at one location. NCore stations collect the following measurements: ozone, SO2 (trace), CO (trace), NOY (reactive oxides of nitrogen), PM2.5 FRM, continuous PM2.5, speciated PM2.5, wind speed, wind direction, relative humidity, and ambient temperature. In addition, filter-based measurements are required for PM coarse (PM10-2.5) on a once every three day sampling frequency. Previously, a minimum of 10 NCore sites nationwide measure lead; however, this requirement was removed in 2016. The NCore stations in Michigan, located at Grand Rapids–Monroe St. (260810020) and Allen Park (261630001), became operational January 1, 2010, one full year ahead of schedule. The 2015 Ozone Standard added an additional requirement to the NCore sites, by requiring PAMS monitors to be located at certain NCore sites. The two NCore sites in Michigan were initially required to implement PAMS monitoring on June 1, 2019, but due to a delay in federal funding, some parameters may not start until 2020. Certain states will also be required to implement enhanced ozone monitoring; however, since all nonattainment areas in Michigan are proposed to be marginal, this will not be required. State and Local Air Monitoring Stations (SLAMS) monitors will supplement the network and improve spatial coverage. Specific network design criteria are contained in the monitoring

MICHIGAN’S 2019 ANNUAL AMBIENT AIR MONITORING NETWORK REVIEW - DRAFT
PAGE 8
regulations that describe the SLAMS monitoring networks for criteria pollutants. These requirements are discussed in detail in the remainder of this review.
Network Review Requirements According to 40 CFR 58.10, an air monitoring network review should:
• Be conducted at least once a year;
• Determine if the system meets the monitoring objectives stated in Appendix D of 40 CFR, Part 58 “Network Design Criteria for Ambient Air Quality Monitoring”2;
• Determine if the system meets the appropriate spatial scales and monitoring objectives, population-driven requirements, and the minimum number of stations that are required based on the likelihood of exceeding the NAAQS;
• Identify needed modifications to the network including termination and relocation of unnecessary stations;
• Identify any new stations that are necessary;
• Correct any inadequacies previously identified; and
• Be used as a starting point for five-year regional assessments.
Elements that must be included in the network review are:
• The USEPA’s Air Quality System (AQS) site identification number;
• Site locations including coordinates and street address;
• Sampling and analysis methods, including parameter codes;
• Operating schedule;
• Monitoring objective and spatial scales;
• Identification of those sites that are suitable and not suitable for comparison to the NAAQS (for PM2.5 only);
• The MSA, CBSA, or CSA represented by each monitor; and
• Evidence that the siting and operation of the monitor meets 40 CFR Part 58, Appendices A (quality assurance requirements), C (ambient air quality monitoring), D (network design criteria) and E (probe and monitoring path siting criteria).
For Michigan, the site-specific data is summarized in various tables throughout the review. The modifications to the network should address:
• New census data;
• Changes in air quality levels; and
• Changes in emission patterns. The time frame for implementation of modifications is one year from the time of the previous network review. Changes will be made on a calendar year basis whenever possible.
Monitor Deployment By Location Table 3 summarizes the distribution of ambient air monitors by pollutant in operation in Michigan during 2018-2019. The distinction is made between building and trailer to indicate differences in floor space and temperature control, information useful in planning deployment of new monitors.
2 “Environmental Protection Agency Ambient Air Quality Surveillance Regulations.” 40 CFR Part 58 Appendix D, April 27, 2016.

MICHIGAN’S 2019 ANNUAL AMBIENT AIR MONITORING NETWORK REVIEW - DRAFT
PAGE 9
TABLE 3: Monitor Distribution Throughout the 2018-2019 Network in Michigan
Site Name AQS ID O3
PM
2.5
PM
2.5
TE
OM
PM
2.5
BA
M
Sp
ecia
tio
n
PM
10
PM
Co
ars
e
CO
Tra
ce C
O
NO
2
NO
y
SO
2
Tra
ce S
O2
Meta
ls (
TS
P)
VO
Cs
Carb
on
yls
PA
Hs
Mete
oro
log
ical
Bu
ild
ing
/Tra
iler
Holland 260050003 x x x T
Bay City 260170014 x x x T
Benzonia (Frankfort) 260190003 x T
Coloma 260210014 x x x T
Cassopolis 260270003 x x B
Sault Ste. Marie + 260330901 x x x x
Rose Lake 2 260370002 x B
Flint 260490021 x x x x T
Otisville 260492001 x x T
Harbor Beach 260630007 x x T
Belding - Merrick St. 260670003 Pb & 4
Lansing 260650012 x x x x x x T
Kalamazoo 260770008 x x x x T
Gr.Rapids-Monroe St. 260810020 x x x x x x x x x Pb & 4 x T
Evans 260810022 x x T
Tecumseh 260910007 x x x x T
New Haven 260990009 x x x T
Sterling Hts/Freedom Hill 260990021 x
Warren 260991003 x T
Manistee + 261010922 x x x B
Scottville 261050007 x x T
Houghton Lake 261130001 x x x x x x T
Monroe Sterling SP 261150006 x x x x T
Muskegon-Green Crk. Rd. 261210039 x x T
Oak Park 261250001 x x x T
Pontiac 261250011 x
Rochester 261250012 x
Jenison 261390005 x x T
West Olive 261390011 x x T
Port Huron 261470005 x x x x x x T
Port Huron-Rural St. 261470031 Pb & 4
Seney 261530001 x x x T
Ypsilanti 261610008 x x x x T
Allen Park 261630001 x x x x x x x x x Pb & 4 x T
River Rouge 261630005 Pb & 4 x x T
Fort St. (SWHS) - Detroit 261630015 x x x x x Pb & 4 x x x B
Linw ood 261630016 x B
E. 7 Mile - Detroit 261630019 x x x x B
Livonia 261630025 x x T
Joy Rd. - Detroit 261630026 x
S Delray / Jefferson 261630027 Pb & 4 T
Dearborn 261630033 x x x x x x x x x B
Wyandotte 261630036 x
FIA / Ambassador Bridge 261630039 x x x T
Eliza How ell 261630093 x x x T
Livonia Near-road 261630095 x x x x T
NMH 48217 261630097 x x Pb & 4 T
DP4th 261630098 x x x x Pb & 4 T
Trinity 261630099 x x x x Pb & 4 x T
TBD 261630100 x x x x Pb & 4 T
Total 27 25 14 7 4 2 5 2 8 2 9 2 12 3 3 2 39
+ = Tribal monitor
4 = Metals suite: Mn, As, Cd, Ni,

MICHIGAN’S 2019 ANNUAL AMBIENT AIR MONITORING NETWORK REVIEW - DRAFT
PAGE 10
Quality Assurance The MDEQ has an approved Quality Management Plan (QMP). The Air Monitoring Unit (AMU) has a Quality Assurance Project Plan (QAPP), which covers the operation of the ambient air network. The QAPP addresses criteria pollutants, air toxics, metals, and particulates including the USEPA PM2.5 Speciation Trends Network (STN). Separate QAPPs exist for the National Air Toxics Trend Site (NATTS) and NCore. Special purpose monitoring projects also have dedicated QAPPs. The AMU has approved standard operating procedures, standardized forms and documentation policies, and a robust audit and assessment program to ensure high data quality. As part of the network review process, it is important to ensure that each monitor meets the specific requirements set forth in 40 CFR Part 58, Appendix A that govern proper calibration and operation, proper probe height, and monitor path length. In addition, the site itself must meet specific criteria governing distance from large trees and buildings, exhaust vents, highways, etc. To address the adequacy of required operational parameters, various types of audits are performed. The USEPA finalized revisions to the ambient air monitoring requirements for criteria pollutants, which were published in the Federal Register on March 27, 2016, and became effective on April 27, 2016. The MDEQ has finished implementing these changes. Audits are conducted by the AMU’s Quality Assurance (QA) Team, which has a separate reporting line of supervision. The audits are conducted on the particulate-based monitors every six months (PM2.5 FRM, continuous PM2.5 TEOM, BAM, PM2.5 Speciation, High Volume TSP [total suspended particulate], and PM10) and the gaseous monitors (CO, SO2, O3, NOy, and NO2) at least once each year. All audit results are reported to AQS quarterly. The toxics monitors (VOCs, carbonyl compounds, and poly-aromatic hydrocarbons [PAH]) are also audited once each year, and the aethalometers are audited every six months by the QA Team. These audits are conducted with independent equipment and gases, which are only used for quality assurance. The AMU’s QA Coordinator reviews the results from all audits. External audits are conducted annually by the USEPA. The USEPA conducts Performance Evaluation Program (PEP) audits for PM2.5 samplers (eight sites per year) and National Performance Audit Program (NPAP) for the gaseous monitors (20% of the sites per year) using a Thru-the-Probe audit system. The USEPA also conducts program-wide Technical Systems Audits every three years to evaluate overall program operations and assess adequacy of documentation and records retention. External audits are also conducted on the laboratory operations for air toxics (VOCs and carbonyls) and metals through the use of performance evaluation samples. The concentrations of audit samples are unknown to both the AQD staff and the MDEQ Environmental Laboratory staff.

MICHIGAN’S 2019 ANNUAL AMBIENT AIR MONITORING NETWORK REVIEW - DRAFT
PAGE 11
LEAD MONITORING NETWORK
Background On December 14, 2010, the USEPA revised the ambient monitoring requirements to better address possible exposures to lead3. On January 5, 2015, the USEPA proposed to retain the current standard. Monitoring is required for point sources that emit 0.5 tons of lead per year or more, if modeling indicates that the maximum concentration is more than half of the level of the air quality standard. If modeling indicates that there is little likelihood of violating the NAAQS, a waiver from monitoring may be obtained from the USEPA Regional Administrator. The final component of the 2010 revisions to the monitoring regulations includes the addition of population-oriented lead monitors at NCore stations that are located in CBSAs with populations greater than 500,000. In the final monitoring regulations of 2016, the USEPA has removed lead monitoring requirement at NCore sites, provided the sites are attaining the standard. At this time, the MDEQ has determined that, to best meet the needs of our citizens, we will continue to monitor for lead at our NCore sites. To place these new monitoring requirements into context, the 2008 lead NAAQS is reviewed below, as are changes already implemented in the lead network.
The 2008 Lead NAAQS The 2008 lead NAAQS reduced the level of the standard from a maximum quarterly average of 1.5 µg/m3 to 0.15 µg/m3 as a rolling three-month average. To determine if the primary NAAQS is met, the maximum three-month average within a three-year period is compared to the level of 0.15 µg/m3. In addition to changing the level and form of the standard, the 2008 NAAQS changed monitoring requirements. The USEPA required that ambient monitoring be performed downwind of point sources emitting one ton or more per year of lead, unless modeling proved that the sources didn’t pose a health risk. In 2010, the new per-ton threshold was reduced to 0.5 ton/year. The NAAQS retained the TSP size fraction of lead, but acknowledged that agencies may, under certain conditions, measure lead as PM10 if low volume sampling devices are used. The MDEQ is currently using high volume TSP samplers to measure lead and will continue to do so for compliance with the NAAQS and consistency with historical data. The NAAQS requires that lead sampling be conducted on a once every six day schedule. The MDEQ follows the USEPA sampling schedule published yearly on the USEPA web site. These filters are analyzed by the MDEQ laboratory using ICP/MS.
3 “Environmental Protection Agency National Ambient Air Quality Standards for Lead; Final Rule.” 40 CFR, parts 50, 51, 53 and 58,
November 12, 2008.

MICHIGAN’S 2019 ANNUAL AMBIENT AIR MONITORING NETWORK REVIEW - DRAFT
PAGE 12
Point Source-oriented Monitoring For 2019, there are no new facilities that need to be investigated with regard to the lead NAAQS requirements. In July 2017, the USEPA redesignated the Belding, Michigan area as being in attainment with the lead standard. The MDEQ will continue monitoring for lead at the Merrick St. site (260670003). The MDEQ is proposing to shut down lead monitor at the Reed St. site (260670002) at the end of 2018 due to continued values below the standard. The Merrick St. monitor will remain operational to detect fugitive lead emissions from the facility.
Non-source-oriented/NCore Monitoring Network Design According to the November 12, 2008, lead NAAQS, each Core-based Statistical Area (CBSA) with a population equaling or exceeding 500,000 people shall have a lead monitoring station to measure neighborhood scale lead in the urban area. The USEPA has now reversed this with the 2016 monitoring regulation changes. The MDEQ has decided that retaining the lead monitoring at the MDEQ’s two NCore sites is in the best interest of Michigan’s citizens. In addition to the lead sites that were added on January 1, 2018, the MDEQ is adding three new lead monitoring sites near the Gordie Howe International Bridge. Additional site details are in the Special Purpose Monitoring section.
Lead Co-location Requirements
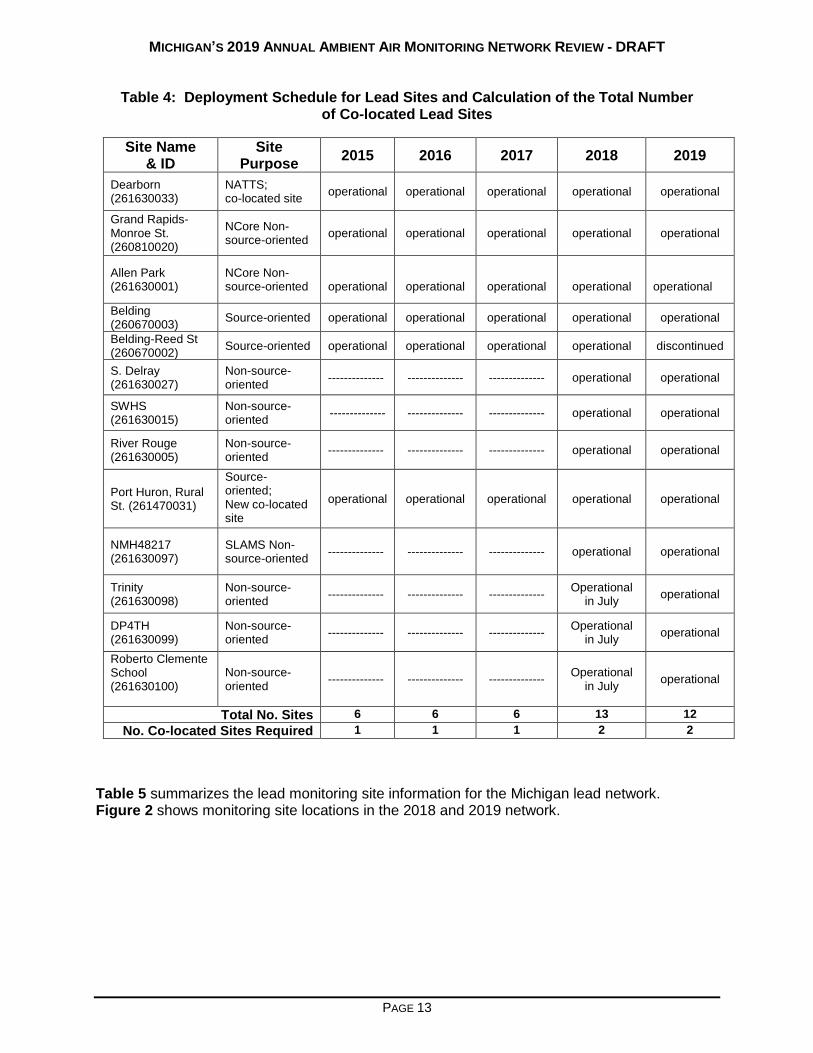
If a primary quality assurance organization (PQAO) has a mixture of source and non-source- oriented lead sites, the number of co-located lead sites is equal to 15% of the total number of these lead sites. Table 4 describes the deployment schedule for various components of the lead network and shows the calculations for determining the number of co-located lead sites that are required.
As shown in Table 4, two co-located monitoring stations are now required for Michigan’s lead network. Due adding lead to all metals site and the addition of the monitoring site for the Gordie Howe International Bridge project. Currently, the co-located site is at Dearborn. According to the Federal Register, the co-located site should be at the location with the highest lead concentrations, which would be at Port Huron–Rural Street (261470031).
The MDEQ prefers to retain one co-located lead site at the National Air Toxics Trend Site (NATTS) at Dearborn (261630033), which is located close to several industrial processes including a steel mill, automotive manufacturing plant, and a rail yard. The monitor is sited at Salina Elementary School. Typically, NATTS sites determine lead as PM10 using a high volume sampler and thus do not meet the monitoring requirements, which specify the use of a high volume TSP sampler or a low volume PM10 sampler under certain instances. However, the MDEQ opted to collect co-located lead measurements as both TSP and PM10 at the Dearborn site to continue generating trend data, promote comparability with other NATTS sites in the nation, and to determine precision for both size fractions. In addition, a MetOne SASS monitor supports the measurement of lead as PM2.5, rounding out the suite of various particle sizes. In the past, the total number of lead sites in Michigan was less than 10, the co-located TSP samplers at Dearborn fulfilled the 15 percent co-location requirement for the lead network. In 2018, the MDEQ will add seven additional lead sites, resulting in a total of 13 sites. To fulfill the 15 percent co-location requirement, the most suitable co-location will be at Port Huron–Rural Street (261470031), where we are currently reporting the highest lead values in the network.
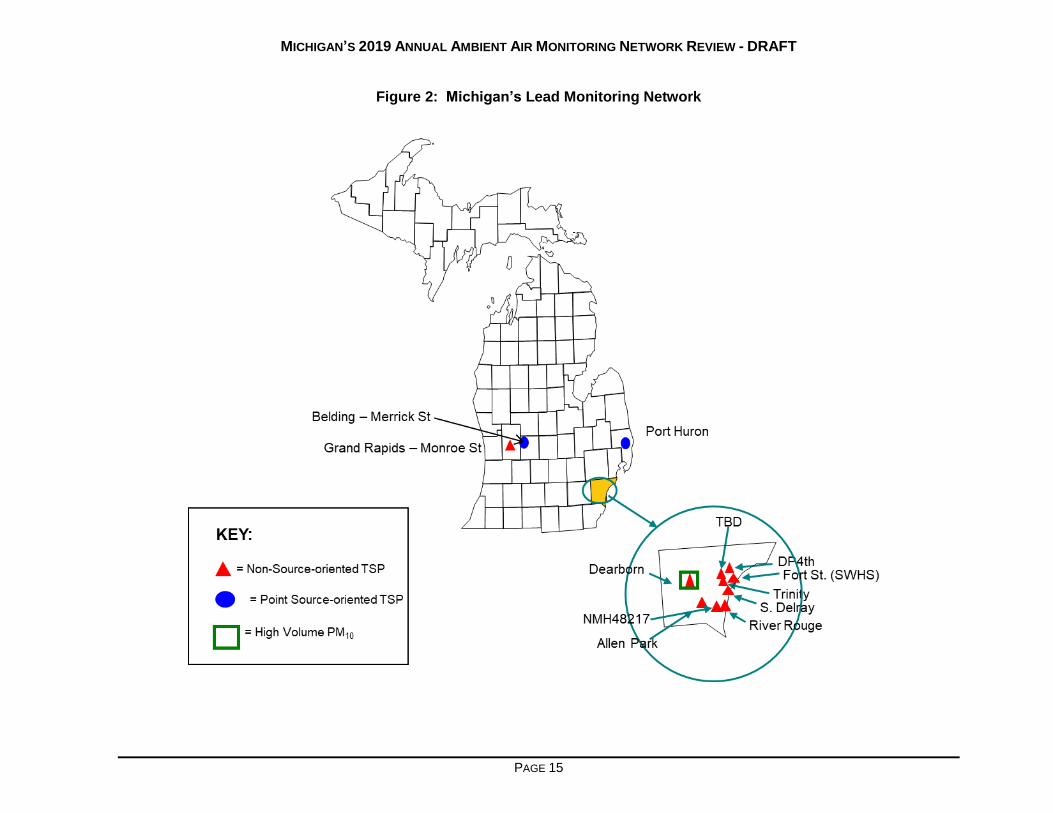
Table 5 summarizes the lead monitoring site information for the Michigan lead network. Figure 2 shows monitoring site locations in the 2017 and 2018 network.
MICHIGAN’S 2019 ANNUAL AMBIENT AIR MONITORING NETWORK REVIEW - DRAFT
PAGE 13
Table 4: Deployment Schedule for Lead Sites and Calculation of the Total Number of Co-located Lead Sites
Site Name & ID
Site Purpose
2015 2016 2017 2018 2019
Dearborn (261630033)
NATTS; co-located site
operational operational operational operational operational
Grand Rapids-Monroe St. (260810020)
NCore Non-source-oriented
operational operational operational operational operational
Allen Park (261630001)
NCore Non-source-oriented
operational
operational
operational
operational
operational
Belding (260670003)
Source-oriented operational operational operational operational operational
Belding-Reed St (260670002)
Source-oriented operational operational operational operational discontinued
S. Delray (261630027)
Non-source-oriented
-------------- -------------- -------------- operational operational
SWHS (261630015)
Non-source-oriented
-------------- -------------- -------------- operational operational
River Rouge (261630005)
Non-source-oriented
-------------- -------------- -------------- operational operational
Port Huron, Rural St. (261470031)
Source-oriented; New co-located site
operational operational operational operational operational
NMH48217 (261630097)
SLAMS Non-source-oriented
-------------- -------------- -------------- operational operational
Trinity (261630098)
Non-source-oriented
-------------- -------------- -------------- Operational
in July operational
DP4TH (261630099)
Non-source-oriented
-------------- -------------- -------------- Operational
in July operational
Roberto Clemente School (261630100)
Non-source-oriented
-------------- -------------- -------------- Operational
in July operational
Total No. Sites 6 6 6 13 12
No. Co-located Sites Required 1 1 1 2 2
Table 5 summarizes the lead monitoring site information for the Michigan lead network. Figure 2 shows monitoring site locations in the 2018 and 2019 network.

MICHIGAN’S 2019 ANNUAL AMBIENT AIR MONITORING NETWORK REVIEW - DRAFT
PAGE 14
Table 5: Michigan’s Lead Monitoring Network
Operating Schedule: 1:6 days
Method: High Volume Sampler & ICAP Spectra, Method Code 108
Monitoring Sites Est
Site AQS Part. Sampling Purpose/ Parameter Date Emissions
Name Site ID Address Size Latitude Longitude Frequency Type Code POC Scale County Estab. Tons/yr
Belding - Merrick St. 260670003 509 Merrick St. TSP 43.09984 -85.22163 1:6 max conc 14129 1 Micro Ionia 1/1/10 0.9 - 1.0
Port Huron 261470031 324 Rural St. TSP 42.98209 -82.449233 1:6 max conc 14129 1 Micro St. Clair 1/1/13 0.75
Port Huron 261470031 324 Rural St. TSP 42.98209 -82.449233 1:12, co-loc max conc 14129 2 Micro St. Clair 7/1/18 0.75
Pop
Site AQS Part. Sampling Purpose/ Parameter Date (2015
Name Site ID Address Size Latitude Longitude Frequency Type Code POC Scale County Estab. CBSA 1 Estimate)
Grand Rapids - Monroe St. 260810020 1179 Monroe St. NW TSP 42.984167 -85.671389 1:6 pop. exp. 14129 1 Neighborhood Kent 1/8/10 GW 1,456,935
Allen Park 261630001 14700 Goddard TSP 42.228611 -83.208333 1:6 pop. exp. 14129 1 Neighborhood Wayne 1/2/10 DWL 4,313,002
Dearborn 261630033 2842 Wyoming TSP 42.306666 -83.148889 1:6 max conc 14129 1 Neighborhood Wayne 6/1/90 DWL 4,313,002
Dearborn 261630033 2842 Wyoming TSP 42.306666 -83.148889 1:12, co-loc max conc 14129 2 Neighborhood Wayne 6/1/90 DWL 4,313,002
Dearborn 261630033 2842 Wyoming PM10 42.306666 -83.148889 1:6 max conc 14129 1 Neighborhood Wayne 6/1/90 DWL 4,313,002
Dearborn 261630033 2842 Wyoming PM10 42.306666 -83.148889 1:12, co-loc max conc 14129 2 Neighborhood Wayne 6/1/90 DWL 4,313,002
S. Delray 261630027 7701 W. Jefferson TSP 42.292222 -83.106944 1:6 pop. exp. 14129 1 Neighborhood Wayne 1/1/18 DWL 4,313,002
Fort St. (SWHS) 261630015 150 Waterman TSP 42.302778 -83.106667 1:6 pop. exp. 14129 1 Neighborhood Wayne 1/1/18 DWL 4,313,002
NMH48217 261630097 3225 S. Deacon St. TSP 42.2616692 -83.157893 1:06 pop. exp. 14129 1 Neighborhood Wayne 8/24/16 DWL 4,313,002
DP4th 261630098 4700 W Fort St TSP 42.312158 -83.091943 1:6 pop. exp. 14129 1 Neighborhood Wayne TBD DWL 4,313,002
Trinity 261630099 9191W Fort St TSP 42.295824 -83.129431 1:6 pop. exp. 14129 1 Neighborhood Wayne TBD DWL 4,313,002
Clemente 261630100 1551 Beard St TSP 42.310352 -83.115923 1:6 pop. exp. 14129 1 Neighborhood Wayne TBD DWL 4,313,002
River Rouge 261630005 315 Genesee TSP 42.267222 -83.13222 1:6 pop. exp. 14129 1 Neighborhood Wayne 1/1/18 DWL 4,313,002
1 CBSA Key:
DWL = Detroit-Warren-Livonia Core Based Statistical Area
GW = Grand Rapids-Wyoming Core Based Statistical Area
Mueller Industries
Monitoring Sites
Non Source Oriented Sites
Point Source Oriented Sites
Facility Name
Mueller Industries
Mueller Industries
Operating Schedule: 1:6 days
Method: High Volume Sampler & ICAP Spectra, Method Code 108
Monitoring Sites Est
Site AQS Part. Sampling Purpose/ Parameter Date Emissions
Name Site ID Address Size Latitude Longitude Frequency Type Code POC Scale County Estab. Tons/yr
Belding - Merrick St. 260670003 509 Merrick St. TSP 43.09984 -85.22163 1:6 max conc 14129 1 Micro Ionia 1/1/10 0.9 - 1.0
Port Huron 261470031 324 Rural St. TSP 42.98209 -82.449233 1:6 max conc 14129 1 Micro St. Clair 1/1/13 0.75
Port Huron 261470031 324 Rural St. TSP 42.98209 -82.449233 1:12, co-loc max conc 14129 2 Micro St. Clair 7/1/18 0.75
Pop
Site AQS Part. Sampling Purpose/ Parameter Date (2015
Name Site ID Address Size Latitude Longitude Frequency Type Code POC Scale County Estab. CBSA 1 Estimate)
Grand Rapids - Monroe St. 260810020 1179 Monroe St. NW TSP 42.984167 -85.671389 1:6 pop. exp. 14129 1 Neighborhood Kent 1/8/10 GW 1,456,935
Allen Park 261630001 14700 Goddard TSP 42.228611 -83.208333 1:6 pop. exp. 14129 1 Neighborhood Wayne 1/2/10 DWL 4,313,002
Dearborn 261630033 2842 Wyoming TSP 42.306666 -83.148889 1:6 max conc 14129 1 Neighborhood Wayne 6/1/90 DWL 4,313,002
Dearborn 261630033 2842 Wyoming TSP 42.306666 -83.148889 1:12, co-loc max conc 14129 2 Neighborhood Wayne 6/1/90 DWL 4,313,002
Dearborn 261630033 2842 Wyoming PM10 42.306666 -83.148889 1:6 max conc 14129 1 Neighborhood Wayne 6/1/90 DWL 4,313,002
Dearborn 261630033 2842 Wyoming PM10 42.306666 -83.148889 1:12, co-loc max conc 14129 2 Neighborhood Wayne 6/1/90 DWL 4,313,002
S. Delray 261630027 7701 W. Jefferson TSP 42.292222 -83.106944 1:6 pop. exp. 14129 1 Neighborhood Wayne 1/1/18 DWL 4,313,002
Fort St. (SWHS) 261630015 150 Waterman TSP 42.302778 -83.106667 1:6 pop. exp. 14129 1 Neighborhood Wayne 1/1/18 DWL 4,313,002
NMH48217 261630097 3225 S. Deacon St. TSP 42.2616692 -83.157893 1:06 pop. exp. 14129 1 Neighborhood Wayne 8/24/16 DWL 4,313,002
DP4th 261630098 4700 W Fort St TSP 42.312158 -83.091943 1:6 pop. exp. 14129 1 Neighborhood Wayne TBD DWL 4,313,002
Trinity 261630099 9191W Fort St TSP 42.295824 -83.129431 1:6 pop. exp. 14129 1 Neighborhood Wayne TBD DWL 4,313,002
TBD 261630100 TSP 1:6 pop. exp. 14129 1 Neighborhood Wayne TBD DWL 4,313,002
River Rouge 261630005 315 Genesee TSP 42.267222 -83.13222 1:6 pop. exp. 14129 1 Neighborhood Wayne 1/1/18 DWL 4,313,002
1 CBSA Key:
DWL = Detroit-Warren-Livonia Core Based Statistical Area
GW = Grand Rapids-Wyoming Core Based Statistical Area
Mueller Industries
Monitoring Sites
Non Source Oriented Sites
Point Source Oriented Sites
Facility Name
Mueller Industries
Mueller Industries
MICHIGAN’S 2019 ANNUAL AMBIENT AIR MONITORING NETWORK REVIEW - DRAFT
PAGE 15
Figure 2: Michigan’s Lead Monitoring Network

MICHIGAN’S 2019 ANNUAL AMBIENT AIR MONITORING NETWORK REVIEW - DRAFT
PAGE 16
Waiver(s) From Lead Monitoring In the Network Review that was due July 1, 2009, waivers from monitoring were sought for point sources where modeling indicated there was little likelihood to violate the NAAQS. These waivers were renewed again in July 2014. According to the waiver process, new waivers from monitoring for these sources need to be applied for five years after the first waiver was obtained. Therefore, the MDEQ will seek a waiver renewal in July 2019.
Lead Quality Assurance The site operator conducts a precision flow check each month. The flow check values are sent to the QA Coordinator each quarter. An independent audit is conducted by a member of the AMU’s QA Team every six months. The auditor is in a separate line of reporting authority from the site operator and uses independent, dedicated equipment to perform the flow rate audit. The auditor also assesses the condition of the monitor and siting criteria. The QA Coordinator reviews all audit results and hard copies are retained in the QA files. The audit results are uploaded to the USEPA’s AQS database each quarter. External lead PEP audits are conducted annually by the USEPA. The USEPA uses a separate sampler at the monitoring station to collect a filter on the same day as an MDEQ sample. The USEPA’s PEP filter is analyzed by an USEPA laboratory. Once the MDEQ enters the filter results in the AQS database, the USEPA enters the result from the co-located PEP filter for comparison. The MDEQ Laboratory participates in an external performance testing program that is administered by the USEPA. The laboratory analyzes spiked filter strips each month which are reported to the USEPA AQS database. Once a quarter, the MDEQ sends a co-located lead filter to the USEPA Region 9 laboratory. The results from the primary filter, analyzed by the MDEQ Laboratory, are compared to the co-located filter that was analyzed by the USEPA Region 9 laboratory.
Plans for the 2019 Lead Monitoring Network In 2019, the MDEQ is planning to continue to collect high volume TSP lead measurements at the NATTS site:
• Dearborn NATTS site (261630033); and
• Co-located Dearborn NATTS (261630033). The MDEQ is also planning to continue the collection of co-located PM10 lead at the Dearborn (261630033) NATTS site during 2019. In 2019, the MDEQ is planning to continue TSP lead measurements at:
• Port Huron (261470031);
• Co-located Port Huron (261470031);
• Belding–Merrick St. (260670003);
• S. Delray (261630027);
• Fort St. (SWHS) (261630015); and
• River Rouge (261630005). In 2019, the MDEQ is planning to discontinue TSP lead source-oriented measurements at:
MICHIGAN’S 2019 ANNUAL AMBIENT AIR MONITORING NETWORK REVIEW - DRAFT
PAGE 17
Belding-Reed St. (260670002). We have seen some recent elevated levels, depending on how the concentrations look for the duration of 2018, we may elect to shut down or opt to keep it another year.
In 2019, the MDEQ is planning to continue collecting lead measurements using high volume TSP samplers at the NCore sites in:
• Grand Rapids–Monroe St. (260810020); and
• Allen Park (261630001). In 2019, the MDEQ is planning to add lead measurements using high volume TSP samplers at the following sites:
• DP4TH (261630098);
• Trinity (261630099); and
• TBD (261630100).

MICHIGAN’S 2019 ANNUAL AMBIENT AIR MONITORING NETWORK REVIEW - DRAFT
PAGE 18
NCORE MONITORING NETWORK The purpose of the NCore stations is to collect a variety of air quality measurements that can be used to provide an integrated approach to air quality management. Collection of a suite of measurements at a single site improves our understanding of how concentrations of various pollutants are inter-related and can evaluate the effectiveness of control programs. Data from NCore sites is also used for the determination of air quality trends, for model evaluation, and for attainment purposes. Reference or equivalent methods must be used.
Network Design Neighborhood and urban scale measurements are to be made at one NCore site per state. Some states, including Michigan, have more than one major population center or multiple airsheds with unique characteristics, so two to three NCore stations are required to adequately characterize air quality. Sampling at NCore sites should use a spatial scale of neighborhood (up to 4 km) or urban (4 km to 50 km). There are a limited number of rural NCore stations. These NCore sites are located away from the influences of major sources, are sited in areas of relatively homogeneous geography, and should sample on a regional scale or larger. There are no rural NCore sites in Michigan. Whether urban or rural, the Federal Register4 specifies the minimum parameters that each NCore site must measure:
• Continuous PM2.5
• 24-hour PM2.5
• Speciated PM2.5
• PM10–2.5
• Ozone
• Trace SO2
• Trace CO
• NO/NOY
• Wind speed
• Wind direction
• Relative humidity
• Outdoor temperature
• Lead (2016 discontinued, not required)
Michigan NCore Sites The MDEQ’s NCore sites are located at Grand Rapids-Monroe St. (260810020) in the Grand Rapids-Wyoming CBSA and at Allen Park (261630001) in the Detroit-Warren-Livonia CBSA. Details were provided in the 2010 Network Review. The 2015 Ozone NAAQS has a requirement for PAMS monitoring at some NCore sites across the nation. These requirements for MDEQ are discussed in the PAMS chapter later in this review. Tables 6 and 7 list the parameters measured at Grand Rapids-Monroe St. (260810020) and Allen Park (261630001), respectively. Start dates are also shown.
4 “Environmental Protection Agency National Ambient Air Quality Standards for Lead; Final Rule.” 40 CFR Parts 50, 51, 53 and
58, November 12, 2008.

MICHIGAN’S 2019 ANNUAL AMBIENT AIR MONITORING NETWORK REVIEW - DRAFT
PAGE 19
Speciation samplers at the MDEQ NCore stations sample on a once every three day sampling schedule to meet the NCore monitoring requirements. The USEPA sampling schedule is followed. Low volume PM10 was added to the Grand Rapids–Monroe St. (260810020) site on January 14, 2010 and was added to the Allen Park (261630001) site on January 8, 2010. Lead was added to both sites in January 2010. Humidity was added to the Grand Rapids–Monroe St. (260810020) NCore station on March 3, 2010. Site specific data for Michigan’s NCore network is summarized in Table 8. A map showing the locations of NCore sites is displayed in Figure 3.
NCore Quality Assurance The MDEQ’s NCore stations contain a variety of monitors that are required to meet the federal requirements for NCore stations. Quality assurance is discussed for each type of monitor in the appropriate section of the network review.
Plans for the 2019 NCore Monitoring Network In 2019, the MDEQ is planning to continue to collect the measurements required for the NCore program at the following sites:
• Grand Rapids–Monroe St. (260810020); and
• Allen Park (261630001).
Lead monitoring will be continued at both sites, even though it is no longer required. PAMS monitoring equipment will be added to these sites as discussed in the PAMS chapter as federal funding becomes available.

MICHIGAN’S 2019 ANNUAL AMBIENT AIR MONITORING NETWORK REVIEW - DRAFT
PAGE 20
Table 6: Measurements Collected at the Grand Rapids–Monroe St. (260810020) NCore Site
Parameter Designation Spatial Scale
Sampling Frequency
Instrument Type
Method Existing Monitor
Start-up Date Comments
PM2.5 continuous NCore/AQI Neighborhood Continuous R & P TEOM
1400 a
Tapered element oscillating
microbalance 11/4/99
DOES NOT meet FEM or ARM requirements
PM2.5 FRM mass NCore Neighborhood 1:3 days R & P Partisol
plus 2025 Manual collection,
gravimetric analysis 10/23/98 ---
PM2.5 Speciation NCore Neighborhood 1:3 days MetOne Super
SASS + URG 3000N
Manual collection, laboratory analysis*
6/1/02 at 1:6 sampling frequency
Freq. changed to 1:3 on 1/1/2011
Trace CO NCore/AQI Neighborhood Continuous API 300 eu/ TECO 48 i
Non-dispersive infrared
4/25/07 probe height 5 m
Trace SO2 NCore/AQI Neighborhood Continuous API 100 eu/ TECO 43i
UV fluorescence 4/1/08 probe height 5 m
NOy NCore/AQI Neighborhood Continuous TECO 42C Chemiluminescence 4/1/08 external converter installed at 10 m
Ozone NCore/AQI was
NAMS Neighborhood Continuous API 400 A1E UV absorption 4/24/80 Year round
Lead Non-source Neighborhood 1:6 days General Metal Works Hi Vol filter-based
Manual collection, ICP/MS analysis
1/8/10 Will continue, not
required
PM10-2.5 mass NCore Neighborhood 1:3 days R & P Partisol
plus 2025 Manual collection,
gravimetric analysis 7/16/10 ---
WS NCore --- Continuous R. M. Young
Prop. Anemom. & vane
Vector summation 1/1/88 At 10 m
WD NCore --- Continuous R. M. Young
Prop. Anemom. & vane
Vector summation 1/1/88 At 10 m
Relative Humidity NCore --- Continuous R. M. Young Resistance hygrometer 3/3/10 > 4 m
Outdoor Temperature
NCore --- Continuous R. M. Young Thermometer 7/15/93 > 4 m
Sigma Theta SLAMS --- Continuous R. M. Young
Prop. Anemom. & vane
Calculation 1/16/01 Optional
Barometric Pressure
SLAMS --- Continuous R. M. Young Electronic pressure
sensor 7/15/93 Optional
PM10 Hi-vol SLAMS Neighborhood 1:6 days Hi-vol Manual collection,
gravimetric analysis 1/1/85 ---
* Laboratory analysis consists of ion chromatography, X-ray Fluorescence (XRF) and thermal optical analysis for ions, trace metals and forms of carbon, respectively.

MICHIGAN’S 2019 ANNUAL AMBIENT AIR MONITORING NETWORK REVIEW - DRAFT
PAGE 21
Table 7: Measurements Collected at the Allen Park (261630001) NCore Site
Parameter Designation Spatial Scale
Sampling Frequency
Instrument Type
Method
Existing Monitor Start-up
Date
Comments
PM2.5 continuous NCore/AQI Neighborhood Continuous R & P TEOM 1400 a Tapered element
oscillating microbalance
2/1/01 DOES NOT meet
FEM or ARM requirements
PM2.5 FRM mass NCore Neighborhood 1:1 day R & P Partisol plus
2025 Manual collection,
gravimetric analysis 5/12/99 ---
PM2.5 Speciation NCore Neighborhood 1:3 day
MetOne Super SASS + URG 3000N +
IMPROVE carbon channel
Manual collection, laboratory analysis*
12/1/00 ---
Trace CO NCore/AQI Neighborhood Continuous API 300 eu/ TECO 48 i
Non-dispersive infrared
6/1/07 4 m probe ht
Trace SO2 NCore/AQI Neighborhood Continuous API 100 eu/
TECO 43 i as UV fluorescence 4/1/08 4 m probe ht
NOy NCore/AQI Neighborhood Continuous TECO 42C Chemiluminescence 4/1/08 external converter installed at 10 m
Ozone NCore/AQI was
NAMS Neighborhood Continuous API 400 E UV absorption 1/1/80
Year round 4 m probe ht
Lead Non-source Neighborhood 1:6 days General Metal Works
Hi Vol filter-based Manual collection, ICP/MS analysis
3/2/01 to 3/31/07; 1/2/10
Will continue, not required
PM10-2.5 mass NCore Neighborhood 1:3 days R & P Partisol plus
2025 Manual collection,
gravimetric analysis 7/16/10 ---
WS NCore --- Continuous R. M. Young Prop. Anemom. & vane
Vector summation 10/18/81 At 10 m
WD NCore --- Continuous R. M. Young Prop. Anemom. & vane
Vector summation 10/18/81 At 10 m
Relative Humidity NCore --- Continuous R. M. Young Resistance hygrometer
1/1/00 > 4 m
Outdoor Temperature
NCore --- Continuous R. M. Young Thermometer 1/1/00 > 4 m
Sigma Theta SLAMS --- Continuous R. M. Young Prop. Anemom. & vane
Calculation 9/1/01 Optional
Barometric Pressure SLAMS --- Continuous R. M. Young Electronic pressure
sensor 1/5/71 Optional
Black Carbon SLAMS --- Continuous Magee large spot
AE21 Optical absorption 12/19/03 Not Req y NCore
PM10 Hi-vol Was NAMS Neighborhood 1:6 days Hi-vol Manual collection,
gravimetric analysis 9/12/87 ---
* Laboratory analysis consists of ion chromatography, X-ray Fluorescence (XRF) and thermal optical analysis for ions, trace metals and forms of carbon, respectively.

MICHIGAN’S 2019 ANNUAL AMBIENT AIR MONITORING NETWORK REVIEW - DRAFT
PAGE 22
Table 8: Michigan’s NCore Monitoring Network
Figure 3: Michigan’s NCore Monitoring Network
Monitoring Sites Pop
Site AQS Purpose/ Date (2015
Name Site ID Address Latitude Longitude Type Scale County Estab. CBSA1Estimate)
Grand Rapids - Monroe St. 260810020 1179 Monroe St., NW, 42.98417 -85.6714 Pop. Exp. Neighborhood Kent 1/1/10 GW 1,456,935
Allen Park 261630001 14700 Goddard 42.22861 -83.2083 Pop. Exp. Neighborhood Wayne 1/1/10 DWL 5,336,286
1 CBSA Key:
DWL = Detroit-Warren-Livonia Core Based Statistical Area
GW = Grand Rapids-Wyoming Core Based Statistical Area
Grand Rapids – Monroe St
Allen Park

MICHIGAN’S 2019 ANNUAL AMBIENT AIR MONITORING NETWORK REVIEW - DRAFT
PAGE 23
OZONE MONITORING NETWORK On October 26, 2015, the USEPA revised the ozone NAAQS, lowering the standard to 0.070 ppm and extending the ozone season in many areas, including Michigan, from March 1 through October 31. The MDEQ began the expanded season in 2017. As a result of the October 17, 2006 monitoring regulations, the minimum number of required ozone sites in an MSA were changed. In addition, due to the 2000 census, MSA boundaries were modified and population totals tied to measurements of ambient air quality were increased. A monitor with a design value (using the most recent three years of data) that is ≥ 85% of the ozone NAAQS has a higher probability of violating the standard. Therefore, the USEPA requires more monitors in these MSAs. In other instances, the number of monitors may be reduced if the design value is greater than 115% of the NAAQS.5 Note: background and transport ozone monitors are still required but are not shown in Table 9.
Table 9: SLAMS Minimum Ozone Monitoring Requirements
MSA Population1,2
Most Recent 3-year Design Value Concentrations ≥ 85% of any
Ozone NAAQS3
Most Recent 3-year Design Value Concentrations < 85% of any
Ozone NAAQS3,4
> 10 million 4 2
4 - 10 million 3 1
350,000 - < 4 million 2 1
50,000 - < 350,0005 1 0
1 Minimum monitoring requirements apply to the MSA. 2 Population is based on the latest available census figures. 3 The ozone NAAQS levels and forms are defined in 40 CFR Part 50. 4 These minimum monitoring requirements apply in the absence of a design value. 5 MSA must contain an urbanized area of 50,000 or more population.
Applying the requirements described in Table 9 to Michigan’s MSAs, population totals and the most recent 3-year design values results in a minimum ozone network design summarized in Table 10. All monitors in Michigan are above 85% of the ozone NAAQS of 0.059 ppm, except for Sault Ste. Marie, which is 0.057 ppm. Figure 4 illustrates changes in the 3-year averages of the fourth highest ozone values, called design values, from 2013 to 2017. When contemplating changes to the ozone network, it is important to consider changes in design values in nonattainment areas. In 2015, the USEPA lowered the ozone NAAQS to 0.070 ppm. The design values for 2013-2015, 2014-2016, and 2015-2017 are compared to the new standard of 0.070 ppm.
5 Table D-2 of Appendix D to Part 58.

MICHIGAN’S 2019 ANNUAL AMBIENT AIR MONITORING NETWORK REVIEW - DRAFT
PAGE 24
Table 10: Application of Minimum Ozone Requirements in the October 17, 2006 Final Revision to the Monitoring Regulation to Michigan’s Ozone Network
NAAQS: 0.070 ppm
85% NAAQS: 0.059 ppm
MSA
2015
Population Counties
Existing
Monitors
2015-2017
3-year O3
design value
Min. No.
Monitors
Required
Detroit-Warren-Livonia MSA 4,313,002 Macomb New Haven 0.071 3
Warren 0.066
Oakland Oak Park 0.070
Wayne Allen Park 0.067
Detroit - E 7 Mile 0.073
Lapeer ---
St. Clair Port Huron 0.072
Livingston ---
Flint MSA 407,385 Genesee Flint 0.067 2
Otisville 0.068
Monroe MSA 149,649 Monroe ---
Ann Arbor MSA 367,627 Washtenaw Ypsilanti 0.067 2
Grand Rapids-Wyoming MSA 1,059,113 Kent
Grand Rapids -
Monroe St. 0.069 2
Evans 0.068
Barry ---
Ottawa Jenison 0.068 1
Montcalm ---
Muskegon-Norton Shores MSA 173,693 Muskegon
Muskegon -
Green Creek Rd. 0.075 1
Lansing-East Lansing MSA 477,656 Clinton Rose Lake 0.066 2
Ingham Lansing 0.067
Eaton ---
Bay City MSA 104,239 Bay ---
Saginaw MSA 191,934 Saginaw ---
Kalamazoo-Portage MSA 338,338 Kalamazoo Kalamazoo 0.070 1
Van Buren ---
Niles-Benton Harbor MSA 154,259 Berrien Coloma 0.073 1
Jackson MSA 158,640 Jackson ---
Battle Creek MSA 134,128 Calhoun ---
South Bend Mishawaka MSA 321,815 Cass Cassopolis 0.072 1
Other areas: Comments
transport site Lenawee Tecumseh 0.067
Benzie Frankfort 0.068
Huron Harbor Beach 0.067
Allegan Holland 0.073
background site Missaukee Houghton Lake 0.067
Mason Scottville 0.068
Schoolcraft Seney 0.067
tribal site Manistee Manistee 0.067
Chippewa Sault Ste. Marie 0.057
Values for sites ≥ 85% NAAQS are in red.
Decimals to the right of the third decimal place are truncated.
The 3-year O3 average at the MSA Design Value site is shown in bold.

MICHIGAN’S 2019 ANNUAL AMBIENT AIR MONITORING NETWORK REVIEW - DRAFT
PAGE 25
Figure 4: Comparison of 4th Highest 8-Hour Ozone Values Averaged Over Three Years 2013-2015, 2014-2016 and 2015-2017
In southeast Michigan, New Haven (260990009) has been the design value site for many years, measuring maximum ozone concentrations downwind from Detroit. However, in 2015, the Detroit E 7 Mile (261630019) monitoring site became the new design value site for the Detroit-Warren-Livonia MSA. The location of the maximum ozone concentration has fluctuated in recent years, possibly due to changes in the amount, type and location of ozone precursor emissions. Allen Park (261630001) is upwind of the central business district and is an NCore site for the Detroit-Warren-Livonia MSA. As such, the MDEQ is required to measure ozone over the entire year at the Allen Park (261630001) site, instead of only during the March through October ozone season in Michigan. The Oak Park (261250001) and Port Huron (261470005) monitors are the only ozone sites in Oakland and St. Clair Counties, respectively. All monitors in southeast Michigan, except for E 7 Mile (261630019), Port Huron (261470005) and New Haven (260990009) are meeting the current ozone standard of 0.070 ppm. Two monitors are required in the Ann Arbor MSA. They consist of the Ypsilanti monitor (261610008) and the downwind monitor in Oak Park (261250001). The urban center city location coupled with a downwind maximum concentration site is a carry-over from the defunct NAMS network. There is not sufficient space in Washtenaw County to site a downwind monitor to measure maximum ozone concentrations, so Oakland County houses the downwind site although it is outside of the boundary of the Ann Arbor MSA. The upwind / downwind configuration will be retained wherever possible to preserve historical trend data. Two monitors are required in the Flint MSA. They consist of the urban center city site in Flint (260490021) and the downwind site at Otisville (260492001).

MICHIGAN’S 2019 ANNUAL AMBIENT AIR MONITORING NETWORK REVIEW - DRAFT
PAGE 26
Two ozone monitors are also required in the Grand Rapids–Wyoming MSA. They consist of the urban center city site in Grand Rapids on Monroe St. (260810020) and the downwind site at Evans (260810022). Two monitors are required in the Lansing–East Lansing MSA consisting of the urban center city site in Lansing Filley (260650018) and the downwind Rose Lake 2 (260370002) location. The MDEQ lost site access to the old Lansing (260650012) site in April 2018. A single ozone monitor is required in the MSAs of Holland-Grand Haven, Muskegon-Norton Shores, Kalamazoo–Portage, Niles-Benton Harbor, and South Bend-Mishawaka. The Jenison (261390005), Muskegon–Green Creek Rd. (261210039), Kalamazoo (260770008), Coloma (260210014) and Cassopolis (260270003) monitors fulfill these requirements, respectively. Coloma (260210014) and Muskegon–Green Creek Rd. (261210039) are violating the 0.070 ppm 8-hour ozone NAAQS. The ozone monitor in Holland (260050003) is in Allegan County and is violating the 0.070 ppm 8-hour ozone NAAQS. This site has historically measured the highest ozone values in the state and historically has been the highest in the region; however, in 2017, Muskegon–Green Creek Rd. (261210039) had the highest ozone three-year average in the state. The Lake Michigan Air Directors Consortium (LADCO) created the map shown in Figure 5 comparing ozone concentrations across the region. Tecumseh (260910007) measures ozone transport into southeast Michigan and is required by Michigan’s maintenance plan. Harbor Beach (260630007) measures transport out of southeast Michigan under southwesterly winds. Scottville (261050007) and Benzonia (260190003) are sited to measure transport of ozone along Lake Michigan and have been in operation for 21 and 27 years, respectively. These two sites are also an important part of Michigan’s maintenance plan. Houghton Lake (261130001) and Seney (261530001) measure background ozone levels in the Lower and Upper Peninsulas, respectively. To the best of our knowledge, the tribal ozone sites in Manistee (261010922) and in Sault Ste. Marie (260330901) will continue to operate.

MICHIGAN’S 2019 ANNUAL AMBIENT AIR MONITORING NETWORK REVIEW - DRAFT
PAGE 27
Figure 5: Ozone Design Values 2015 – 20176
Table 11 summarizes the ozone monitoring site information for sites that were in existence in 2018 and are planned to be operational in 2019. Figure 6 illustrates the geographical distribution of this network.
6 Map provided by D. Kenski, Lake Michigan Air Directors Consortium
2015 - 2017 Ozone Design Values

MICHIGAN’S 2019 ANNUAL AMBIENT AIR MONITORING NETWORK REVIEW - DRAFT
PAGE 28
Table 11: Michigan’s Ozone Monitoring Network
Operating Schedule: Hourly, March 1 to Octover 31; NCore operate hourly all year
Former NAMS sites are shown in bold.
Method: Ultra Violet Absorption Continuous Monitor, Method Code 087
Monitoring Sites NCore sites are shown in italics. Pop
Site AQS Purpose/ Parameter Start (2017
Name Site ID Address Latitude Longitude Type Code POC Scale County Date MSA1Estimate)
Rose Lake 260370001 8562 E Stoll Rd 42.7983 -84.39389 max conc 44201 1 urban Clinton 6/7/79 LEL 477,656
Flint 260490021 Whaley Park, 3610 Iowa 43.0472 -83.67028 pop exp 44201 1 nghbrhd Genesee 6/16/92 F 407,385
Otisville 260492001 G11107 Washburn Rd 43.1683 -83.46167 max conc 44201 1 urban Genesee 5/13/80 F 407,385
Lansing Filley 260650018 815 Filley Street 42.7616 -84.5628 pop exp 44201 2 nghbrhd Ingham 5/17/18 LEL 477,656
GR - M onroe St 260810020 1179 M onroe NW 42.9842 -85.6714 pop exp 44201 1 nghbrhd Kent 4/24/80 GW 1,059,113
Warren 260991003 29900 Hoover 42.5133 -83.00611 max conc 44201 1 urban Macomb 1/1/77 DWL 4,313,002
Holland 260050003 966 W 32nd St 42.7678 -86.14861 max conc 44201 1 urban Allegan 8/25/92 A 116,447
Frankfort / Benzonia 260190003 West St., Benzonia Tw p. 44.61694 -86.10944 max conc 44201 1 regional Benzie 7/28/92 Not in MSA N/A
Coloma 260210014 Paw Paw WWTP, 4689 Defield Rd.,Coloma 42.1978 -86.30972 max conc 44201 1 regional Berrien 8/3/92 NBH 154,259
Cassopolis 260270003 Ross Beatty High School, 22721 Diamond 41.8956 -86.00167 pop exp 44201 2 urban Cass 5/16/91 SBM 52,293
Harbor Beach 260630007 1172 S. M 25, Sand Beach Tw p. 43.8364 -82.64306 backgrd 44201 1 regional Huron 4/1/94 Not in MSA N/A
Kalamazoo 260770008 Fairgrounds, 2500 Lake St 42.2781 -85.54194 pop exp 44201 1 nghbrhd Kalamazoo 6/1/92 KP 338,338
Evans 260810022 10300 14 Mile Road, NE 43.1767 -85.41667 max conc 44201 1 urban Kent 4/1/99 GW 1,059,113
Tecumseh 260910007 6792 Raisin Center Highw ay 41.9956 -83.94667up w ind
backgrd 44201 1 regional Lenaw ee 7/6/93 AL 98,623
New Haven 260990009 57700 Gratiott 42.7314 -82.79361 max conc 44201 1 urban Macomb 7/14/80 DWL 4,313,002
Houghton Lake 261130001 1769 S Jeffs Road 44.3106 -84.89194 background 44201 1 regional Missaukee 4/1/98 Not in MSA N/A
Scottville 261050007 525 W US 10 43.9533 -86.29444 max conc 44201 1 regional Mason 4/1/98 Not in MSA N/A
Muskegon - Green Ck 261210039 1340 Green Creek Road 43.2781 -86.31111 pop exp 44201 1 regional Muskegon 5/1/91 MNS 173,693
Oak Park 261250001 13701 Oak Park Blvd. 42.4631 -83.18333 pop exp 44201 2 urban Oakland 1/9/81 DWL 4,313,002
Jenison 261390005 6981 28Th Ave. Georgetow n Tw p. 42.8944 -85.85278 pop exp 44201 1 urban Ottaw a 4/1/89 GW 1,059,113
Port Huron 261470005 2525 Dove Rd 42.9533 -82.45639 pop exp 44201 1 urban Saint Clair 2/28/81 DWL 4,313,002
Seney 261530001 Seney Wildlife Refuge, HCR 2 Box 1 46.2889 -85.95027 bkgrd 44201 1 regional Schoolcraft 1/15/02 Not in MSA N/A
Ypsilanti 261610008 555 Tow ner Ave 42.2406 -83.59972 pop exp 44201 1 nghbrhd Washtenaw 4/1/00 AA 367,627
Allen Park 261630001 14700 Goddard 42.2286 -83.2083 pop exp 44201 2 nghbrhd Wayne 1/1/80 DWL 4,313,002
Detroit - E 7 Mile 261630019 11600 East Seven Mile Road 42.4308 -83.00028 max conc 44201 2 urban Wayne 4/11/77 DWL 4,313,002
Tribal Stations
Monitoring Sites Pop
Site AIRS Start (2017
Name Site ID Address Latitude Longitude Purpose Purpose Purpose Scale County Date MSA 1 Estimate)
Manistee 261010922 3031 Domres Rd 44.307 -86.24268 transport 44,201 1 regional Manistee 4/1/06 Not in MSA N/A
Sault Ste. Marie 260330901 650 W Easterday Ave 46.4936 -84.3641 transport 44,201 1 nghbrhd Chippew a 1/1/12 Not in MSA N/A
1 MSA Key: A = Allegan Micropolitan Area HGH = Holland-Grand Haven MSA
AA = Ann Arbor MSA KP = Kalamazoo-Portage MSA
AL = Adrian Micropolitan Area LEL= Lansing-E. Lansing MSA
DWL = Detroit-Warren-Livonia MSA MNS = Muskegon-Norton Shores MSA
F = Flint MSA NBH = Niles-Benton Harbor MSA
GW = Grand Rapids-Wyoming MSA SBM = South Bend-Mishawaka MSA (IN/MI)
SLAMS Stations
Houghton Lake and Lansing operate hourly all year

MICHIGAN’S 2019 ANNUAL AMBIENT AIR MONITORING NETWORK REVIEW - DRAFT
PAGE 29
Figure 6: Michigan’s Ozone Network
MICHIGAN’S 2019 ANNUAL AMBIENT AIR MONITORING NETWORK REVIEW - DRAFT
PAGE 30
Ozone Season and Modeling The length of the ozone season was modified, with the enactment of the 0.070 ppm 8-hour primary NAAQS. The new ozone NAAQS final rule extends the ozone season in Michigan from March 1 through October 31. This new season started with the 2017 ozone season. With the new 1-hour NO2 NAAQS, modeling conducted as part of the permitting process for new source review (NSR) has indicated that many facilities in Michigan could violate the standard. More refined modeling is an option using the Ozone Limiting Method or Plume Volume Molar Ratio Method (PVMRM), but more site-specific 1-hour NO2 background levels, as well as year-round ozone values, are necessary. Specifically, modeling staff need five years of ozone and NO2 data collected in small cities, urban, and rural areas. While Allen Park (2616309001) and Grand Rapids–Monroe St. (260810020) generate ozone values in urban areas throughout the year, levels in smaller cities and rural areas were not available. Therefore, beginning October 1, 2010, the MDEQ began to monitor for ozone throughout the year at the Lansing (260650012) and Houghton Lake (261130001) stations. This will continue at the new Lansing Filley (260650018). The collection of additional NO2 data to support NSR modeling is discussed in the NO2 section.
Ozone Quality Assurance Site operators conduct precision checks on the monitors every two weeks. The results of the precision checks are sent to the QA Coordinator for review each quarter. Each ozone monitor is also audited annually by the AMU’s QA Team. The audit utilizes a dedicated ozone photometer to assess the accuracy of the station monitor. The auditor also assesses the monitoring system (inspecting the sample line, filters, and the inlet probe), siting, and documentation of precision checks. The results of the ozone audits and precision checks indicate whether the monitor is meeting measurement quality objectives. The AMU uploads the results of the precision checks and audits to the USEPA’s AQS database each quarter. The QA Coordinator reviews all audits and hard copies are retained in the QA files. The USEPA conducts thru-the-probe audits of 20% of the MDEQ’s ozone monitors each year. The audit consists of delivering four levels of ozone to the station monitor through the probe. The percent difference that is measured by the auditor’s monitor is compared to the station monitor. The auditor also assesses station and monitoring siting criteria. The USEPA auditor provides the AMU with a copy of the audit results and uploads the audit data to AQS.

MICHIGAN’S 2019 ANNUAL AMBIENT AIR MONITORING NETWORK REVIEW - DRAFT
PAGE 31
Plans for the 2019 Ozone Monitoring Network Beginning October 1, 2009, the MDEQ began collecting ozone measurements all year at the NCore sites and plans to continue through 2019:
• Grand Rapids–Monroe St. (260810020); and
• Allen Park (261630001).
To support NSR modeling projects, the MDEQ will continue to collect ozone measurements all year through 2019:
• Lansing (260650018); and
• Houghton Lake (261130001). The current ozone network meets the minimum design specifications in 40 CFR Part 58. No ozone site reductions are planned at this time. The following monitors are planned to be retained as part of the 2019 ozone network, operating March 1 through October 31:
• Holland (260050003)
• Frankfort/Benzonia (260190003)
• Coloma (260210014)
• Cassopolis (260270003)
• Rose Lake 2 (260370002)
• Flint (260490021)
• Otisville (260492001)
• Harbor Beach (260630007) (downwind monitor)
• Kalamazoo (260770008)
• Evans (260810022)
• Tecumseh (260910007) (background monitor)
• New Haven (260990009)
• Warren (260991003)
• Scottville (261050007)
• Muskegon–Green Creek Rd. (261210039)
• Oak Park (261250001)
• Jenison (261390005)
• Port Huron (261470005)
• Seney (261530001)
• Ypsilanti (261610008)
• Detroit-E 7 Mile (261630019) To the best of our knowledge, these tribal monitors will also continue to operate in 2019:
• Manistee (261050922) (tribal monitor); and
• Sault Ste. Marie (260330901) (tribal monitor).

MICHIGAN’S 2019 ANNUAL AMBIENT AIR MONITORING NETWORK REVIEW - DRAFT
PAGE 32
PM2.5 MONITORING NETWORK The January 15, 2013, revision to the PM NAAQS lowered the PM2.5 annual average from 15.0 µg/m3 to 12.0 µg/m3. All sites in Michigan are currently meeting this standard. The October 17, 2006 changes to the monitoring regulations impacted the minimum number of PM2.5 sites in an MSA, as shown in Table 13.7 Background and transport monitors are required in addition to these minimum requirements. Although speciation monitoring is required, details specifying the exact number of sites and their sampling frequency were not stated in the October 17, 2006 regulations. However, the continued operation of the speciation trends site Allen Park (261630001) on a once every three day sampling schedule is required. Michigan does not spatially average PM2.5 values from multiple sites to determine attainment with the annual PM2.5 NAAQS. Therefore, if a PM2.5 monitor that is violating the NAAQS must be removed due to loss of access or funding, a replacement site need not be found, if the annual and/or 24-hour design value site(s) in that MSA are still operational. The attainment status of the area is dependent upon the design value sites.
Table 12: PM2.5 Minimum Monitoring Requirements
MSA Population1,2 Most Recent 3-year Design Value Concentrations ≥ 85% of
any PM2.5 NAAQS3
Most Recent 3-year Design Value Concentrations < 85% of any PM2.5
NAAQS3,4
> 1,000,000 3 2
500,000 – < 1,000,000 2 1
50,000 - ≤ 500,0005 1 0
1 Minimum monitoring requirements apply to the MSA. 2 Population based on the latest available census figures. 3 The PM2.5 NAAQS levels and forms are defined in 40 CFR Part 50. 4 These minimum monitoring requirements apply in the absence of a design value. 5 MSA must contain an urbanized area of 50,000 or more.
The regulations also state that any Federal Reference Method (FRM) monitors that are within ± 5% of the level of the 24-hour NAAQS must sample on a daily sampling frequency. The monitoring regulations also state that 50% of all required FRM sites must co-locate continuous PM2.5 measurements. In 2016, the MDEQ changed all FRM monitors to very sharp cut cyclones. The change outs were made in April and May 2016. This changed the method code from 118 to 145. The dates of each instrument conversion can be determined by the data in the USEPA AQS database. During 2018, the MDEQ will begin to make a method change for sampling of PM2.5 in its network. A slow transition from the filter-based PM2.5 FRM network to a continuous beta attenuation air monitor (BAM) network will be made. The following sites will shut down the FRM filter-based instruments and operate as continuous FEMs:
• Flint (260490021) will be a co-located site with a primary BAM(MetOne) and a secondary PM2.5 filter FRM;
7 Table D-5 of Appendix D to Part 58.

MICHIGAN’S 2019 ANNUAL AMBIENT AIR MONITORING NETWORK REVIEW - DRAFT
PAGE 33
• SWHS (261630015) will be a co-located site with a primary PM2.5 filter FRM and a secondary BAM (MetOne);
• Seney (261530001);
• Houghton Lake (261130001); and
• Tecumseh (260910007). Applying Table 12 to Michigan’s MSAs, the resulting population totals and most recent 3-year design values are presented in Table 13. Design values shown in bold print represent the controlling site in each MSA, which is also called the design value site. Table 13: Application of the Minimum PM2.5 Monitoring Requirements in the October 17,
2006 Final Revision to the Monitoring Regulation to Michigan's PM2.5 FRM Network
annual 24-hr
85% of 12 ug/m3 85% of 35 ug /m3
10.2 30
The 3-year PM2.5 annual average at MSA Design Value site is shown in bold.
.
MSA
2015
Population Est. Counties Existing Monitors
2015-2017
3-year PM2.5
design value
(annual)
2015-2017
3-year PM2.5
design value (24-
Hr)
Min. No.
monitors
Required Comments
Detroit-Warren-Livonia MSA 4,313,002 Macomb New Haven 8.2 23 3
Oakland Oak Park 8.5 23
Wayne Allen Park 9.0 22 daily
Detroit-SW HS 11.2 22
Detroit - Linwood 9.4 25
Detroit - E 7 Mi 8.6 21
Livonia 8.5 22
Dearborn 10.9 26
Wyandotte 7.8 20
Detroit-FIA/Lafayette 8.5 21
Livonia Near Road 8.8 21.9
Lapeer ---
St Clair Port Huron 8.4 22
Livingston ---
Flint MSA 407,385 Genesee Flint 7.5 19 0
Monroe MSA 149,649 Monroe Sterling State Park 8.2 22 0
Ann Arbor MSA 367,627 Washtenaw Ypsilanti 8.4 21 0
Grand Rapids-Wyoming MSA 1,059,113 Kent GR - Monroe St. 8.5 23 2
GR - Wealthy St. 9.1 25
Barry ---
Ottawa Jenison (closed)
Montcalm ---
Muskegon-Norton Shores MSA 173,693 Muskegon Muskegon - Apple St. (closed) 0
Lansing-East Lansing MSA 477,,656 Clinton ---
Ingham Lansing 7.7 20 0
Eaton ---
Bay City MSA 104,239 Bay Bay City 7.1 22 0
Kalamazoo-Portage MSA 338,338 Kalamazoo Kalamazoo 8.3 22 0
Van Buren ---
Niles-Benton Harbor MSA 154,259 Berrien Coloma 7.8 21 0
Jackson MSA 158,640 Jackson ---
Battle Creek MSA 134,128 Calhoun ---
South Bend-Mishaw aka MSA 321,815 Cass ---
St. Joseph, IN 0
Other areas
Allegan Holland 7.5 21 micropolitan area
Missaukee Houghton Lake 5.1 15
Manistee Manistee 5.9 17
Tecumseh Lenawee 7.8 19
Sault Ste. Marie Chippewa 5.6 17
5% of the 24-Hr NAAQS
33-37 = 5% NAAQS
The annual avg & 24-hr avg are rounded to 1 and 0 decimal points respectively.

MICHIGAN’S 2019 ANNUAL AMBIENT AIR MONITORING NETWORK REVIEW - DRAFT
PAGE 34
The reduced concentrations of PM2.5 measured since 2010 have caused the 2015-2017 design values to drop markedly in many MSAs. The minimum number of monitoring sites in Monroe, Ann Arbor, Holland-Grand Haven, Muskegon-Norton Shores, Lansing-East Lansing, Bay City, Kalamazoo-Portage, Flint, and Niles-Benton Harbor has fallen from one site to zero. Due to an increase in population, two monitors sites are again required in the Grand Rapids-Wyoming MSA. Those monitors are located at the Grand Rapids-Monroe St. site (260810020) and the Jenison site (261390005). Only three PM2.5 FRM monitors are required in the Detroit-Warren-Livonia MSA. Dearborn (261630033) has historically been the highest annual design value site; however, this year Detroit-SWHS (261630015) is the highest. Allen Park (261630001) is the population-oriented trend site, and as such, is also required to collect speciated PM2.5 samples on a once every three day schedule. The Wyandotte site (261630036) has the lowest design values in Wayne County. The Linwood site (261630016) also has a low design value and is located in Wayne County between the Dearborn (261630033) and E 7 Mile (261630019) sites. The MDEQ plans to shut down the Wyandotte and Linwood sites.
The Detroit-SWHS site (261630015) is the highest in the Detroit-Warren-Livonia MSA. With construction of the second international bridge crossing near this site, the MDEQ will continue operating the primary PM2.5 FRM monitor and will add a PM2.5 BAM FEM monitor as part of the Gordie Howe International Bridge monitoring effort. Detroit–FIA/Lafayette (261630039) was a special purpose monitor that has been located to measure impacts from diesel-powered mobile sources and from the international border crossing at the Ambassador Bridge. This site will be shut down in June 2018 due to a loss of site access. Since the MDEQ is adding three new FEM BAM sites near this site, there are no plans to replace it. The E 7 Mile site (261630019) is near the border of Wayne and Macomb Counties. The MDEQ will continue to operate this site. The sites at New Haven (260990009) and Oak Park (261250001) are the only sites in Macomb and Oakland Counties, respectively. The MDEQ will continue to operate these. The Livonia site (261630025) and the Livonia Near-road site (261630095) are in western Wayne County. The Livonia Near-road site (261630095) fulfills the requirement for PM2.5 monitoring at a near-road site. Since values at the Livonia Site (261630025) have been rapidly decreasing and the Livonia Near-road site is only 450 feet away, the MDEQ is planning to discontinue the original Livonia site (261630025). Through a cooperative grant project with USEPA Region 5 and the USEPA’s Office of Research and Development (ORD), the MDEQ deployed a special purpose PM2.5 FRM sampler to Tecumseh (260910007) in Lenawee County on April 1, 2008. Other special measurements that were added to the Tecumseh site include PM2.5 speciation and continuous EC/OC. Beginning January 1, 2019, the MDEQ will discontinue the two types of speciation monitors. In addition, the MDEQ will change the method of the PM2.5 collection, to a continuous FEM method, by installing a BAM FEM monitor sometime in 2018. Tecumseh is the upwind background site near the Detroit-Warren-Livonia MSA where PM2.5 measurements will continue.

MICHIGAN’S 2019 ANNUAL AMBIENT AIR MONITORING NETWORK REVIEW - DRAFT
PAGE 35
Two monitors were required in the Grand Rapids-Wyoming MSA. The Grand Rapids-Monroe St. (260810020) is an NCore site and is therefore required to retain the PM2.5 monitor, and as such is also required to collect speciated PM2.5 samples on a once every three day schedule. The second site is located at the Jenison (261390005) site. As shown in Table 13, using the most recent three years of data, the Flint (260490021) monitor has an annual and a 24-hour design value equaling 7.5 and 19 µg/m3, respectively. Both of these values are less than 85% of their respective NAAQS. Therefore, a PM2.5 monitoring site is no longer required in the Flint MSA. However, no changes are suggested at this time other than the addition of a continuous FEM BAM to be added in 2018. The BAM will be the primary monitor at this site and the FRM will be the co-located monitor. This will fulfill the requirement to have a BAM co-located with an FRM in the PQAO. Fine particulate concentrations have dropped below 85% of the level of the NAAQS in the Ann Arbor MSA, so a monitor is no longer required. The Ypsilanti site (261610008) is located in a ZIP code with some of the highest incidences of asthma in Michigan. A co-located monitor is also located at this site to determine precision. No changes are suggested at this time. The annual and 24-hour PM2.5 design values at the Lansing monitor (260650012) are no longer greater than 85% of the NAAQS, indicating that monitoring is no longer required. The MDEQ will continue to operate the monitor at the newly relocated site, Lansing Filley (260650018) which was moved in May 2018. The Saginaw MSA is required to have a PM2.5 FRM site. The USEPA Regional Administrator granted a waiver allowing for the Bay City site (260170014) to fulfill this requirement. The 24-hour PM2.5 design value of the monitor in Bay City is less than 85% of the NAAQS, indicating that monitoring is no longer required. The MDEQ will continue to operate the monitor. The Kalamazoo monitor (260770008) fulfilled the requirement that the Kalamazoo-Portage MSA have one FRM sampler. Both the most recent 24-hour and annual design value at the Kalamazoo monitor are now less than 85% of the respective NAAQS, indicating that a site is no longer necessary in this MSA. The MDEQ will discontinue operation of both FRM monitors and replace them with co-located continuous FEM BAM in 2018. If the MDEQ installs enough BAM monitors in 2018 to require a BAM to BAM co-location, a second FEM BAM will be installed at this site. The PM2.5 monitor in Holland (260050003) in Allegan County is in a micropolitan area. The monitor’s design value is no longer within 85% of the NAAQS. Now that concentrations have fallen, it may be possible to discontinue monitoring at Holland, but the MDEQ will continue to operate the monitor. Houghton Lake (261130001) is the background PM2.5 FRM site in Michigan. The MDEQ plans to replace this monitor with a continuous FEM BAM in 2018. There are two tribal PM2.5 monitoring sites located in Michigan; one in Manistee (261010922) operated as a FRM filter-based sampler, and the other is in Sault Ste. Marie (260330901). It operates as a continuous FEM BAM. It is anticipated that both sites will continue to sample for
PM2.5. Table 14 summarizes the PM2.5 FRM monitoring site information for 2018 and 2019. Figure 7 illustrates the geographical distribution of PM2.5 FRM monitors for 2018 and 2019.

MICHIGAN’S 2019 ANNUAL AMBIENT AIR MONITORING NETWORK REVIEW - DRAFT
PAGE 36
Table 14: Michigan’s PM2.5 FRM Network
Operating Schedule: Once every 6 days, once every 3 days or daily see below. SLAMS NetworkMethod: Partisol 2025 Rupprecht & Patashnick Samplers, Method Code 145
Monitoring Sites Pop
Site AQS Sampling Purpose/ Parameter Start (2015
Name Site ID Address Latitude Longitude Frequency Type Code POC Scale County Date MSA 1 Estimate)
Holland 260050003 966 W. 32nd, Holland 42.767778 -86.148611 1:3 Pop. Exp. 88101 1 Neighborhood Allegan 10/31/98 A 116,447
Bay City 260170014 1001 Jennison St 43.571389 -83.890833 1:3 Pop. Exp. 88101 1 Neighborhood Bay 8/24/00 BC 104,239
Flint 260490021 3610 Iow a St., Flint 43.04722 -83.670278 1:6, co-loc Pop. Exp. 88101 2 Neighborhood Genesee 12/16/98 F 407,385
Lansing Filley 260650018 815 Filley St 42.761654 -84.562879 1:3 Pop. Exp. 88101 1 Neighborhood Ingham 5/17/18 LEL 477,656
Grand Rapids -
Monroe St. 260810020 1179 Monroe St., NW, 42.984167 -85.671389 1:3 Pop. Exp. 88101 1 Neighborhood Kent 10/23/98 GW 1,059,113
Grand Rapids -
Monroe St. 260810020 1179 Monroe St., NW, 42.984167 -85.671389 1:6, coloc Pop. Exp. 88101 2 Neighborhood Kent 10/23/98 GW 1,059,113
New Haven 260990009 57700 Gratiott 42.731389 -82.793611 1:3 Pop. Exp. 88101 1 Neighborhood Macomb 12/22/98 DWL 4,313,002
Oak Park 261250001 13701 Oak Park Blvd. 42.463056 -83.183333 1:3 Pop. Exp. 88101 1 Neighborhood Oakland 12/25/98 DWL 4,313,002
Jenison 261390005 6981 28th Ave 42.894402 -85.85278 1:6 Pop. Exp. 88101 1 urban Ottaw a 1/2/18 GW 1,059,113
Port Huron 261470005 2525 Dove Rd. 42.953333 -82.456389 1:3 Pop. Exp. 88101 1 Urban Saint Clair 2/11/99 DWL 4,313,002
Ypsilanti 261610008 555 Tow ner Ave. 42.240556 -83.599722 1:3 Pop. Exp. 88101 1 Neighborhood Washtenaw 8/4/99 AA 367,627
Ypsilanti 261610008 555 Tow ner Ave. 42.240556 -83.599722 1:6, co-loc Pop. Exp. 88101 2 Neighborhood Washtenaw 8/4/99 AA 367,627
Allen Park 261630001 14700 Goddard 42.228611 -83.208333 1:1 Pop. Exp. 88101 1 Neighborhood Wayne 5/12/99 DWL 4,313,002
Detroit - SWHS 261630015 150 Waterman 42.302778 -83.106667 1:3
Pop. Exp.
Max. Conc. 88101 1 Neighborhood Wayne 2/26/99 DWL 4,313,002
Detroit - E 7 Mile 261630019 11600 E. 7 Mile 42.430833 -83.000278 1:3 Pop. Exp. 88101 1 Neighborhood Wayne 4/30/00 DWL 4,313,002
Livonia Near Road 261630095 18790 Haggerty Rd. 42.421494 -83.425168 1:3 Near Road 88101 1 Micro Wayne 1/1/15 DWL 4,313,002
Dearborn 261630033 2842 Wyoming, Salina School 42.306666 -83.148889 1:3
Pop. Exp.
Max. Conc. 88101 1 Neighborhood Wayne 2/5/99 DWL 4,313,002
Dearborn 261630033 2842 Wyoming, Salina School 42.306666 -83.148889 1:6, co-loc
Pop. Exp.
Max. Conc. 88101 2 Neighborhood Wayne 2/5/99 DWL 4,313,002
Special Purpose and Tribal PM2.5 Monitors in Michigan
Monitoring Sites Pop
Site AQS Sampling Purpose/ Parameter Start (2015
Name Site ID Address Latitude Longitude Frequency Type Code POC Scale County Date MSA 1 Estimate)
Manistee 261010922 3031 Domres Rd. 44.307 -86.24268 1:3 Tribal 88101 1 Regional Manistee 4/2/06 Not in CBSA N/A
1 MSA Key: A = Allegan Micropolitan Area KP = Kalamazoo-Portage MSA
AA = Ann Arbor MSA LEL = Lansing-E. Lansing MSA
AL = Adrian Micropolitan Area M = Monroe MSA
DWL = Detroit-Warren-Livonia MSA MNS = Muskegon-Norton Shores MSA
F = Flint MSA NBH = Niles-Benton Harbor MSA
GW = Grand Rapids-Wyoming MSA SBM = South Bend-Mishawaka MSA (IN/MI)
HGH = Holland-Grand Haven MSA

MICHIGAN’S 2019 ANNUAL AMBIENT AIR MONITORING NETWORK REVIEW - DRAFT
PAGE 37
Figure 7: Michigan’s PM2.5 FRM Monitoring Network

MICHIGAN’S 2019 ANNUAL AMBIENT AIR MONITORING NETWORK REVIEW - DRAFT
PAGE 38
PM2.5 Quality Assurance The PM2.5 sampling is addressed in the AMU’s program QAPP. The MDEQ operates four co-located PM2.5 FRM samplers, meeting the precision monitoring requirement of 15%. The sampling frequency of the precision samplers at Grand Rapids–Monroe St. (260810020), Kalamazoo (260770008), Ypsilanti (261610008), and Dearborn (261630033) is once every six days. As the network is converted over to FEM BAM, the co-location sites will be adjusted. The MDEQ’s station operators conduct flow checks every four weeks to ensure the flow rate is meeting the measurement quality objectives. Results from these flow checks are submitted to the PM2.5 auditor each month for review and are uploaded to the USEPA’s AQS database each quarter. Every six months, each PM2.5 sampler is audited by a member of the AMU’s QA Team. The auditor has a separate line of supervision from the site operator and uses dedicated equipment for audits. The audit assesses the accuracy of the flow, as well as the monitor sampling and siting criteria. Every flow audit is reviewed by the QA Coordinator, copies are retained in the QA files, and the audits are uploaded to the USEPA’s AQS database. The AMU’s auditor also performs a systems audit for each sampler. The systems audit evaluates the siting criteria, condition of the sampling site/station, and other parameters. Copies of the systems audit forms are reviewed by the QA Coordinator and are retained in the QA central files. The MDEQ participates in the USEPA’s Performance Evaluation Program (PEP) audits at eight sites each year. The USEPA auditor sets up a PM2.5 monitor to run side-by-side with the station PM2.5 sampler on a run day. The filter from the PEP audit is sent to an independent laboratory for analysis. Once the MDEQ filter weight is entered into the USEPA’s AQS database, the audit filter weight is entered by the USEPA whereby the concentrations are compared between the PEP audit filter and the station filter. The USEPA auditor also assesses the station and monitor siting criteria to evaluate adequacy of the location, including distances from trees, exhaust vents, and large buildings. Probe heights and separation distances are also assessed.
Plans for the 2018-2019 PM2.5 FRM Monitoring Network The following PM2.5 FRM monitors will be retained as part of the 2019 network:
• The one in three day PM2.5 FRM monitor in Holland (260050003)
• The one in three day PM2.5 FRM monitor in Bay City (260170014)
• The one in three day PM2.5 FRM monitor in Lansing (260650018)
• The one in three day PM2.5 FRM monitor in Grand Rapids-Monroe St. (260810020)
• The one in three day PM2.5 FRM monitor in Jenison (261390005)
• The one in three day PM2.5 FRM monitor in New Haven (260990009)
• The one in three day PM2.5 FRM monitor in Oak Park (261250001)
• The one in three day PM2.5 FRM monitor in Port Huron (261470005)
• The one in three day PM2.5 FRM monitor in Ypsilanti (261610008)
• The daily PM2.5 FRM monitor in Allen Park (261630001)
• The one in three day PM2.5 FRM monitor at Detroit-SWHS (261630015)
• The one in three day PM2.5 FRM monitor at Detroit-E 7 Mile (261630019)
• The one in three day PM2.5 FRM monitor at Livonia-Near-road (261630095)
• The one in three day PM2.5 FRM monitor in Dearborn (261630033)

MICHIGAN’S 2019 ANNUAL AMBIENT AIR MONITORING NETWORK REVIEW - DRAFT
PAGE 39
The following co-located precision monitors will continue operation contingent upon adequate funding:
• The one in six day PM2.5 FRM monitor at Grand Rapids-Monroe St. (260810020);
• The one in six day PM2.5 FRM monitor in Ypsilanti (261610008);
• The one in six day PM2.5 FRM monitor in Dearborn (261630033); and
• The one in three day PM2.5 FRM monitor in Flint (260490021). The following PM2.5 FRM monitors will be shut down:
• The one in three day PM2.5 FRM monitor in Livonia (261630025);
• The one in three day PM2.5 FRM monitor in Linwood (261630016);
• The one in three day PM2.5 FRM monitor in Wyandotte (261630036); and
• The one in three day PM2.5 FRM monitor in FIA (261630039).
The following PM2.5 FRM filter-based samplers will be replace with FEM BAM Monitors:
• The one in three day PM2.5 FRM monitor in Houghton Lake (261130001);
• The one in three day PM2.5 FRM monitor in Tecumseh (260910007). The following PM2.5 continuous FEM BAM monitors will be added to the network:
• Flint (260490021) will be primary to the secondary PM2.5 FRM;
• SWHS (261630015) will be secondary to the primary PM2.5 FRM; and
• Seney (261530001) replacing the TEOM.
To the best of our knowledge, the following tribal FRM monitors will continue operation:
• A one in three day PM2.5 FRM tribal monitoring site in Manistee (261010922), contingent upon the Little River Band of Ottawa Indians plans for 2019.

MICHIGAN’S 2019 ANNUAL AMBIENT AIR MONITORING NETWORK REVIEW - DRAFT
PAGE 40
CONTINUOUS PM2.5 MONITORING NETWORK According to the October 17, 2006, changes to the monitoring regulations, 50% of the minimum number of required FRM sites must be co-located with a continuous PM2.5 monitor. The 13 continuous monitors operational in the state exceed the minimum number that are required. In 2018, the MDEQ operated Rupprecht & Patashnick TEOM samplers to supply continuous fine particulate data at 13 monitoring sites, as shown in Table 15. The MDEQ currently is meeting the minimum 50% co-location requirement. Figure 8 illustrates the geographical distribution of the continuous monitoring network. Michigan’s NCore stations are required to operate continuous PM2.5 samplers. Both Grand Rapids–Monroe St. (260810020) and Allen Park (261630001) currently have PM2.5 TEOMs, meeting the requirement for continuous PM2.5 measurements. The MetOne BAM operated by the Inter-Tribal Council, Sault Ste. Marie (260330901), is currently operated as an FEM and can be compared to the NAAQS. In 2018, the MDEQ will make a method change for sampling of PM2.5 at some of the sites as seen below. A slow transition from the filter-based PM2.5 FRM network to a BAM network will be made. The instruments will operate as continuous FEMs. The FEM BAMs will also replace the TEOM instruments as the MDEQ is able to purchase new instruments.
The MDEQ operates the TEOMs from March through October with an inlet temperature of 50C. Once the ozone season is over, starting November 1, the MDEQ reduces the inlet temperature to
30C in the winter months to minimize loss of nitrates. Operating the TEOMs in this way maximizes comparability with the FRMs. The PM2.5 TEOM sites operate to support AIRNOW real time data reporting and to provide adequate spatial coverage. This will continue as long as adequate levels of funding are received.

MICHIGAN’S 2019 ANNUAL AMBIENT AIR MONITORING NETWORK REVIEW - DRAFT
PAGE 41
Table 15: Michigan’s Continuous PM2.5 Monitoring Network
Operating Schedule: continuous
Method: Rupprecht & Patashnick Tapered Element Oscilating Microbalance (TEOMS) Samplers, Method Codes 701/703
Monitoring Sites Pop
Site AQS Purpose/ Parameter Start (2015
Name Site ID Address Latitude Longitude Type Code POC Scale County Date MSA 1 Estimate)
Bay City 260170014 1001 Jennison St 43.571389 -83.890833 Pop. Exp. 88503 3 Neighborhood Bay 11/19/05 BC 104,239
Lasing Filley 260650018 815 Filley Street 42.761654 -84.562879 Pop. Exp. 88101 1 Neighborhood Ingham 5/17/18 LEL 477,656
Grand Rapids - Monroe St 260810020 1179 Monroe St., NW, 42.984167 -85.671389 Pop. Exp. 88503 3 Neighborhood Kent 11/4/99 GW 1,059,113
Port Huron 261470005 2525 Dove Rd. 42.953333 -82.456389 Pop. Exp. 88503 3 Regional Saint Clair 9/18/03 DWL 4,313,002
Ypsilanti 261610008 555 Tow ner Ave 42.240556 -83.599722 Pop. Exp. 88503 3 Neighborhood Washtenaw 2/24/00 AA 367627
Allen Park 261630001 14700 Goddard 42.228611 -83.208333 Pop. Exp. 88503 3 Neighborhood Wayne 12/1/00 DWL 4,313,002
Dearborn 261630033 2842 Wyoming, Salina School 42.306666 -83.148889
Pop. Exp.
Max. Conc. 88503 3 Neighborhood Wayne 9/26/03 DWL 4,313,002
Method:
Sault Ste. Marie 260330901 650 W Easterday Ave 46.49366 -84.36416 Tribal 88101 3 Regional Chippew a 1/1/2012 Not in MSA N/A
Flint 260490021 Whaley Park, 3610 Iow a St., Flint 43.04722 -83.670278 Pop. Exp. 88101 1 Neighborhood Genesee TBD F 407,385
Kalamazoo 260770008 Fairgrounds, 1400 Olmstead Rd. 42.278056 -85.541944 Pop. Exp. 88101 2 Neighborhood Kalamazoo TBD KP 338,338
Kalamazoo. Co-located 260770008 Fairgrounds, 1400 Olmstead Rd. 42.278056 -85.541944 Pop. Exp. 88101 3 Neighborhood Kalamazoo TBD KP 338,338
Tecumseh 260910007 6792 Raisin Center Highw ay 41.995556 -83.946667 up w ind backgrd 88101 1 Regional Lenaw ee TBD AL 98623
Houghton Lake 261130001 1769 S Jeffs Rd. 44.310556 -84.891944 Background 88101 1 Regional Missaukee TBD Not in MSA N/A
Seney 261530001 Seney Wildlife Refuge, HCR 2 Box 1 46.28888 -85.95027 Background 88101 1 Regional Schoolcraft TBD Not in MSA N/A
SWHS 261630015 150 Waterman , Detroit 42.302778 -83.106667 Pop. Exp. 88101 1 Neighborhood Wayne TBD DWL 4,313,002
DP4TH 261630098 4700 W.Fort St. 42.312158 -83.091943 Pop. Exp. 88101 1 Neighborhood Wayne TBD DWL 4,313,002
Trinity 261630099 9191 W Fort St. 42.295824 -83.129431 Pop. Exp. 88101 1 Neighborhood Wayne TBD DWL 4,313,002
TBD 261630100 Pop. Exp. 88101 1 Neighborhood Wayne TBD DWL 4,313,002
1 MSA Key:
AA = Ann Arbor MSA F = Flint MSA F = Flint MSAF = Flint MSA
AL = Adrian Micropolitan Area GW = Grand Rapids-Wyoming MSAGW = Grand Rapids-Wyoming MSAGW = Grand Rapids-Wyoming MSA
BC = Bay City MSA KP = Kalamazoo-Portage MSAKP = Kalamazoo-Portage MSAKP = Kalamazoo-Portage MSA
DWL = Detroit-Warren-Livonia MSA LEL = Lansing-E. Lansing MSALEL = Lansing-E. Lansing MSALEL = Lansing-E. Lansing MSA
Beta Attenuation Monitor, Method Code 170

MICHIGAN’S 2019 ANNUAL AMBIENT AIR MONITORING NETWORK REVIEW - DRAFT
PAGE 42
Figure 8: Michigan’s Continuous PM2.5 Network
Continuous PM2.5 TEOM and FEM BAMs Quality Assurance The AMU site operator conducts flow checks for precision every four weeks. Results from the precision checks are sent to the auditor for review each month and reported to the USEPA’s AQS database each quarter. An independent flow rate audit is conducted by a member of the AMU’s QA Team every six months. During the flow rate audit, the auditor assesses the condition of the station, sample probe, and siting criteria. The QA Coordinator reviews all audit results and hard copies of the results are retained in the QA files. Each quarter the flow audits are uploaded to the USEPA’s AQS database.

MICHIGAN’S 2019 ANNUAL AMBIENT AIR MONITORING NETWORK REVIEW - DRAFT
PAGE 43
Plans for the 2019 Continuous PM2.5 TEOM and FEM BAMs Network There is one addition planned for the PM2.5 TEOM network, but if the USEPA cuts funding, operation of some additional TEOMs may need to be discontinued. Continued operation of the PM2.5 TEOMs at Dearborn (261630033), Allen Park (261630001), and Grand Rapids-Monroe St. (260610020) will be given the highest priority. The Dearborn (261630033) monitor measures the highest concentrations of PM2.5 in Michigan and is needed for the development of attainment strategies, AIRNOW reporting, diurnal profiling and estimation of risk. The Allen Park (261630001) monitor is needed to provide a counterpoint to the measurements taken at Dearborn. Allen Park is a population-oriented site designated as the trend site for Michigan. Dearborn is the maximum concentration site, so comparisons between these sites are important to characterize point source impacts on ambient air quality. Also, the PM2.5 TEOMs at Grand Rapids-Monroe St. (260810020) and Allen Park (261630001) need to continue operation due to the NCore requirement for continuous fine particulate measurements. During 2019, contingent upon adequate levels of funding, Michigan is planning to continue to operate PM2.5 TEOM monitors at:
• Bay City (260170014)
• Grand Rapids–Monroe St. (260810020)
• Port Huron (261470005)
• Ypsilanti (261610008)
• Allen Park (261630001)
• Dearborn (261630033)
• Lansing (260650018)
• Kalamazoo (260770008) During 2018, contingent upon adequate levels of funding, Michigan plans to install continuous PM2.5 FEM BAM monitors at:
• Flint (260490021) will be a co-located site with a primary BAM (MetOne) and a secondary PM2.5 filter FRM
• SWHS (261630015) will be a co-located site with a primary PM2.5 filter FRM and a secondary BAM (MetOne)
• Seney (261530001)
• Houghton Lake (261130001)
• Tecumseh (260910007)
• DP4th (261630098)
• Trinity (261630099)
• TBD (261630100)
During June 2018, due to loss of site access the TEOM at FIA (261630039) will be shutdown. During 2019, to the best of our knowledge, the Inter-Tribal Council is planning to continue to operate as an FEM a PM2.5 BAM MetOne monitor at Sault Ste. Marie (260330901).

MICHIGAN’S 2019 ANNUAL AMBIENT AIR MONITORING NETWORK REVIEW – DRAFT
PAGE 44
SPECIATED PM2.5 MONITORING NETWORK Continued operation of the speciation trend site network is required on a national level and these sites sample on frequency of once every three days, following the USEPA sampling schedule. The speciated trend site in Michigan is located at Allen Park (261630001). All remaining supplemental speciation sites operate on a once every six day schedule, except for the NCore site at Grand Rapids–Monroe St. (260810020), which also has a sampling frequency of once every three days. Tecumseh (260910007) was a special purpose monitor for a study, which is now complete, and will be shut down in 2019. The speciation network is described in Table 16. Figure 9 illustrates the current coverage across Michigan. Note that Allen Park (261630001) contains a suite of carbon channel samplers: an IMPROVE, a MetOne SASS and an URG 3000 N. The MDEQ will continue to operate the three different carbon samplers to support USEPA OAQPS inter-sampler comparability studies.
Continuous Speciation Measurements In addition to the speciated measurements integrated over a 24-hour time period described above, The MDEQ operates continuous monitors for carbon black and elemental carbon/organic carbon (EC/OC). Large spot aethalometers from Magee Scientific operate at Dearborn (261630033) and Allen Park (261630001). These units measure carbon black, which is very similar to and correlates well with elemental carbon. As part of the CSATAM 2015 grant, three new aethalometers were purchased from Magee Scientific. These were installed in 2016 as Special Purpose Monitors at Eliza Howell Near-road (261630093), Eliza Howell Downwind (261630094), and Livonia Near-road (261630095). Since the Air Toxics Near-roadway study has been completed, these instruments will be relocated to the three new Gordie Howe International Bridge monitoring locations and one newly purchased monitor will be installed at the southwest Detroit site. A continuous EC/OC monitor from Sunset Laboratories was deployed at the Detroit-Newberry site (261630038) site to determine diurnal variation in elemental carbon and organic carbon. This EC/OC is currently on reserve as a backup due to the loss of site access at Detroit-Newberry. To help in the development of attainment strategies, the Southeast Michigan Council of Governments (SEMCOG) purchased a second Sunset EC/OC unit that was deployed at Dearborn (261630033). The instrument at Dearborn became non-functional in February 2018. An additional EC/OC unit was deployed at Tecumseh (260910007) to characterize levels upwind from Detroit. This will be shut down sometime in 2018 due to the cost of replacement parts, age of the equipment, and the frequency of repairs.
Speciation Quality Assurance The MDEQ has adopted and follows the USEPA’s QAPP for the speciation trends network. The site operator conducts flow checks for precision every four weeks. Results from the precision checks are sent to the auditor for review each month and uploaded to the USEPA’s AQS database each quarter. The QA team conducts flow rate audits on the PM2.5 speciation monitors every six months. The auditor also assesses the monitoring station and siting criteria to ensure it continues to meet the measurement quality objectives. Audit results are reviewed by the AMU’s QA Coordinator. Audit data is also uploaded to the USEPA’s AQS database each quarter. The USEPA periodically conducts technical systems audits and instrument audits for the speciation network. The USEPA also conducts audits of national contract laboratory, which supplies speciation analysis services for the entire nation.

MICHIGAN’S 2019 ANNUAL AMBIENT AIR MONITORING NETWORK REVIEW - DRAFT
PAGE 45
Table 16: Michigan’s PM2.5 Speciation Network
Operating Schedule: Once Every 3 days (Allen Park and Grand Rapids), once every 6 days all others. Follows USEPA sampling schedule.
Method: Met One SASS and URG 3000 N units to collect organic & elemental carbon, Method Code 811 (SASS) Method Code 839/840 (URG)
Monitoring Sites Pop
Site AQS Sampling Purpose/ Start (2015
Name Site ID Address Latitude Longitude Frequency Type POC Scale County Date MSA 1 Estimate) Comments
Grand Rapids -
Monroe St 260810020 1179 Monroe St., NW, 42.984 -85.67139 1:3 Pop. Exp. 5 Neighborhood Kent 11/4/99 GW 1,038,583
Allen Park 261630001 14700 Goddard 42.229 -83.20833 1:3 Pop. Exp. 5 Neighborhood Wayne 12/1/00 DWL 4,302,043
Fort St. (SWHS) 261630015 150 Waterman St 42.303 -83.10667 1:6Pop. Exp.
Max. Conc. 5 Neighborhood Wayne 11/2/08 DWL 4,302,043
Dearborn 261630033 2842 Wyoming, Salina School 42.307 -83.14889 1:6Pop. Exp.
Max. Conc. 5 Neighborhood Wayne 9/26/03 DWL 4,302,043
Continuous Speciation MeasurementsMethod: Magee Aethalometer: Method Code 861
Pop
Site AQS Sampling Start (2015
Name Site ID Address Latitude Longitude Method Purpose POC Scale County Date MSA 1 Estimate) Comments
Allen Park 261630001 14700 Goddard 42.229 -83.20833McGee large spot Aethalometer
(carbon black) Pop. Exp. 1 Neighborhood Wayne 1/1/04 DWL 4,302,043
Dearborn 261630033 2842 Wyoming, Salina School 42.307 -83.14889McGee large spot Aethalometer
(carbon black)
Pop. Exp.
Max. Conc. 1 Neighborhood Wayne 12/19/03 DWL 4,302,043
Fort St. (SWHS) 261630015 150 Waterman St 42.303 -83.10667McGee large spot Aethalometer
(carbon black)
Pop. Exp.
Max. Conc. 1 Neighborhood Wayne TBD DWL 4,302,043
1 MSA Key:
DWL = Detroit-Warren-Livonia MSA SPM = Special Purpose Monitor
GW = Grand Rapids-Wyoming MSA
Current Speciation Sites
Monitoring Sites

MICHIGAN’S 2019 ANNUAL AMBIENT AIR MONITORING NETWORK REVIEW - DRAFT
PAGE 46
Figure 9: Michigan’s PM2.5 Speciation (SASS) Network

MICHIGAN’S 2019 ANNUAL AMBIENT AIR MONITORING NETWORK REVIEW - DRAFT
PAGE 47
Plans for the 2019 PM2.5 Speciation Monitoring Network During 2019, contingent upon adequate levels of funding, the MDEQ is planning to continue to operate 24-hour PM2.5 SASS speciation monitors at:
• Grand Rapids-Monroe St. (260810020) operating once every three days;
• Allen Park (261630001) operating once every three days;
• Dearborn (261630033) operating once every six days; and
• SWHS (261630015) operating once every six days. On January 1, 2019, the MDEQ is planning on shutdown the 24-hour PM2.5 SASS speciation monitor at Tecumseh (260910007). During 2018, the MDEQ is planning to discontinue operating hourly Sunset EC/OC monitors at:
• Dearborn (261630033); and
• Tecumseh (260910007). During 2019, contingent upon adequate levels of funding, the MDEQ is planning to continue to operate hourly Magee aethalometer monitors at:
• Dearborn (261630033); and
• Allen Park (261630001). During 2018, the MDEQ is planning on installing hourly Magee aethalometer monitors as part of the Gordie Howe International Bridge monitoring at:
• DP4TH 261630099);
• Trinity (261630099);
• TBD (261630100); and
• SWHS site (261630015).

MICHIGAN’S 2019 ANNUAL AMBIENT AIR MONITORING NETWORK REVIEW - DRAFT
PAGE 48
PM10 MONITORING NETWORK The October 17, 2006 monitoring regulations modified the minimum number of PM10 samplers required in MSAs. Since then, further revisions have occurred, relaxing the numbers of sites required in high population areas with low concentrations of PM10, as shown in Table 17.8
Table 17: PM10 Minimum Monitoring Requirements (Number of Stations per MSA)1
Population Category
High Concentration2
Medium Concentration3
Low Concentration4, 5
> 1,000,000 6-10 4-8 2-4
500,000 – 1,000,000 4-8 2-4 1-2
250,000 – 500,000 3-4 1-2 0-1
100,000 – 250,000 1-2 0-1 0
1 Selection of urban areas and actual numbers of stations per area within the ranges shown in this table will be jointly determined by the USEPA and the State Agency.
2 High concentration areas are those for which ambient PM10 data show ambient concentrations exceeding the PM10 NAAQS by 20% or more.
3 Medium concentration areas are those for which ambient PM10 data show ambient concentrations exceeding 80% of the PM10 NAAQS.
4 Low concentration areas are those for which ambient PM10 data show ambient concentrations < 80% of the PM10 NAAQS.
5 These minimum monitoring requirements apply in the absence of a design value.
Applying Table 17 to Michigan’s urban areas, population totals and historical PM10 data results in the design requirements that are shown in Table 18. According to the tables, two to four PM10 sites are required in the Detroit-Warren-Livonia Metropolitan Area. Currently, there are three sites in operation; one at Allen Park (261630001), one at Detroit-SWHS (261630015), and a co-located pair at the design value site at Dearborn (261630033). The co-located PM10 samplers at Dearborn fulfilled the 15% co-location requirement for the PM10 network. The PM10 monitoring requirements specify that two to four PM10 sites are required in the Grand Rapids-Wyoming MSA. There are currently two sites in operation, one at Grand Rapids-Monroe St. (260810020) and the second at Jenison (261390005). According to the requirements, either zero or one PM10 monitor is required in the Flint MSA. In 2006, the MDEQ operated a PM10 sampler in Flint (260490021) but as a result of budget cuts, PM10 sampling was discontinued on April 1, 2007. PM coarse measurements are required at NCore sites. One acceptable technology is to use two R & P Partisol Plus 2025 units; one equipped with a PM2.5 head and a very sharp cut cyclone and the second with a PM10 head and a down tube. PM coarse is determined by subtracting the fine particulate from the PM10. Therefore, to meet the NCore requirements, a Partisol sampler equipped with a PM10 head and a down tube was deployed to both Grand Rapids–Monroe St. (260810020) and Allen Park (261630001). Table 19 summarizes the PM10 monitoring site information for sites in operation in 2018 and 2019. Figure 10 shows the PM10 monitoring locations for 2018 and 2019.
8 Table D-4 of Appendix D to Part 58.

MICHIGAN’S 2019 ANNUAL AMBIENT AIR MONITORING NETWORK REVIEW - DRAFT
PAGE 49
Table 18: Application of the Minimum PM10 Monitoring Regulations in the April 30, 2007 Correction to the October 17, 2006 Final Revision to the Monitoring Regulation to
Michigan's PM10 Network
2015-2017
MSA
2015
Estimated
Population Counties Existing Monitors
most recent
3-year PM10
design value
(24-Hr)
Conc.
Class.
Min No
monitors
Required
Detroit-Warren-Livonia MSA 4,313,002 Macomb --- --- 2-4
Oakland --- ---
Wayne Allen Park 37 low
Detroit -SW HS 49 low
Dearborn 58 low
Lapeer --- ---
St Clair --- ---
Livingston --- ---
Flint MSA 407,385 Genesee --- low 0 -1
Monroe MSA 149,649 Monroe --- ---
Ann Arbor MSA 367,627 Washtenaw --- --- 0-1
Grand Rapids-Wyoming MSA 1,059,113 Kent GR - Monroe St 38
low 2-4
Barry --- ---
Ottawa Jenison started 2018 ---
Montcalm --- ---
Muskegon-Norton Shores MSA 173,693 Muskegon --- ---
Lansing-East Lansing MSA 477,656 Clinton --- --- 0-1
Ingham --- ---
Eaton --- ---
Bay City MSA 104,239 Bay --- ---
Saginaw-Saginaw Twp N MSA 191,934 Saginaw --- ---
Kalamazoo-Portage MSA 338,338 Kalamazoo --- --- 0-1
Van Buren --- ---
Niles-Benton Harbor MSA 154,259 Berrien --- ---
Jackson MSA 158,640 Jackson --- ---
Battle Creek MSA 134,128 Calhoun --- ---
South Bend-Mishawaka MSA 321,815 Cass --- --- 0-1
St. Joseph, IN --- ---
MSAs with populations greater than 500,000 require at least 1 PM 10 monitor.
Design value sites are in bold

MICHIGAN’S 2019 ANNUAL AMBIENT AIR MONITORING NETWORK REVIEW - DRAFT
PAGE 50
Table 19: Michigan’s PM10 Monitoring Network
Figure 10: Michigan’s PM10 Monitoring Network
Method: Manual High Volume Sampler: Method Code 109 (Dearborn also uses a R&P TEOM to make continuous measurements: Method Code 079)
Monitoring Sites Pop
Site AQS Sampling Monitor Purpose/ Parameter Start (2015
Name Site ID Address Latitude Longitude Frequency Type Type Code POC Scale County Date MSA 1 Estimate)
Allen Park 261630001 14700 Goddard 42.228611 -83.20833 1:6 High Vol pop exp 81102 1 nghbrhd Wayne 9/12/87 DWL 4,313,002
Detroit - SWHS 261630015 150 Waterman 42.302778 -83.10667 1:6 High Vol max conc 81102 1 nghbrhd Wayne 3/27/87 DWL 4,313,002
Dearborn 261630033 2842 Wyoming 42.306666 -83.14889 1:6 High Vol max conc 81102 1 nghbrhd Wayne 6/12/90 DWL 4,313,002
Grand Rapids -
Monroe St 260810020 1179 Monroe NW 42.984167 -85.67139 1:6 High Vol pop exp 81102 1 nghbrhd Kent 3/20/87 GW 1,059,113
Jenison 261390005
6981 28Th Ave.
Georgetow n Tw p. 42.894444 -85.85278 1:6 High Vol pop exp 81102 1 nghbrhd Ottaw a 1/1/18 GW 1,059,113
Dearborn 261630033 2842 Wyoming 42.306666 -83.14889 1:12
High Vol for
precision max conc 81102 9 nghbrhd Wayne 6/12/90 DWL 4,313,002
Dearborn
261630033
continuous 2842 Wyoming 42.306666 -83.14889 continuous R&P PM10 TEOM max conc 81102 3 nghbrhd Wayne 4/1/00 DWL 4,313,002
Method:
Method Code 127 (PM10) and Method Code 118 (PM2.5)
Monitoring Sites Pop
Site AQS Sampling Monitor Parameter Start (2015
Name Site ID Address Latitude Longitude Frequency Type Purpose Code POC Scale County Date MSA 1 Estimate)
Grand Rapids -
Monroe St 260810020 1179 Monroe NW 42.984167 -85.67139 1:6 Low Vol Partisol pop exp 81102 1 nghbrhd Kent 7/16/11 GW 1,059,113
Allen Park 261630001 14700 Goddard 42.228611 -83.20833 1:6 Low Vol Partisol pop exp 81102 1 nghbrhd Wayne 7/16/11 DWL 4,313,002
1 MSA Key: DWL= Detroit-Warren-Livonia MSA
GW = Grand Rapids-Wyoming MSA
NCore Low Volume PM Coarse Sites
Low volume Partisol 2025 Sampler with down tube and PM10 head co-loctaed with low volume Partisol 2025 PM2.5 Sampler. PM coarse determined by difference.

MICHIGAN’S 2019 ANNUAL AMBIENT AIR MONITORING NETWORK REVIEW - DRAFT
PAGE 51
PM10 Quality Assurance The AMU site operator conducts a flow check once a month. Flow check values are sent to the QA Coordinator each quarter and reported to the USEPA’s AQS database each quarter. An independent audit is conducted by a member of the AMU’s QA Team every six months. The auditor is in a separate line of reporting authority from the site operator and uses independent dedicated equipment to perform the flow rate audit. The auditor also assesses the condition of the monitor and siting criteria. The QA Coordinator reviews all audit results, and hard copies are retained in the QA files. Audit results are uploaded to the USEPA’s AQS database each quarter.
Plans for the 2019 PM10 Monitoring Network During 2019, contingent upon adequate levels of funding, the MDEQ is planning to operate high volume PM10 monitors sampling over 24 hours at:
• Monroe Street in Grand Rapids (260810020) on a once every six day schedule;
• The PM10 monitor in Jenison (261390005) on a once every six day schedule;
• The PM10 monitor in Allen Park (261630001) on a once every six day schedule;
• The PM10 monitor in Detroit–SWHS (261630015) on a once every six day schedule;
• The PM10 monitor in Dearborn (261630033) on a once every six day schedule; and
• The PM10 co-located monitor in Dearborn (261630033) on a once every twelve day schedule.
The MDEQ is planning to operate low volume PM10 monitors co-located with low volume PM2.5 monitors to calculate PM10-2.5 at the following NCore sites:
• The low volume PM10 monitor at Monroe St. in Grand Rapids (260810020) on a once every six day schedule; and
• The low volume PM10 monitor at Allen Park (261630001) on a once every six day schedule.
The MDEQ also planning to operate:
• PM10 TEOM at Dearborn (261630033) on an hourly schedule.

MICHIGAN’S 2019 ANNUAL AMBIENT AIR MONITORING NETWORK REVIEW - DRAFT
PAGE 52
CARBON MONOXIDE MONITORING NETWORK Prior to the latest CO NAAQS review, the MDEQ operated trace CO monitors at Grand Rapids–Monroe St. (260810020) and Allen Park (261630001) as part of NCore. On August 31, 2011,9 the USEPA finalized the new CO NAAQS and retained the level and form of the CO NAAQS but revised the design of the ambient monitoring network for CO to be more focused on heavily traveled urban roads. In the rule, CBSAs with population totals equal to or greater than one million people would be required to add CO monitors to near-road monitoring stations that are required in the NO2 network design. The MDEQ has operated CO monitors at Eliza Howell Near-road (261630093), Eliza-Downwind (261630094) and Livonia Near-road (261630095) sites. The Eliza-Downwind site is no longer required for the study and will be shut down in 2019. Table 20 summarizes the CO monitoring site information for sites that were in existence in 2018. Figure 11 shows the distribution of CO monitors across the state of Michigan.
CO Quality Assurance The AMU site operator performs a precision check of the analyzer every two weeks. Results of precision checks are sent to the QA Coordinator each quarter. Each monitor is audited annually by the AMU’s QA Team. The auditor has a separate reporting line of authority from the site operator. The auditor utilizes dedicated gas calibrator and calibration gases that are only for audits. The independent audit challenges the accuracy of the station monitor. The auditor also assesses the monitoring system (inspecting the sample line, filters, and inlet probe), siting, and documentation of precision checks. Results of the audits and precision checks indicate whether the monitor is meeting the measurement quality objectives. The AMU uploads the results of the precision checks and audits to the USEPA’s AQS database each quarter. The QA Coordinator reviews all audit results, and hard copies are retained in the QA files. External audits are conducted by the USEPA’s thru-the-probe audit procedure for regular and trace level CO monitors. The USEPA reports the results to AQS.
Plans for the 2019 CO Monitoring Network During 2019, contingent upon adequate levels of funding, the MDEQ plans to continue to operate trace level CO monitors to support NCore operations:
• Grand Rapids-Monroe St. (26810020); and
• Allen Park (261630001). During 2019, the MDEQ plans to continue to operate CO monitors to support the near-road network at:
• Eliza Howell (roadway) (261630093); and
• Livonia Near-road (261630095).
9 USEPA, “National Ambient Air Quality Standards for Carbon Monoxide,” 40 CFR parts 50, 53 and 58, proposed rule, January 28,
2011.

MICHIGAN’S 2019 ANNUAL AMBIENT AIR MONITORING NETWORK REVIEW - DRAFT
PAGE 53
During 2019, the MDEQ plans to shut down one near-road site:
• Eliza Howell (downwind) (261630094).
During 2018, two new CO monitors will be installed at two of the new Gordie Howe International Bridge sites:
• DP4TH (261630098); and
• Trinity (261630099).
Table 20: Michigan’s CO Monitoring Network
Operating Schedule: Continuous
Method: Gas Filter Correlation Analyzer- CO: Method 054 and Trace CO: Method Code 093
Ncore Sites (Trace)
Monitoring Sites Pop
Site AQS Purpose/ Parameter Start (2015
Name Site ID Address Latitude Longitude Measurement Type Code POC Scale County Date MSA 1 Estimate)
Grand Rapids -
Monroe St 260810020 1179 Monroe NW 42.98417 -85.671389 trace pop exp 42101 1 nghbrhd Kent 1/1/08 GW 1,059,113
Allen Park 261630001 14700 Goddard 42.22861 -83.208333 trace pop exp 42101 1 nghbrhd Wayne 1/1/08 DWL 4,313,002
Near Roadway Sites
Monitoring Sites Pop
Site AQS Parameter Start (2015
Name Site ID Address Latitude Longitude Measurement Purpose Code POC Scale County Date MSA 1 Estimate)
Eliza Howell #1 261630093 Service Road I-96 & Telegraph 42.38599 -83.26632 CO Near Road 42101 1 micro Wayne 9/1/11 DWL 4,313,002
Livonia Near Road 261630095 18790 Haggerty Road 42.42149 -83.425168 CO Near Road 42101 1 micro Wayne 1/1/15 DWL 4,313,002
Gordie Howe Bridge Study (GHBS)
Monitoring Sites Pop
Site AQS Parameter Start (2015
Name Site ID Address Latitude Longitude Measurement Purpose Code POC Scale County Date MSA 1 Estimate)
DP4TH 261630098 4700 W.Fort St. 42.31216 -83.091943 CO pop exp 42101 1 nghbrhd Wayne TBD DWL 4,313,002
Trinity 261630099 9191 W Fort St. 42.29582 -83.129431 CO pop exp 42101 1 nghbrhd Wayne TBD DWL 4,313,002
1 MSA Key:
DWL = Detroit-Warren-Livonia MSA GW = Grand Rapids-Wyoming MSA

MICHIGAN’S 2019 ANNUAL AMBIENT AIR MONITORING NETWORK REVIEW - DRAFT
PAGE 54
Figure 11: Michigan’s CO Monitoring Network
MICHIGAN’S 2019 ANNUAL AMBIENT AIR MONITORING NETWORK REVIEW - DRAFT
PAGE 55
NITROGEN DIOXIDE and NOY MONITORING NETWORK On February 9, 2010, the USEPA modified the NO2 NAAQS. Prior to this date, there was a single form of the standard; the annual average concentration of NO2 could not be greater than 53 ppb. The USEPA has added an hourly level of 100 ppb to the NAAQS. Along with modifications to the standard, changes to the design of the ambient monitoring network also occurred. A three-tiered monitoring network for NO2 will focus on near-road monitoring as well as monitoring at ambient locations. The minimally required components of the network are:
Tier 1: Near-road Monitors
A. Every CBSA with a population greater than or equal to 500,000 people must have a microscale NO2 monitor located within 50 meters of a major roadway.
B. An additional near-roadway site is required in CBSAs with populations of 2,500,000 or
more. C. An additional near-roadway site is required for any roadway segment with 250,000 or
more annual average daily traffic (AADT) totals.
Tier 2: Area-wide Monitors
A. One NO2 monitor in every CBSA with a population equal to or greater than 1,000,000 people. This monitor should be located in an area with an expected high concentration of NO2 and should use a neighborhood or larger scale. Emission inventory data should be used to make this selection.
Tier 3: Regional Administrator Required Monitors
A. The USEPA Administrator must require a minimum of 40 NO2 monitors nationwide in
locations with “susceptible and vulnerable” populations.
The network design described above shall use the latest available US Census figures. The new monitoring stations must be deployed and operational by January 1, 201310. Because of budgetary constraints, the USEPA has developed a build-and-hold system for implementing the new monitoring locations. Two Detroit near-road monitoring sites have been deployed. In addition, the MDEQ operates the community scale NO2 monitor at its Detroit-E 7 Mile (261630019) site. The USEPA has finalized a new rule, which eliminates the third phase of the near road sites. This would have removed the requirement for a near-road site in Grand Rapids; however, the Grand Rapids CBSA is now over the population threshold for a Tier One near-road site. The MDEQ is working with Region 5 USEPA and OAQPS USEPA to secure funding to deploy a near-road site in Grand Rapids. The MDEQ cannot deploy a near-road site in Grand Rapids until it is fully funded by the USEPA. Eliza Howell (downwind) (261630094) will be shut down completely at the end 2018 to ease the workload. Historically, this site has been for research and is not federally required.
10 “Primary National Ambient Air Quality Standards for Nitrogen Dioxide,” USEPA, 40 CFR Parts 50 and 58. February 9, 2010.

MICHIGAN’S 2019 ANNUAL AMBIENT AIR MONITORING NETWORK REVIEW - DRAFT
PAGE 56
Table 21 summarizes the monitoring requirements for NO2 according to the various tiers for all CBSAs in Michigan. As shown by this table, one monitor is required in Grand Rapids-Wyoming MSA and three monitors are required in the Detroit-Warren-Livonia MSA.
Table 21: NO2 Network Design
Tier 1: Near-road NO2 Monitors – Phase 2 The second near-roadway site for the Detroit-Warren-Livonia MSA was due by January 1, 2015. The Livonia Near-road site (261630095) was established in December 2014 and was operational by January 1, 2015. This is the heaviest traveled traffic segment in the Detroit-Warren-Livonia MSA; see yellow star on Figure 12.
MSA Counties
2017
Estimated
Population
Near
Roadway
Monitors
Req'd
Additional
Near
Roadway
Site
250,000
AADT
Community
Wide
Monitor
EJ
Monitor
Detroit-Warren-Livonia MSA Macomb 4,313,002 1 1 1
Oakland
Wayne
Lapeer
St Clair
Livingston
Flint MSA Genesee 407,385
Monroe MSA Monroe 149,649
Ann Arbor MSA Washtenaw 367,627
Grand Rapids-Wyoming MSA Kent 1,059,113 1 1
Barry
Ottawa
Montcalm
Muskegon-Norton Shores MSA Muskegon 173,693
Lansing-East Lansing MSA Clinton 477,656
Ingham
Eaton
Bay City MSA Bay 104,239
Saginaw MSA Saginaw 191,934
Kalamazoo-Portage MSA Kalamazoo 338,338
Van Buren
Niles-Benton Harbor MSA Berrien 154,259
Jackson MSA Jackson 158,640
Battle Creek MSA Calhoun 134,128
South Bend Mishawaka MSA IN/MI Cass 321,815
St. Joseph, IN

MICHIGAN’S 2019 ANNUAL AMBIENT AIR MONITORING NETWORK REVIEW - DRAFT
PAGE 57
Figure 12: Comparison of Eliza Howell Park Location with Other Air Monitoring Stations and Roadway Segments with High Traffic Counts
Tier 2: Area-wide NO2 Monitors Area-wide monitoring is required in every CBSA with 1,000,000 or more people. The Detroit-Warren-Livonia MSA and the Grand Rapids-Wyoming MSA both meet this requirement in Michigan. The MDEQ is currently operating an NO2 monitor at the Detroit-E 7 Mile site (261630019) in northeast Detroit, which is downwind from the urban core and located in a residential neighborhood expected to have high NO2 levels. A new NO2 monitor must be added into the Grand Rapids-Wyoming MSA to meet this requirement. After investigation the sources of NO2 emissions, the MDEQ feels it is appropriate to place a monitor at the Grand Rapids-Monroe St. (260810020). Figure 13 shows the NO2 emission points for Kent and Ottawa Counties, as well as the location of the Grand Rapids-Monroe Street site. This site has been designated as a PAMS site by the USEPA. It is MDEQ’s intention to run the direct NO2 instrument required by the PAMS program year round to meet the Area-wide NO2 requirement. The direct NO2 instrument has not been received due to delay in the PAM’s national contracts. In the meanwhile, the MDEQ will temporarily install a traditional NOx instrument at Jenison (261390005) in lieu of the NO2 monitor.
Eliza Howell Park (USEPA/FHA)
696/Lodge (261250010)
Allen Park (261630001)
MONITORING LOCATIONS (261630001)
Livonia (261630025)

MICHIGAN’S 2019 ANNUAL AMBIENT AIR MONITORING NETWORK REVIEW - DRAFT
PAGE 58
Figure 13: NO2 Emissions in Kent and Ottawa Counties
Tier 3: NO2 Monitors for Susceptible and Vulnerable Populations The final tier of the new NO2 monitoring network could include an environmental justice component as determined by the USEPA Administrator. Forty additional monitoring sites will be deployed throughout the nation to meet the environmental justice component of the network design. At this time, the MDEQ is not planning on deploying any of these monitors. However, as part of a special study, the MDEQ is installing NOx monitors at three new sites in 2018 to study the impacts of the Gordie Howe International Bridge project.
NO2 Monitoring for NSR Recent modeling projects for new source review have shown that there is a possibility that the new 1-hour NO2 NAAQS could be violated using current modeling techniques. More refined modeling that would provide a more accurate picture of the impact from new sources could be performed; however, the MDEQ lacked ambient data required for use in the models. At least five years of NO2 data are required in both urban and rural locations. Therefore, on July 1, 2010, the MDEQ began collecting NO2 measurements at Houghton Lake (261130001) and at Lansing (260650012). The MDEQ will continue this monitoring at the new Lansing Filley (260650018) site.
NOY Monitoring
Trace NOY monitors for the NCore sites at Grand Rapids–Monroe St. (260810020) and Allen Park (261630001) have been operational since December 2007.
Table 22 summarizes the NO2 and NOY monitoring site information for sites that are in existence in 2018 and 2019. Figure 14 shows the NO2 and NOY monitoring network operated by the MDEQ in 2018 and 2019.

MICHIGAN’S 2019 ANNUAL AMBIENT AIR MONITORING NETWORK REVIEW - DRAFT
PAGE 59
NO2 and NOY Quality Assurance The AMU site operator performs a precision check of the analyzer every two weeks. The precision checks are sent to the QA Coordinator each month. Each monitor is audited annually by the AMU’s QA Team, which has a separate reporting line of authority from the site operator. The auditor utilizes dedicated gas calibrator and calibration gases that are only for audits. The independent audit challenges the accuracy of the station monitor. The auditor also assesses the monitoring system (inspecting the sample line, filters, and inlet probe), siting, and documentation of precision checks. The results of the audits and precision checks indicate whether the monitor is meeting the measure-ment quality objectives. The AMU uploads the precision check results and audit results to the USEPA’s AQS database each quarter. The QA Coordinator reviews all audit results, and hard copies are retained in the QA files. For conventional (non-trace level) NO2 monitors, the USEPA conducts thru-the-probe audits at 20% of the monitors each year. The audit consists of delivering four levels of calibration gas to the station monitor through the probe. At this time, the USEPA is not conducting thru-the-probe audits for the NOY monitors.
Plans for the 2019 NO2 and NOY Monitoring Network During 2019, contingent upon adequate levels of funding, the MDEQ is planning to operate NO2 at:
• Lansing Filley (260650018);
• Houghton Lake (261130001);
• Detroit-E 7 Mile (261630019);
• Eliza Howell Near-road site (261630093);
• Livonia Near-road (261630095); and
• SWHS (261630015).
During 2019, the MDEQ is planning to operate NO2 at three new sites to study the impacts of the Gordie Howe International Bridge construction:
• DP4TH (261630098);
• Trinity (261630099); and
• TBD (261630100).
By January 1, 2019, the MDEQ is planning to shut down the Eliza Howell downwind (261630094) monitor. The MDEQ will temporarily install a NOx monitor in Jenison (261390005) to meet the Grand Rapids area requirement until the PAMs funding is received for direct NO2 at Grand Rapids-Monroe St. (260810020). Also contingent upon adequate funding, the MDEQ will continue to operate trace level NOY monitors at the NCore sites:
• Grand Rapids–Monroe St. (26810020); and
• Allen Park (261630001).
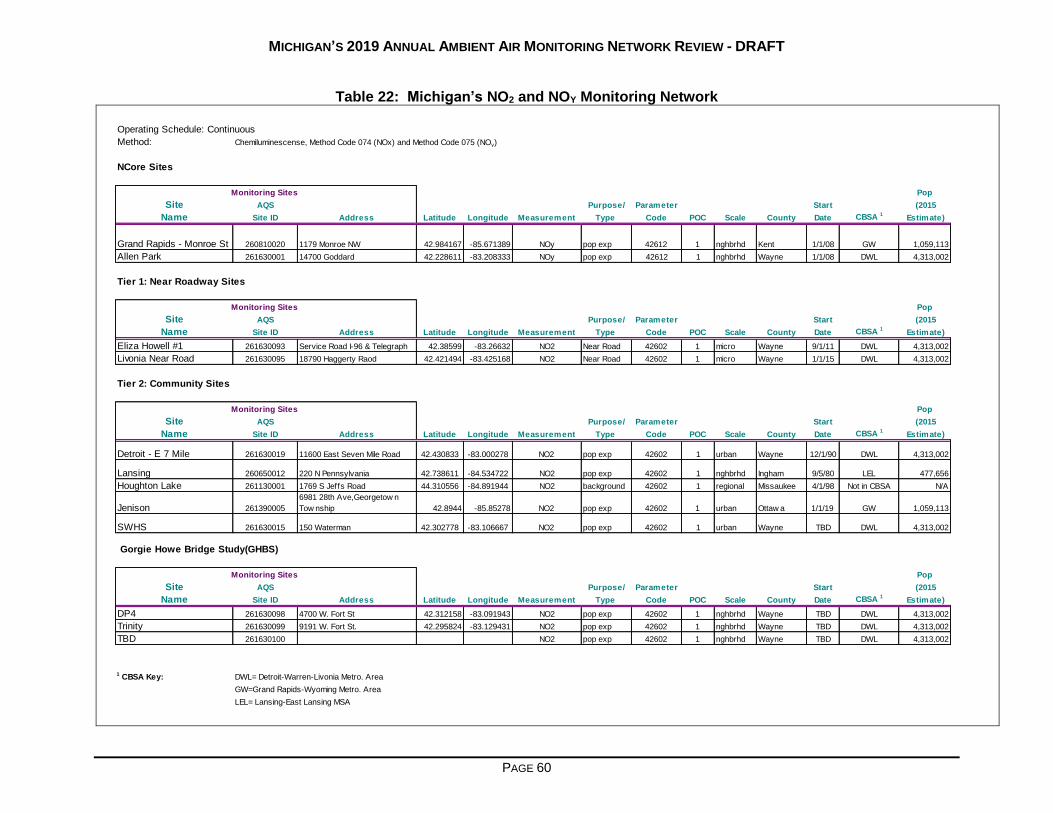
MICHIGAN’S 2019 ANNUAL AMBIENT AIR MONITORING NETWORK REVIEW - DRAFT
PAGE 60
Table 22: Michigan’s NO2 and NOY Monitoring Network
Operating Schedule: Continuous
Method: Chemiluminescense, Method Code 074 (NOx) and Method Code 075 (NOy)
NCore Sites
Monitoring Sites Pop
Site AQS Purpose/ Parameter Start (2015
Name Site ID Address Latitude Longitude Measurement Type Code POC Scale County Date CBSA 1 Estimate)
Grand Rapids - Monroe St 260810020 1179 Monroe NW 42.984167 -85.671389 NOy pop exp 42612 1 nghbrhd Kent 1/1/08 GW 1,059,113
Allen Park 261630001 14700 Goddard 42.228611 -83.208333 NOy pop exp 42612 1 nghbrhd Wayne 1/1/08 DWL 4,313,002
Tier 1: Near Roadway Sites
Monitoring Sites Pop
Site AQS Purpose/ Parameter Start (2015
Name Site ID Address Latitude Longitude Measurement Type Code POC Scale County Date CBSA 1 Estimate)
Eliza Howell #1 261630093 Service Road I-96 & Telegraph 42.38599 -83.26632 NO2 Near Road 42602 1 micro Wayne 9/1/11 DWL 4,313,002
Livonia Near Road 261630095 18790 Haggerty Raod 42.421494 -83.425168 NO2 Near Road 42602 1 micro Wayne 1/1/15 DWL 4,313,002
Tier 2: Community Sites
Monitoring Sites Pop
Site AQS Purpose/ Parameter Start (2015
Name Site ID Address Latitude Longitude Measurement Type Code POC Scale County Date CBSA 1 Estimate)
Detroit - E 7 Mile 261630019 11600 East Seven Mile Road 42.430833 -83.000278 NO2 pop exp 42602 1 urban Wayne 12/1/90 DWL 4,313,002
Lansing 260650012 220 N Pennsylvania 42.738611 -84.534722 NO2 pop exp 42602 1 nghbrhd Ingham 9/5/80 LEL 477,656
Houghton Lake 261130001 1769 S Jeffs Road 44.310556 -84.891944 NO2 background 42602 1 regional Missaukee 4/1/98 Not in CBSA N/A
Jenison 261390005
6981 28th Ave,Georgetow n
Tow nship 42.8944 -85.85278 NO2 pop exp 42602 1 urban Ottaw a 1/1/19 GW 1,059,113
SWHS 261630015 150 Waterman 42.302778 -83.106667 NO2 pop exp 42602 1 urban Wayne TBD DWL 4,313,002
Gorgie Howe Bridge Study(GHBS)
Monitoring Sites Pop
Site AQS Purpose/ Parameter Start (2015
Name Site ID Address Latitude Longitude Measurement Type Code POC Scale County Date CBSA 1 Estimate)
DP4 261630098 4700 W. Fort St 42.312158 -83.091943 NO2 pop exp 42602 1 nghbrhd Wayne TBD DWL 4,313,002
Trinity 261630099 9191 W. Fort St. 42.295824 -83.129431 NO2 pop exp 42602 1 nghbrhd Wayne TBD DWL 4,313,002
TBD 261630100 NO2 pop exp 42602 1 nghbrhd Wayne TBD DWL 4,313,002
1 CBSA Key: DWL= Detroit-Warren-Livonia Metro. Area
GW=Grand Rapids-Wyoming Metro. Area
LEL= Lansing-East Lansing MSA

MICHIGAN’S 2019 ANNUAL AMBIENT AIR MONITORING NETWORK REVIEW - DRAFT
PAGE 61
Figure 14: Michigan’s NO2 and NOY Monitoring Network

MICHIGAN’S 2019 ANNUAL AMBIENT AIR MONITORING NETWORK REVIEW - DRAFT
PAGE 62
SULFUR DIOXIDE MONITORING NETWORK On June 2, 2010, the USEPA made the SO2 NAAQS more stringent by changing the current standard from a 24-hour and an annual average to an hourly measurement that cannot exceed 75 ppb. The form of the standard is now a 99th percentile form averaged over three years. The secondary standard has not been changed11. To design a monitoring network, the USEPA created the Population Weighted Emissions Index (PWEI) that is calculated by: (CBSA population12) * (total SO2 emissions in that CBSA in tpy) / 1,0000,000 = PWEI The PWEI value for each CBSA is compared to the threshold values shown in Table 23 to determine the number of monitoring sites that are required:
Table 23: Population Weighted Emission Index-based Monitoring Requirements
Population Weighted Emissions Index Value Number of Sites
Greater than or equal to 1,000,000 3
Greater 100,000 but less than 1,000,000 2
Greater than 5,000 1
The PWEI monitors serve a variety of purposes including assessing population exposure, determining trends and transport as well as ascertaining background levels. The USEPA allows agencies to count the NCore SO2 monitors as part of these new requirements. Also, because the new SO2 monitors are not single source-oriented, existing infrastructure can be used to select locations for expansion of the SO2 network. In 2018, MDEQ is installing three SO2 monitors at three new sites to study the impacts of the Gordie Howe International Bridge construction. If Table 23 is applied to the PWEI calculations for the CBSAs in Michigan, the number of monitors that are required is shown in Table 24. The data in the table uses the 2010 US Census data and the 2008 version of the National Emissions Inventory data.
11 Primary National Ambient Air Quality Standards for Sulfur Dioxide; Final Rule, 75 Federal Register 35520 (June 22, 2010). 12 According to the latest US Census Bureau estimates.

MICHIGAN’S 2019 ANNUAL AMBIENT AIR MONITORING NETWORK REVIEW - DRAFT
PAGE 63
Table 24: Population Weighted Emissions Index Totals for CBSAs in Michigan
Based on the 2008 emissions data and 2010 population estimates, the Detroit-Warren-Livonia CBSA needs two SO2 monitoring sites, while the Holland-Grand Haven Metropolitan Area, Lansing-East Lansing Metropolitan Area, and Monroe Metropolitan Area each need a single SO2 monitoring site. The NCore trace level SO2 monitor at Allen Park (261630001) fulfills the requirement for one of the SO2 monitors required in the Detroit-Warren-Livonia CBSA. The MDEQ also monitors at Detroit–SWHS (261630015) and Port Huron (261470005). The MDEQ deployed the Sterling State Park (261150006) site on January 1, 2013, to fulfill the requirement for the Monroe Metropolitan Area. The MDEQ deployed SO2 monitors in the Holland-Grand Haven Metropolitan Area at the West Olive site (261390011) in Ottawa County on January 1, 2015 and in the Lansing-East Lansing Metropolitan Area at the Lansing site (260650012) in Ingham County, on January 1, 2012. Due to loss of site access, the Lansing site (260650012) was moved to a new location in May 2018 Lansing Filley (261630018). Table 25 summarizes the SO2 monitoring site information for 2018 and 2019. Figure 16 shows the geographical distribution of SO2 sites across Michigan.
MSA Counties
2008 NEI
Download: Total
County SO2
Emissions, tpy
2008 NEI
SO2 Total
Emissions,
tpy
2010
Population
2008/2010
NEI PWEI
Monitors
Required 2008
EI & 2010
Census
Detroit-Warren-Livonia Metro Area Macomb 1,367.46 124,738 4,296,250 535,905 2
Oakland 2,780.69
Wayne 55,790.51
Lapeer 152.87
St Clair 64,388.92
Livingston 257.45
Flint Metro Area Genesee 538.38 538 425,790 229 0
Monroe Metro Area Monroe 135,799.72 135,800 152,021 20,644 1
Ann Arbor Metro Area Washtenaw 530.36 530 344,791 183 0
Grand Rapids-Wyoming Metro Area Kent 1,539.62 1,843 774,160 1,427 0
Barry 116.40
Newaygo 75.23
Ionia 111.60
Holland-Grand Haven Metro Area Ottawa 39,664.67 39,665 263,801 10,464 1
Muskegon-Norton Shores Metro Area Muskegon 11,611.80 11,612 172,188 1,999 0
Lansing-East Lansing Metro Area Clinton 141.76 14,184 464,036 6,582 1
Ingham 10,546.34
Eaton 3,496.12
Bay City Metro Area Bay 19,073.08 19,073 107,771 2,056 0
Saginaw-Saginaw Twp N Metro Area Saginaw 821.42 821 200,169 164 0
Kalamazoo-Portage Metro Area Kalamazoo 1,672.04 1,810 326,589 591 0
Van Buren 138.04
Niles-Benton Harbor Metro Area Berrien 384.68 385 156,813 60 0
Jackson Metro Area Jackson 293.11 293 160,248 47 0
Battle Creek Metro Area Calhoun 666.26 666 136,146 91 0
South Bend Mishawaka Metro Area IN/MI Cass 98.09 98 52,293 5 0

MICHIGAN’S 2019 ANNUAL AMBIENT AIR MONITORING NETWORK REVIEW - DRAFT
PAGE 64
SO2 Monitoring and Modeling Requirements With the revision to the SO2 NAAQS in 2010 federal regulations also changed for both monitoring and modeling SO2 emissions. The USEPA established a three-tiered process for assessing the attainment status of the ambient air near large sources emitting SO2. States were first required to establish monitoring stations in areas with high population levels and high emission levels. Existing monitors in Detroit and Lansing, and new monitors in West Olive and Monroe, met this obligation for assessment. Of these four areas, only a small region in eastern Wayne County was found to have levels of SO2 exceeding the health-based standard. This area was designated by the USEPA as nonattainment. The MDEQ has completed an attainment plan that will bring the area into compliance with the NAAQS. The second tier requires states to conduct either monitoring or modeling for sources emitting over 16,000 tons per year. The MDEQ identified six areas meeting this criterion. Modeling has been completed for sources in the St. Clair, Eaton, Ingham, Marquette, Ottawa, Bay and Monroe Counties. The USEPA reviewed the modeling designated a small portion of St. Clair County as nonattainment in September 2016. The other areas were designated attainment/unclassifiable in September 2016. Control strategies will be developed for the sources in St. Clair County and the attainment plan will be incorporated into the Michigan State Implementation Plan (SIP). DTE Energy has installed two SO2 special purpose monitoring stations in St. Clair County to provide additional SO2 and meteorological data to aid future SIP development. These monitors are not part of a Data Requirements Rule network. The third tier involves modeling of SO2 source emissions greater than 2000 tons per year. This modeling project involved Delta and Alpena Counties and was submitted to the USEPA on January 11, 2017. There were no nonattainment areas recommended from this modeling. The necessity of taking a combination monitoring/modeling approach to assessment for SO2 was borne from the fact that monitoring could not cover every wind scenario at each large emission source nationwide and states could not bear the large associated expenses of establishing enough new monitoring sites to adequately characterize the SO2 pollutant levels in ambient air. Assessment is enhanced with additional modeling, a less expensive methodology that helps inform planners about the degree of a problem needing to be solved and the effectiveness of different proposed control options. The MDEQ continues to identify strategies to reduce SO2 pollutant levels through collaboration with Michigan industry, as well as local and federal partners.
SO2 Quality Assurance The AMU site operator performs a precision check of the analyzer every two weeks. Precision checks are sent to the QA Coordinator each quarter. Each monitor is audited annually by the AMU’s QA Team, which has a separate reporting line of authority from the site operator. The auditor utilizes dedicated gas calibrator and calibration gases that are only for audits. The independent audit challenges the accuracy of the station monitor. The auditor also assesses the monitoring system (inspecting the sample line, filters, and inlet probe), siting, and document-tation of precision checks. Results of the audits and precision checks indicate whether the monitor is meeting the measurement quality objectives. The AMU uploads the precision check results and audit results to the USEPA’s AQS database each quarter. The QA Coordinator reviews all audit results, and hard copies are retained in the QA files.

MICHIGAN’S 2019 ANNUAL AMBIENT AIR MONITORING NETWORK REVIEW - DRAFT
PAGE 65
The USEPA conducts thru-the-probe audits on 20% of the SO2 monitors each year. The audit consists of delivering four levels of calibration gas to the station monitor through the probe. The USEPA reports the audit results to AQS.
Plans for the 2019 SO2 Monitoring Network During 2019, contingent upon adequate levels of funding, the MDEQ is planning to continue to operate an SO2 monitor at:
• Detroit-SWHS (261630015);
• Grand Rapids–Monroe St. (260810020);
• Allen Park (261630001);
• Lansing (260650018);
• Port Huron (261470005);
• Sterling State Park (261150006);
• West Olive (261390011); and
• NMH 48217 (261630097).
The MDEQ is planning to operate three SO2 monitors for the Gordie Howe International Bridge project in southwest Detroit at:
• DP4TH (261630098);
• Trinity (261630099); and
• TBD (2161630100).

MICHIGAN’S 2019 ANNUAL AMBIENT AIR MONITORING NETWORK REVIEW - DRAFT
PAGE 66
Table 25: Michigan’s SO2 Monitoring Network

MICHIGAN’S 2019 ANNUAL AMBIENT AIR MONITORING NETWORK REVIEW - DRAFT
PAGE 67
Figure 15: Michigan’s SO2 Monitoring Network

MICHIGAN’S 2019 ANNUAL AMBIENT AIR MONITORING NETWORK REVIEW - DRAFT
PAGE 68
TRACE METAL MONITORING NETWORK Since 1981, monitoring for trace metals as TSP has been conducted as part of the Michigan Toxics Air Monitoring Program (MITAMP). Over the years, the program gradually expanded to eight sites that collected TSP samples on a once every six or once every 12 day schedule. The trace metals network follows the sampling calendar published by the USEPA. The samples were analyzed for trace levels of metals. The suite of elements has been modified over the years, with the most recent list including manganese, arsenic, cadmium, and nickel at all sites. As stated in the Lead section the MDEQ is proposing to add TSP lead to all trace metals sites. Lead is monitored at source-oriented sites and at NCore sites, as discussed in the Lead section of this report. The Dearborn NATTS Site (261630033) has a more extensive metals list, which includes: beryllium, vanadium, chromium, manganese, nickel, cobalt, copper, zinc, arsenic, molybdenum, cadmium, barium, lead, and iron. As part of the Gordie Howe International Bridge project, trace metals will be added to the three sites. The trace metals sites include:
• Allen Park (261630001)
• Detroit-SWHS (261630015)
• S. Delray-Jefferson (261630027)
• River Rouge (261630005)
• Dearborn (261630033)
• NMH 48217 (261630097)
• DP4TH (261630098)
• Trinity (261630099)
• TBD (261630100)
• Belding-Merrick St. (260670003)
• Port Huron (261470031)
Trace metals as PM10 are determined as part of the NATTS program at Dearborn (261630033). To promote comparability with the TSP-size trace metals collected at other monitoring stations, and to assess both inter-sampler precision and method precision, co-located PM10 and TSP trace metals are also collected at Dearborn. Table 26 summarizes the trace metals monitoring site information for 2018 and 2019. Figure 16 shows the geographical distribution of sites across Michigan.

MICHIGAN’S 2019 ANNUAL AMBIENT AIR MONITORING NETWORK REVIEW - DRAFT
PAGE 69
Table 26: Michigan’s Trace Metal Monitoring Network
Operating Schedule: 1:6, follows EPA published calendar
Method: TSP: High Volume sampler using glass f iber f ilter ; Emission Spectra ICAP for lead; ICP MS for remaining metals
PM10: High Volume sampler using quartz filter; Emission Spectra ICAP for lead; ICP MS for remaining metals
Monitoring Sites Pop
Site AQS Sampling Purpose/ Date (2015
Name Site ID Address Latitude Longitude Frequency Elements Size Type POC Scale County Estab. MSA 1 Estimated)
Belding - Merrick St 260670003 509 Merrick 43.09984 -85.22163 1:6 Pb, Mn, As, Cd, Ni TSP max conc 1 micro Ionia 1/1/10 I 64,223
Grand Rapids - Monroe St 260810020 1179 Monroe St NW 42.984167 -85.671389 1:6 Pb, Mn, As, Cd, Ni TSP pop exp 1 nghbrhd Kent 1/8/10 GW 1,059,113
Port Huron 261470031 324 Rural St 42.98209 -82.449233 1:6 Pb, Mn, As, Cd, Ni TSP max conc 1 micro Saint Clair 1/1/13 DWL 4,313,002
Allen Park 261630001 14700 Goddard 42.228611 -83.208333 1:6 Pb, Mn, As, Cd, Ni TSP pop exp 1 nghbrhd Wayne 5/1/99 DWL 4,313,002
Dearborn 261630033 2842 Wyoming 42.306666 -83.148889 1:6Be, V, Cr, Mn, Co, Ni, Cu,
Zn, As, Mo, Cd, Ba, Pb, Fe TSP max conc 1 nghbrhd Wayne 6/1/90 DWL 4,313,002
River Rouge 261630005 315 Genesee 42.267222 -83.132222 1:6 Pb, Mn, As, Cd, Ni TSP max conc 1 nghbrhd Wayne 1/1/94 DWL 4,313,002
Fort St. (SWHS) 261630015 150 Waterman 42.302778 -83.106667 1:6 Pb, Mn, As, Cd, Ni TSP pop exp 1 nghbrhd Wayne 2/26/99 DWL 4,313,002
S Delray 261630027 7701 W Jefferson 42.292222 -83.106944 1:6 Pb, Mn, As, Cd, Ni TSP max conc 1 nghbrhd Wayne 10/6/04 DWL 4,313,002
Dearborn 261630033 2842 Wyoming 42.306666 -83.148889 1:12Be, V, Cr, Mn, Co, Ni, Cu,
Zn, As, Mo, Cd, Ba, Pb, Fe TSP max conc 2 nghbrhd Wayne 6/1/90 DWL 4,313,002
NMH 48217 261630097) 3225 S. Deacon 42.261669 -83.157893 1:6 Pb, Mn, As, Cd, Ni TSP pop exp 1 nghbrhd Wayne 1/9/16 DWL 4,313,002
DP4TH 261630098 4700 W. Fort St 42.312158 -83.091943 1:6 Pb, Mn, As, Cd, Ni TSP pop exp 1 nghbrhd Wayne TBD DWL 4,313,002
Trinity 261630099 9191 W. Fort St. 42.295824 -83.129431 1:6 Pb, Mn, As, Cd, Ni TSP pop exp 1 nghbrhd Wayne TBD DWL 4,313,002
TBD 261630100 1:6 Pb, Mn, As, Cd, Ni TSP pop exp 1 nghbrhd Wayne TBD DWL 4,313,002
Dearborn 261630033 2842 Wyoming 42.306666 -83.148889 1:6Be, V, Cr, Mn, Co, Ni, Cu,
Zn, As, Mo, Cd, Ba, Pb, Fe PM 10 max conc 1 nghbrhd Wayne 6/1/90 DWL 4,313,002
Dearborn 261630033 2842 Wyoming 42.306666 -83.148889 1:12
Be, V, Cr, Mn, Co, Ni, Cu,
Zn, As, Mo, Cd, Ba, Pb, Fe PM 10 max conc 9 nghbrhd Wayne 6/1/90 DWL 4,313,002
1 MSA Key: DWL= Detroit-Warren-Livonia MSA GW = Grand Rapids- Wyoming MSA
I = Ionia Micropolitan

MICHIGAN’S 2019 ANNUAL AMBIENT AIR MONITORING NETWORK REVIEW - DRAFT
PAGE 70
FIGURE 16: MICHIGAN’S TRACE METAL MONITORING NETWORK

MICHIGAN’S 2019 ANNUAL AMBIENT AIR MONITORING NETWORK REVIEW - DRAFT
PAGE 71
Trace Metal Quality Assurance The site operator conducts a precision flow check once a month. Flow check values are sent to the QA Coordinator each quarter. An independent audit is conducted by a member of the AMU’s QA Team every six months. The auditor is in a separate line of reporting authority from the site operator and uses independent, dedicated equipment to perform the flow rate audit. The auditor also assesses the condition of the monitor and siting criteria. The QA Coordinator reviews all audit results, and hard copies are retained in the QA files. The MDEQ Laboratory participates in two types of external performance testing programs. A nationally-based audit program sends a sample that has a known concentration of metals spiked onto a filter. The lab analyzes the filter in the same fashion as the routine samples. Results are compared to a “true” value and tabulated for all participants in the program. The MDEQ Laboratory also receives regional round robin audits. The regional audit sample is collected by running an ambient air monitor for 24 hours. The filter is cut into strips and sent to several laboratories. Results for the participating laboratories are compared to each other since a “true” value is not known. Precision samples for both PM10 and TSP-sized trace metals are collected at Dearborn (261630033) on a once every 12 day frequency. Additionally, precision samples for TSP-sized trace metals will collected at Port Huron–Rural Street (261470031) starting in 2018.
Plans for the 2019 Trace Metal Network: During 2019, contingent upon adequate levels of funding, the MDEQ plans to continue collecting trace metal measurements, as described for the above elements at:
• Belding-Merrick St. (260670003) - TSP – lead, manganese, nickel, arsenic and cadmium;
• Grand Rapids-Monroe St. (260810020) - TSP – lead, manganese, nickel, arsenic and cadmium;
• Allen Park (261630001) - TSP – lead, manganese, nickel, arsenic and cadmium;
• Fort St. (SWHS) (261630015) - TSP – lead, manganese, nickel, arsenic and cadmium;
• South Delray (261630027) - TSP – lead, manganese, nickel, arsenic and cadmium;
• River Rouge (261630005) - TSP – lead, manganese, nickel, arsenic and cadmium;
• Dearborn NATTS site (261630033) for both PM10 and TSP – metals reported include manganese, nickel, arsenic, cadmium, lead, beryllium, vanadium, chromium, cobalt, copper, zinc, molybdenum, barium and iron;
• Port Huron (261470031) - TSP – lead, manganese, nickel, arsenic and cadmium; and
• New Mount Hermon Church (261630097) - TSP – lead, manganese, nickel, arsenic and cadmium.
The MDEQ is discontinued collecting trace metal measurements in 2018 at:
• Belding-Reed St. (260670002) - TSP – lead, manganese, nickel, arsenic and cadmium. In July 2018, the MDEQ will add TSP - lead and trace metals to monitoring to the following sites:
• DP4TH (261630099) - TSP – lead, manganese, nickel, arsenic and cadmium;
• Trinity (261630098) - TSP – lead, manganese, nickel, arsenic and cadmium; and
• TBD (261630100) - TSP – lead, manganese, nickel, arsenic, and cadmium.

MICHIGAN’S 2019 ANNUAL AMBIENT AIR MONITORING NETWORK REVIEW - DRAFT
PAGE 72
VOLATILE ORGANIC COMPOUND MONITORING NETWORK The collection of more than 50 VOCs per sample began at various sites in 1990 as part of the MITAMP air toxics network. Either a once every six day or once every 12 day sampling frequency has been used depending on the site and budget status. The VOC network follows the sampling calendar published by the USEPA. The Detroit-SWHS (261630005) site has been the trend site and has collected VOC samples every year since 1993. The determination of VOC samples on a one every six day sampling frequency using Method TO-15 is required for the NATTS site at Dearborn (261630033). A minimum of six precision (duplicate) samples per year are also collected at Dearborn (261630033) as part of the NATTS program. Table 27 summarizes the VOC monitoring site information. Figure 17 illustrates the geographical distribution of VOC monitors in Michigan.
VOC Quality Assurance Once a year, the QA Team conducts a thru-the-probe audit using a known concentration of specialized calibration gas. The gas is sent through the station sample probe and collected into a clean, evacuated 6-liter Summa canister over a 24-hour period, and analyzed using USEPA Method TO-15. The results are compared to the auditor’s target concentration. Once a year, the QA Team also conducts a zero air check on the sampler by running VOC-free air through the probe and into an air canister for 24 hours. The auditor assesses the sampling configuration, including the condition and height of probe and siting criteria. The MDEQ Laboratory also participates in regional performance test programs. The regional performance test audit is produced by a multi-sampling unit that collects actual ambient air. The results from the participating laboratories are compared to each other since a “true” value is not known. The QA Coordinator receives, reviews, and retains copies of all performance test audit samples. The MDEQ Laboratory also participates in regional round robin samples.
Plans for the 2019 VOC Monitoring Network During 2019, contingent upon adequate levels of funding, the MDEQ plans to continue collecting VOCs at:
• Detroit-SWHS (261630015) once every 12 days; and
• Dearborn NATTS site (261630033) once every six days and precision samples once every two months

MICHIGAN’S 2019 ANNUAL AMBIENT AIR MONITORING NETWORK REVIEW - DRAFT
PAGE 73
Table 27: Michigan’s VOC Monitoring Network
Figure 17: Michigan’s VOC Monitoring Network
Operating Schedule: 1:6 and 1:12, Follows EPA Published ScheduleMethod: Stainless Steel Pressurized Canister Sampler; Gas Chromatograph/ Mass Spectrometer (24-hr samples); Method Code 110
Monitoring Sites Pop
Site AQS Sampling Purpose/ Date (2015
Name Site ID Address Latitude Longitude Frequency Type POC Scale County Estab. MSA 1 Estimated)
Detroit - SWHS 261630015 150 Waterman 42.302778 -83.106667 1:12 pop exp 1 nghbrhd Wayne 2/26/99 DWL 4,313,002
Dearborn 261630033 2842 Wyoming 42.306666 -83.148889 1:6 max conc 1 nghbrhd Wayne 6/1/90 DWL 4,313,002
1 MSA Key: DWL= Detroit-Warren-Livonia MSA
Dearborn
Detroit - SWHS
Dearborn
Detroit - SWHS

MICHIGAN’S 2019 ANNUAL AMBIENT AIR MONITORING NETWORK REVIEW - DRAFT
PAGE 74
CARBONYL MONITORING NETWORK The collection of carbonyl compounds, including formaldehyde and acetaldehyde as part of MITAMP, began at various sites in 1995. Either a once every six day or once every 12 day sampling frequency has been used depending on the site and budget status. The carbonyl network follows the sampling calendar published by the USEPA. The Detroit-SWHS (261630015) site has been the trend site and has collected carbonyl samples every year since 1995. Levels of formaldehyde in southeast Michigan are very heterogeneous, unlike other areas of the United States. Historical concentrations at River Rouge (261630005) are elevated, so the continuation of this monitor is important for the characterization of risk and for the determination of trends, this runs on a once every 12 day schedule. Detroit-SWHS (261630015) is the MDEQ’s air toxic trend site, so monitoring has continued on a once every 12 day schedule. Monitoring for carbonyl compounds on a one in six day frequency using Method TO-11A is required at the Dearborn NATTS site (261630033). Also, as a part of NATTS, six precision samples for carbonyls are collected every year. The MDEQ in 2019, as part of PAMS, will sample carbonyls at Allen Park (261630001), and also Grand Rapids-Monroe St. (260810020). The sampling will run on a once every three day schedule, with three 8-hour samples collected every run day. Table 28 summarizes the carbonyl monitoring site information for sites that were in existence in 2018 and will be added in 2019. Figure 18 shows the distribution of carbonyl samplers across Michigan.
Carbonyl Quality Assurance Once a year, the QA Team conducts a thru-the-probe audit using a known concentration of specialized calibration gas. The gas is sent through the station sample probe and collected on a dinitrophenyl hydrazine (DNPH) cartridge over a 24-hour period and analyzed using USEPA Method TO-11A. The laboratory result is compared to the auditor’s target concentration. The QA Team also conducts a zero air check of the sampler once a year by sending carbonyl-free air through the probe and into the sampler for 24 hours. The auditor assesses the sampling configuration, including the condition and height of probe and siting criteria. The carbonyl samples are sent to two different labs. NATTS samples go to a National Contract Lab. The National Lab participates in a national performance test program. The lab where the Detroit-SWHS and River Rouge samples go is also required to participate in the NATTS performance test program. The national contractor sends a spiked sample of known compounds and concentrations to the laboratory. The results are compared to the “true” value. The regional performance test audit is produced by a multi-sampling unit that collects actual ambient air. The results from the participating laboratories are compared to each other since a “true” value is not known. The QA Coordinator receives, reviews, and retains copies of all performance test audit samples.
MICHIGAN’S 2019 ANNUAL AMBIENT AIR MONITORING NETWORK REVIEW - DRAFT
PAGE 75
Plans for the 2019 Carbonyl Monitoring Network During 2019, contingent upon adequate levels of funding, Michigan plans to continue collecting carbonyls at:
• Detroit-SWHS (261630015) once every 12 days;
• River Rouge (261630005) once every 12 days; and
• Dearborn NATTS site (261630033) once every six days and precision sample once every two months.
During 2019, contingent upon adequate levels of funding for the PAMS, Michigan plans to begin collecting carbonyls at:
• Allen Park (261630001); and
• Grand Rapids-Monroe St. (260810020).

MICHIGAN’S 2019 ANNUAL AMBIENT AIR MONITORING NETWORK REVIEW - DRAFT
PAGE 76
Table 28: Michigan’s Carbonyl Monitoring Network
Operating Schedule: 1:6 and 1:12, Follows EPA published schedule
Method: 2,4 dinitrophenyl hydrazine treated silica gel cartridges; HPLC w ith ultraviolet absorption; Method Code 202
Monitoring Sites Pop
Site AQS Sampling Purpose/ Date (2015
Name Site ID Address Latitude Longitude Frequency Type POC Scale County Estab. MSA 1 Estimated)
Dearborn 261630033 2842 Wyoming 42.306666 -83.148889 1:6 max conc 1 nghbrhd Wayne 6/1/90 DWL 4,313,002
River Rouge 261630005 315 Genesee 42.267222 -83.132222 1:12 max conc 1 nghbrhd Wayne 1/1/94 DWL 4,313,002
Detroit - SWHS 261630015 150 Waterman 42.302778 -83.106667 1:12 pop exp 2 nghbrhd Wayne 2/26/99 DWL 4,313,002
PAMS Monitoring Sites Pop
Site AQS Sampling Purpose/ Date (2015
Name Site ID Address Latitude Longitude Frequency Type POC Scale County Estab. MSA 1 Estimated)
Allen Park 261630001 14700 Goddard 42.228611 -83.208333 1:3 (3-8hr samples) pop exp 1 nghbrhd Wayne 1/1/19 DWL 4,313,002
Grand Rapids-Monroe St. 260810020 1179 Monroe SE NW 42.956111 -85.679167 1:3 (3-8hr samples) pop exp 1 nghbrhd Kent 1/1/19 GW 4,313,002
1 MSA Key: DWL= Detroit-Warren-Livonia MSA
GW = Grand Rapids-Wyoming MSA

MICHIGAN’S 2019 ANNUAL AMBIENT AIR MONITORING NETWORK REVIEW - DRAFT
PAGE 77
Figure 18: Michigan’s Carbonyl Monitoring Network

MICHIGAN’S 2019 ANNUAL AMBIENT AIR MONITORING NETWORK REVIEW - DRAFT
PAGE 78
POLYNUCLEAR AROMATIC HYDROCARBONS MONITORING NETWORK As part of the USEPA’s desire to augment the NATTS, PAHs were added to the Dearborn site on April 6, 2008. Samples are collected on a once every six day sampling schedule using an Anderson PS-1 sampler. The PAH network follows the sampling calendar published by the USEPA. The sampler contains a glass thimble filled with prepared polyurethane foam plugs that surround XAD-2 resin. Volatile PAHs are absorbed into the foam and XAD-2 resin. Particle bound PAHs are trapped on a filter that precedes the thimble. A second sampler was deployed to the Dearborn site so six precision samples can be collected each year, conforming to the USEPA’s co-location criteria. The media is sent to the national contract laboratory, Eastern Research Group (ERG), where it is extracted and analyzed according to ASTM test method D 6209, which is equivalent to USEPA method TO-13A. Table 29 shows the site information for PAH sites that were in operation in 2018. Figure 19 shows the locations of sites where PAH monitoring occurs.
PAH Quality Assurance The site operator conducts a precision flow check once a month. The flow check values are sent to the QA Coordinator each quarter. An independent audit is conducted by a member of the AMU’s QA Team once a year. The auditor is in a separate line of reporting authority from the site operator and uses independent, dedicated equipment to perform the flow rate audit. The auditor also assesses the condition of the monitor and siting criteria. The QA Coordinator reviews all audit results, and hard copies are retained in the QA files.
Plans for the 2019 PAH Monitoring Network During 2019, contingent upon adequate levels of funding, Michigan plans to continue collecting PAHs at:
• Dearborn (261630033) – once every six days and precision once every two months.

MICHIGAN’S 2019 ANNUAL AMBIENT AIR MONITORING NETWORK REVIEW - DRAFT
PAGE 79
Table 29: Michigan’s PAHs Monitoring Network
Figure 19: Michigan’s PAHs Monitoring Network
Operating Schedule: 1:6 , Follows EPA published schedule
Method: Polyurethane foam plugs and XAD-2 resin w ith gas chromatography mass spectrometry; Method Code 202
Monitoring Sites Pop
Site AQS Sampling Parameter Purpose/ Date (2015
Name Site ID Address Latitude Longitude Frequency Code POC Type POC Scale County Estab. MSA 1 Estimated)
Dearborn 261630033 2842 Wyoming 42.30667 -83.1489 1:6 various 1 max conc 1 nghbrhd Wayne 6/1/90 DWL 4,313,002
1 MSA Key: DWL= Detroit-Warren-Livonia MSA
DearbornDearborn

MICHIGAN’S 2019 ANNUAL AMBIENT AIR MONITORING NETWORK REVIEW - DRAFT
PAGE 80
PAMS NETWORK The MDEQ has not operated a Photochemical Assessment Monitoring Station (PAMS) site since before 2001. However, the recently revised monitoring rule (80 FR 65292; October 26, 2015) requires PAMS measurements June 1 through August 31 at NCore sites that are located in Core-based Statistical Areas (CBSAs) with populations of 1,000,000 or more. As long as federal funding is made available for Michigan to fully fund 2 PAMS sites, the MDEQ will implement the following changes to its network starting June 2019.
Network Decision The NCore sites located at Allen Park (261630001) and Grand Rapids-Monroe St. (260810020) will serve as the locations of the required PAMS sites and will measure the parameters described below. The purchasing process has not yet begun; however, equipment likely to be installed at the sites will be Ceilometers for determining mixing height, Auto-GCs for VOCs, true NO2 using a direct reading NO2 analyzer, and carbonyls. National purchasing contract will be used to obtain as much of the instrumentation as possible.
Auto GC Decision
A complete list of the targeted compounds is found in Table 30. The MDEQ at this point is planning to measure hourly speciated VOC measurements with an auto-gas chromatograph (GC) using the CAS system.
Meteorology Measurements Decision The MDEQ will measure wind direction, wind speed, temperature, relative humidity, atmospheric pressure, precipitation, solar radiation, ultraviolet radiation, and mixing height using Ceilometer.
Other Required Measurements Carbonyl sampling at a frequency of three 8-hour samples on a one-in-three day basis (90 samples per PAMS sampling season) using instrumentation that will be purchased at a later date. A complete list of the target carbonyl compounds may be found in Table 30. The TO-11A test method, as used in the National Air Toxics Trends (NATTS) program will be used. The MDEQ will monitor for NO and NOY in addition to true NO2. The true NO2 analyzer will be a direct reading NO2 analyzer, which will be purchased under the National Contract. The NO and NOY will be measured using a TECO analyzer.

MICHIGAN’S 2019 ANNUAL AMBIENT AIR MONITORING NETWORK REVIEW - DRAFT
PAGE 81
Table 30: PAMS Target Compound List
Priority Compounds Optional Compounds 1 1,2,3-trimethylbenzene a 19 n-hexane b 1 1,3,5-trimethylbenzene 19 m-diethlybenzene
2 1,2,4-trimethylbenzene a 20 n-pentane 2 1-pentene 20 methylcyclohexane
3 1-butene 21 o-ethyltoluene a 3 2,2-dimethylbutane 21 methylcyclopentane
4 2,2,4-trimethylpentane b 22 o-xylene a,b 4 2,3,4-trimethylpentane 22 n-decane
5 acetaldehyde b,c 23 p-ethyltoluene a 5 2,3-dimethylbutane 23 n-heptane
6 acetone c,d 24 Propane 6 2,3-dimethylpentane 24 n-nonane
7 benzene a,b 25 propylene 7 2,4-dimethylpentane 25 n-octane
8 c-2-butene 26 styrene a,b 8 2-methylheptane 26 n-propylbenzene a
9 ethane d 27 toluene a,b 9 2-methylhexane 27 n-undecane
10 ethylbenzene a,b 28 t-2-butene 10 2-methylpentane 28 p-diethylbenzene
11 Ethylene 11 3-methylheptane 29 t-2-pentene
12 formaldehyde b,c 12 3-methylhexane 30 α/β-pinene
13 Isobutane 13 3-methylpentane 31 1,3 butadiene b
14 Isopentane 14 Acetylene 32 benzaldehyde c
15 Isoprene 15 c-2-pentene 33 carbon tetrachloride b
16 m&p-xylenes a,b 16 cyclohexane 34 Ethanol
17 m-ethyltoluene a 17 cyclopentane 35 Tetrachloroethylene b
18 n-butane 18 isopropylbenzene b
Source: Revisions to the Photochemical Assessment Monitoring Stations Compound Target List. USEPA, November 20, 2013
a Important SOAP (Secondary Organic Aerosols Precursor) compounds b HAP (Hazardous Air Pollutant) compounds c Carbonyl compounds d Non-reactive compounds, not considered to be VOC for regulatory purposes

MICHIGAN’S 2019 ANNUAL AMBIENT AIR MONITORING NETWORK REVIEW - DRAFT
PAGE 82
METEOROLOGICAL MEASUREMENTS Various meteorological measurements have been added to supplement the ambient monitoring network and enhance data analysis activities. A description of the types of meteorological measurements that are made at each site is provided in Table 31. The MDEQ is not planning any changes to the meteorological measurements.
Meteorological Equipment Quality Assurance
On an annual basis, an Equipment Technician conducts a multi-speed and directional certification of the propeller anemometer and vane systems. The QA Team staff or Senior Environmental Technician performs a “sun shot” to check the true north orientation of the anemometer and vane system at the station.
An independent audit is conducted by the QA Team to assess the accuracy of the indoor and outdoor temperature, barometric pressure, and relative humidity measurements at the site. The comparison is done between the station’s measurements and the auditor’s certified thermo-meter, barometer, and hygrometer to ensure quality objectives are being met. The QA Coordinator reviews the results of both the wind speed and wind direction certifications as well as the independent audits. Hard copies of all assessments are retained in the QA file system.
Plans for the 2018 Meteorological Monitoring Network
During 2019, contingent upon adequate levels of funding, Michigan plans to continue collecting hourly meteorological measurements at:
• Holland (26005003)
• Bay City (260170014)
• Coloma (260210014)
• Cassopolis (260270003)
• Flint (260490021)
• Otisville (260492001)
• Harbor Beach (260630007)
• Lansing Filley (260650018)
• Kalamazoo (260770008)
• Grand Rapids–Monroe St. (260810020)
• Evans (280810022)
• Tecumseh (260910007)
• New Haven (260990009)
• Sterling Heights/Freedom Hill (260990021)
• Scottville (261050007)
• Houghton Lake (261130001)
• Sterling State Park–Monroe (261150006)
• Muskegon–Green Creek Rd. (261210039)
• Oak Park (261250001)
• Pontiac (261250011)
• Rochester (261250012)
• Jenison (261390005)
• West Olive (261390011)
• Port Huron (261470005)
• Seney (261530001)

MICHIGAN’S 2019 ANNUAL AMBIENT AIR MONITORING NETWORK REVIEW - DRAFT
PAGE 83
• Ypsilanti (261610008)
• Allen Park (261630001)
• River Rouge (261630005)
• Detroit–SWHS (261630015)
• Detroit–E 7 Mile (261630019)
• Livonia Near-road (261630095)
• Detroit-Joy Rd. (261630026)
• Dearborn (261630033)
• Eliza Howell (261630093)
• Trinity (261630099) To the best of our knowledge, the following tribal meteorological equipment monitor will continue operation:
• Manistee (261010922)
• Sault Ste. Marie (260330901)

MICHIGAN’S 2019 ANNUAL AMBIENT AIR MONITORING NETWORK REVIEW - DRAFT
PAGE 84
Table 31: Meteorological Measurements in Michigan
Site Name AQS ID
WS
61
10
3
WD
61
10
4
Ou
tsid
e T
em
pe
ratu
re
62
10
1
Re
lati
ve
Hu
mid
ity
62
20
1
Ba
rom
etr
ic P
ress
ure
64
10
1
So
lar
Ra
dia
tio
n
63
30
1
Sig
ma
Th
eta
61
10
6
Holland 260050003 X X X X X X X
Bay City 260170014 X X X X
Coloma 260210014 X X X X
Cassopolis 260270003 X X X X
Sault Ste Marie * 260330901 X X X X X
Flint 260490021 X X X X X X
Otisville 260492001 X X X X X X
Harbor Bach 260630007 X X X X X
Lansing 260650018 X X X X X X
Kalamazoo 260770008 X X X X X
Grand Rapids-Monroe St. 260810020 X X X X X X
Evans 260810022 X X X X X
Tecumseh 260910007 X X X X X X
New Haven 260990009 X X X X X X
Sterling Heights. /Freedom Hill
260990021 X X X X X
Manistee * 261010922 X X X X X X X
Scottville 261050007 X X X X X
Houghton Lake 261130001 X X X X X X
Sterling State Park-Monroe 2611500006 X X X X X
Muskegon, Green Creek Rd.
261210039 X X X X X
Oak Park 261250001 X X X X X X
Pontiac 261250011 X X X X X
Rochester 261250012 X X X X X
Jenison 261390005 X X X X X
West Olive 261390011 X X X X X
Port Huron 261470005 X X X X X X
Seney 261530001 X X X X X X X
Ypsilanti 261610008 X X X X X X
Allen Park 261630001 X X X X X X
River Rouge 261630005 X X X X X
Detroit-SWHS 261630015 X X X X X X
Detroit-E7 Mile 261630019 X X X X X X
Livonia Near Rd. 261630095 X X X X X X
Detroit-Joy Rd. 261630026 X X X X
Dearborn 261630033 X X X X X X
Eliza Howell-Roadside 261630093 X X X X
Trinity 261630099 X X X X X

MICHIGAN’S 2019 ANNUAL AMBIENT AIR MONITORING NETWORK REVIEW - DRAFT
PAGE 85
SPECIAL PURPOSE MONITORS
The MDEQ is currently working on three special projects. The first project is a Community Scale Air Toxics Ambient Monitoring (CSATAM) grant. In 2015, the MDEQ applied for the grant to study near roadway emissions at three sites in Detroit: Eliza Howell Near-road (261630093), Eliza Howell Downwind (261630094), and Livonia Near-road (261630095). The grant involves a minimum of two years of monitoring at these sites, with a three-month intensive where additional samples and increased sampling frequency will be employed. The monitoring portion of this study has concluded, and the final data analysis is currently underway. The monitoring for CO, NO2 and PM2.5 at these sites are classified as SLAMS .
The second special purpose monitoring project (which comes under SLAMS) resulted from a request from community members in the Detroit 48217 ZIP code for an air monitoring station in their neighborhood. The 48217 community has many industrial sources located in and around it. As such, the MDEQ has agreed to continue monitoring past the approved one-year study. The NMH 48217 (261630097) site is located at New Mount Hermon Church at 3225 S. Deacon Street in Detroit. Data was analyzed at the end of the one-year study (September 2017), and a determination was made to shut down some of the parameters that were being collected. The site now monitors only for SO2, PM2.5, TEOM, and TSP metals.
The third special purpose monitoring project has resulted due to the proposed Gordie Howe International Bridge project. It will involve additional monitoring at three new sites and the existing Detroit–SWHS site beginning July 2018. This monitoring project was made possible by a grant from the Michigan State Housing Development Authority. The MDEQ will conduct ambient air quality monitoring in the Delray area of Detroit to ascertain air pollution levels. This area is being impacted by the construction of a new International Bridge Crossing. The monitoring will start before bridge construction occurs to determine the effect of earth moving and house demolition equipment. The monitoring project will continue the first few years of bridge operation to understand the role that traffic plays in the air quality of the Delray area. Table 32 shows the instruments that are planned for deployment. The length of this study is not known, however under an agreement with the City of Detroit and the Governor’s Office, the MDEQ has agreed to keep SWHS and one other site running for 10 years. The duration of the other sites will depend on an annual review of the data.

MICHIGAN’S 2019 ANNUAL AMBIENT AIR MONITORING NETWORK REVIEW - DRAFT
PAGE 86
Table 32: Instruments to be added at Gordie Howe International Bridge Project Study
Site Address Instrument Sampling Frequency
SWHS (261630015)
150 Waterman
PM2.5-BAM Hourly
Black Carbon-Aethalometer
Hourly
SO2 Hourly
NOx Hourly
TSP-Pb 24-hr every 6 day
DP4TH (261630098)
4700 W. Fort St.
SO2 Hourly
CO Hourly
NOx Hourly
PM2.5-BAM Hourly
Black Carbon-Aethalometer
Hourly
TSP-Pb 24-hr every 6 day
Trinity (261630099)
9191 W. Fort St.
MET Hourly
SO2 Hourly
CO Hourly
NOx Hourly
PM2.5-BAM Hourly
Black Carbon-Aethalometer
Hourly
TSP-Pb 24-hr every 6 day
TBD (261630100)
.
SO2 Hourly
NOx Hourly
PM2.5-BAM Hourly
Black Carbon-Aethalometer
Hourly
TSP-Pb 24-hr every 6 day

MICHIGAN’S 2019 ANNUAL AMBIENT AIR MONITORING NETWORK REVIEW - DRAFT
PAGE 87
ADEQUACY OF MICHIGAN’S MONITORING SITES The suitability of monitoring site locations is frequently assessed by the AMU’s QA Team and the USEPA. The USEPA assesses the adequacy of the stations during PM2.5 PEP audits, gaseous NPAP audits, and systems audits. The results indicate that the stations are properly sited, which includes distances away from obstructions, large trees, and set-backs from roadways. Suitability of probe heights and separation distances are assessed both by MDEQ and USEPA auditors. If any issues are found during the audits, the MDEQ works with USEPA Region 5 to correct them during the audit follow-up process. The Dearborn NATTS Site (261630033) has an issue with a tree dripline being too close to some of the monitors located on the sampler deck. The tree is located on private property, and therefore the MDEQ has no authority to remove the tree. The MDEQ was able to move the deck to the west side of the bunker, so that the tree drip line will no longer be an issue. Table 33 summarizes the various monitoring waivers the MDEQ has requested.
Table 33: Summary of Waivers for Michigan’s Monitoring Network
Type of Wavier Explanation
Ozone Monitor The Ann Arbor MSA does not have enough space for the downwind monitor in Washtenaw County, therefore the MDEQ requests to place it in Oakland County
Lead Co-location
There is not a large enough foot print at the Belding monitoring sites to co-locate a lead monitor. Therefore, the MDEQ requests to leave the lead co-location at Dearborn. Originally requested in 2010.
Lead Monitoring Request to waive lead monitoring at Consumer’s JH Campbell plant. Modeling shows low impact. Originally requested in 2009 and re-submitted in 2014. Needs to be renewed every 5 years.
Lead Monitoring Request to waive lead monitoring at St. Mary’s Cement plant. Modeling shows low impact. Originally requested in 2009 and resubmitted in 2014. Needs to be renewed every 5 years.
Lead Monitoring Request to waive lead monitoring at Consumer’s Karn-Weadock plant. Modeling shows low impact. Originally requested in 2011 and resubmitted in 2016. Needs to be renewed every 5 years.

MICHIGAN’S 2019 ANNUAL AMBIENT AIR MONITORING NETWORK REVIEW - DRAFT
PAGE 88
APPENDIX A: ACRONYMS AND THEIR DEFINITIONS:
Acronym Definition
> Greater than
< Less than
≥ Greater than or equal to
≤ Less than or equal to
% Percent
µg/m3 Micrograms per cubic meter
AERMOD AMS/USEPA Regulatory Model
AMU Air Monitoring Unit
AQD Air Quality Division
AQS Air Quality System (USEPA air monitoring data archive)
ARM Approved regional method
BAM Beta Attenuation Monitor (hourly PM2.5 measurement monitor)
CAA Clean Air Act
CASTNET Clean Air Status and Trends Network
CBSA Core-Based Statistical Area
CFR Code of Federal Regulations
CO Carbon monoxide
CSA Consolidated Statistical Area
DNPH 2,4 -di nitrophenyl hydrazine – this is the derivatizing agent on the cartridges used to collect carbonyl samples
DPW Department of Public Works
EC Elemental carbon
USEPA U.S. Environmental Protection Agency
FDMS Filter Dynamic Measurement System
FEM Federal Equivalent Method
FIA Family Independence Agency
FRM Federal Reference Method
GC Gas chromatograph (instrument providing VOC measurements)
GFIs Ground fault circuit interrupters
hr Hour
IN-MI Indiana-Michigan
LADCO Lake Michigan Air Directors Consortium
DEQ Michigan Department of Environmental Quality
MITAMP Michigan Toxics Air Monitoring Program
MSA Metropolitan Statistical Area
NAAQS National Ambient Air Quality Standard
NAMS National Air Monitoring Station
NATTS National Air Toxics Trend Sites
NCore National Core Monitoring Sites
NEI National Emission Inventory
NO2 Nitrogen dioxide
NOX Oxides of Nitrogen
NOY Oxides of nitrogen + nitric acid + organic and inorganic nitrates
NPAP National Performance Audit Program
OAQPS Office of Air Quality and Planning and Standards (USEPA)
OC Organic carbon
OTAQ Office of Transportation and Air Quality (USEPA)

MICHIGAN’S 2019 ANNUAL AMBIENT AIR MONITORING NETWORK REVIEW - DRAFT
PAGE 89
Acronym Definition
PAH Polynuclear Aromatic Hydrocarbon
PAMS Photochemical Assessment Monitoring Station
PEP Performance Evaluation Program
PM Particulate matter
PM2.5 Particulate matter with an aerodynamic diameter less than or equal to 2.5 microns
PM10 Particulate matter with a diameter of 10 microns or less
PM10-2.5 Coarse PM equal to the concentration difference between PM10 and PM2.5
ppb parts per billion
ppm parts per million = mg/kg, mg/L, µg/g (1 ppm = 1,000 ppb)
QA Quality assurance
QAPP Quality Assurance Project Plan
RTI Research Triangle Institute (national contract laboratory for speciated PM2.5)
SLAMS State and Local Air Monitoring Station
SO2 Sulfur dioxide
STAG State Air Grant (federal)
STN Speciation Trend Network (PM2.5)
TEOM Tapered element oscillating microbalance (hourly PM2.5 measurement monitor)
tpy ton per year
TRI Toxic Release Inventory
TSP Total Suspended Particulate
U of M University of Michigan
U.S. United States
VOC Volatile organic compounds

MICHIGAN’S 2019 ANNUAL AMBIENT AIR MONITORING NETWORK REVIEW - DRAFT
PAGE 90
Appendix B: Summary of Comments Received and Replies As part of the network review process, the EPA requires that the MDEQ solicit public comments. The MDEQ made the draft 2019 Network Review available for public comment by posting the document on its air quality homepage. To ensure that the public was aware that the document was open for comment, the 30-day public comment period was announced through the Air Quality Listserv and via a press release on May 31, 2018. The MDEQ received one comment to the network review. Comment: It was recommended that the PAMS site in SE Michigan be relocated from Allen Park (an NCORE site) to E 7 Mile. E 7 Mile site represents the ozone design value for SE Michigan. The commenter believes that NOx and VOC measurements at E 7 Mile will provide data that will be useful in determining the relative benefits of VOC and NOx emission reductions and assist in developing an optimum cost-effective control strategy for SE Michigan. Response: The MDEQ has a requirement to operate a photochemical air monitoring station (PAMS) at both NCore sites, located in Grand Rapids and Allen Park. To relocate the PAMS station from Allen Park to the Detroit E 7 Mile site would require a waiver from the USEPA. PAMS stations are required to be operated at the NCore sites where reactive oxides of nitrogen, NOy are also measured. To obtain a waiver from the USEPA to locate the PAMS station at a non-NCore site would require the MDEQ to install a NOy monitor at the E 7 Mile site. Adding an additional NOy instrument to the E 7 Mile site would be a significant expense for equipment and labor. The MDEQ would only be able to shut down the NOy instrument at the existing NCore site at Allen Park if a side-by-side demonstration of NOy and NOx at the site could demonstrate a ‘negligible’ difference in the measured values. It is unknown to the MDEQ how long this demonstration would need to be conducted nor what constitutes a negligible difference in values. If MDEQ is able to obtain a waiver from the USEPA to operate the PAMS station at the E 7 Mile site and if a waiver is granted to move the NOy instrument from Allen Park to the E 7 Mile site, the MDEQ will grant this request.

MICHIGAN’S 2019 ANNUAL AMBIENT AIR MONITORING NETWORK REVIEW - DRAFT
PAGE 91
Appendix C: Written Comments Received
NAVNIT K. GHUMAN
MDEQ AIR QUALITY DIVISION
3058 W GRAND BLVD, SUITE 2-300
DETROIT MI 48202
June 20, 2018
Comments on “Michigan’s 2019 Ambient Air Monitoring Network Review”
As consulting scientists to the Southeast Michigan Air Quality Study (SEMAQS) on ozone, Dr.
Jay Turner of Washington University in St. Louis, and I strongly recommend that the PAMS site
in SE Michigan be relocated from Allen Park to E 7 Mile.
US EPA has declared SE Michigan a marginal ozone nonattainament area which requires the
development of a State Implementation Plan and attainment in 3 years. Ozone formation
depends not only on the ambient concentrations of NOx and VOC, but also critically on the
VOC/NOx ratio. From our analyses in SE Michigan, the maximum 8-hr on a given day appears
to be sensitive to ratio near the present Design Value site at East 7 Mile. On the other hand, the
ratio at the Allen Park site appears to be more invariant as it is dominated by local highway
emissions and provides no information about the downwind O3 maxima.
Thus, we believe NOx and VOC measurements at E7 Mile will provide data that will be useful in
determining the relative benefits of VOC and NOx emission reductions and assist in developing
an optimum cost-effective control strategy for SE Michigan.
Please contact me if you need additional information.
Sincerely,
George T. Wolff, Ph.D.
Atmospheric Scientist
Air Improvement Resource, Inc.
Farmington Hills, MI
George T. Wolff, Ph.D
Principal Scientist
Air Improvement Resource, Inc.
248-331-3866
MICHIGAN’S 2019 ANNUAL AMBIENT AIR MONITORING NETWORK REVIEW - DRAFT
PAGE 92
SEMCOG is in agreement with this recommendation based on the overall ozone analyses and
review recently completed by Dr. Turner and Dr. Wolff on behalf of the Southeast Michigan Air
Quality Study workgroup.
Thanks!
Kelly Karll, PE
Plan Implementation
Direct & Cell: 313.324.3375