michigan’s medicaid program€¦ · – provider assessments, known as quality assurance...
TRANSCRIPT

MICHIGAN’S MEDICAID PROGRAM
Presentation to the Medicaid Subcommittee of the House Appropriations Subcommittee on Health and Human Services
Kevin Koorstra, Senior Fiscal AnalystKyle I. Jen, Deputy Director
October 27, 2015
Background Briefing
Presentation Topics
Background Briefing will cover:
Traditional Medicaid Program
Traditional Medicaid Financing
Healthy Michigan Plan
Healthy Michigan Plan Financing
Total Medicaid Expenditures
Medicaid Budget Outlook
House Fiscal Agency: October 2015 2

TRADITIONAL MEDICAIDPROGRAM
Medicaid Program Administration
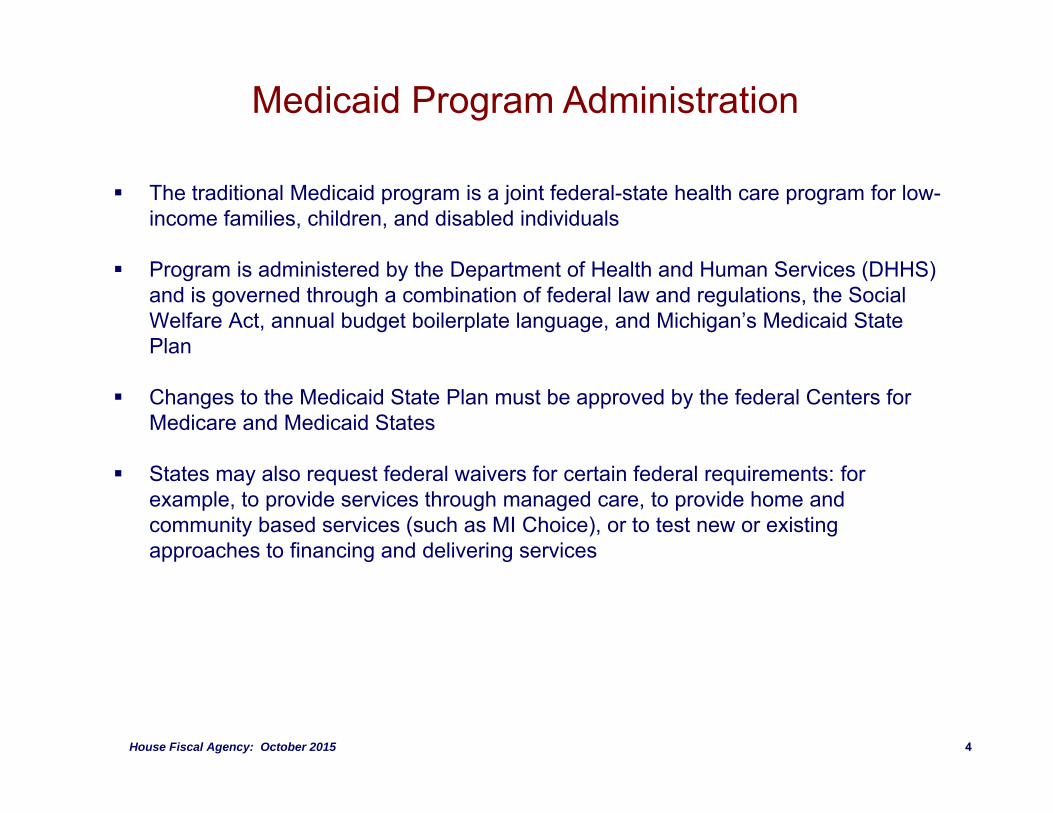
The traditional Medicaid program is a joint federal-state health care program for low-income families, children, and disabled individuals
Program is administered by the Department of Health and Human Services (DHHS) and is governed through a combination of federal law and regulations, the Social Welfare Act, annual budget boilerplate language, and Michigan’s Medicaid State Plan
Changes to the Medicaid State Plan must be approved by the federal Centers for Medicare and Medicaid States
States may also request federal waivers for certain federal requirements: for example, to provide services through managed care, to provide home and community based services (such as MI Choice), or to test new or existing approaches to financing and delivering services
House Fiscal Agency: October 2015 4

Medicaid Eligibility
States have the flexibility to establish income eligibility standards within federal standards
Current net income eligibility standards (not including Healthy Michigan Plan):– Families receiving Family Independence Program cash assistance: 49% of the
federal poverty level (FPL)– Aged, blind, and disabled individuals receiving Supplemental Security Income
(SSI): 75% of FPL– Elderly and disabled individuals up to 100% of FPL– Children under 18 in families up to 160% of FPL– Pregnant women and newborn children up to 195% of FPL– Individuals needing long-term care services up to 225% of FPL (or 300% of SSI)– Medically needy individuals with income or resources above regular financial
eligibility levels
House Fiscal Agency: October 2015 5

Medicaid Eligibility
House Fiscal Agency: October 2015 6
TABLE 12015 Federal Poverty Level Examples
% of FPL Eligibility Group Individual Family of 2 Family of 3 Family of 4
100% Elderly/disabled $11,770 $15,930 $20,090 $24,250133% Healthy Michigan Plan 15,654 21,187 26,720 32,253160% Children under 18 18,832 25,488 32,144 38,800195% Pregnant women/newborn
children22,952 31,064 39,176 47,288
225% Individuals needing long‐term care
26,600 36,002 45,403 54,805
Note: Does not reflect income disregards and asset tests, including 5% income disregard for Healthy Michigan Plan, children, and pregnant women.

Medicaid CaseloadsFrom FY 2000-01 to FY 2010-11, Medicaid caseloads increased by over 70%. Since the peak,caseloads have declined by nearly 15%. The primary driver of caseloads changes appears to beeconomic. Medicaid caseloads appear to track more closely to the state’s poverty rate than the state’sunemployment rate.
House Fiscal Agency: October 2015 7
0.0
2.0
4.0
6.0
8.0
10.0
12.0
14.0
16.0
18.0
0
250,000
500,000
750,000
1,000,000
1,250,000
1,500,000
1,750,000
2,000,000
2,250,000
FY2001
FY2002
FY2003
FY2004
FY2005
FY2006
FY2007
FY2008
FY2009
FY2010
FY2011
FY2012
FY2013
FY2014
FY2015Est
FY2016Est
Poverty/Une
mployment R
ate
Caseload
FIGURE 1Annual Medicaid Caseloads and Economic Trends
Traditional Medicaid Caseload Poverty Rate Unemployment Rate

Medicaid Enrollment and Expenditure Comparison
House Fiscal Agency: October 2015 8
Average cost per beneficiary varies widely among beneficiary groups. The elderly and blind &disabled represent 22% of enrollees, but constitute a majority of the expenditures. Conversely,children make up a majority of enrollees, but only constitute 23% of the expenditures.
* Includes pregnant women, childless adults, foster care children and Plan First enrollees.
0%
10%
20%
30%
40%
50%
60%
70%
80%
90%
100%
Avg. Monthly Beneficiaries Expenditures
Perc
enta
ge o
f Tot
al
FIGURE 2Comparison: FY 2012‐13 Medicaid Beneficiaries and Expenditures
Elderly Blind & Disabled Children Various* Other

Medicaid Services
Federal law and regulations have established both mandatory and optional medical services that are covered by the program
Mandatory Medicaid services include:– Inpatient and outpatient hospital services– Physician’s services– Nursing facility services– Laboratory and x-ray services– Emergency services– Pregnancy-related services
Optional Medicaid services covered under Michigan’s Medicaid program include:– Behavioral health (mental health and substance use disorder)– Home- and community-based services (including MI Choice and habilitation support waivers)– Pharmaceutical services– Adult home help services– Dental services (including the Healthy Kids Dental program)– Hospice services– Program of All-Inclusive Care for the Elderly (PACE)
House Fiscal Agency: October 2015 9

Medicaid Provider Rates
States have the flexibility to establish Medicaid provider rates up to the various federal upper payment limits for hospital services, nursing facilities, clinic services, and practitioner services
These federal upper payment limits generally correspond to Medicare reimbursement rates
Federal regulations also require that provider rates “be sufficient to enlist enough providers so that services under the [Medicaid state] plan are available to beneficiaries at least to the extent that those services are available to the general population.”
Medicaid is considered the payer of last resort, meaning all other financial resources such as commercial insurance, Medicare, workers compensation, or no-fault automobile insurance are utilized prior to Medicaid provider reimbursement
House Fiscal Agency: October 2015 10

Medicare Savings Programs
State Medicaid programs are required to participate in Medicare savings programs, which help low-income Medicare eligible individuals pay for Medicare coverage
There are four Medicare savings programs:– For Medicare eligible individuals up to 100% of FPL, the Qualified Medicare Beneficiaries
program pays Medicare Part A (inpatient services) premiums, Medicare Part B (outpatient services) premiums, deductibles, and coinsurances
– For Medicare eligible individuals between 100% and 120% of FPL, the Special Low Income Medicare Beneficiaries program pays Part B premiums
– For Medicare eligible individuals between 120% and 135% of FPL, the Qualifying Individuals program pays Part B premiums
– For Medicare eligible individuals up to 200% of FPL, the Qualified Disabled Working Individual program pays Part A premiums
Michigan recently implemented a new program for individuals receiving full Medicare and Medicaid coverage (known as “dual eligibles”) called MI Health Link
– Partnership between the state, the federal government, and managed care health plans to provide a single, integrated health plan for all health services
– Currently available in Southwest Michigan, the Upper Peninsula, Macomb County, and Wayne County
– Enrollment is voluntary
House Fiscal Agency: October 2015 11

TRADITIONAL MEDICAID FINANCING

Federal Medicaid Match Rate
Traditional Medicaid expenditures are jointly financed by the federal and state governments
For most expenditures the portion financed by the federal government is determined utilizing the Federal Medical Assistance Percentage (FMAP)
This rate is adjusted annually based on a comparison of a given state’s average personal income to the average national personal income utilizing a three-year average
For FY 2015-16, Michigan’s FMAP rate is 65.60%: the federal government finances 65.60% of Medicaid expenditures, and the state finances the remaining 34.40%. In other words, for each $1.00 Michigan spends on the Medicaid program, the federal government provides $1.91
House Fiscal Agency: October 2015 13

Federal Medicaid Match RateThe federal Medicaid match (FMAP) rate shifted in the state’s favor during the economic downturnas Michigan’s economic growth lagged the nation’s, reducing growing state match requirements,but has now flattened out.
House Fiscal Agency: October 2015 14
ARRA: Federal American Recovery and Reinvestment Act of 2009
0%
10%
20%
30%
40%
50%
60%
70%
80%
FY2001
FY2002
FY2003
FY2004
FY2005
FY2006
FY2007
FY2008
FY2009
FY2010
FY2011
FY2012
FY2013
FY2014
FY2015
FY2016
FIGURE 3Michigan's FMAP Rate
Regular FMAP Rate Temporary ARRA Increase

State Medicaid Match Rate Portion
For FY 2015-16, $4.3 billion in state match funds are appropriated as state match for $12.9 billion in total projected traditional Medicaid expenditures
The largest source of state match funds is General Fund/General Purpose (GF/GP) revenue, at $2.4 billion
Over the last 15 years, the state has increasingly relied on state restricted funds to reduce the need for GF/GP funds as state match, with $1.9 billion in restricted funds appropriated for FY 2015-16
Restricted fund sources include:– Provider assessments, known as Quality Assurance Assessment Program (QAAP), levied
against hospitals, nursing homes, and ambulance providers: $1.1 billion– Medicaid Benefits Trust fund: $324 million– Health Insurance Claims Assessment: $210 million– Special financing funds from public and university hospitals: $186 million– Merit Award Trust Fund: $64 million
Additionally, the state collects roughly $600 million by levying its Use Tax on Medicaid Managed Care Organizations; $400 million (or 2/3) accrues to state GF/GP and $200 million (or 1/3) accrues to the School Aid Fund
House Fiscal Agency: October 2015 15

QAAP Provider Increases and State SavingsThe net payment increases to providers from the Quality Assurance Assessment Program grewsubstantially through FY 2010-11 but have flattened out since. The increase in FY 2015-16 statesavings and subsequent reduction in net provider increase is due to a one-time state retainerincrease of $93 million.
House Fiscal Agency: October 2015 16
$0
$200
$400
$600
$800
$1,000
$1,200
FY2001
FY2002
FY2003
FY2004
FY2005
FY2006
FY2007
FY2008
FY2009
FY2010
FY2011
FY2012
FY2013
FY2014
FY2015
FY2016
Millions
FIGURE 4Quality Assurance Assessment Program: Estimated Provider Increases and State GF/GP
Savings
Net increases to providers
State GF/GP savings
Note: Does not include provider rate increases under Healthy Michigan Plan.

HEALTHY MICHIGAN PLAN

Healthy Michigan Plan
The federal Affordable Care Act, enacted in 2010, required states to expand their Medicaid programs to include all individuals with net income up to 133% of FPL
The target population for the expansion is adults (ages 19-64), as children and pregnant women with incomes of 133% or lower were already eligible for Medicaid
A subsequent Supreme Court decision made expansion optional for each state. As of September 1, 2015, 30 states and the District of Columbia had adopted the expansion
The Michigan Legislature expanded Medicaid to adults with income up to 133% of FPL via Public Act 107 of 2013 (House Bill 4714) which created the Healthy Michigan Plan
Public Act 107 required an initial federal waiver to make a number of modifications from the state’s traditional Medicaid program, including:
– Health savings accounts– Co-pays and other cost sharing (up to 5% of income for individual with income of 100% of
FPL or higher)– Certain incentives for healthy behavior
House Fiscal Agency: October 2015 18
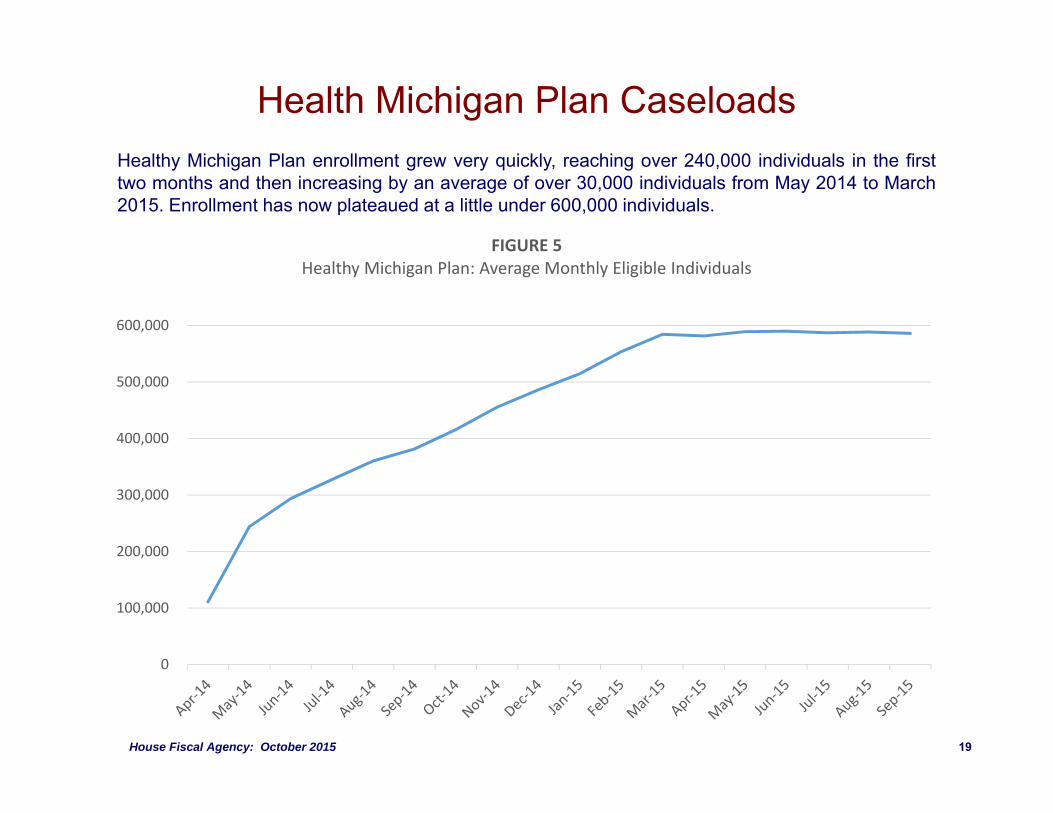
Health Michigan Plan CaseloadsHealthy Michigan Plan enrollment grew very quickly, reaching over 240,000 individuals in the firsttwo months and then increasing by an average of over 30,000 individuals from May 2014 to March2015. Enrollment has now plateaued at a little under 600,000 individuals.
House Fiscal Agency: October 2015 19
0
100,000
200,000
300,000
400,000
500,000
600,000
FIGURE 5Healthy Michigan Plan: Average Monthly Eligible Individuals

HEALTHY MICHIGAN PLAN FINANCING

Healthy Michigan Plan Financing Initially, federal funds support 100% of costs associated with the Healthy Michigan
Plan. That federal match rate will phase down to 90% over the next five years: 95% for calendar year 2017, 94% for 2018, 93% for 2019, and then 90% for 2020 and subsequent years
Based on current HFA projections, state matching costs for the Healthy Michigan Plan will be about $150 million in FY 2016-17 (for three-quarters of a year), growing to roughly $450 million in FY 2020-21 (when the state match rate will be 10% for a full fiscal year)
Not all of the state matching costs, however, will require additional GF/GP funds. Provider assessments and special financing contributions will be used to support the special Medicaid reimbursements within the Healthy Michigan Plan
HFA projects GF/GP costs of $117 million in FY 2016-17, growing to $331 million in FY 2020-21
House Fiscal Agency: October 2015 21

Healthy Michigan Plan State Savings Implementing the Healthy Michigan Plan has also resulted in state savings, as
various health care costs previously funded either partially or wholly through state GF/GP revenue have been shifted to 100% federal funding
Full year GF/GP appropriation reductions of $235 million are as follows:– $168 million for non-Medicaid mental health funding (originally $204 million, with $36 million
subsequently restored)– $47 million for the Adult Benefits Waiver program (including $12 million in restricted
Medicaid Benefits Trust Fund savings that had offset GF/GP)– $19 million for prisoner health care costs in the Department of Corrections budget (originally
$32 million, with $13 million subsequently restored)– $1 million for smaller health care programs
Additionally, the state has realized additional revenue from the Health Insurance Claims Assessment (HICA) and the Use Tax on Medicaid managed care organizations as a result of increased health care activities driven by the Healthy Michigan Plan
Governor’s original proposal for Healthy Michigan Plan included the creation of a reserve fund to pay for future state match costs; Public Act 107, ultimately, did not specifically set aside state funds for future Healthy Michigan Plan costs
House Fiscal Agency: October 2015 22
Healthy Michigan Plan Saving and Cost Estimates
House Fiscal Agency: October 2015 23
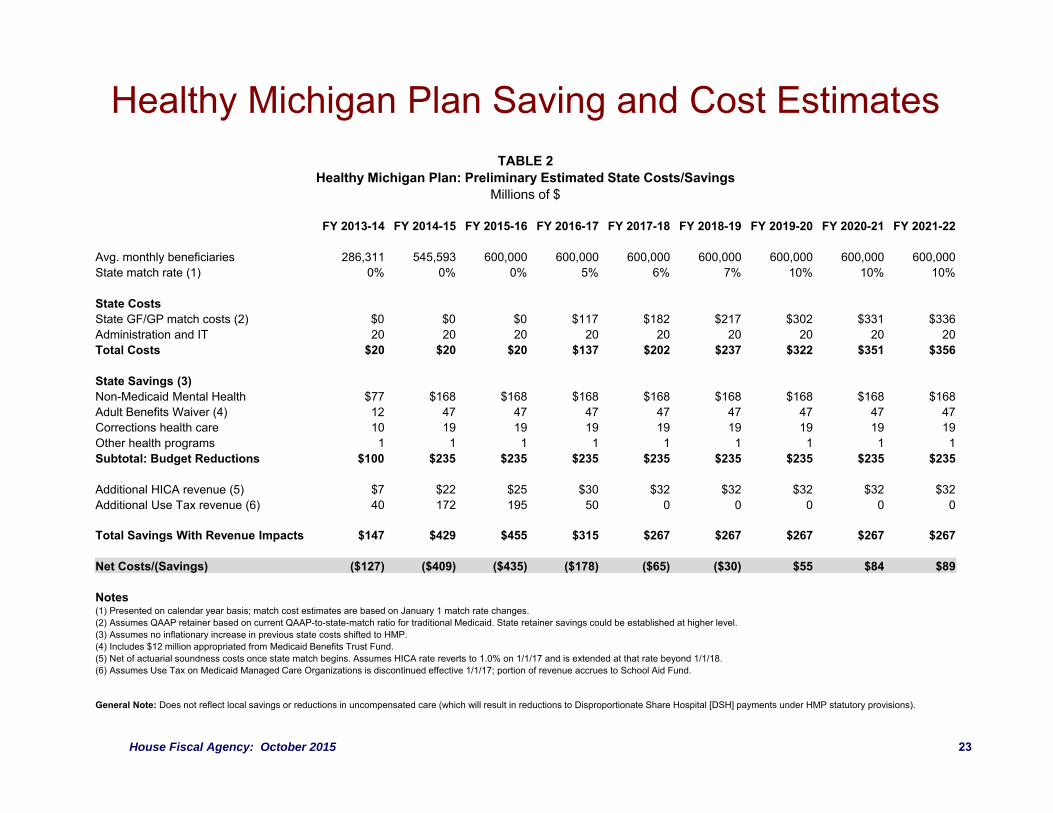
TABLE 2Healthy Michigan Plan: Preliminary Estimated State Costs/Savings
Millions of $
FY 2013-14 FY 2014-15 FY 2015-16 FY 2016-17 FY 2017-18 FY 2018-19 FY 2019-20 FY 2020-21 FY 2021-22
Avg. monthly beneficiaries 286,311 545,593 600,000 600,000 600,000 600,000 600,000 600,000 600,000 State match rate (1) 0% 0% 0% 5% 6% 7% 10% 10% 10%
State CostsState GF/GP match costs (2) $0 $0 $0 $117 $182 $217 $302 $331 $336 Administration and IT 20 20 20 20 20 20 20 20 20 Total Costs $20 $20 $20 $137 $202 $237 $322 $351 $356
State Savings (3)Non-Medicaid Mental Health $77 $168 $168 $168 $168 $168 $168 $168 $168 Adult Benefits Waiver (4) 12 47 47 47 47 47 47 47 47 Corrections health care 10 19 19 19 19 19 19 19 19 Other health programs 1 1 1 1 1 1 1 1 1 Subtotal: Budget Reductions $100 $235 $235 $235 $235 $235 $235 $235 $235
Additional HICA revenue (5) $7 $22 $25 $30 $32 $32 $32 $32 $32 Additional Use Tax revenue (6) 40 172 195 50 0 0 0 0 0
Total Savings With Revenue Impacts $147 $429 $455 $315 $267 $267 $267 $267 $267
Net Costs/(Savings) ($127) ($409) ($435) ($178) ($65) ($30) $55 $84 $89
Notes(1) Presented on calendar year basis; match cost estimates are based on January 1 match rate changes.(2) Assumes QAAP retainer based on current QAAP-to-state-match ratio for traditional Medicaid. State retainer savings could be established at higher level.(3) Assumes no inflationary increase in previous state costs shifted to HMP.(4) Includes $12 million appropriated from Medicaid Benefits Trust Fund.(5) Net of actuarial soundness costs once state match begins. Assumes HICA rate reverts to 1.0% on 1/1/17 and is extended at that rate beyond 1/1/18.(6) Assumes Use Tax on Medicaid Managed Care Organizations is discontinued effective 1/1/17; portion of revenue accrues to School Aid Fund.
General Note: Does not reflect local savings or reductions in uncompensated care (which will result in reductions to Disproportionate Share Hospital [DSH] payments under HMP statutory provisions).
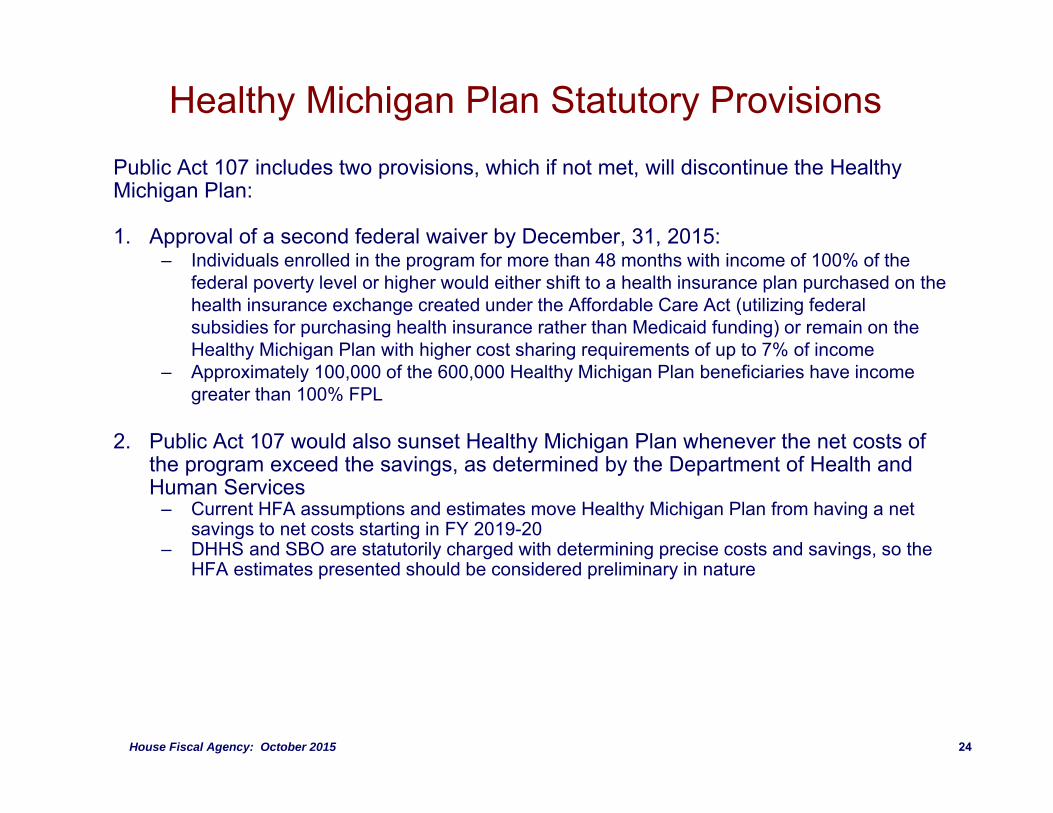
Healthy Michigan Plan Statutory ProvisionsPublic Act 107 includes two provisions, which if not met, will discontinue the Healthy Michigan Plan:
1. Approval of a second federal waiver by December, 31, 2015:– Individuals enrolled in the program for more than 48 months with income of 100% of the
federal poverty level or higher would either shift to a health insurance plan purchased on the health insurance exchange created under the Affordable Care Act (utilizing federal subsidies for purchasing health insurance rather than Medicaid funding) or remain on the Healthy Michigan Plan with higher cost sharing requirements of up to 7% of income
– Approximately 100,000 of the 600,000 Healthy Michigan Plan beneficiaries have income greater than 100% FPL
2. Public Act 107 would also sunset Healthy Michigan Plan whenever the net costs of the program exceed the savings, as determined by the Department of Health and Human Services
– Current HFA assumptions and estimates move Healthy Michigan Plan from having a net savings to net costs starting in FY 2019-20
– DHHS and SBO are statutorily charged with determining precise costs and savings, so the HFA estimates presented should be considered preliminary in nature
House Fiscal Agency: October 2015 24

TOTAL MEDICAID EXPENDITURES

Medicaid Expenditures by Service DeliveryAs both traditional Medicaid and Healthy Michigan Plan caseloads have increased, so have Medicaidexpenditures. Since FY 2000-01, expenditures have tripled from $5.7 billion to $17.0 billion. Both fee-for-service and managed care services have increased, but managed care services have increasedfaster as an increasing percentage of Medicaid beneficiaries have been enrolled into a managed carehealth plan. 71% of beneficiaries are currently covered through managed care, and represent 64% ofexpenditures.
House Fiscal Agency: October 2015 26
$0
$2
$4
$6
$8
$10
$12
$14
$16
$18
FY2001
FY2002
FY2003
FY2004
FY2005
FY2006
FY2007
FY2008
FY2009
FY2010
FY2011
FY2012
FY2013
FY2014
FY2015Appr
FY2016Appr
Billion
s
FIGURE 6Medicaid Expenditures by Service Delivery
Fee‐For‐Services and Long‐Term Care Services Managed Care Services

Medicaid Managed Care The use of managed care is intended to constrain costs by minimizing utilization of
higher-cost services, emphasizing primary and preventative care, and negotiating and incentivizing lower reimbursement rates with providers
Managed care plans accept the risk of having to pay for high utilizers of health care by accepting a capitated per-member, per-month rate
The capitated rates must be actuarially sound based on generally accepted actuarial practices and regulatory requirements
Managed care also creates more predictability for state budgeting
Managed care enrollment is optional for some groups of Medicaid beneficiaries: migrants, Native Americans, and dual eligibles
Some beneficiaries are excluded from managed care enrollment: individuals without full Medicaid coverage, individuals residing in a psychiatric hospital or nursing facility, MI Choice and PACE beneficiaries, and individuals with commercial coverage
House Fiscal Agency: October 2015 27

Annual Cost per Medicaid BeneficiaryCaseload increases are not the sole reason for Medicaid expenditure increases. Utilization, inflation,and increases in special payments and provider assessments have also increased costs. Theaverage cost per traditional Medicaid beneficiary has increased 50% from $4,900 to $7,500 (HealthyMichigan Plan costs are approximately $6,300). This increase is below the rate of general medicalcost inflation.
House Fiscal Agency: October 2015 28
$0
$1,000
$2,000
$3,000
$4,000
$5,000
$6,000
$7,000
$8,000
$9,000
FY 2001FY 2002FY 2003FY 2004FY 2005FY 2006FY 2007FY 2008FY 2009FY 2010FY 2011FY 2012FY 2013FY 2014FY 2015Appr
FY 2016Appr
FIGURE 7Annual Cost per Medicaid Beneficiary Compared to Medical Cost Inflation
Annual Medicaid Cost per Beneficiary (Traditional Program) FY 2001 Indexed to U.S. Medical Cost Inflation

MEDICAID BUDGET OUTLOOK

Medicaid Expenditures by Fund SourceThe state’s total Medicaid caseload has doubled, while total Medicaid expenditures have tripled.Despite those increases, GF/GP funds are basically at the same level as FY 2000-01: roughly $2.0billion. ($400 million of GF/GP in FY 2015-16 is effectively revenue from the Medicaid Managed CareUse Tax)
House Fiscal Agency: October 2015 30
ARRA: Federal American Recovery and Reinvestment Act of 2009
$0
$2
$4
$6
$8
$10
$12
$14
$16
$18
$20
0
250,000
500,000
750,000
1,000,000
1,250,000
1,500,000
1,750,000
2,000,000
2,250,000
2,500,000
FY2001
FY2002
FY2003
FY2004
FY2005
FY2006
FY2007
FY2008
FY2009
FY2010
FY2011
FY2012
FY2013
FY2014
FY2015Appr
FY2016Appr
Expe
nditu
res (in billions)
Caseload
FIGURE 8Total Medicaid Caseload and Expenditures by Fund Source
GF/GP State Restricted Temporary ARRA Federal
Caseload
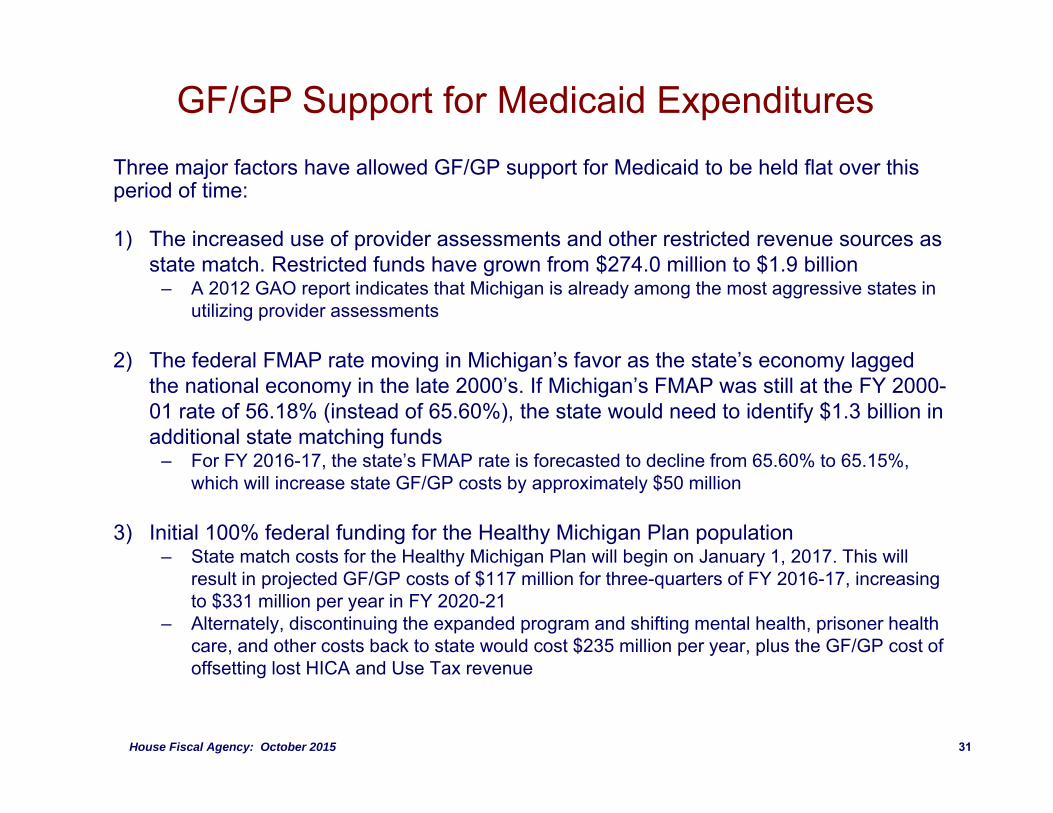
GF/GP Support for Medicaid ExpendituresThree major factors have allowed GF/GP support for Medicaid to be held flat over this period of time:
1) The increased use of provider assessments and other restricted revenue sources as state match. Restricted funds have grown from $274.0 million to $1.9 billion
– A 2012 GAO report indicates that Michigan is already among the most aggressive states in utilizing provider assessments
2) The federal FMAP rate moving in Michigan’s favor as the state’s economy lagged the national economy in the late 2000’s. If Michigan’s FMAP was still at the FY 2000-01 rate of 56.18% (instead of 65.60%), the state would need to identify $1.3 billion in additional state matching funds
– For FY 2016-17, the state’s FMAP rate is forecasted to decline from 65.60% to 65.15%, which will increase state GF/GP costs by approximately $50 million
3) Initial 100% federal funding for the Healthy Michigan Plan population– State match costs for the Healthy Michigan Plan will begin on January 1, 2017. This will
result in projected GF/GP costs of $117 million for three-quarters of FY 2016-17, increasing to $331 million per year in FY 2020-21
– Alternately, discontinuing the expanded program and shifting mental health, prisoner health care, and other costs back to state would cost $235 million per year, plus the GF/GP cost of offsetting lost HICA and Use Tax revenue
House Fiscal Agency: October 2015 31
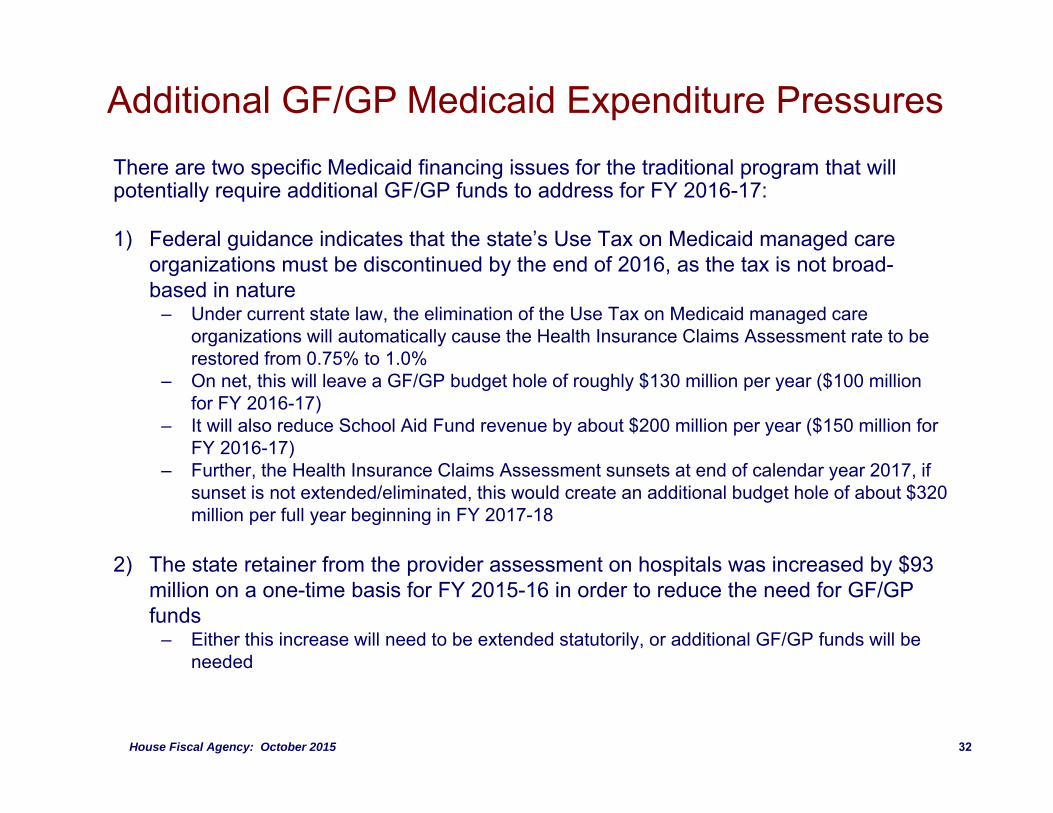
Additional GF/GP Medicaid Expenditure PressuresThere are two specific Medicaid financing issues for the traditional program that will potentially require additional GF/GP funds to address for FY 2016-17:
1) Federal guidance indicates that the state’s Use Tax on Medicaid managed care organizations must be discontinued by the end of 2016, as the tax is not broad-based in nature
– Under current state law, the elimination of the Use Tax on Medicaid managed care organizations will automatically cause the Health Insurance Claims Assessment rate to be restored from 0.75% to 1.0%
– On net, this will leave a GF/GP budget hole of roughly $130 million per year ($100 million for FY 2016-17)
– It will also reduce School Aid Fund revenue by about $200 million per year ($150 million for FY 2016-17)
– Further, the Health Insurance Claims Assessment sunsets at end of calendar year 2017, if sunset is not extended/eliminated, this would create an additional budget hole of about $320 million per full year beginning in FY 2017-18
2) The state retainer from the provider assessment on hospitals was increased by $93 million on a one-time basis for FY 2015-16 in order to reduce the need for GF/GP funds
– Either this increase will need to be extended statutorily, or additional GF/GP funds will be needed
House Fiscal Agency: October 2015 32