michigan polling - realclearpolitics.comaugust_16_2018).pdf · 4 7) if the election for governor...
TRANSCRIPT

1
Michigan Polling
Executive Summary
Gravis Marketing, a nonpartisan research firm, conducted a random survey of 647 registered, likely voters in Michigan. The poll was conducted from August
14th through the 16th and has a margin of error of ±3.9%. The totals may not round to 100% because of rounding. The survey was conducted using an online
panel of cell phone users and interactive voice responses. The results are weighted by voting demographics. The poll was paid for by Gravis Marketing.
3) Do you strongly approve, somewhat approve, somewhat disapprove, or strongly disapprove of President Trump’s job performance?
Party Age group Gender
Democrat Independent or In Another Party Republican 18-29 30-49 50-64 65 or older Female Male
Q3: TRUMPPERFORMANCE Somewhat Approve 8.3% 12.2% 20.2% 18.4% 19.7% 9.2% 6.6% 14.1% 11.9%
Somewhat Disapprove 8.5% 6.7% 12.0% 26.1% 10.6% 2.3% 3.5% 9.9% 8.0%
Strongly Approve 5.3% 25.2% 56.6% 6.0% 21.0% 36.8% 34.4% 17.5% 36.6%
Strongly Disapprove 67.9% 52.5% 10.1% 39.2% 46.5% 45.5% 52.0% 52.3% 39.0%
Uncertain 9.9% 3.4% 1.1% 10.2% 2.2% 6.2% 3.4% 6.1% 4.5%
Contact: Doug Kaplan, 407-242-1870
2
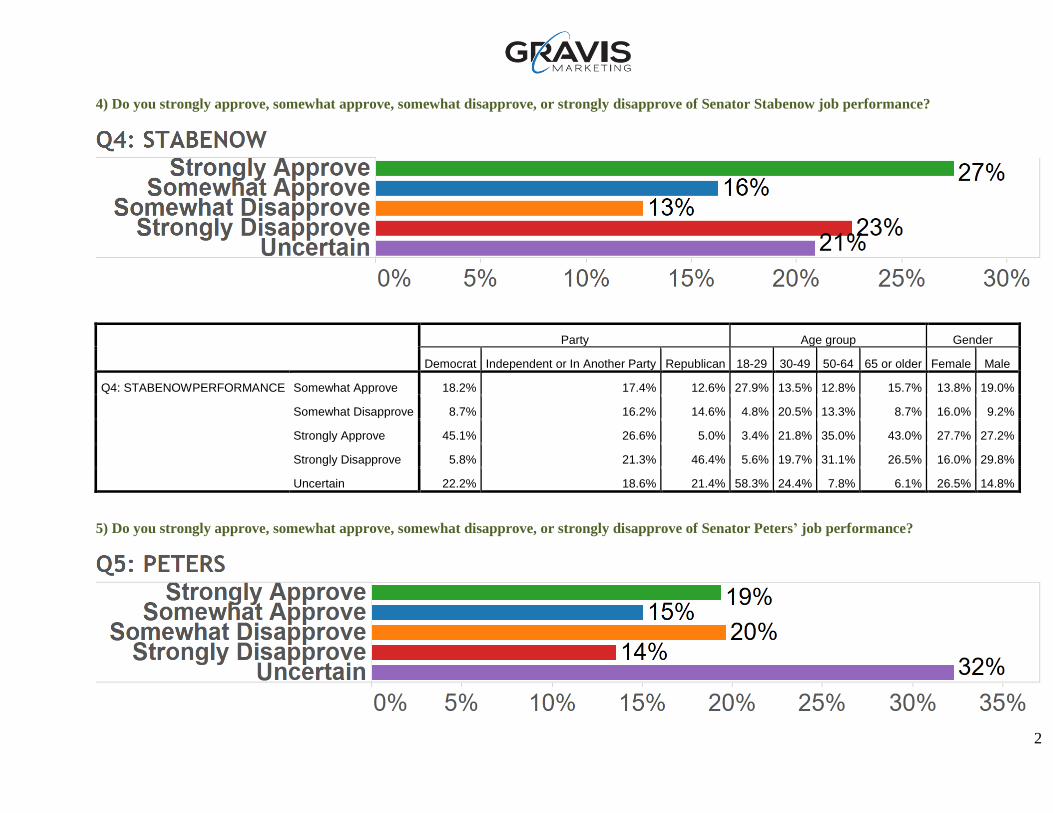
4) Do you strongly approve, somewhat approve, somewhat disapprove, or strongly disapprove of Senator Stabenow job performance?
Party Age group Gender
Democrat Independent or In Another Party Republican 18-29 30-49 50-64 65 or older Female Male
Q4: STABENOWPERFORMANCE Somewhat Approve 18.2% 17.4% 12.6% 27.9% 13.5% 12.8% 15.7% 13.8% 19.0%
Somewhat Disapprove 8.7% 16.2% 14.6% 4.8% 20.5% 13.3% 8.7% 16.0% 9.2%
Strongly Approve 45.1% 26.6% 5.0% 3.4% 21.8% 35.0% 43.0% 27.7% 27.2%
Strongly Disapprove 5.8% 21.3% 46.4% 5.6% 19.7% 31.1% 26.5% 16.0% 29.8%
Uncertain 22.2% 18.6% 21.4% 58.3% 24.4% 7.8% 6.1% 26.5% 14.8%
5) Do you strongly approve, somewhat approve, somewhat disapprove, or strongly disapprove of Senator Peters’ job performance?

3
Party Age group Gender
Democrat Independent or In Another Party Republican 18-29 30-49 50-64 65 or older Female Male
Q5: PETERSPERFORMANCE Somewhat Approve 15.8% 16.0% 13.2% 18.4% 12.3% 14.0% 17.7% 14.0% 16.2%
Somewhat Disapprove 15.3% 29.3% 15.9% 13.4% 26.0% 20.1% 16.4% 19.4% 20.0%
Strongly Approve 27.2% 14.5% 13.9% 17.5% 15.3% 22.7% 20.5% 16.2% 22.9%
Strongly Disapprove 7.5% 11.1% 24.1% 3.8% 10.8% 19.3% 15.5% 8.5% 19.0%
Uncertain 34.2% 29.0% 32.9% 46.9% 35.5% 23.9% 29.9% 41.9% 21.9%
6) Do you strongly approve, somewhat approve, somewhat disapprove, or strongly disapprove of Governor Snyder’s job performance?
Party Age group Gender
Democrat Independent or In Another Party Republican 18-29 30-49 50-64 65 or older Female Male
Q6: SNYDERPERFORMANCE Somewhat Approve 17.1% 29.4% 24.7% 31.5% 25.4% 18.1% 21.5% 25.1% 20.9%
Somewhat Disapprove 24.5% 20.5% 30.1% 38.7% 23.4% 22.9% 18.4% 23.6% 26.5%
Strongly Approve 4.3% 11.0% 32.0% 6.9% 4.4% 20.3% 24.7% 10.2% 19.4%
Strongly Disapprove 43.8% 31.8% 8.6% 1.1% 43.0% 33.3% 31.2% 32.6% 26.4%
Uncertain 10.2% 7.4% 4.6% 21.8% 3.7% 5.4% 4.2% 8.5% 6.8%
4
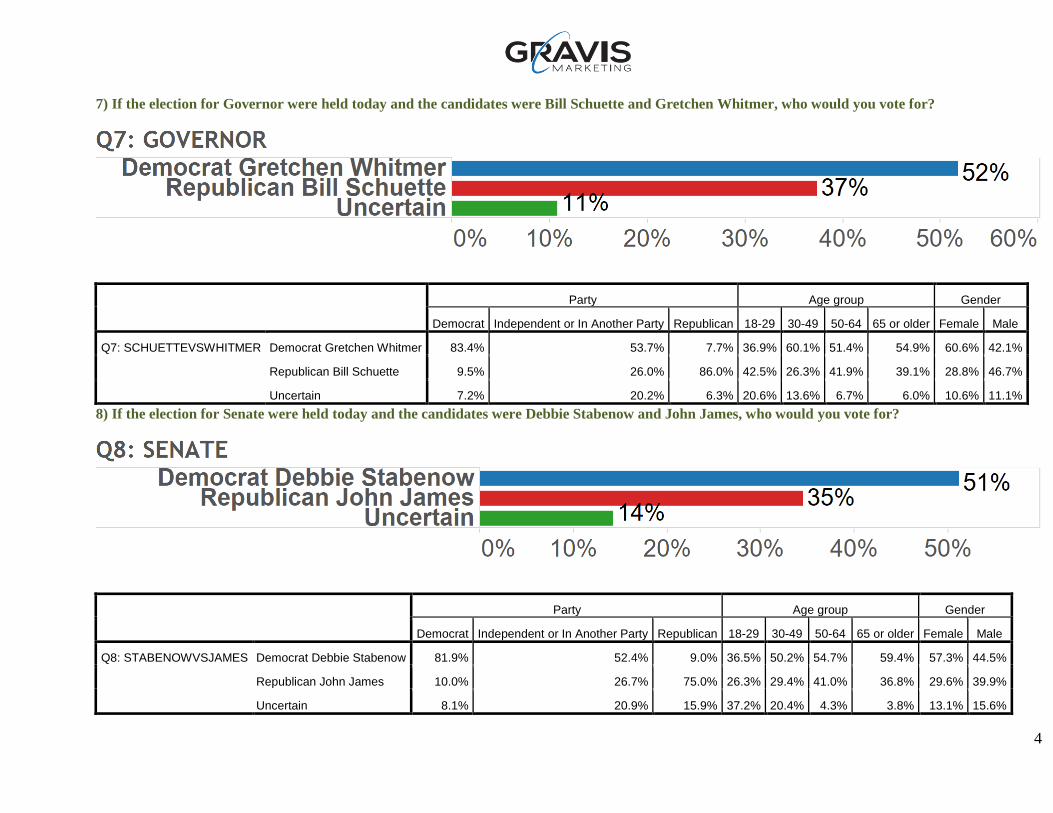
7) If the election for Governor were held today and the candidates were Bill Schuette and Gretchen Whitmer, who would you vote for?
Party Age group Gender
Democrat Independent or In Another Party Republican 18-29 30-49 50-64 65 or older Female Male
Q7: SCHUETTEVSWHITMER Democrat Gretchen Whitmer 83.4% 53.7% 7.7% 36.9% 60.1% 51.4% 54.9% 60.6% 42.1%
Republican Bill Schuette 9.5% 26.0% 86.0% 42.5% 26.3% 41.9% 39.1% 28.8% 46.7%
Uncertain 7.2% 20.2% 6.3% 20.6% 13.6% 6.7% 6.0% 10.6% 11.1%
8) If the election for Senate were held today and the candidates were Debbie Stabenow and John James, who would you vote for?
Party Age group Gender
Democrat Independent or In Another Party Republican 18-29 30-49 50-64 65 or older Female Male
Q8: STABENOWVSJAMES Democrat Debbie Stabenow 81.9% 52.4% 9.0% 36.5% 50.2% 54.7% 59.4% 57.3% 44.5%
Republican John James 10.0% 26.7% 75.0% 26.3% 29.4% 41.0% 36.8% 29.6% 39.9%
Uncertain 8.1% 20.9% 15.9% 37.2% 20.4% 4.3% 3.8% 13.1% 15.6%

5
9) Would you more or less likely support a candidate for Congress if you knew they would support Nancy Pelosi to be Speaker of the House?
Party Age group Gender
Democrat Independent or In Another Party Republican 18-29 30-49 50-64 65 or older Female Male
Q9: SUPPORTPELOSI Less Likely 24.8% 40.4% 64.5% 36.6% 40.4% 46.2% 38.4% 34.4% 49.0%
More Likely 34.6% 17.3% 12.9% 29.3% 18.7% 22.8% 22.7% 24.7% 20.9%
Uncertain 40.6% 42.3% 22.6% 34.0% 40.9% 31.0% 39.0% 40.9% 30.1%
10) Would you more or less likely support a candidate for Congress if you knew they would vote to impeach President Donald J. Trump?
Party Age group Gender
Democrat Independent or In Another Party Republican 18-29 30-49 50-64 65 or older Female Male
Q10: IMPEACHTRUMP Less Likely 15.6% 40.0% 79.1% 41.4% 38.2% 45.2% 41.5% 32.5% 52.2%
More Likely 62.5% 42.1% 13.8% 33.2% 44.9% 40.6% 47.3% 51.9% 30.7%
Uncertain 22.0% 17.9% 7.1% 25.4% 17.0% 14.1% 11.2% 15.6% 17.0%

6
11) Do you currently approve or disapprove of the Tax Reform Bill that was signed into law recently?
Party Age group Gender
Democrat Independent or In Another Party Republican 18-29 30-49 50-64 65 or older Female Male
Q11: TAXREFORM Approve 12.5% 30.4% 53.2% 15.3% 23.6% 40.7% 32.9% 22.6% 38.2%
Disapprove 58.3% 43.8% 19.8% 49.2% 41.1% 38.2% 45.5% 43.6% 41.1%
Uncertain 29.1% 25.8% 27.0% 35.6% 35.3% 21.1% 21.6% 33.8% 20.7%
12) Do you support or oppose the legalization of same-sex marriage in the United States?
Party Age group Gender
Democrat Independent or In Another Party Republican 18-29 30-49 50-64 65 or older Female Male
Q12: SAMESEXMARRIAGE Oppose 12.8% 28.8% 59.1% 16.3% 26.9% 39.1% 37.4% 23.8% 39.8%
Support 76.9% 56.6% 26.4% 75.5% 68.5% 44.9% 40.6% 63.0% 47.8%
Uncertain 10.3% 14.6% 14.5% 8.1% 4.6% 16.0% 22.1% 13.2% 12.4%
7
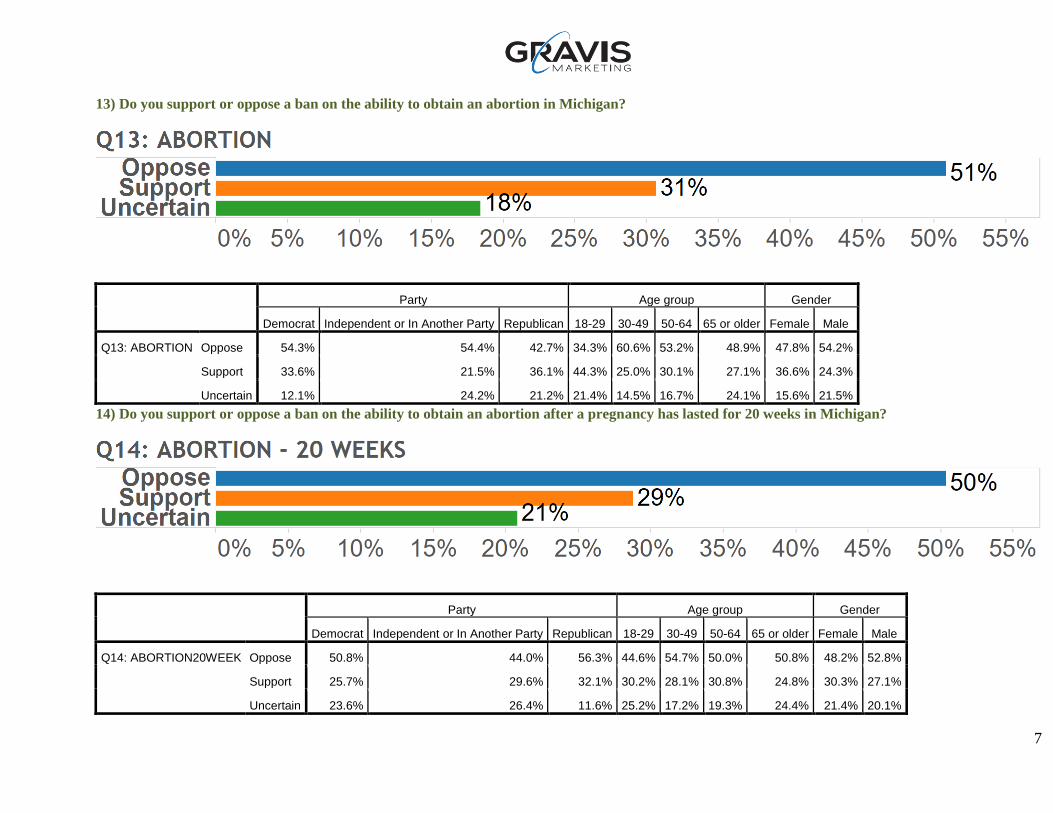
13) Do you support or oppose a ban on the ability to obtain an abortion in Michigan?
Party Age group Gender
Democrat Independent or In Another Party Republican 18-29 30-49 50-64 65 or older Female Male
Q13: ABORTION Oppose 54.3% 54.4% 42.7% 34.3% 60.6% 53.2% 48.9% 47.8% 54.2%
Support 33.6% 21.5% 36.1% 44.3% 25.0% 30.1% 27.1% 36.6% 24.3%
Uncertain 12.1% 24.2% 21.2% 21.4% 14.5% 16.7% 24.1% 15.6% 21.5%
14) Do you support or oppose a ban on the ability to obtain an abortion after a pregnancy has lasted for 20 weeks in Michigan?
Party Age group Gender
Democrat Independent or In Another Party Republican 18-29 30-49 50-64 65 or older Female Male
Q14: ABORTION20WEEK Oppose 50.8% 44.0% 56.3% 44.6% 54.7% 50.0% 50.8% 48.2% 52.8%
Support 25.7% 29.6% 32.1% 30.2% 28.1% 30.8% 24.8% 30.3% 27.1%
Uncertain 23.6% 26.4% 11.6% 25.2% 17.2% 19.3% 24.4% 21.4% 20.1%
8
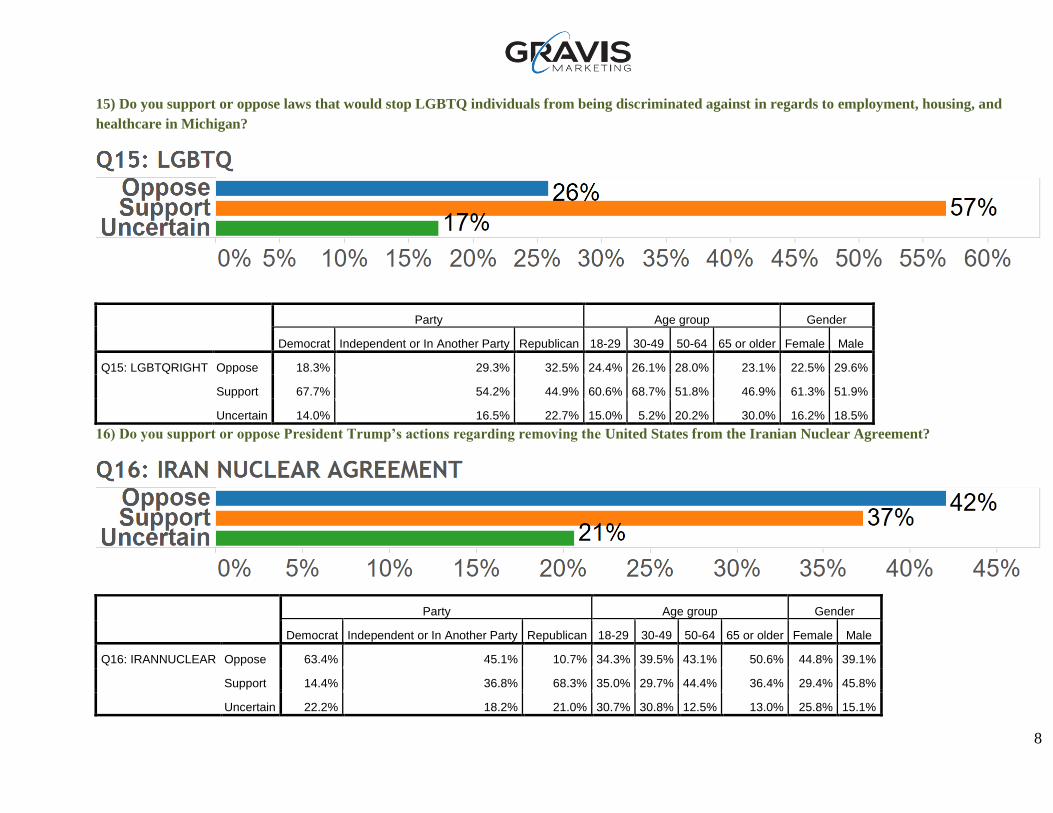
15) Do you support or oppose laws that would stop LGBTQ individuals from being discriminated against in regards to employment, housing, and
healthcare in Michigan?
Party Age group Gender
Democrat Independent or In Another Party Republican 18-29 30-49 50-64 65 or older Female Male
Q15: LGBTQRIGHT Oppose 18.3% 29.3% 32.5% 24.4% 26.1% 28.0% 23.1% 22.5% 29.6%
Support 67.7% 54.2% 44.9% 60.6% 68.7% 51.8% 46.9% 61.3% 51.9%
Uncertain 14.0% 16.5% 22.7% 15.0% 5.2% 20.2% 30.0% 16.2% 18.5%
16) Do you support or oppose President Trump’s actions regarding removing the United States from the Iranian Nuclear Agreement?
Party Age group Gender
Democrat Independent or In Another Party Republican 18-29 30-49 50-64 65 or older Female Male
Q16: IRANNUCLEAR Oppose 63.4% 45.1% 10.7% 34.3% 39.5% 43.1% 50.6% 44.8% 39.1%
Support 14.4% 36.8% 68.3% 35.0% 29.7% 44.4% 36.4% 29.4% 45.8%
Uncertain 22.2% 18.2% 21.0% 30.7% 30.8% 12.5% 13.0% 25.8% 15.1%

9
17) As you may know there is an investigation into possible dealings with President Trump’s associates and Russia being led by Special Counsel Robert
Mueller. Do you believe the investigation is justified or do you believe it is politically motivated?
Party Age group Gender
Democrat Independent or In Another Party Republican 18-29 30-49 50-64 65 or older Female Male
Q17: RUSSIA Justified 70.8% 45.0% 18.4% 21.9% 52.2% 52.5% 54.6% 49.6% 44.9%
Politically motivated 19.1% 44.0% 74.3% 53.2% 40.8% 41.2% 40.5% 36.2% 50.5%
Uncertain 10.1% 11.1% 7.4% 24.9% 7.0% 6.3% 5.0% 14.2% 4.6%
18) Do you strongly approve, somewhat approve, somewhat disapprove, or strongly disapprove of Special Counsel Robert Mueller’s job performance?
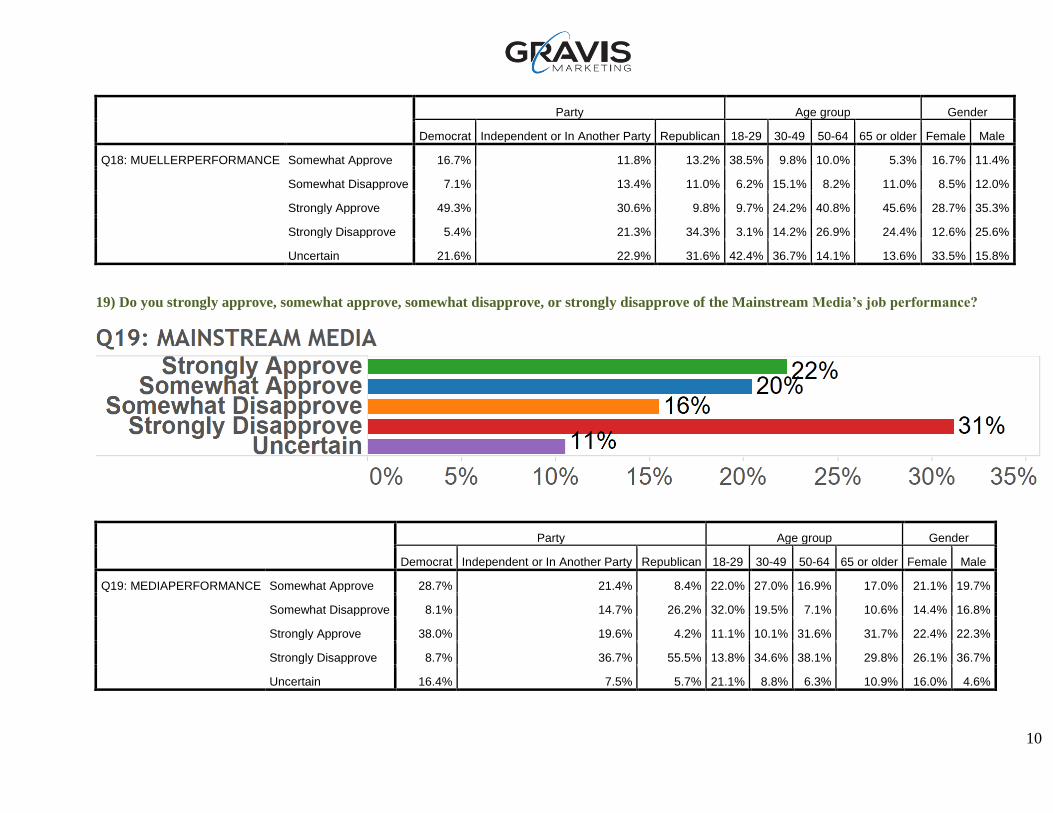
10
Party Age group Gender
Democrat Independent or In Another Party Republican 18-29 30-49 50-64 65 or older Female Male
Q18: MUELLERPERFORMANCE Somewhat Approve 16.7% 11.8% 13.2% 38.5% 9.8% 10.0% 5.3% 16.7% 11.4%
Somewhat Disapprove 7.1% 13.4% 11.0% 6.2% 15.1% 8.2% 11.0% 8.5% 12.0%
Strongly Approve 49.3% 30.6% 9.8% 9.7% 24.2% 40.8% 45.6% 28.7% 35.3%
Strongly Disapprove 5.4% 21.3% 34.3% 3.1% 14.2% 26.9% 24.4% 12.6% 25.6%
Uncertain 21.6% 22.9% 31.6% 42.4% 36.7% 14.1% 13.6% 33.5% 15.8%
19) Do you strongly approve, somewhat approve, somewhat disapprove, or strongly disapprove of the Mainstream Media’s job performance?
Party Age group Gender
Democrat Independent or In Another Party Republican 18-29 30-49 50-64 65 or older Female Male
Q19: MEDIAPERFORMANCE Somewhat Approve 28.7% 21.4% 8.4% 22.0% 27.0% 16.9% 17.0% 21.1% 19.7%
Somewhat Disapprove 8.1% 14.7% 26.2% 32.0% 19.5% 7.1% 10.6% 14.4% 16.8%
Strongly Approve 38.0% 19.6% 4.2% 11.1% 10.1% 31.6% 31.7% 22.4% 22.3%
Strongly Disapprove 8.7% 36.7% 55.5% 13.8% 34.6% 38.1% 29.8% 26.1% 36.7%
Uncertain 16.4% 7.5% 5.7% 21.1% 8.8% 6.3% 10.9% 16.0% 4.6%
11
20) Would you approve or disapprove of a border wall built between the border of Mexico and the U.S.?
Party Age group Gender
Democrat Independent or In Another Party Republican 18-29 30-49 50-64 65 or older Female Male
Q20: BORDERWALL Approve 19.5% 44.3% 64.0% 27.4% 40.9% 46.0% 40.9% 34.9% 46.2%
Disapprove 69.6% 51.8% 23.4% 54.3% 49.7% 46.9% 54.2% 53.1% 47.6%
Uncertain 10.8% 3.9% 12.6% 18.3% 9.4% 7.1% 4.9% 12.1% 6.2%
21) Do you believe the U.S. Senate should consider President Trump’s nominee, Brett Kavanaugh to fill the vacancy of Justice Kennedy, who is
retiring?
Party Age group Gender
Democrat Independent or In Another Party Republican 18-29 30-49 50-64 65 or older Female Male
Q21: SENTATEJUSTICE No 54.8% 35.5% 4.9% 22.4% 31.0% 40.4% 37.1% 38.2% 29.5%
Uncertain 25.7% 26.1% 16.5% 30.6% 34.7% 13.8% 18.1% 30.1% 15.5%
Yes 19.5% 38.4% 78.5% 47.1% 34.3% 45.9% 44.8% 31.6% 55.0%
12
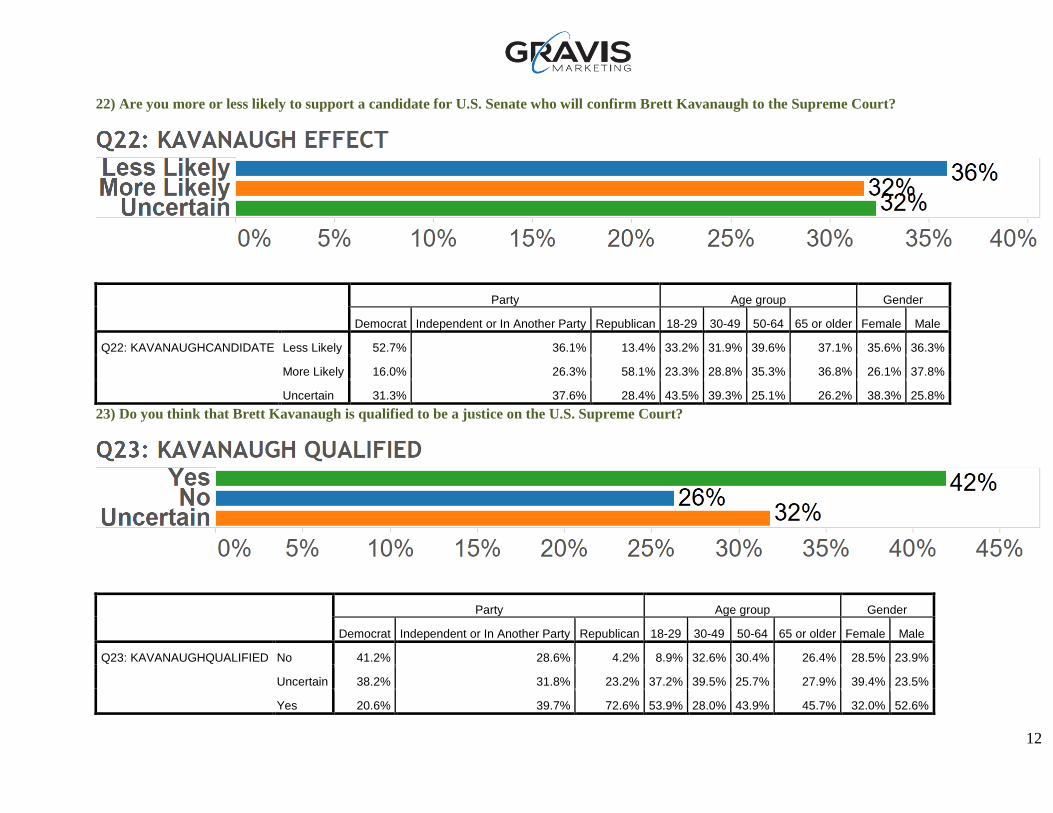
22) Are you more or less likely to support a candidate for U.S. Senate who will confirm Brett Kavanaugh to the Supreme Court?
Party Age group Gender
Democrat Independent or In Another Party Republican 18-29 30-49 50-64 65 or older Female Male
Q22: KAVANAUGHCANDIDATE Less Likely 52.7% 36.1% 13.4% 33.2% 31.9% 39.6% 37.1% 35.6% 36.3%
More Likely 16.0% 26.3% 58.1% 23.3% 28.8% 35.3% 36.8% 26.1% 37.8%
Uncertain 31.3% 37.6% 28.4% 43.5% 39.3% 25.1% 26.2% 38.3% 25.8%
23) Do you think that Brett Kavanaugh is qualified to be a justice on the U.S. Supreme Court?
Party Age group Gender
Democrat Independent or In Another Party Republican 18-29 30-49 50-64 65 or older Female Male
Q23: KAVANAUGHQUALIFIED No 41.2% 28.6% 4.2% 8.9% 32.6% 30.4% 26.4% 28.5% 23.9%
Uncertain 38.2% 31.8% 23.2% 37.2% 39.5% 25.7% 27.9% 39.4% 23.5%
Yes 20.6% 39.7% 72.6% 53.9% 28.0% 43.9% 45.7% 32.0% 52.6%

13
24) Do you support or oppose abolishing the immigration and customs enforcement agency, commonly referred to as ICE?
Party Age group Gender
Democrat Independent or In Another Party Republican 18-29 30-49 50-64 65 or older Female Male
Q24: ABOLISHICE Oppose 41.9% 55.1% 64.3% 54.5% 61.5% 52.5% 39.6% 52.6% 52.6%
Support 22.4% 14.8% 17.4% 16.3% 13.3% 21.0% 23.4% 17.6% 19.8%
Uncertain 35.7% 30.1% 18.3% 29.3% 25.2% 26.6% 37.0% 29.8% 27.6%
25) Are you more or less likely to support a candidate in House or Senate who will abolish the immigration and customs enforcement agency,
commonly referred to as ICE?
Party Age group Gender
Democrat Independent or In Another Party Republican 18-29 30-49 50-64 65 or older Female Male
Q25: ABOLISHICECANDIDATE Less Likely 31.9% 56.0% 52.8% 29.7% 52.7% 50.3% 41.3% 45.7% 45.1%
More Likely 27.0% 12.4% 29.2% 48.6% 8.0% 22.7% 21.4% 21.7% 25.0%
Uncertain 41.0% 31.6% 18.0% 21.8% 39.3% 27.0% 37.2% 32.6% 29.9%

14
The following questions are for demographic purposes:
1) Are you registered to vote in Michigan?
2) How likely are you to vote in the upcoming Michigan Midterm Elections?
26) What is your party affiliation?
15
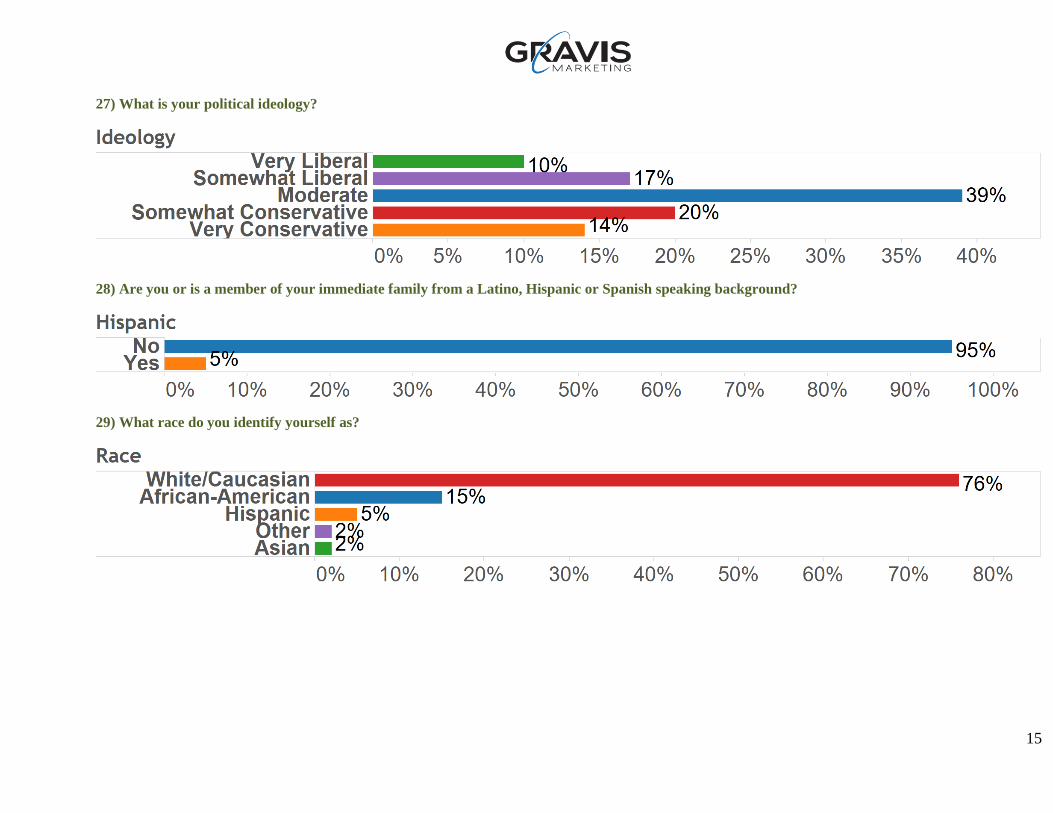
27) What is your political ideology?
28) Are you or is a member of your immediate family from a Latino, Hispanic or Spanish speaking background?
29) What race do you identify yourself as?
16
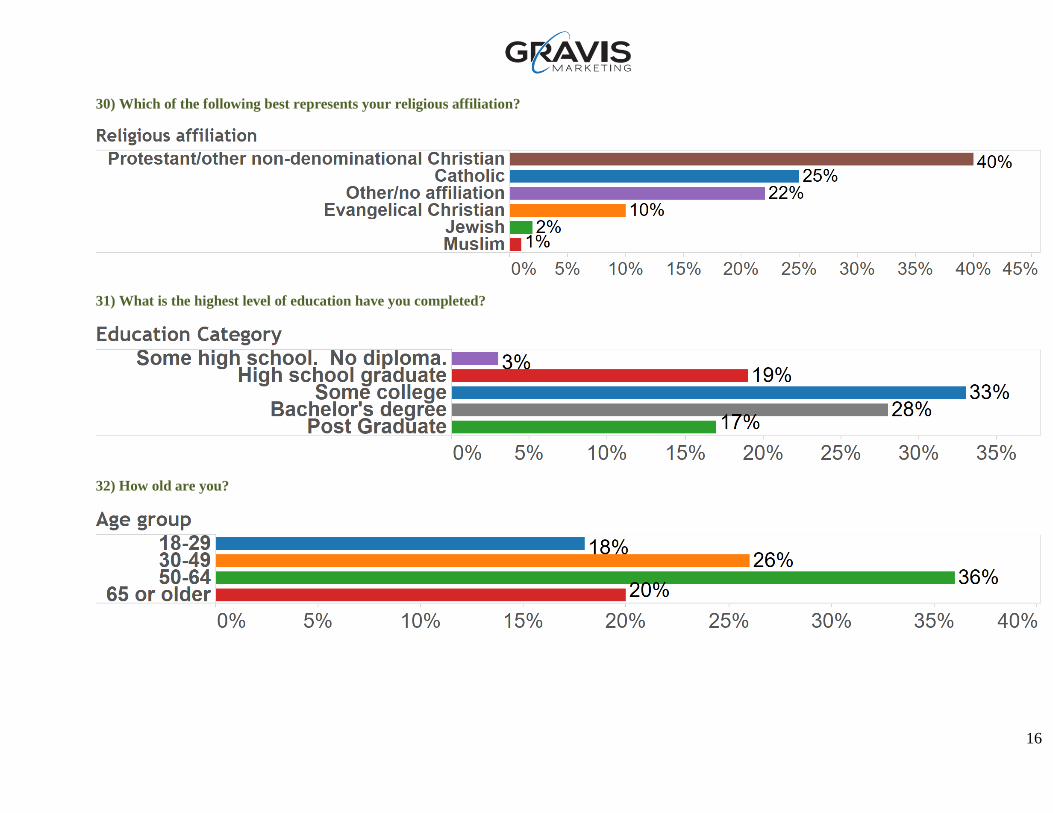
30) Which of the following best represents your religious affiliation?
31) What is the highest level of education have you completed?
32) How old are you?
17
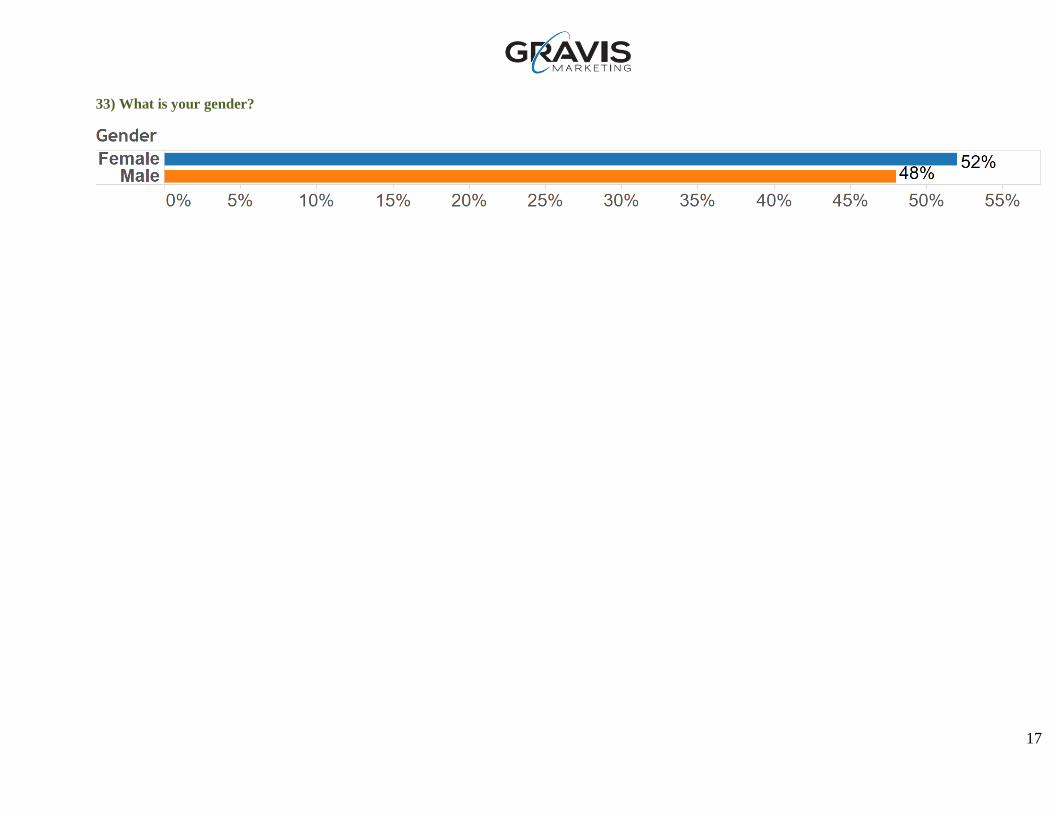
33) What is your gender?