michigan child death report - som - state of michigan first understand how and why our children are...
TRANSCRIPT

1
Michigan Department of
Human Services
CSA Children’s Services Administration Communication
Issuance
Type: Informational Memorandum (IM) Program Instruction (PI) Policy Guide (PG)
Issuance Date: 08/27/12 Obsolete Date: n/a Response Due: n/a Log No.: 12‐133 Contact: Colin Parks at 517‐241‐8297 Originating Office: CPS & Family Preservation Subject/Title: Michigan Child Death Report Distribution: DHS Child Welfare Staff
Private Agency Child Welfare Staff CSA Central Office Managers/Staff Native American Tribes Data Management DHS County Directors Adult Services Staff
BCAL CWTI SACWIS
Other: Attached is a copy of an annual report on Michigan child deaths. The report consolidates child death data from the past two years (2009‐2010) and is created in accordance with 1997 PA 167 (MCL 722.627b). This report is created with input from over 1,200 community representatives in 62 counties throughout the state. It is developed in part to provide recommendations and strategies to state legislators about Michigan could work toward preventing future child deaths. This report is then provided to the state legislature for their review, and possible action. Below are some of the key findings for your review:
‐ From 2009‐2010, at least 2,803 children died in Michigan. ‐ Black children die at a rate 2.8 times that of white children. ‐ Infant deaths (children under 12‐months) account for over half of the Michigan child deaths. ‐ At least 61% of these child deaths are viewed as preventable. ‐ Michigan’s infant mortality rate is 7.5 per thousand live births. The national rate is 6.3 per thousand live births. ‐ Between 2009‐2010, at least 267 Michigan infant deaths were associated with an unsafe sleep environment.
Since 1996, nearly 1,800 Michigan infant deaths were sleep‐related. ‐ If Michigan were able to eliminate these unsafe sleep deaths, we would drop to a 6.6 per thousand infant
mortality rate. Please feel free to contact Colin Parks, Manager of CPS & Family Preservation at 517‐241‐8297 with any questions.

The Michigan Department of Human ServicesMichigan Public Health Institute
C h i l d D e a t h s IN MICHIGAN
A r e p o r t o n t h e c a u s e s a n d t r e n d s o f child deaths in Michigan based on findings from c o m m u n i t y - b a s e d C h i l d D e a t h R e v i e w Teams w i t h r e comenda t i on s f o r po l i c y a n d p r a c t i c e t o p r e v e n t c h i l d d e a t h s.
A Report on Reviewsconducted in 2009-2010
Michigan Chi ld Death State Advisory TeamN i n t h A n n u a lE X E C U T I V E R E P O R T

The Honorable Rick Snyder, GovernorHonorable members of the Michigan Legislature
I am submitting this ninth annual report on child deaths in Michigan in accordance with 1997 PA 167. In the two-year period from 2009-2010, 2,803 children died in Michigan. Black children died at a rate 2.8 times that of white children, and each year, infant deaths (children under age 1) have accounted for approximately half of all child deaths in Michigan and nationwide.
The child death review process provides a critical opportunity to learn about the causes and circumstances of children’s deaths in order to prevent future deaths as well as injuries and disabilities. For each death assigned for review, a multidisciplinary team from the child’s community met to determine the circumstances that led to the death and its preventability.
In 2009-2010, more than 1,200 community representatives in 62 counties reviewed 1,283 child deaths and determined that more than half (61 percent) were preventable. In this report, the Michigan Child Death State Advisory Team presents multiple strategies to prevent future child deaths. The report includes recommendations for increased education campaigns to prevent drug overdoses by teens, and new laws requiring health practitioners to uniformly educate parents on how to prevent sleep-related infant deaths.
Reducing infant mortality and preventable child deaths will require sustained efforts at the state and local levels. I appreciate the priority that this administration has placed on decreasing infant mortality, highlighted through its MiDashboard initiative. Childhood mortality is a critical indicator of the overall health and welfare of Michigan and I share your commitment to reduce preventable deaths and improve Michigan’s performance in this area.
Sincerely,
Maura D. Corrigan, Director Department of Human Services
1
C h i l d D e a t h s IN MICHIGAN
MICHIGAN CHILD DEATH STATE ADVISORY TEAM
NINTH ANNUAL REPORT
A REPORT ON REVIEWS CONDUCTED IN 2009–2010
MISSION
TO UNDERSTAND HOW AND WHY CHILDREN DIE IN MICHIGAN,
IN ORDER TO TAKE ACTION TO PREVENT OTHER CHILD DEATHS.
SUBMITTED TO
THE HONORABLE RICK SNYDER, GOVERNOR, STATE OF MICHIGAN
THE HONORABLE RANDY RICHARDVILLE, MAJORITY LEADER, MICHIGAN STATE SENATE
THE HONORABLE JASE BOLGER, SPEAKER OF THE HOUSE, MICHIGAN HOUSE OF REPRESENTATIVES

MICHIGAN CHILD DEATH
S TATE ADV ISORY TEAM
2009–2010
CHAIRZOE LYONS
Acting DirectorBranch/Hillsdale Department of Human Services
MEMBERS
BROOKE BRANTLEY-GILBERTInvestigator
Office of the Children’s Ombudsman
STACIE BLADENDirector
Office of Family AdvocateMichigan Department of Human Services
DEBI CAINDirector
Domestic Violence Prevention and Treatment Board
Michigan Department of Human Services
BRENDA FINKDirector
Division of Family & Community HealthMichigan Department of Community Health
JEFFREY FINKProsecutor
Kalamazoo County Prosecutors Office
ROSEMARY FOURNIERProgram Coordinator
Michigan Fetal & Infant Mortality ReviewMichigan Department of Community Health
SHIRLEY MANN GRAYAdministrative Director
Clinical Support Services, Family Centered CareChildren’s Hospital of Michigan
DR BRIAN HUNTERChief Medical Examiner
Genesee County Medical Examiners Office
LT CLAY JANSSONCommerce Twp Substation Commander
Oakland County Sheriff’s Office
KIM KOVALCHICKCoordinated School Health and Safety
Programs UnitMichigan Department of Education
JOSEPH KOZAKIEWICZDirector
Chance at Childhood
COLIN PARKSActing Program Manager
CPS and Family Preservation ProgramsMichigan Department of Human Services
JENIFER PETTIBONEChild Welfare Services
State Court Administrative Office
LINDA SCARPETTAManager
Injury & Violence Prevention SectionMichigan Department of Community Health
JOHN SHAFFERManager
Mid Michigan Medical Center EMS
DR DEBRA SIMMSDivision Chief
Center for Child Protection Helen DeVos Children’s Hospital
PATRICIA L SORENSONVice President for Policy
Michigan’s Children
STACEY TADGERSONDirector
Native American AffairsMichigan Department of Human Services
AMY ZAAGMANExecutive Director
MI Council for Maternal and Child Health
CHILD DEATH REVIEW
P R O G R A M S T A F F
Michigan Public Health InstituteSHANNON STOTENBUR-WING
Program DirectorHEIDI HILLIARD
Project CoordinatorLINDSAY GROSSSpecial Projects Facilitator

TABLE OF
CONTENTS
INTRODUCTION . . . . . . . . . . . . . . . . . . . . . . . . . . . . . 4
SCOPE OF THE DATA . . . . . . . . . . . . . . . . . . . . . . . . . 5
CHILD DEATH REVIEW DATA OVERVIEW . . . . . . . . . . . 5
SELECTED CAUSES OF DEATH . . . . . . . . . . . . . . . . . . 13
Sleep-Related Infant Deaths . . . . . . . . . . . . . . . . . . . . 13
Poisonings/Overdoses/Acute Intoxications . . . . . . . . . 17
Motor Vehicle Deaths . . . . . . . . . . . . . . . . . . . . . . . . 19
Child Abuse and Neglect Deaths . . . . . . . . . . . . . . . . 21
FETAL INFANT MORTALITY REVIEW . . . . . . . . . . . . . . 24
Scope of the Problem . . . . . . . . . . . . . . . . . . . . . . . . 25
Status of Local FIMR Teams . . . . . . . . . . . . . . . . . . . . 26
Examples of Local Initiatives Resulting from FIMRs . . . . . 27
APPENDICES
A: Total Numbers of Resident Child Deaths vs Number of Reviews by County,
2009 and 2010 . . . . . . . . . . . . . . . . . . . . . . . . 30–31
B: Child Fatality Bills — 2011 . . . . . . . . . . . . . . . . . . . . 32

4
INTRODUCTIONChildren are not supposed to die. The death of a child is a profound loss not only to the child’s parents and family, but also to the larger community. In order to reduce the numbers of these tragic losses, we must first understand how and why our children are dying.
The Child Death Review (CDR) program was implemented in Michigan in 1995 to conduct in-depth reviews of child deaths and identify ways to prevent them. Multidisciplinary teams of local community members examine the circumstances that led to the deaths of children in their jurisdictions. Required members of local teams include: the county medical examiner’s office, the county prosecutor’s office, local law enforcement, and representatives from the local court, health department and county office of the Michigan Department of Human Services (DHS). Local teams may add further membership or invite guests as necessary, including emergency medical services, physicians, records staff, schools, community mental health, or other service providers. Based on their review findings, these teams recommend actions aimed at preventing future deaths.
The Michigan Child Death State Advisory Team was established by Public Act 167 of 1997 (MCL 722.627b) to “identify and make recommendations on policy and statutory changes pertaining to child fatalities and to guide statewide prevention, education and training efforts.” The law further requires the State Advisory Team to publish an annual report on child fatalities. The present report includes deaths reviewed in 2009 and 2010, during which a total of 2,803* children died in Michigan. Local teams reviewed 1,283 child deaths in that same time period.
DHS has established a contract with the Michigan Public Health Institute (MPHI) to manage the CDR program. The contract requires MPHI to provide annual training for team members and statewide training on child death procedures. In the past four years, MPHI also hosted regional trainings around the state attended by approximately 500 professionals involved in the investigation of children’s deaths. Annual regional meetings of local CDR team coordinators are held throughout the state. MPHI staff attend local CDR meetings to provide technical assistance and encourage prevention efforts. Program support materials produced include resource guides for effective reviews, protocol manuals, investigative protocols, formatted local and state mortality data, prevention resources and a program website. Staff help teams with case identification, research on causes of death, county and cause-specific data analysis, and other types of technical assistance and support as needed.
The Michigan CDR program has established working relationships with numerous diverse organizations throughout the state to promote child health and safety. The program also maintains a productive working relationship with DHS that has led to the implementation of innovative strategies to better protect children and prevent deaths. MPHI staff also manage the Fetal Infant Mortality Review Program (FIMR), funded by the Michigan Department of Community Health (MDCH). In 2009 and 2010, FIMR conducted intensive reviews of infant deaths in 14 communities. Michigan’s collaboration of CDR and FIMR is recognized as a national model.
*1,497 children died in Michigan in 2009. An official total for 2010 child deaths was not available at the time that this report was prepared; the provisional total for 2010 per the state vital statistics office was 1,306 child deaths.

5
CHILD DEATH REVIEW DATA OVERVIEWManner, Age and Race
Two types of death determination are reported on death certificates: cause and manner. Cause refers to the actual disease, injury or complications that directly resulted in the death. Manner refers to the circumstances of the death. There are five possible manners: natural, accident, suicide, homicide or undetermined. Within each of the five manners of death, there can be multiple causes of death. For example, natural deaths include causes such as cancer, birth defects and prematurity. Homicides include causes such as blunt force trauma and multiple gunshot wounds.
Of the total child deaths in the state for 2009 (cause and manner data for 2010 was not available from the Vital Statistics Office when this report was prepared), 70 percent were natural deaths, while 18 percent were accidental deaths, including, but not limited to deaths from fires, drownings, car crashes and suffocations. These two largest categories of manner are nearly identical in percentage to those from the previous two years.*
SCOPE OF THE DATA
The information presented in this report is based on data provided by the local county CDR teams. The teams complete a standardized data reporting tool developed by the National Center for the Review and Prevention of Child Deaths and submit the information to the CDR program office at MPHI. This reporting tool was developed with input from many states through their CDR programs. This comprehensive document can be viewed on the Michigan CDR website: www.keepingkidsalive.org.
It is important to note that not all child deaths in the state are reviewed. Local teams select cases to review, based on the number of deaths that occur, the resources available in the county and the team’s ability to access case information. Larger counties typically must limit their reviews to cases that fall under the jurisdiction of the county medical examiner, which are primarily non-natural deaths. Non-natural deaths are generally regarded as more preventable, and information concerning these types of deaths may be more readily available to the local teams.
The CDR data presented in this report does not account for every child death in the state, but through examination of the case information on deaths that were reviewed, the resulting data assists in the identification of emerging issues, problematic trends and key risk factors that can be used to prevent future deaths. For specific data requests, or for more information not presented in this report, contact MPHI at [email protected].
Please note: When referring to “deaths reviewed,” data was derived from the local team reviews. When referring to “total deaths,” data was derived from official mortality statistics for the state, which are based on death certificates.
* Source: Michigan Department of Community Health, Division for Vital Records and Health Statistics

6
Local teams reviewed 1,283 deaths in 2009 and 2010. The largest portions were those classified as accidental deaths and natural deaths (35 percent and 34 percent, respectively). The difference in percentages between total deaths and reviewed deaths is due to the fact that the most populous counties in Michigan reviewed very few of their natural deaths, while they reviewed most, if not all, of their accidental deaths.
Percentage of Child Deaths Reviewed in 2009-2010 by Manner
HOMICIDE11%
NATURAL34%
ACCIDENT35%
UNDETERMINED12%
SUICIDE7.4%
10–14 YEARS10%
UNDER 142%
1–4 YEARS13%
5–9 YEARS6.9%
UNKNOWN.5%
15–18 YEARS28%
Each year, the deaths of infants (children under age one) account for approximately half of all child deaths ages 0-18, both in Michigan and nationwide. In 2009 and 2010, deaths of children under age 1 accounted for 42 percent of all cases reviewed in Michigan.
Deaths of children ages 15-18 were the next most frequently reviewed, accounting for 27 percent of all deaths reviewed in 2009-2010. Compared with other age groups, a higher percentage of deaths in the 15-18 age range were attributed to accidents, homicides and suicides, and were therefore more likely to be reviewed.
Percentage of Child Deaths Reviewed in 2009-2010 by Age

The largest percentage of infant deaths reviewed was classified as natural. Approximately 70 percent of natural infant deaths reviewed in 2009-2010 were due to birth-related conditions: prematurity (birth at less than 37 weeks gestation) at 36 percent; and congenital anomalies (birth defects) and other perinatal conditions at 34 percent. The scope of infant mortality in Michigan is addressed in greater detail in the section of this report entitled Fetal Infant Mortality Review (FIMR) in Michigan.
Of all age groups, infants made up the largest percentage of deaths ruled undetermined by medical examiners. This was largely due to the recent shift away from use of the term “Sudden Infant Death Syndrome” (SIDS) when an infant is found unresponsive in a sleep environment. Consistent with the national trend, medical examiners in Michigan are more frequently referring to these as “Sudden Unexpected Infant Deaths” (SUIDs) with the manner of death classified as undetermined, if there is not enough evidence to classify the death as an accidental suffocation.
Percentage of Deaths to Infants < 1 Reviewed in 2009-2010 by Manner
Most infant deaths classified as accidental by medical examiners were due to suffocation in a sleep environment. Of all accidental infant deaths reviewed in 2009-2010, 83 percent (120 deaths) were due to sleep-related suffocation. This type of death is addressed later in this report.
7
UNDETERMINED21% NATURAL
49%
ACCIDENT27%
HOMICIDE2.8%

8
As children get older, the incidence of death due to external causes (accidents, homicides and suicides) increases.
Percentage of Deaths to Children Ages 1-4 Reviewed in 2009-2010 by Manner
Percentage of Deaths to Children Ages 5-9 Reviewed in 2009-2010 by Manner
HOMICIDE14%
NATURAL34%
ACCIDENT35%
UNDETERMINED17%
HOMICIDE13%
NATURAL40%
ACCIDENT43%
UNDETERMINED3.6%

9
Percentage of Deaths to Children Ages 10-14 Reviewed in 2009-2010 by Manner
Percentage of Deaths to Children Ages 15-18 Reviewed in 2009-2010 by Manner
HOMICIDE8.4%
NATURAL34%
ACCIDENT41%
UNDETERMINED3.1%
SUICIDE14%
HOMICIDE22%
NATURAL13%
ACCIDENT42%
UNDETERMINED2%
SUICIDE21%

10
In 2009, blacks made up about 15 percent of the population in Michigan, but accounted for 36 percent of the total child deaths, and 32 percent of the child deaths reviewed in that same year. This overrepresentation has remained consistent throughout the 14 years that the CDR program has operated in Michigan.
Percentage of Child Deaths Reviewed in 2009 & 2010 by Race
100%
90%
80%
70%
60%
50%
40%
30%
20%
10%
0% White Black Pacific Island Asian American Indian Multi-racial
PER
CEN
T
RACE
2009
2010

11
Preventability
Local teams define a child’s death as preventable “if the community or an individual could reasonably have changed the circumstances that led to the death”* and each team decides if cases meet this criterion. Using this standard, nearly all accidents and homicides were determined by the local teams to have been preventable. Consistent with review findings in previous years, the teams determined that more than half of all deaths reviewed in 2009-2010 were preventable (61 percent).
The graph below shows that a significant percentage of deaths classified as undetermined were preventable. Most of these were sleep-related infant deaths. Local teams considered specific risk factors such as unsafe sleep environments when making preventability determinations.
* National Center for the Review and Prevention of Child Deaths Case Report Data Dictionary, January 2008.
Percentage of Preventable Child Deaths Reviewed in 2009 & 2010 by Manner
100%
90%
80%
70%
60%
50%
40%
30%
20%
10%
0% Natural Accident Suicide Homicide Undetermined Total
PER
CEN
T
MANNER
2009
2010

12
Consistent with prior years, in 2009-2010, local review teams considered deaths in the 15-18 age range as more preventable than deaths of younger children. Teams found that nearly half of the deaths in children ages 0-14 were preventable. This increased to over three-quarters in the 15-18 age range. This was due to the fact that the majority of older teen deaths were due to accidents, homicides and suicides, which were viewed by local teams as more preventable than natural deaths.
The deaths considered least preventable by local teams were those that occurred within the perinatal period - the first 28 days of life. The majority of these deaths involved infants born prematurely and/or with congenital anomalies, and made up a large portion of all deaths under age 1.
Percentage of Preventable Child Deaths Reviewed in 2009 & 2010 by Age
100%
90%
80%
70%
60%
50%
40%
30%
20%
10%
0% Under Age 1 Ages 1–4 Ages 5–9 Ages 10–14 Ages 15–18 Total
PER
CEN
T
AGE
2009
2010

1313
Sleep-Related Infant Deaths
During the past several decades, the diagnosis of Sudden Infant Death Syndrome (SIDS) was often made when an infant died suddenly and unexpectedly in his or her sleep, and no medical cause for the death could be identified. In the past 10 years, there have been statewide and national efforts to improve the quality of death scene investigations in these types of cases, including the use of dolls to re-enact the infant’s exact body position when found. As a result, better information is now available on the circumstances surrounding these deaths, including details of the infant’s sleep environment.
The use of the term “SIDS” has decreased dramatically in Michigan. Due to improved investigations, medical examiners are determining more sleep-related infant deaths to be caused by positional asphyxia (suffocation). If medical examiners do not believe that there is enough evidence in the case to make a suffocation determination, they are more often using the term “Sudden Unexpected Infant Death” (SUID), rather than “SIDS.”
The graphs in this section include deaths designated by medical examiners as: SIDS, positional asphyxia, and undetermined/SUID. Because of this variety of terminology, and the historical prominence of the term “SIDS,” which many believed to be a mysterious and unpreventable type of infant death, the public may be confused about what really causes these deaths and the importance of following infant safe sleep guidelines in order to prevent them.
In locations where the most thorough and vigorous scene investigations and caregiver interviews are conducted, the number of deaths to infants who were known to have been on their backs, alone and in a crib free of suffocation hazards drops to nearly zero. There are many ways that babies’ airways can become blocked during sleep: by suffocation hazards such as pillows, thick blankets, stuffed toys and bumper pads; by being face down on soft bedding; by couch cushions and other inappropriate sleep surfaces; by becoming wedged between an adult bed mattress and the wall or headboard; and in many cases by an adult or other child’s body if they are asleep on the same surface with the infant. The American Academy of Pediatrics has developed a list of infant safe sleep guidelines to prevent these tragic events.
If all of the sleep-related infant deaths could be prevented in Michigan, the state’s infant mortality rate — 7.5 per 1,000 live births in 2009, well above the national rate of 6.3 — would drop to 6.6. The root causes of prematurity, low birth weight and congenital anomalies are difficult to pinpoint and affect. Preventing sleep-related infant death is relatively simple. A safe sleep environment for every baby in Michigan would bring us closer to the goal identified by Governor Snyder in his MiDashboard initiative and of those involved in public health, health care and other human service fields, significantly reducing the infant mortality rate in this state.
Although sleep-related infant deaths can and do occur in all types of families, there are groups at elevated risk. Blacks, American Indians and low-income families have experienced sleep-related infant deaths at much higher rates than other groups.
The percentages in the following graphs are based on 267 deaths reviewed in 2009 and 2010 where the local team indicated that the child’s sleep environment was a factor in the death. Since 1996, local teams have reviewed almost 1,800 sleep-related infant deaths.
SELECTED CAUSES OF DEATH AND RECOMMENDATIONS FOR POLICYMAKERS

14
The American Academy of Pediatrics (AAP) has defined a safe infant sleep location to be a safety-approved crib, bassinet or portable crib with a firm mattress and a tight-fitting sheet. Only 26 percent of the sleep-related deaths reviewed in 2009 and 2010 occurred in an AAP safe infant sleep location. The remaining deaths occurred in locations considered unsafe for infants. In more than half (51 percent) of the deaths reviewed, the infant died after being placed to sleep on an adult bed.
According to the AAP, loose blankets, pillows, comforters and stuffed toys should not be present in an infant’s sleep environment. Of the 26 percent of sleep-related infant deaths reviewed that did occur in a safe infant sleep location, many involved suffocation hazards in the child’s immediate sleep environment. In 58 percent of these cases reviewed in 2009 and 2010, blankets were present in the crib, bassinet or playpen at the time of the death. The items shown in this graph are not mutually exclusive; in some cases, the infants had more than one of the items present at the time of death.
Percentage of Sleep-Related Deaths Reviewed in 2009 & 2010 by Incident Sleep Place
Percentage of Sleep-Related Deaths Reviewed in 2009 & 2010 where Sleep Place was Crib/Bassinet by Objects in Sleep Environment
60%
50%
40%
30%
20%
10%
0% Crib/Bassinet Adult Bed/Water Bed Chair/Couch/Floor Other
PER
CEN
T
INCIDENT SLEEPING PLACE
2009
2010
70%
60%
50%
40%
30%
20%
10%
0% Blanket Pillow Comforter Bumper Pads
PER
CEN
T
OBJECT
2009
2010

15
The AAP guidelines state that infants should always be placed to sleep on their backs. In 30 percent of the sleep-related deaths reviewed in 2009 and 2010, the infants were reportedly found unresponsive on their backs. In 16 percent of the cases, local teams did not have information about the position in which the infant was found unresponsive. This represents an 8 percent decrease in this category from the previous report.
Percentage of Sleep-Related Deaths Reviewed in 2009-2010 by Found Position
The AAP recommends that infants sleep on a surface separate from adults or other children. In 2009-2010, there were 124 sleep-related deaths reviewed in which the infant was sleeping with at least one adult at the time of death, and 32 were sleeping with at least one other child. Since these categories are not mutually exclusive, some infants may have been sleeping with both adults and other children at the time of their deaths.
Percentage of Sleep-Related Deaths Reviewed in 2009 & 2010 by Sleep Surface Sharing
UNKNOWN16%
ON STOMACH45%
ON BACK30%
ON SIDE9.4%
60%
50%
40%
30%
20%
10%
0% With Adult With Child
PER
CEN
T
2009
2010

16
Recommendations to Policy Makers to Prevent Sleep-Related Infant Deaths:
1. Adopt a “No Missed Opportunity” Infant Safe Sleep Education Campaign. All state agencies that work with children and families: Implement and maintain an infant safe sleep education campaign, including multiple strategies to inform and change the behavior of all persons who care for infants, as well as their support persons. This can be accomplished through the following actions:
suffocation, not a random and mysterious cause of death.
when designing services for high-risk families and infants.
populations with emphasis on the racial and income disparities that contribute to infant suffocation deaths.
2. Develop Enhanced Provider Outreach and Education. Michigan Department of Licensing and Regulatory Affairs and other relevant regulatory agencies: For licensing and accreditation purposes, require demonstrated core competencies in infant safe sleep for professionals who work in health care and other human service delivery fields, including:
and all other personnel who interact with new parents.
and health communication.
3. Produce Resource Materials. The Michigan Department of Community Health: Coordinate the statewide development, updating and dissemination of infant safe sleep resource materials for use by a wide variety of disciplines.
4. Enact Legislation. The Michigan Legislature: Based on HB 47 (Act 73 of 2010) in Pennsylvania, enact legislation requiring hospitals and nurse midwives to uniformly educate new parents on how to prevent sleep-related infant deaths.

17
Poisonings/Overdoses/Acute Intoxications
Poisoning occurs when a substance not meant for human consumption is ingested and causes harm; overdose is when a substance for which a safe dosage has been established (e.g., pain medications and other types of prescription drugs) is taken in excess and causes harm; and acute intoxication is when a substance for which no safe dosage has been established (e.g., cocaine and other types of illegal drugs) is ingested and causes harm.
The greatest portion of all poisonings, overdoses, and acute intoxications reviewed in 2009 and 2010 was accidental. In a small percentage of cases, the medical examiner cannot be certain whether a teen’s overdose was a result of suicide or an accident, and will classify the manner of death as undetermined.
Percentage of Reviews of Child Poisoning, Overdose, or Acute Intoxication
Deaths in 2009 & 2010 by Manner
80%
70%
60%
50%
40%
30%
20%
10%
Accident Suicide Homicide Undetermined
PER
CEN
T
MANNER
2009
2010

18
Regarding accidental poisoning or overdose deaths to children, the general public likely thinks of toddlers getting into cleaning products or medicines. Young children can and do ingest toxic substances, but the vast majority of kids who die from accidental poisoning or overdose are actually teens. These deaths often involve the abuse of one or more prescription or illegal drugs.
The number of accidental teen overdoses, especially involving prescription drugs, has increased over the past several years. Between 1999 and 2003, there were 25 such deaths in Michigan, for an average of five per year. Between 2004 and 2009, that average nearly tripled to 13.7 deaths per year, or 82 total deaths. Teen males accounted for 82 percent of the reviews of accidental overdoses or acute intoxications in 2009-2010.
Recommendations to Policy Makers to Prevent Poisonings/Overdoses/Acute Intoxications:
1. Implement Education Campaign. State Board of Education:
prescription drug abuse and the potential for overdose when teens have access to prescription medications.
coordinators.
2. Target Prevention. All local human service agencies that work with teens and their families: Collaborate with the Regional Substance Abuse Coordinating Agency and Michigan Youth Opportunities Initiative in your local area to implement evidence-based youth substance abuse prevention campaigns.
3. Implement Take-Back Programs. Michigan State Police, Michigan Sheriff’s Association and Michigan Chiefs of Police: Institute prescription drug take-back programs to reduce the availability and accessibility of unused prescription drugs by unauthorized users.*
* For more information on how to set up such a program, contact Kristen Katcherian at the DEA-Detroit Division: (313) 226-7536.
Percentage of Accidental Positioning, Overdose, or Acute Intoxication Deaths Reviewed in 2009 & 2010 by Age
80%
70%
60%
50%
40%
30%
20%
10%
0% Under Age 1 Ages 1–4 Ages 5–9 Ages 10–14 Ages 15–18
PER
CEN
T
AGE
2009
2010

19
Motor Vehicle Deaths
New teen drivers are at very high risk for causing motor vehicle crashes. According to the National Highway Traffic Safety Administration, teenagers are involved in three times as many fatal crashes as drivers of all ages. This statistic is attributed in part to teens’ inexperience behind the wheel and increased likelihood of risk-taking behavior. These risks increase with each additional teen passenger in the vehicle.
Local teams reviewed 175 child deaths involving motor vehicles in 2009 and 2010. Ninety-seven of these deaths were to teens ages 15-18, more than all the other ages combined (78). Fifty-seven percent of all motor vehicle deaths reviewed during the report period involved male victims.
Percentage of Motor Vehicle Deaths Reviewed in 2009 & 2010 by Age
70%
60%
50%
40%
30%
20%
10%
0% Under Age 1 Ages 1–4 Ages 5–9 Ages 10–14 Ages 15–18
PER
CEN
T
AGE
2009
2010
20
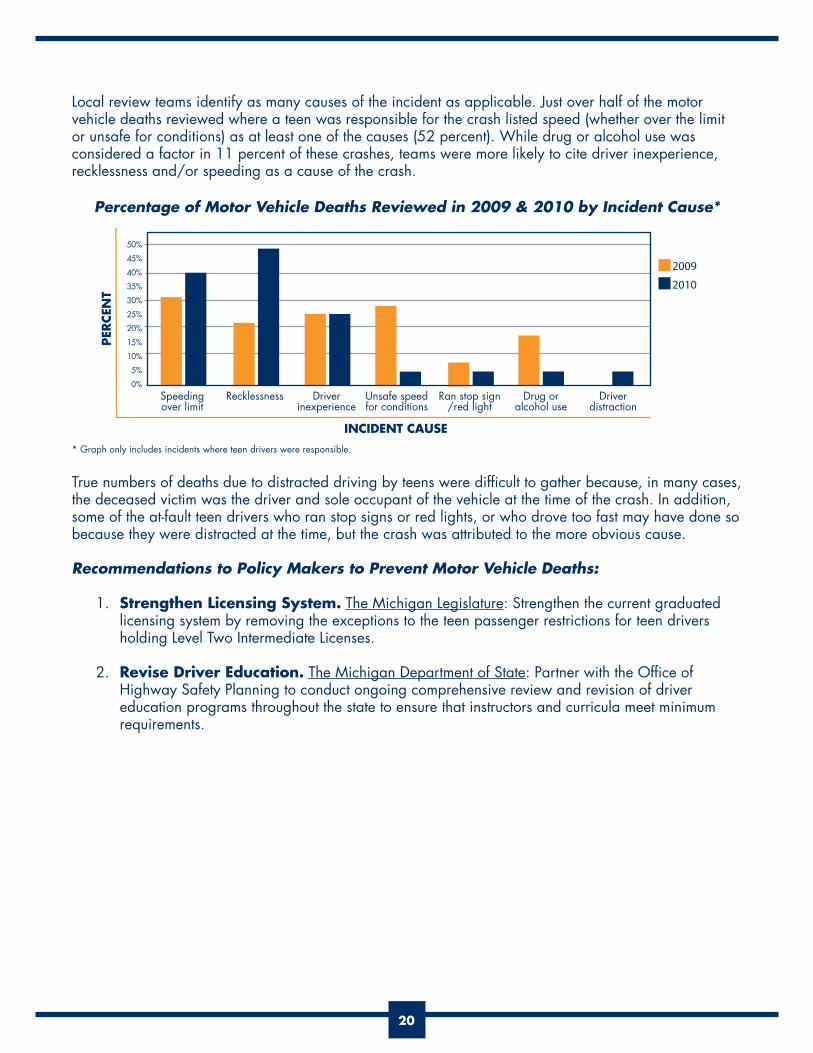
Local review teams identify as many causes of the incident as applicable. Just over half of the motor vehicle deaths reviewed where a teen was responsible for the crash listed speed (whether over the limit or unsafe for conditions) as at least one of the causes (52 percent). While drug or alcohol use was considered a factor in 11 percent of these crashes, teams were more likely to cite driver inexperience, recklessness and/or speeding as a cause of the crash.
* Graph only includes incidents where teen drivers were responsible.
True numbers of deaths due to distracted driving by teens were difficult to gather because, in many cases, the deceased victim was the driver and sole occupant of the vehicle at the time of the crash. In addition, some of the at-fault teen drivers who ran stop signs or red lights, or who drove too fast may have done so because they were distracted at the time, but the crash was attributed to the more obvious cause.
Recommendations to Policy Makers to Prevent Motor Vehicle Deaths:
1. Strengthen Licensing System. The Michigan Legislature: Strengthen the current graduated licensing system by removing the exceptions to the teen passenger restrictions for teen drivers holding Level Two Intermediate Licenses.
2. Revise Driver Education. The Michigan Department of State: Partner with the Office of Highway Safety Planning to conduct ongoing comprehensive review and revision of driver education programs throughout the state to ensure that instructors and curricula meet minimum requirements.
50%
45%
40%
35%
30%
25%
20%
15%
10%
5%
0% Speeding Recklessness Driver Unsafe speed Ran stop sign Drug or Driver over limit inexperience for conditions /red light alcohol use distraction
PER
CEN
T
INCIDENT CAUSE
2009
2010
Percentage of Motor Vehicle Deaths Reviewed in 2009 & 2010 by Incident Cause*

21
Child Abuse and Neglect Deaths
Identification of child abuse and neglect fatalities presents unique challenges. A study published in Pediatrics (2002) that reviewed nine years of children’s death certificates estimated that about half of child abuse and neglect deaths were coded inconsistently on death certificates. The Centers for Disease Control and Prevention (CDC) has funded state-level surveillance projects which concluded that local review teams are the most accurate way to identify deaths due to child abuse and neglect.*
The percentages of deaths reported in the graphs in this section are based on 38 abuse-related and 89 neglect-related fatalities reviewed in 2009 and 2010. When local teams review a child’s death, they are asked to indicate if they believe that someone caused or contributed to the child’s death by any action or inaction on their part. These numbers represent those cases wherein the teams indicated that abuse or neglect either caused or contributed to the child’s death. As such, they will not be reflective of official counts of abuse or neglect fatalities reported by other entities, such as DHS or MDCH’s Division for Vital Records and Health Statistics.
Infants under age 1 and children ages 1-4 continue to be at an increased risk of abuse fatality over all other age groups, which is consistent with national trends. For 2009-2010 reviews, the percentage of abuse deaths increased for both infants and children ages 1-4 over the previous two years, while the percentage of the three other age categories decreased; there were zero such deaths for ages 10-14 in those two years of reviews.
Percentage of Child Abuse Deaths Reviewed in 2009-2010 by Age
*McCurdy J, Wetterhall S, Gibbs D, & Farris T. Child Maltreatment Surveillance: Recommended Model System CDC, May 22, 2006.
UNDER 1 YEAR42%
1–4 YEARS45%
15–18 YEARS5.3%
5–9 YEARS7.9%
22
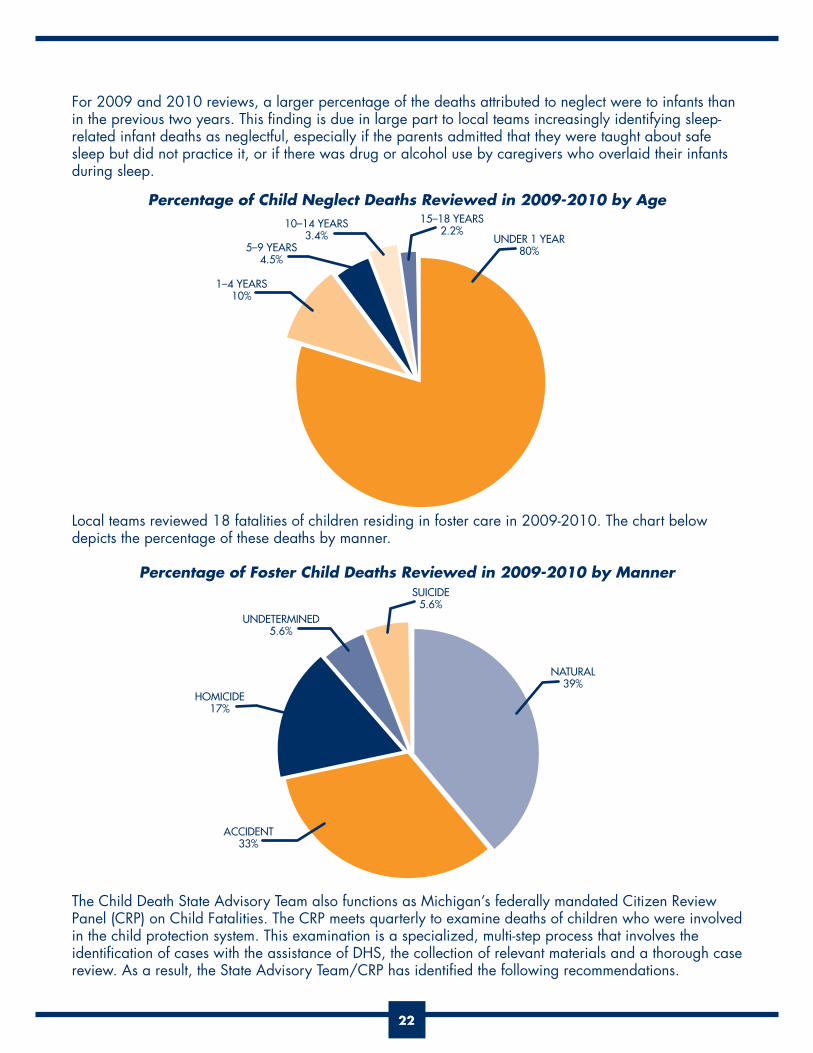
For 2009 and 2010 reviews, a larger percentage of the deaths attributed to neglect were to infants than in the previous two years. This finding is due in large part to local teams increasingly identifying sleep-related infant deaths as neglectful, especially if the parents admitted that they were taught about safe sleep but did not practice it, or if there was drug or alcohol use by caregivers who overlaid their infants during sleep.
Percentage of Child Neglect Deaths Reviewed in 2009-2010 by Age
Local teams reviewed 18 fatalities of children residing in foster care in 2009-2010. The chart below depicts the percentage of these deaths by manner.
Percentage of Foster Child Deaths Reviewed in 2009-2010 by Manner
The Child Death State Advisory Team also functions as Michigan’s federally mandated Citizen Review Panel (CRP) on Child Fatalities. The CRP meets quarterly to examine deaths of children who were involved in the child protection system. This examination is a specialized, multi-step process that involves the identification of cases with the assistance of DHS, the collection of relevant materials and a thorough case review. As a result, the State Advisory Team/CRP has identified the following recommendations.
10–14 YEARS3.4%
UNDETERMINED5.6%
UNDER 1 YEAR80%
NATURAL39%
1–4 YEARS10%
ACCIDENT33%
15–18 YEARS2.2%
SUICIDE5.6%
5–9 YEARS4.5%
HOMICIDE17%
23
Recommendations to Policy Makers to Prevent Child Abuse and Neglect Deaths:
1. Enhance Resource Awareness. Michigan Departments of Human Services, Community Health and Education: Ensure that human service professionals working with high-risk families are knowledgeable about, and make appropriate referrals to, state and community resources, such as the Maternal Infant Health Program and other primary and secondary prevention services.
2. Train School Professionals. Michigan Department of Education: Encourage school districts to
partner with their local DHS office to offer annual mandated reporter training to teachers and other school professionals.
3. Train Medical Professionals and Other Direct Service Providers. Michigan Bureau of Health Professions: As part of licensing standards, require training through DHS for medical professionals on failure to thrive and medical neglect, as well as on their duty as mandated reporters to file a complaint with Children’s Protective Services (CPS) when child abuse or neglect is suspected.
All supervisors of paraprofessionals and community health workers who provide direct services to families: Provide training for workers on identifying children who are undernourished, or have unmet medical needs, as well as on the responsibility for filing complaints with CPS when any type of neglect or abuse is suspected.
4. Continue and Enhance Training. Michigan Department of Human Services: Provide annual updated training to CPS and foster care workers on the identification and assessment of mental health and substance abuse service needs of families involved in the child protection system. In addition to initial training, it is recommended that child welfare workers should be offered advanced mental health and substance abuse training annually.
24
FETAL INFANT MORTALITY REVIEW (FIMR) IN MICHIGAN This section was authored by the Michigan Department of Community Health.
The Fetal Infant Mortality Review program gives communities an opportunity to do an in-depth review of the deaths of infants under the age of 1, and select cases of stillbirth. The overall goal of FIMR is to enhance the health and well-being of women, infants and families by improving the community resources and service delivery systems available to them. The FIMR process brings together key members of the community to review confidential, de-identified information from individual cases of fetal and infant death in order to identify factors associated with those deaths and develop recommendations for change, assist in the implementation of change and determine community effects.
There are many similarities between the FIMR and the CDR processes. Both operate under the guiding principle that local, multidisciplinary review aids in better understanding of how to prevent future deaths and improve the lives of babies, children and families. Both processes are concerned with improving the accuracy of systems for determining the cause and manner of a child’s death and generating data and information that will help local and state efforts to improve systems and prevent future infant and child mortality. FIMR and CDR have in common the objective of identifying gaps between the availability of services in the community and the needs of children and their families. Outcomes from both processes are related to increased communication and understanding among all agencies represented in the review process.
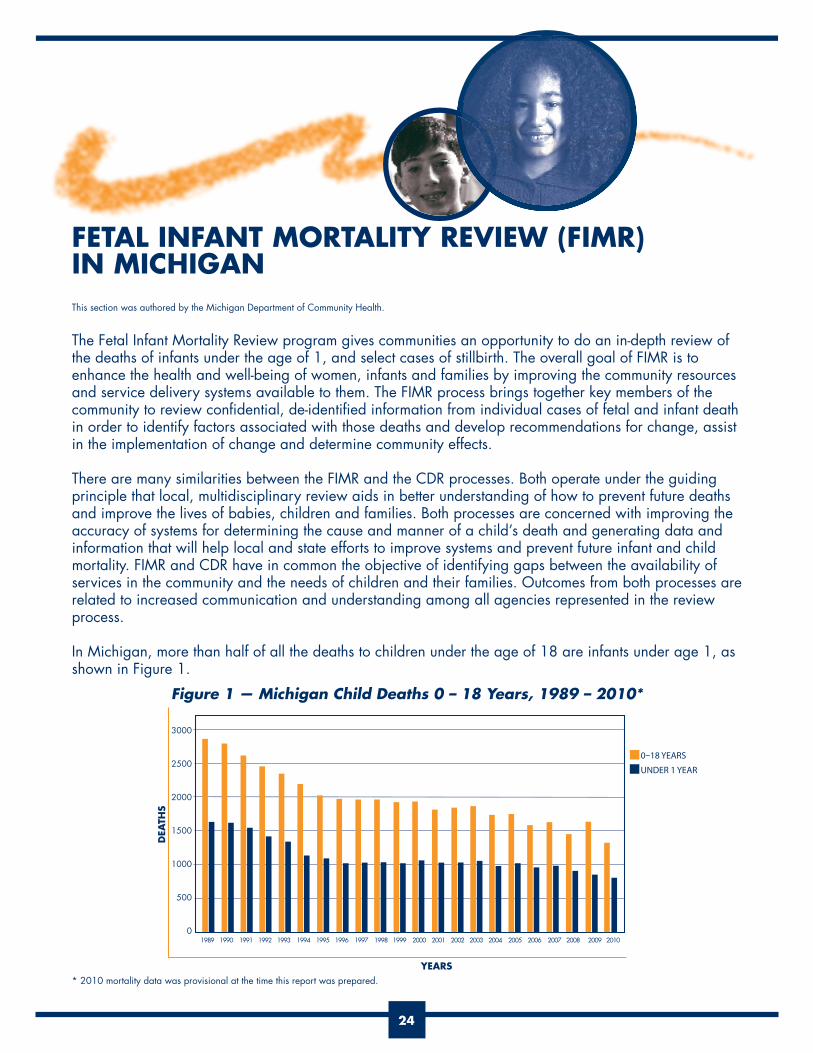
In Michigan, more than half of all the deaths to children under the age of 18 are infants under age 1, as shown in Figure 1.
Figure 1 — Michigan Child Deaths 0 – 18 Years, 1989 – 2010*
3000
2500
2000
1500
1000
500
0 1989 1990 1991 1992 1993 1994 1995 1996 1997 1998 1999 2000 2001 2002 2003 2004 2005 2006 2007 2008 2009 2010
DEA
THS
YEARS
0–18 YEARS
UNDER 1 YEAR
* 2010 mortality data was provisional at the time this report was prepared.

25
The Persistent Problem of Infant Mortality in Michigan
Infant mortality (IM) continues to be higher for Michigan than for the United States as a whole. In 2009 in Michigan, there were 881 infant deaths resulting in an IM rate of 7.5 per 1,000 live births compared to the U.S. infant mortality rate of 6.3. In 2010, provisional numbers suggest that 771 infants died before reaching their first birthday for a provisional infant mortality rate of 6.7 per 1,000 live births, the first significant decrease the state has experienced in more than a decade. Michigan currently ranks 37th among states for overall infant mortality (three-year average, 2005 – 2007, National Center for Health Statistics, CDC). Figure 2 illustrates Michigan’s persistently higher infant mortality rate, well above the U.S. rate.
Figure 2 — Michigan Infant Death Rate Compared to the U.S.*
One of Michigan’s most significant challenges is the persistent disparities between the black infant mortality rate and the rate for white infants. In 2009 the white infant mortality rate was 5.4 per 1,000 live births, while the black rate was 15.5 per 1,000 live births. The infant mortality rate for infants of other races was 6.6 per 1,000 live births. Disparities also exist between Native American infants and infants of Hispanic and Arab ethnicities in Michigan, as shown in Figure 3.
Figure 3 — Michigan Infant Mortality Trend Rates by Race and Ancestry Three-year Averages, 1998 – 2010*
20
18
16
14
12
10
8
6
4
2
098-00 99-01 00-02 01-03 02-04 03-05 04-06 05-07 06-08 07-09 08-10
BLACK
HISPANIC
NATIVE AMERICAN
ARAB
WHITE
60%
25
20
15
10
5
0
MICHIGAN
US
1970 1980 1985 1990 1995 1996 1997 1998 1999 2000 2001 2002 2003 2004 2005 2006 2007 2008 2009 2010
* 2010 mortality data was provisional at the time this report was prepared.
26
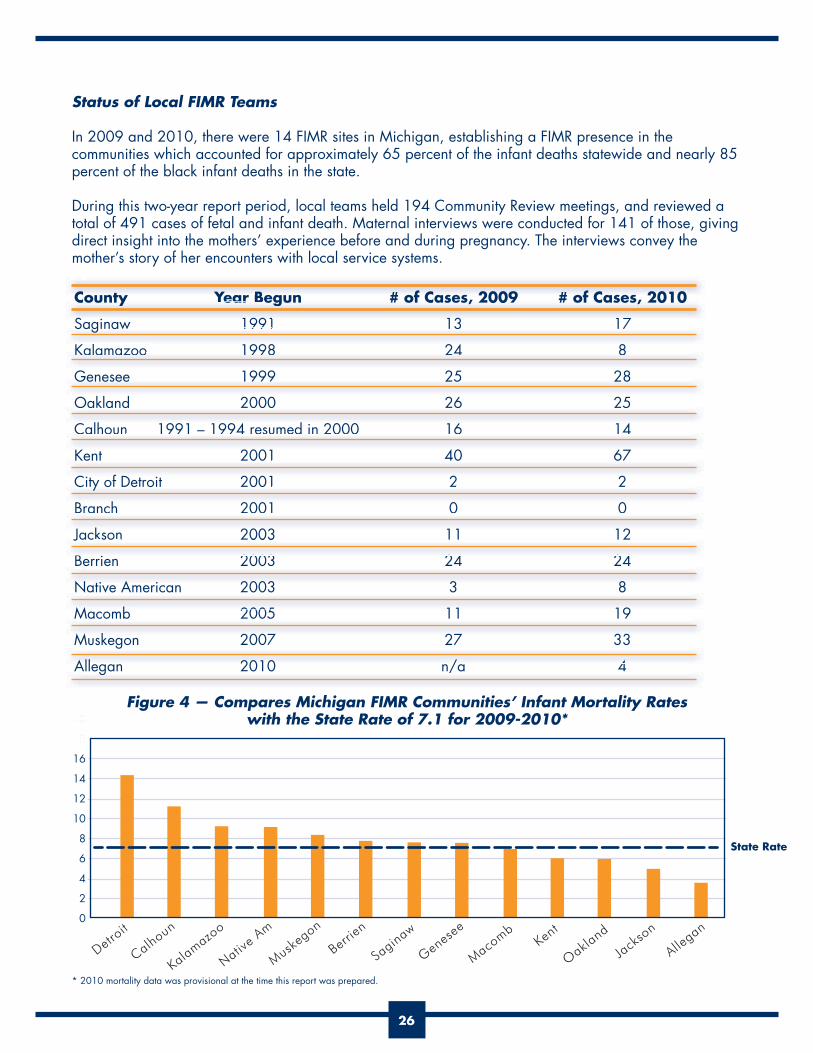
Status of Local FIMR Teams
In 2009 and 2010, there were 14 FIMR sites in Michigan, establishing a FIMR presence in the communities which accounted for approximately 65 percent of the infant deaths statewide and nearly 85 percent of the black infant deaths in the state.
During this two-year report period, local teams held 194 Community Review meetings, and reviewed a total of 491 cases of fetal and infant death. Maternal interviews were conducted for 141 of those, giving direct insight into the mothers’ experience before and during pregnancy. The interviews convey the mother’s story of her encounters with local service systems.
County Year Begun # of Cases, 2009 # of Cases, 2010
Saginaw 1991 13 17
Kalamazoo 1998 24 8
Genesee 1999 25 28
Oakland 2000 26 25
Calhoun 1991 – 1994 resumed in 2000 16 14
Kent 2001 40 67
City of Detroit 2001 2 2
Branch 2001 0 0
Jackson 2003 11 12
Berrien 2003 24 24
Native American 2003 3 8
Macomb 2005 11 19
Muskegon 2007 27 33
Allegan 2010 n/a 4
Figure 4 — Compares Michigan FIMR Communities’ Infant Mortality Rates with the State Rate of 7.1 for 2009-2010*
County YearYY Begun # of Cases, 2009 # of Cases, 2010
S i 1991 13 17Saginaw 1991 13 17
l 4Kalamazoo 1998 24 8
Genesee 1999 25 28
N ti A i 2003 3 8
Oakland 2000 26 25
lh 4 d 4Calhoun 1991 1994 resumed in 2000 16 14
Kent 2001 40 67
C f D 2001 2 2City of Detroit 2001 2 2
B h 2001 0 0
g /
Branch 2001 0 0
J k 2003 11 12Jac so 003
B 2003 24 24
g
All 2010 / 4
M b 2005 11 19
M k 2007 27 33
Co nt YearY Beg n # fof Cases 2009 # fof Cases 2010
20
18
16
14
12
10
8
6
4
2
0
Detroit
Calhoun
Kalamazoo
Native A
m
Muskegon
Berrien
Saginaw
Genes
ee
Macomb
Kent
Oakland
Jack
son
Allegan
State Rate
* 2010 mortality data was provisional at the time this report was prepared.

27
Examples of Local Initiatives Resulting from FIMRs
Saginaw Responding to the high rate of unplanned pregnancies in the FIMR data, the Saginaw Department of Public Health developed a Reproductive Health Plan (RHP) to be completed by every Healthy Start mother to assist in reproductive planning. Healthy Start is a federally funded program whose goal is to identify and develop community-based systems approaches to reducing infant mortality. Currently, there are 105 federally funded Healthy Start projects in 38 states, the District of Columbia, and Puerto Rico. Direct services include outreach and recruitment, case management, screening and treatment of depression, education, interconception care and fatherhood/male involvement.
The Saginaw RHP addresses pregnancy timing, birth spacing, healthy lifestyles and habits, as well as immunizations.
Genesee Genesee’s FIMR identified that high numbers of women who experienced an infant death were using drugs, alcohol and tobacco. High correlation exists between these behaviors, preterm births and low birth weight. Multiple interventions implemented by the community included:
positive. The PRIDE (Programs to Reduce Infant Deaths Effectively) Medical Services team held a morbidity and mortality continuing education event for more than 30 attendees on the topic of incompetent cervix. It is one of the major contributors to preterm delivery and early infant death. Awareness of the need for education came out of FIMR Case Review Team meetings, where it was recognized that there is no standard for defining, identifying or treating incompetent cervix.
Oakland The Oakland County FIMR team found that there was a lack of culturally competent bereavement services available to families in a high number of the cases reviewed. The Oakland County Health Division (OCHD) increased the number of nurses able to provide bereavement home visits to families following an infant or fetal loss, and sponsored a training for public health nurses, Communicating with Grieving Parents, in collaboration with Tomorrow’s Child/Michigan SIDS.
Supported by FIMR findings, the OCHD applied for and received two grants: a 0-3 prevention grant, which supports the Nurse Family Partnership program, and a Nurturing Parenting Program, which targets child abuse prevention in Pontiac.
CalhounWorking with the FIMR Community Action Team in Calhoun County, the Maternal Infant Health Commission and FIMR personnel improved the screening and treatment protocols for asymptomatic bacteriuria among prenatal care providers. (Treatment for asymptomatic bacteriuria reduces the incidence of symptomatic urinary tract infections, low birth weight babies, and preterm delivery.)

28
Kent FIMR findings in Kent County helped their Health Department to recognize the need for an ongoing Interconception Care (IC) program. The Interconception Care program enrolls at-risk women who have had a previous poor birth outcome such as previous premature or low birth weight infant, and surrounds them with intense, home-based services aimed at identifying and addressing medical, psychosocial and behavioral risks. In fiscal year 2010, the Health Department received a second year of funding from the Legacy Grant (part of Genesee County’s REACH awards). This funding will help support more enrollments to the IC program and will include planning a Racism Awareness/Cultural Competence training for IC program professionals and developing tool-kits for professionals and clients.
DetroitDetroit’s FIMR reviews have illustrated the lack of Medical Home for women and children in Wayne County. A Patient-Centered Medical Home is a team-based model of care led by a personal physician who provides continuous and coordinated care throughout a patient’s lifetime to maximize health outcomes.
On August 17, 2010, the Great Start Collaborative Wayne County (FIMR Community Action Team) hosted a Wayne Children’s Healthcare Access Program (WCHAP) at the University of Michigan Dearborn Fairlane Campus. One of the sessions focused on the Well Baby/Well Child/Early Childhood Continuum. Lessons and recommendations from FIMR reviews were shared at that session.
JacksonThe House to House Program was developed for women of childbearing age and was implemented in high-risk areas of Jackson County. A Centers for Disease Control and Prevention grant was obtained to enhance the existing program and add “Parent Teen Connectedness” to the curriculum. Parent Teen Connectedness programs aim to provide adolescents with knowledge and skills to make healthy decisions and develop their natural strengths, teaching them that a hopeful future can result from good choices. Connectedness or “bonding” (i.e., stronger relationships between adolescents and their parents, peers, schools and community groups) has been identified as one of the key elements in reducing risky sexual behavior in youths. Jackson County’s teen pregnancy rate among 15 – 17 year olds is one of the highest in the state, (tied with Detroit) and their FIMR findings supported the need.
BerrienResponding to the high number of sleep-related infant deaths reviewed in FIMR, a community campaign entitled Baby’s Own Bed (BOB) was launched. Flip charts were produced for use in community presentations and a safe sleep power point was created. The BOB program continues to be a priority among Berrien County’s initiatives. In response to the FIMR findings, letters to the editor were provided to local newspapers to promote September as Safe Sleep Month in Michigan. Information was included about safe sleep and the BOB program, as well as details on how the public can contribute money toward the purchase of a port-a-crib and safe sleep package. Past and current funders of the BOB program include Good Fellows, Heart of Cook Foundation, and American Electric Power.
Intertribal Council (Native American FIMR)The Intertribal Council continues to use FIMR for one of the evaluation components of their federal Healthy Start grant. In its project, FIMR aids in the comprehensive health data collection for minority populations to accurately assess and monitor health status and health disparities.

29
MacombFIMR personnel partnered with the faith-based community in Macomb County and highlighted Infant Mortality findings from their reviews at the Metro Youth Day Prayer Breakfast, attended by community leaders as well as Michigan’s then Governor, Jennifer Granholm.
MuskegonDriven by FIMR findings, a Sexually Transmitted Diseases workgroup has formed in Muskegon and is working with emergency department staff to include a social work consult for every pregnant patient who presents for testing. Services include referrals to the local health department for additional assistance with family planning. Muskegon’s FIMR coordinator and public health nurse attended a World AIDS Day event on December 1, 2010, at a local community college. A display was created, promoting HPV vaccination and chlamydia and gonorrhea testing. More than 40 students were tested for HIV and 10 for chlamydia and gonorrhea.
The State Support program for FIMR provides technical assistance to local communities and coordination of team activities, including: team organization; hands-on skills for abstracting, interviewing and conducting team meetings; moving recommendations to action; resources on best practices in prevention; and links with other child health, safety and protection sources. Program support materials include standard Case Abstraction forms and Access database, state-developed Maternal Home Interview guide, Standard Issues Summary form with standard state-developed definitions, and a program coordinator’s manual. For more information about Michigan’s FIMR program, contact Rosemary Fournier at [email protected].

30
APPENDIX ATotal Numbers of Resident Child Deaths vs Number of Reviews by County, 2009 and 2010
COUNTY TOTAL DEATHS* 2009 REVIEWS** 2009 *** REVIEWS** 2010Alcona 2 0 0Alger 2 2 0Allegan 8 12 16Alpena 4 1 2Antrim 1 0 0Arenac 2 1 3Baraga 0 0 0Barry 8 13 9Bay 16 16 10Benzie 0 0 0Berrien 27 32 6Branch 3 0 0Calhoun 26 10 9Cass 9 3 7Charlevoix 2 0 0Cheboygan 2 0 0Chippewa 1 6 3Clare 3 3 2Clinton 9 2 8Crawford 1 0 2Delta 4 0 0Dickinson 2 0 2Eaton 13 11 12Emmet 1 0 0Genesee 82 30 26Gladwin 3 3 2Gogebic 3 1 1Grand Traverse 10 9 8Gratiot 8 4 3Hillsdale 6 0 0Houghton 2 0 0Huron 4 2 3Ingham 35 13 8Ionia 3 1 6Iosco 4 3 1Iron 2 1 2Isabella 6 5 10Jackson 18 12 10Kalamazoo 43 12 15
continued

31
COUNTY TOTAL DEATHS* 2009 REVIEWS** 2009 *** REVIEWS** 2010Kalkaska 3 2 0Kent 79 34 26Keweenaw 0 0 0Lake 2 0 0Lapeer 14 11 8Leelanau 0 0 0Lenawee 13 11 9Livingston 19 11 14Luce 0 0 0Mackinac 2 0 0Macomb 124 26 17Manistee 2 0 10Marquette 7 6 1Mason 5 0 12Mecosta 6 8 3Menominee 1 0 0Midland 12 9 3Missaukee 3 0 2Monroe 18 12 13Montcalm 7 6 6Montmorency 0 0 0Muskegon 26 3 12Newaygo 4 0 2Oakland 143 30 35Oceana 5 0 0Ogemaw 3 3 5Ontonagon 0 0 1Osceola 7 6 1Oscoda 3 0 0Otsego 7 13 4Ottawa 27 9 7Presque Isle 1 0 4Roscommon 4 0 8Saginaw 41 13 12St Clair 31 26 22St Joseph 13 16 8Sanilac 6 4 1Schoolcraft 0 0 0Shiawassee 8 5 3Tuscola 7 2 4Van Buren 8 5 10Washtenaw 42 11 13Wayne 415 167 156Wexford 4 1 7Total 1497 658 625*Source: Michigan Department of Community Health, Division for Vital Records and Health Statistics
**Note: number of reviews may exceed number of total deaths in a county for a given year if deaths occurring later in the year were reviewed the following year, or if non-residents were reviewed in the county of incident.
***2010 total number of deaths by county was not available from the Michigan Department of Community Health, Division for Vital Records and Health Statistics, at the time this report was prepared.

32
APPENDIX B
Child Fatality Bills – 2011
In 2011, a package of bills was enacted into law, amending the Michigan Child Protection Law (CPL) with the intent of increasing the oversight of cases involving children who died while under court jurisdic-tion. These changes will require the department to notify certain entities when a child under court jurisdic-tion dies. They will also increase participation by the courts in the child death review process, particularly when the child was under court jurisdiction at the time of death. Specific details prescribed by these laws are provided below:
PA 67 / HB 4385
or an open services case; When prior complaints on deceased child’s parents are received by the department; When a child death could have been the result of abuse/neglect.
PA 68 / HB 4387
Citizen Review Panel (CRP) and reporting requirements.
statewide CRP where abuse or neglect is suspected and the child was a ward at the time of death or was a ward under court jurisdiction 2(b) (within 12 months of the death).
Legislature.
PA 69 / SB 226
Registry (CFR).-
dren who died under CA/N court jurisdiction; Providing the number of children who died from abuse or neglect after a parent had one or more CPS complaints in the two years preceding the death and the category dispositions of those complaints, and providing the CPS dispositions of the child fatalities for both of these groups.
PA 70 / SB 228
include the local court when a child dies.

ACKNOWLEDGEMENTS
We wish to acknowledge the dedication of the more than 1,200 volunteers from throughout Michigan who serve our state and the children of Michigan by serving on Child Death Review Teams. It is an act of courage
to acknowledge that the death of a child is a community problem. Their willingness to step outside of their traditional professional roles, and examine all of the circumstances that lead to child deaths, and to seriously
consider ways to prevent other deaths, has made this report possible.
Many thanks to the local Child Death Review Team Coordinators for volunteering their time to organize, facilitate and report on the findings of their reviews. Because of their commitment to the child death review
process, this annual report is published.
The Michigan Department of Community Health, Office of the State Registrar, Division for Vital Records and Health Statistics has been especially helpful in providing
child mortality data and in helping us to better understand and interpret the statistics on child deaths.
The Michigan Department of Human Services provides the funding and oversight for theChild Death Review program, which is managed by contract with the
Michigan Public Health Institute.
Permission to quote or reproduce materials from this publication is granted when acknowledgement is made. Additional copies may be ordered from the Michigan Public Health Institute.
This report is also available at www.michigan.gov/dhs and www.keepingkidsalive.org.

The Michigan Department of Human ServicesGrand Tower Building235 South Grand AvenueLansing, MI 48909www.michigan.gov/dhs
Michigan Public Health InstituteCenter for Child and Family Health2455 Woodlake CircleOkemos, MI 48664(517) 324–7330www.keepingkidsalive.org
This report is written in memory of all of the children in Michigan who have died. The Michigan Child Death State Advisory Team issues this repor t with the hope that it will encourage additional effor ts, both in local communities and among our state leaders, to keep every child in Michigan safe and healthy.