michael t. madigan, john m. martinko, david a. stahl...
TRANSCRIPT

10/5/2013
1
LECTURE PRESENTATIONS
For BROCK BIOLOGY OF MICROORGANISMS, THIRTEENTH EDITION
Michael T. Madigan, John M. Martinko, David A. Stahl, David P. Clark
Lectures by
John Zamora
Middle Tennessee State University
© 2012 Pearson Education, Inc.
Cell Structure and Function in Bacteria
and Archaea
Chapter 3
I. Cell Shape and Size
• 3.1 Cell Morphology
• 3.2 Cell Size and the Significance of
Smallness
© 2012 Pearson Education, Inc. Marmara University – Enve303 Env. Eng. Microbiology – Prof. BARIŞ ÇALLI
10/5/2013
2
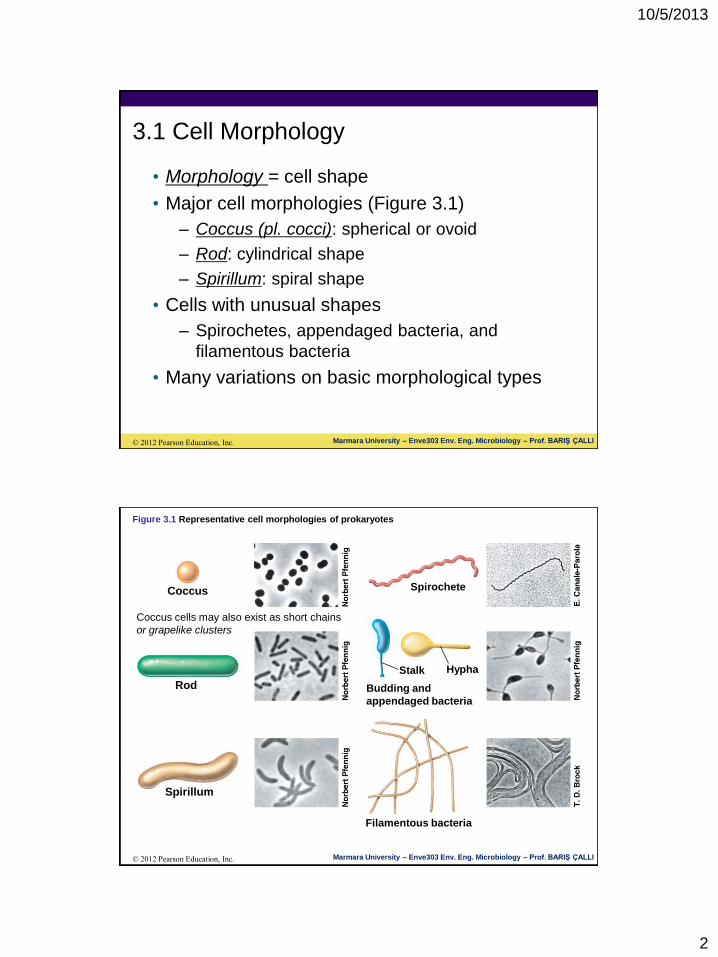
3.1 Cell Morphology
• Morphology = cell shape
• Major cell morphologies (Figure 3.1)
– Coccus (pl. cocci): spherical or ovoid
– Rod: cylindrical shape
– Spirillum: spiral shape
• Cells with unusual shapes
– Spirochetes, appendaged bacteria, and
filamentous bacteria
• Many variations on basic morphological types
© 2012 Pearson Education, Inc. Marmara University – Enve303 Env. Eng. Microbiology – Prof. BARIŞ ÇALLI
Figure 3.1 Representative cell morphologies of prokaryotes
Coccus
Rod
Spirillum
Spirochete
Stalk
Hypha
Budding and
appendaged bacteria
Filamentous bacteria
© 2012 Pearson Education, Inc. Marmara University – Enve303 Env. Eng. Microbiology – Prof. BARIŞ ÇALLI
Coccus cells may also exist as short chains
or grapelike clusters

10/5/2013
3
3.1 Cell Morphology
• Morphology typically does not predict physiology1,
ecology, phylogeny2, etc. of a prokaryotic cell
• Selective forces may be involved in setting the
morphology
– Optimization for nutrient uptake (small cells and
those with high surface-to-volume ratio)
– Swimming motility in viscous environments or
near surfaces (helical or spiral-shaped cells)
– Gliding motility (filamentous bacteria)
© 2012 Pearson Education, Inc. Marmara University – Enve303 Env. Eng. Microbiology – Prof. BARIŞ ÇALLI
1 functions and activities of living organisms and their parts
2 the evolutionary history of a group of organisms
3.2 Cell Size and the Significance of
Smallness
• Size range for prokaryotes: 0.2 µm to >700 µm in
diameter
– Most cultured rod-shaped bacteria are between
0.5 and 4.0 µm wide and <15 µm long
– Examples of very large prokaryotes
• Epulopiscium fishelsoni (Figure 3.2a)
• Thiomargarita namibiensis (Figure 3.2b)
• Size range for eukaryotic cells: 10 to >200 µm in
diameter
© 2012 Pearson Education, Inc. Marmara University – Enve303 Env. Eng. Microbiology – Prof. BARIŞ ÇALLI

10/5/2013
4
Figure 3.2 Some very large prokaryotes
© 2012 Pearson Education, Inc. Marmara University – Enve303 Env. Eng. Microbiology – Prof. BARIŞ ÇALLI
Epulopiscium fishelsoni
Thiomargarita namibiensis
3.2 Cell Size and the Significance of
Smallness
• Surface-to-Volume Ratios, Growth Rates, and
Evolution
– Advantages to being small (Figure 3.3)
• Small cells have more surface area relative to cell
volume than large cells (i.e., higher S/V)
– support greater nutrient exchange per unit cell
volume
– tend to grow faster than larger cells
© 2012 Pearson Education, Inc. Marmara University – Enve303 Env. Eng. Microbiology – Prof. BARIŞ ÇALLI

10/5/2013
5
Figure 3.3 Surface area and volume relationships in cells
r = 1 m
r = 2 m
r = 1 m
r = 2 m
Surface area (4r2) = 12.6 m2
Volume ( r3) = 4.2 m3
Surface area = 50.3 m2
Volume = 33.5 m3
3 4
Surface Volume
= 3
Surface Volume
= 1.5
© 2012 Pearson Education, Inc. Marmara University – Enve303 Env. Eng. Microbiology – Prof. BARIŞ ÇALLI
3.2 Cell Size and the Significance of
Smallness
• Lower Limits of Cell Size
– Cellular organisms <0.15 µm in diameter are
unlikely
– Open oceans tend to contain small cells (0.2–
0.4 µm in diameter)
© 2012 Pearson Education, Inc. Marmara University – Enve303 Env. Eng. Microbiology – Prof. BARIŞ ÇALLI
10/5/2013
6
II. The Cytoplasmic Membrane and
Transport
• 3.3 The Cytoplasmic Membrane
• 3.4 Functions of the Cytoplasmic Membrane
• 3.5 Transport and Transport Systems
© 2012 Pearson Education, Inc. Marmara University – Enve303 Env. Eng. Microbiology – Prof. BARIŞ ÇALLI
3.3 The Cytoplasmic Membrane in
Bacteria and Archaea
• Cytoplasmic membrane:
– Thin structure that surrounds the cell
– 6-8 nm thick
– Vital barrier that separates cytoplasm from
environment
– Highly selective permeable barrier; enables
concentration of specific metabolites and
excretion of waste products
© 2012 Pearson Education, Inc. Marmara University – Enve303 Env. Eng. Microbiology – Prof. BARIŞ ÇALLI

10/5/2013
7
• Composition of Membranes
– General structure is phospholipid bilayer (Figure 3.4)
• Contain both hydrophobic and hydrophilic components
– Can exist in many different chemical forms as a result of variation in the groups attached to the glycerol backbone
– Fatty acids point inward to form hydrophobic environment; hydrophilic portions remain exposed to external environment or the cytoplasm
3.3 The Cytoplasmic Membrane
Animation: Membrane Structure
© 2012 Pearson Education, Inc. Marmara University – Enve303 Env. Eng. Microbiology – Prof. BARIŞ ÇALLI
Fatty acids
Glycerol
Phosphate
Ethanolamine
Fatty acids
Glycerophosphates
Hydrophilic
region
region
region
Hydrophobic
Hydrophilic
Fatty acids
© 2012 Pearson Education, Inc. Marmara University – Enve303 Env. Eng. Microbiology – Prof. BARIŞ ÇALLI
General architecture
of a bilayer
membrane; the blue
balls depict glycerol
with phosphate and
(or) other hydrophilic
groups.
Figure 3.4 Phospholipid bilayer membrane
10/5/2013
8
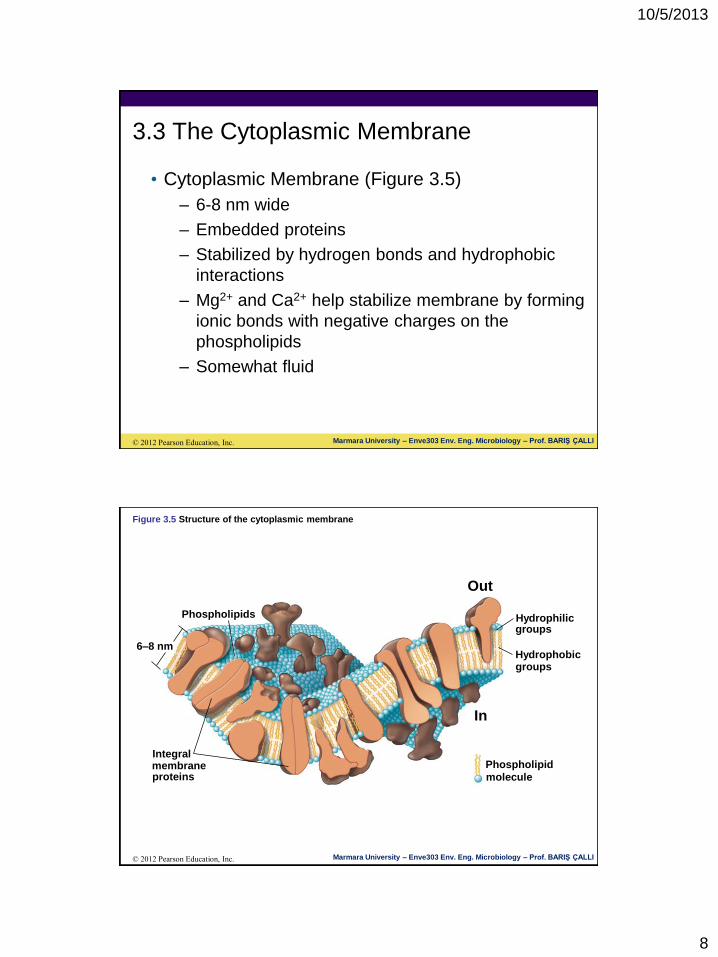
3.3 The Cytoplasmic Membrane
• Cytoplasmic Membrane (Figure 3.5)
– 6-8 nm wide
– Embedded proteins
– Stabilized by hydrogen bonds and hydrophobic
interactions
– Mg2+ and Ca2+ help stabilize membrane by forming
ionic bonds with negative charges on the
phospholipids
– Somewhat fluid
© 2012 Pearson Education, Inc. Marmara University – Enve303 Env. Eng. Microbiology – Prof. BARIŞ ÇALLI
Figure 3.5 Structure of the cytoplasmic membrane
Phospholipids
Integral
membrane
proteins
6–8 nm
Hydrophilic
groups
groups
Hydrophobic
Out
In
Phospholipid
molecule
© 2012 Pearson Education, Inc. Marmara University – Enve303 Env. Eng. Microbiology – Prof. BARIŞ ÇALLI
10/5/2013
9
3.3 The Cytoplasmic Membrane
• Membrane Proteins
– Outer surface of cytoplasmic membrane can
interact with a variety of proteins that bind
substrates or process large molecules for transport
– Inner surface of cytoplasmic membrane interacts
with proteins involved in energy-yielding reactions
and other important cellular functions
© 2012 Pearson Education, Inc. Marmara University – Enve303 Env. Eng. Microbiology – Prof. BARIŞ ÇALLI
3.3 The Cytoplasmic Membrane
• Membrane Proteins (cont’d)
– Integral membrane proteins
• Firmly embedded in the membrane
– Peripheral membrane proteins
• One portion anchored in the membrane
© 2012 Pearson Education, Inc. Marmara University – Enve303 Env. Eng. Microbiology – Prof. BARIŞ ÇALLI

10/5/2013
10
3.3 The Cytoplasmic Membrane
• Membrane-Strengthening Agents
– Sterols
• Rigid, planar lipids found in eukaryotic membranes
Strengthen and stabilize membranes
– Hopanoids
• Structurally similar to sterols
• Present in membranes of many Bacteria
© 2012 Pearson Education, Inc. Marmara University – Enve303 Env. Eng. Microbiology – Prof. BARIŞ ÇALLI
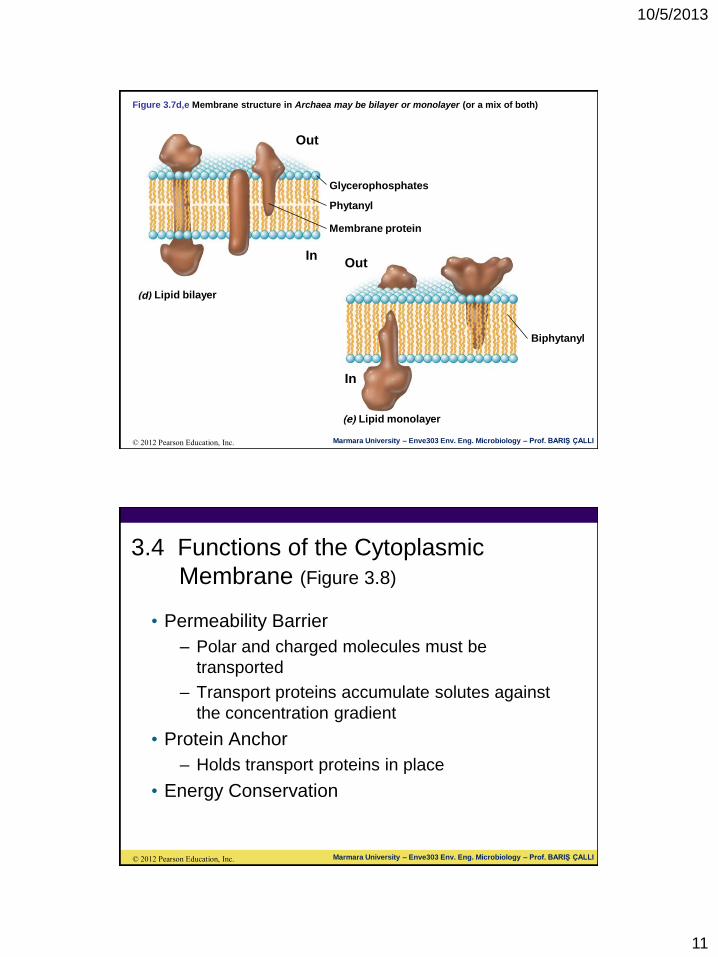
3.3 The Cytoplasmic Membrane
• Archaeal Membranes
– Ether linkages in phospholipids of Archaea
– Bacteria and Eukarya that have ester linkages in
phospholipids
– Can exist as lipid monolayers, bilayers, or mixture
(Figure 3.7d and e)
© 2012 Pearson Education, Inc. Marmara University – Enve303 Env. Eng. Microbiology – Prof. BARIŞ ÇALLI
10/5/2013
11
Figure 3.7d,e Membrane structure in Archaea may be bilayer or monolayer (or a mix of both)
Lipid bilayer
In
Out
Membrane protein
Glycerophosphates
Phytanyl
© 2012 Pearson Education, Inc. Marmara University – Enve303 Env. Eng. Microbiology – Prof. BARIŞ ÇALLI
Out
In
Lipid monolayer
Biphytanyl
3.4 Functions of the Cytoplasmic
Membrane (Figure 3.8)
• Permeability Barrier
– Polar and charged molecules must be
transported
– Transport proteins accumulate solutes against
the concentration gradient
• Protein Anchor
– Holds transport proteins in place
• Energy Conservation
© 2012 Pearson Education, Inc. Marmara University – Enve303 Env. Eng. Microbiology – Prof. BARIŞ ÇALLI

10/5/2013
12
Figure 3.8 The major functions of the cytoplasmic membrane.
Permeability barrier: Prevents leakage and functions as a gateway for transport of nutrients into, and wastes out of, the cell
Protein anchor: Site of many proteins that participate in transport, bioenergetics, and chemotaxis
Energy conservation: Site of generation and use of the proton motive force
© 2012 Pearson Education, Inc. Marmara University – Enve303 Env. Eng. Microbiology – Prof. BARIŞ ÇALLI
Although structurally weak, the cytoplasmic membrane has many
important cellular functions.
3.5 Transport and Transport Systems
• Carrier-Mediated Transport Systems (Figure 3.9)
– Show saturation effect
– Highly specific
© 2012 Pearson Education, Inc. Marmara University – Enve303 Env. Eng. Microbiology – Prof. BARIŞ ÇALLI

10/5/2013
13
Figure 3.9 Transport versus diffusion.
Rate
of
so
lute
en
try
Transporter saturated
with substrate
Transport
Simple diffusion
External concentration of solute
© 2012 Pearson Education, Inc. Marmara University – Enve303 Env. Eng. Microbiology – Prof. BARIŞ ÇALLI
In transport, the
uptake rate
shows saturation
at relatively low
external
concentrations
3.5 Transport and Transport Systems
• Three transport events are possible: uniport,
symport, and antiport (Figure 3.11)
– Uniporters transport in one direction across the
membrane
– Symporters function as co-transporters
– Antiporters transport a molecule across the
membrane while simultaneously transporting
another molecule in the opposite direction
© 2012 Pearson Education, Inc. Marmara University – Enve303 Env. Eng. Microbiology – Prof. BARIŞ ÇALLI

10/5/2013
14
Figure 3.11 Structure of membrane-spanning transporters and types of transport events
Uniporter Antiporter Symporter
Out
In
© 2012 Pearson Education, Inc. Marmara University – Enve303 Env. Eng. Microbiology – Prof. BARIŞ ÇALLI
Membrane-
spanning
transporters are
made of 12 α-
helices (each
shown here as a
cylinder) that
aggregate to form a
channel through the
membrane. Shown
here are three
different transport
events; for
antiporters and
symporters, the
cotransported
substance is
shown in yellow.
III. Cell Walls of Prokaryotes
• 3.6 The Cell Wall of Bacteria: Peptidoglycan
• 3.7 The Outer Membrane
• 3.8 Cell Walls of Archaea
© 2012 Pearson Education, Inc. Marmara University – Enve303 Env. Eng. Microbiology – Prof. BARIŞ ÇALLI
10/5/2013
15
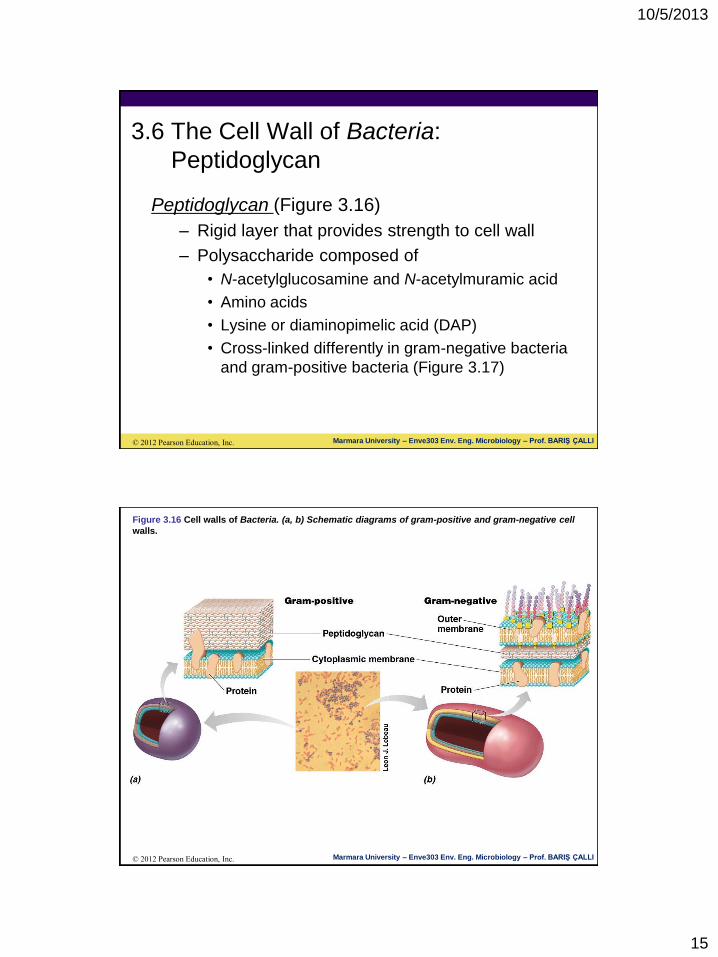
3.6 The Cell Wall of Bacteria:
Peptidoglycan
Peptidoglycan (Figure 3.16)
– Rigid layer that provides strength to cell wall
– Polysaccharide composed of
• N-acetylglucosamine and N-acetylmuramic acid
• Amino acids
• Lysine or diaminopimelic acid (DAP)
• Cross-linked differently in gram-negative bacteria
and gram-positive bacteria (Figure 3.17)
© 2012 Pearson Education, Inc. Marmara University – Enve303 Env. Eng. Microbiology – Prof. BARIŞ ÇALLI
Figure 3.16 Cell walls of Bacteria. (a, b) Schematic diagrams of gram-positive and gram-negative cell
walls.
© 2012 Pearson Education, Inc. Marmara University – Enve303 Env. Eng. Microbiology – Prof. BARIŞ ÇALLI
10/5/2013
16
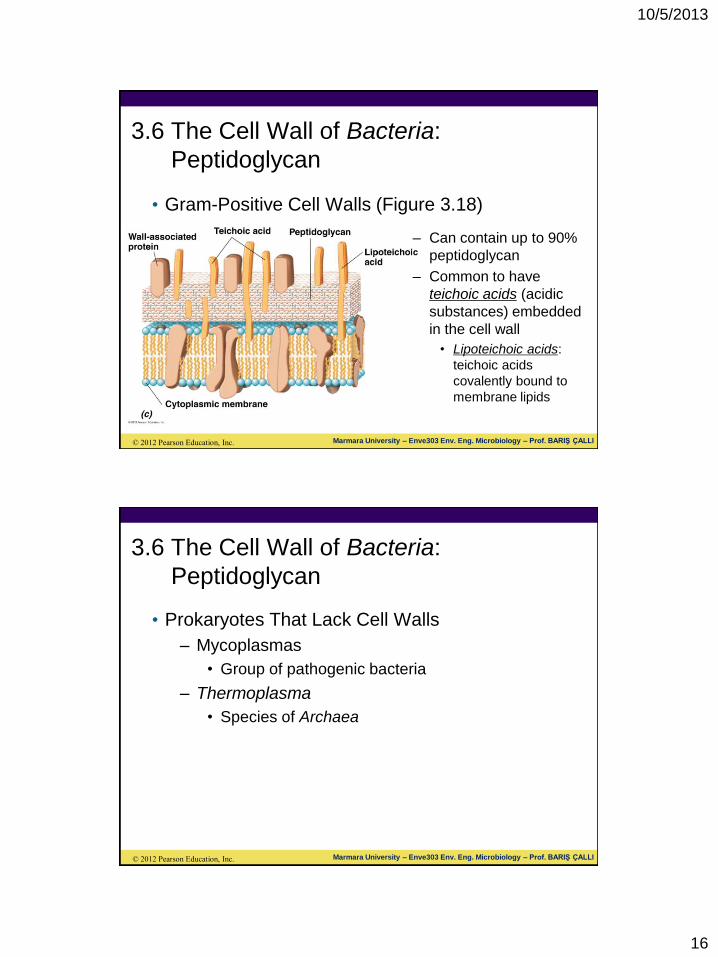
3.6 The Cell Wall of Bacteria:
Peptidoglycan
• Gram-Positive Cell Walls (Figure 3.18)
© 2012 Pearson Education, Inc. Marmara University – Enve303 Env. Eng. Microbiology – Prof. BARIŞ ÇALLI
– Can contain up to 90%
peptidoglycan
– Common to have
teichoic acids (acidic
substances) embedded
in the cell wall
• Lipoteichoic acids:
teichoic acids
covalently bound to
membrane lipids
3.6 The Cell Wall of Bacteria:
Peptidoglycan
• Prokaryotes That Lack Cell Walls
– Mycoplasmas
• Group of pathogenic bacteria
– Thermoplasma
• Species of Archaea
© 2012 Pearson Education, Inc. Marmara University – Enve303 Env. Eng. Microbiology – Prof. BARIŞ ÇALLI

10/5/2013
17
3.7 The Outer Membrane
• Total cell wall contains ~10% peptidoglycan
(Figure 3.20a)
• Most of cell wall composed of outer membrane
(lipopolysaccharide [LPS] layer)
• Structural differences between cell walls of
gram-positive and gram-negative Bacteria are
responsible for differences in the Gram stain
reaction
© 2012 Pearson Education, Inc. Marmara University – Enve303 Env. Eng. Microbiology – Prof. BARIŞ ÇALLI
Figure 3.20a The gram-negative cell wall. Arrangement of lipopolysaccharide, lipid A, phospholipid,
porins, and lipoprotein in the outer membrane
© 2012 Pearson Education, Inc. Marmara University – Enve303 Env. Eng. Microbiology – Prof. BARIŞ ÇALLI
O-polysaccharide
Peptidoglycan
Core polysaccharide
Lipid A Protein
Porin
Out
8 nm
Phospholipid
Lipopolysaccharide
(LPS)
Lipoprotein
In
Outermembrane
Periplasm
Cytoplasmic
membrane
Cellwall

10/5/2013
18
3.8 Cell Walls of Archaea
• No peptidoglycan
• Typically no outer membrane
• Pseudomurein
– Polysaccharide similar to peptidoglycan
Composed of N-acetylglucosamine and N-
acetyltalosaminuronic acid
– Found in cell walls of certain methanogenic
Archaea
• Cell walls of some Archaea lack pseudomurein
© 2012 Pearson Education, Inc. Marmara University – Enve303 Env. Eng. Microbiology – Prof. BARIŞ ÇALLI
IV. Other Cell Surface Structures and
Inclusions
• 3.9 Cell Surface Structures
• 3.10 Cell Inclusions
• 3.11 Gas Vesicles
• 3.12 Endospores
© 2012 Pearson Education, Inc. Marmara University – Enve303 Env. Eng. Microbiology – Prof. BARIŞ ÇALLI

10/5/2013
19
3.9 Cell Surface Structures
• Capsules and Slime Layers
– Polysaccharide layers (Figure 3.23)
• May be thick or thin, rigid or flexible
– Assist in attachment to surfaces
– Protect against phagocytosis
– Resist desiccation
© 2012 Pearson Education, Inc. Marmara University – Enve303 Env. Eng. Microbiology – Prof. BARIŞ ÇALLI
Figure 3.23
Bacterial capsules.
Cell Capsule
© 2012 Pearson Education, Inc. Marmara University – Enve303 Env. Eng. Microbiology – Prof. BARIŞ ÇALLI
Capsules of Acinetobacter species
observed by phase-contrast
microscopy after negative staining of
cells with India ink. India ink does not
penetrate the capsule, so the capsule
appears as a light area surrounding
the cell, which appears black.
Transmission electron micrograph of
a thin section of cells of
Rhodobacter capsulatus with
capsules (arrows) clearly evident;
cells are about 0.9 µm wide.
Transmission electron micrograph of
Rhizobium trifolii stained with
ruthenium red to reveal the capsule.
The cell is about 0.7 µm wide.
10/5/2013
20
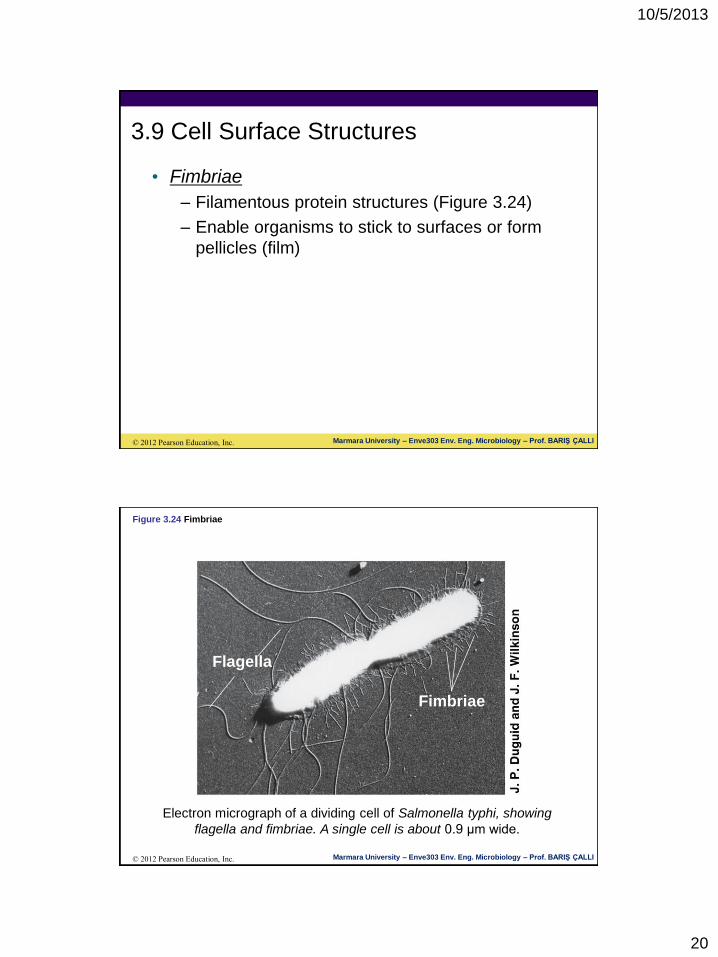
3.9 Cell Surface Structures
• Fimbriae
– Filamentous protein structures (Figure 3.24)
– Enable organisms to stick to surfaces or form
pellicles (film)
© 2012 Pearson Education, Inc. Marmara University – Enve303 Env. Eng. Microbiology – Prof. BARIŞ ÇALLI
Figure 3.24 Fimbriae
Flagella
Fimbriae
© 2012 Pearson Education, Inc. Marmara University – Enve303 Env. Eng. Microbiology – Prof. BARIŞ ÇALLI
Electron micrograph of a dividing cell of Salmonella typhi, showing
flagella and fimbriae. A single cell is about 0.9 µm wide.
10/5/2013
21
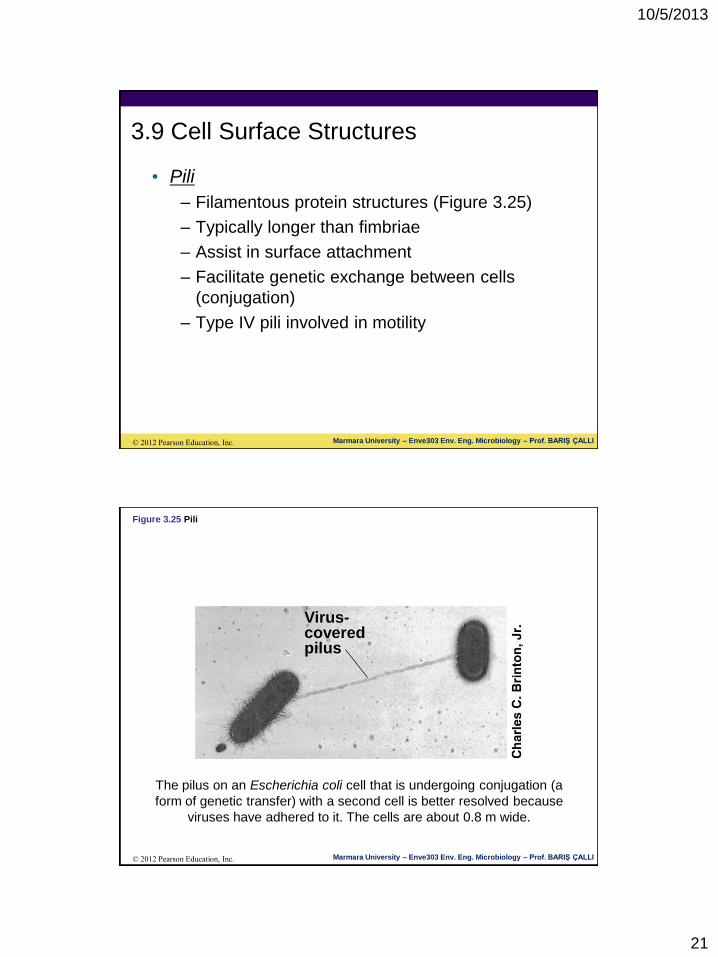
3.9 Cell Surface Structures
• Pili
– Filamentous protein structures (Figure 3.25)
– Typically longer than fimbriae
– Assist in surface attachment
– Facilitate genetic exchange between cells
(conjugation)
– Type IV pili involved in motility
© 2012 Pearson Education, Inc. Marmara University – Enve303 Env. Eng. Microbiology – Prof. BARIŞ ÇALLI
Figure 3.25 Pili
Virus- covered pilus
© 2012 Pearson Education, Inc. Marmara University – Enve303 Env. Eng. Microbiology – Prof. BARIŞ ÇALLI
The pilus on an Escherichia coli cell that is undergoing conjugation (a
form of genetic transfer) with a second cell is better resolved because
viruses have adhered to it. The cells are about 0.8 m wide.

10/5/2013
22
3.10 Cell Inclusions
• Carbon storage polymers
– Poly--hydroxybutyric acid (PHB): lipid (Figure
3.26)
– Glycogen: glucose polymer
• Polyphosphates: accumulations of inorganic
phosphate (Figure 3.27)
• Sulfur globules: composed of elemental sulfur
• Magnetosomes: magnetic storage inclusions
(Figure 3.28)
© 2012 Pearson Education, Inc. Marmara University – Enve303 Env. Eng. Microbiology – Prof. BARIŞ ÇALLI
Figure 3.26 Poly-β-hydroxyalkanoates.
Polyhydroxyalkanoate
© 2012 Pearson Education, Inc. Marmara University – Enve303 Env. Eng. Microbiology – Prof. BARIŞ ÇALLI
Electron micrograph of a thin section of cells of a bacterium containing
granules of PHA. Nile red–stained cells of a PHA-containing bacterium.

10/5/2013
23
3.11 Gas Vesicles
• Gas Vesicles
– Confer buoyancy in planktonic cells
(Figure 3.29)
– Spindle-shaped, gas-filled structures made of
protein (Figure 3.30)
– Gas vesicle impermeable to water
– Molecular Structure of Gas Vesicles
• Gas vesicles are composed of two proteins:
GvpA and GvpC
• Function by decreasing cell density
© 2012 Pearson Education, Inc. Marmara University – Enve303 Env. Eng. Microbiology – Prof. BARIŞ ÇALLI
Figure 3.29 Buoyant cyanobacteria.
© 2012 Pearson Education, Inc. Marmara University – Enve303 Env. Eng. Microbiology – Prof. BARIŞ ÇALLI
Flotation of gas-vesiculate cyanobacteria that formed a bloom in a
freshwater lake, Lake Mendota, Madison, Wisconsin (USA).

10/5/2013
24
3.12 Endospores
• Endospores
– Highly differentiated cells resistant to heat, harsh
chemicals, and radiation (Figure 3.32)
– “Dormant” stage of bacterial life cycle
(Figure 3.33)
– Ideal for dispersal via wind, water, or animal gut
– Only present in some gram-positive bacteria
© 2012 Pearson Education, Inc. Marmara University – Enve303 Env. Eng. Microbiology – Prof. BARIŞ ÇALLI
Figure 3.32 The bacterial endospore.
Terminal spores
Subterminal spores
Central spores
© 2012 Pearson Education, Inc. Marmara University – Enve303 Env. Eng. Microbiology – Prof. BARIŞ ÇALLI
Phase-contrast photomicrographs illustrating endospore morphologies
and intracellular locations in different species of endospore-forming
bacteria. Endospores appear bright by phase-contrast microscopy.

10/5/2013
25
Figure 3.33 The life cycle of an endospore-forming bacterium.
Vegetative cell
Developing spore
Sporulating cell
Mature spore
© 2012 Pearson Education, Inc. Marmara University – Enve303 Env. Eng. Microbiology – Prof. BARIŞ ÇALLI
The phase-contrast photomicrographs are of cells of Clostridium pascui.
A cell is about 0.8 m wide.
3.12 Endospores
• Endospore Structure (Figure 3.35)
– Structurally complex
– Contains dipicolinic acid
– Enriched in Ca2+
– Core contains small acid-
soluble proteins (SASPs)
© 2012 Pearson Education, Inc. Marmara University – Enve303 Env. Eng. Microbiology – Prof. BARIŞ ÇALLI

10/5/2013
26
3.12 Endospores
• The Sporulation Process
– Complex series of events (Figure 3.37)
– Genetically directed
© 2012 Pearson Education, Inc. Marmara University – Enve303 Env. Eng. Microbiology – Prof. BARIŞ ÇALLI
Figure 3.37 Stages in endospore formation.
© 2012 Pearson Education, Inc. Marmara University – Enve303 Env. Eng. Microbiology – Prof. BARIŞ ÇALLI
Stages are defined from genetic and microscopic analyses of sporulation in
Bacillus subtilis, the model organism for studies of sporulation.
Free endospore
Stage VI, VIIStage V
Coat
Stage IV
Stage IIIStage II
Mother cell
Prespore
Septum
Sporulationstages
Cortex
Cell wall
Cytoplasmicmembrane
Vegetative cycle
Maturation,cell lysis
Celldivision
GerminationGrowth
Engulfment
Asymmetriccell division;commitmentto sporulation,Stage I
Spore coat, Ca2
uptake, SASPs,dipicolinic acid
Cortexformation

10/5/2013
27
V. Microbial Locomotion
• 3.13 Flagella and Motility
• 3.14 Gliding Motility
• 3.15 Microbial Taxes
© 2012 Pearson Education, Inc. Marmara University – Enve303 Env. Eng. Microbiology – Prof. BARIŞ ÇALLI
3.13 Flagella and Motility
• Flagellum (pl. flagella): structure that assists
in swimming
– Different arrangements: peritrichous, polar,
lophotrichous
– Helical in shape
© 2012 Pearson Education, Inc. Marmara University – Enve303 Env. Eng. Microbiology – Prof. BARIŞ ÇALLI
Animation: Flagella Arrangement

10/5/2013
28
3.13 Flagella and Motility
• Flagella increase or decrease rotational speed in
relation to strength of the proton motive force
• Differences in swimming motions
– Peritrichously flagellated cells move slowly in a
straight line
– Polarly flagellated cells move more rapidly and
typically spin around
© 2012 Pearson Education, Inc. Marmara University – Enve303 Env. Eng. Microbiology – Prof. BARIŞ ÇALLI
3.14 Gliding Motility
• Gliding Motility
– Flagella-independent motility
– Slower and smoother than swimming
– Movement typically occurs along long axis of cell
– Requires surface contact
– Mechanisms
• Excretion of polysaccharide slime
• Type IV pili
• Gliding-specific proteins
© 2012 Pearson Education, Inc. Marmara University – Enve303 Env. Eng. Microbiology – Prof. BARIŞ ÇALLI

10/5/2013
29
3.15 Microbial Taxes
• Taxis: directed movement in response to chemical
or physical gradients
– Chemotaxis: response to chemicals
– Phototaxis: response to light
– Aerotaxis: response to oxygen
– Osmotaxis: response to ionic strength
– Hydrotaxis: response to water
© 2012 Pearson Education, Inc. Marmara University – Enve303 Env. Eng. Microbiology – Prof. BARIŞ ÇALLI
3.15 Microbial Taxes
• Chemotaxis
– Best studied in E. coli
– Bacteria respond to temporal, not spatial,
difference in chemical concentration
– “Run and tumble” behavior (Figure 3.47)
– Attractants and receptors sensed by
chemoreceptors
© 2012 Pearson Education, Inc. Marmara University – Enve303 Env. Eng. Microbiology – Prof. BARIŞ ÇALLI

10/5/2013
30
Figure 3.47 Chemotaxis in a peritrichously flagellated bacterium such as Escherichia coli.
Tumble
Run
Tumble
Run
Attractant
© 2012 Pearson Education, Inc. Marmara University – Enve303 Env. Eng. Microbiology – Prof. BARIŞ ÇALLI
No attractant present:
Random movement. In the
absence of a chemical
attractant the cell swims
randomly in runs, changing
direction during tumbles.
Attractant present: Directed movement
In the presence of an attractant runs
become biased, and the cell moves up the
gradient of the attractant. The attractant
gradient is depicted in green, with the
highest concentration where the color is
most intense.
3.15 Microbial Taxes
Measuring Chemotaxis (Figure 3.48)
Measured by inserting a capillary tube
containing an attractant or a repellent in a
medium of motile bacteria
Can also be seen under a microscope
© 2012 Pearson Education, Inc. Marmara University – Enve303 Env. Eng. Microbiology – Prof. BARIŞ ÇALLI

10/5/2013
31
Figure 3.48 Measuring chemotaxis using a capillary tube assay.
© 2012 Pearson Education, Inc. Marmara University – Enve303 Env. Eng. Microbiology – Prof. BARIŞ ÇALLI
(a) Insertion of the capillary into a bacterial
suspension. As the capillary is inserted,
a gradient of the chemical begins to
form.
(b) Control capillary contains a salt solution
that is neither an attractant nor a
repellent. Cell concentration inside the
capillary becomes the same as that
outside.
(c) Accumulation of bacteria in a capillary
containing an attractant.
(d) Repulsion of bacteria by a repellent.
Time course showing cell
numbers in capillaries
containing various chemicals.