michael clarfeld, clearbridge investments kevin mccarthy ... · michael clarfeld, clearbridge...
TRANSCRIPT

Is the MLP Model Broken?
Michael Clarfeld, Clearbridge Investments
Kevin McCarthy, Kayne Anderson Fund Advisors
Ed Russell, Tortoise Capital Advisors
©2016 Tortoise Capital Advisors, L.L.C. MLP Asset Manager Panel Discussion | June 2, 2016

Tortoise MLP Index®
MLP YTD total return performance
Source: Bloomberg as of 5/31/2016.
Price return Total return12/31/2015 - 2/11/2015 -31.6% -29.9%2/11/2016 - 5/31/2016 52.9% 56.2%YTD 4.6% 9.5%
-30% +56%
600
650
700
750
800
850
900
950
1000
12/31/2015 1/31/2016 2/29/2016 3/31/2016 4/30/2016 5/31/2016

Closed-end funds Exchange traded products Open-end funds
MLP fund net flows by quarter (2010-present)
Source: US Capital as of 4/30/2016.
-1,000
0
1,000
2,000
3,000
4,000
5,000
6,000
7,000
Mar
-10
Jun-
10
Sep
-10
Dec
-10
Mar
-11
Jun-
11
Sep
-11
Dec
-11
Mar
-12
Jun-
12
Sep
-12
Dec
-12
Mar
-13
Jun-
13
Sep
-13
Dec
-13
Mar
-14
Jun-
14
Sep
-14
Dec
-14
Mar
-15
Jun-
15
Sep
-15
Dec
-15
Apr
-16
Cap
ital i
nflo
ws
($ in
mill
ions
)

Exchange traded products Open-end funds
YTD MLP fund net flows by month
Source: US Capital as of 4/30/2016.
-200
0
200
400
600
800
1,000
Jan-16 Feb-16 Mar-16 Apr-16
Cap
ital i
nflo
ws
($ in
mill
ions
)

1
For institutional investors only.
Not for distribution to the general public.
Confidential and proprietary information.
For institutional investors only.
Not for distribution to the general public.
Confidential and proprietary information.
Simplification Transactions:
What’s Old is New Again
Michael Clarfeld, CFA
Managing Director, Portfolio Manager
June 2, 2016
2
For institutional investors only.
Not for distribution to the general public.
Confidential and proprietary information.
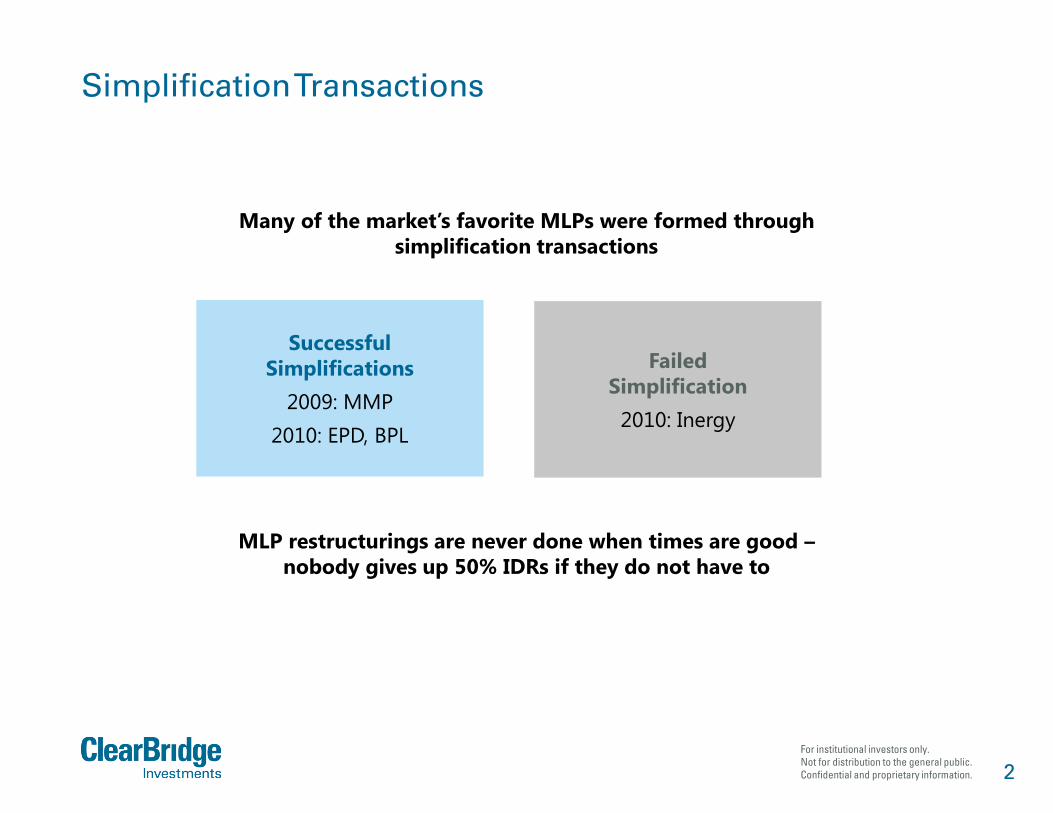
Simplification Transactions
MLP restructurings are never done when times are good –
nobody gives up 50% IDRs if they do not have to
Successful
Simplifications
2009: MMP
2010: EPD, BPL
Failed
Simplification
2010: Inergy
Many of the market’s favorite MLPs were formed through
simplification transactions
3
For institutional investors only.
Not for distribution to the general public.
Confidential and proprietary information.
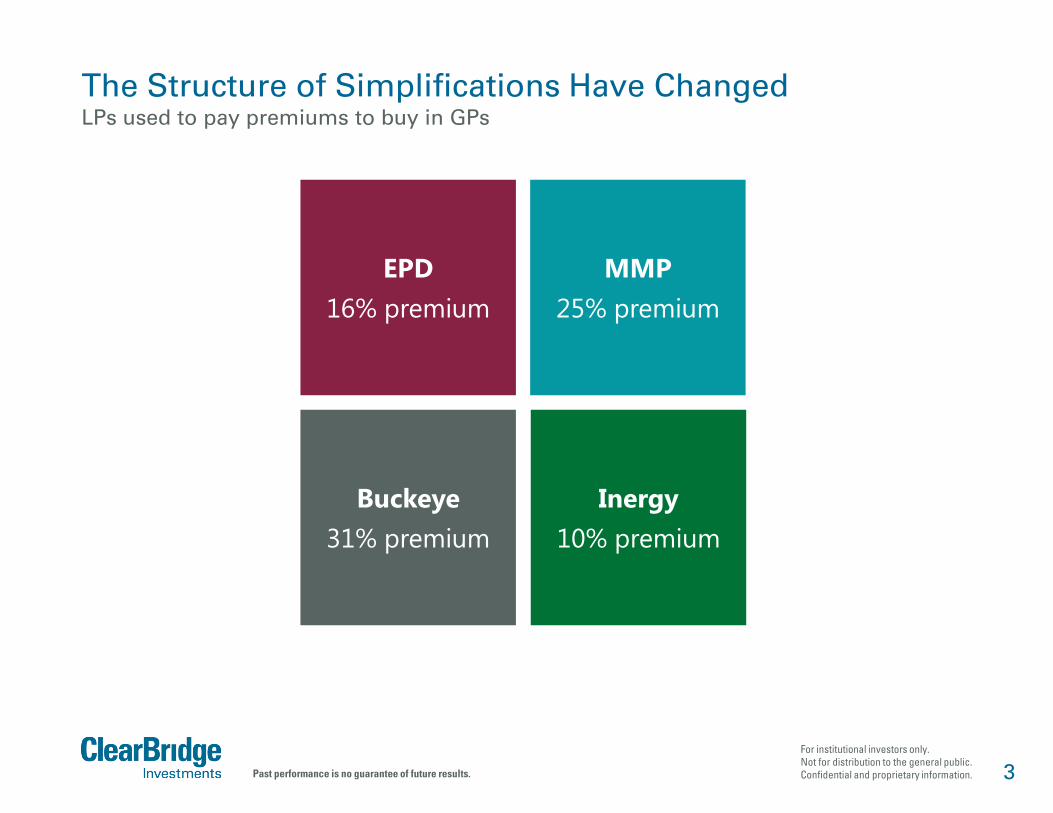
The Structure of Simplifications Have Changed LPs used to pay premiums to buy in GPs
EPD
16% premium
MMP
25% premium
Buckeye
31% premium
Inergy
10% premium
Past performance is no guarantee of future results.

4
For institutional investors only.
Not for distribution to the general public.
Confidential and proprietary information.
Lately GPs Have Been Paying Premiums to Buy in Their LPs
Past performance is no guarantee of future results.
2014
Kinder
11-16%
premium
2015
Crestwood
5%
premium
2016
Targa
18%
premium

5
For institutional investors only.
Not for distribution to the general public.
Confidential and proprietary information.
The GP/LP Model
The GP/LP model is
challenged when:
Growth slows
Cost of equity is high
The GP/LP model
works when:
Growth is strong
Cost of equity is cheap

6
For institutional investors only.
Not for distribution to the general public.
Confidential and proprietary information.
Is the GP/LP Model Broken?
• The model clearly isn’t “broken” – many of the best-performing MLPs are LPs with GP
Source: Bloomberg.
Past performance is no guarantee of future results.
Bottom Line:
The model can work
and work across various lines
of business
(G&P, Long haul pipes,
Refinery logistics)
Overriding Similarities:
Visible Growth
Big Differences:
AM and RMP:
G&Ps for non-IG EPs
CQP: Management issues
Performance
as of April 29, 2016 (%)
Name TTM Relative
to AMZ Index
Valero Energy Partners, LP -3.9 25.0
Phillips 66 Partners, LP -22.3 6.6
Shell Midstream Partners, LP -6.2 2.7
Antero Midstream Partners, LP 4.0 32.9
Rice Midstream Partners, LP 11.6 40.5
Cheniere Energy Partners, LP -3.2 25.7
Spectra Energy Partners, LP -1.5 27.4
Tallgrass Energy Partners, LP -12.2 16.7

7
For institutional investors only.
Not for distribution to the general public.
Confidential and proprietary information.
Conclusion
• GP/LP structure isn’t going away – this is America and the upside to being a successful GP isa powerful incentive
• There will not be a mass move to get rid of or cap IDRs – nobody will give up 50% unlessthey have to
• Simplification transactions are not new – they happen in downcycles
• The “MLP” universe is becoming more diverse
– C-corps like KMI or TRGP
– Unified Partnerships like EPD or MMP
– Classic GP/LP like WGP and WES or TEP and TEGP
• As investment universe changes, MLP products likely to change too (harder to own C-corpMLPs like Kinder and TRGP in C-corp mutual funds and ETFs)
• Payout ratio philosophy may differ by structure
– High payout ratio is a must in GP/LP structure
– High payout ratio may not make sense over the long term in C-corps like KMI, TRGP andPAGP/PAA
Product Development Research led to the following conclusions:
Combinations of different ClearBridge strategies using appropriate
reallocation triggers and weights generate higher risk-adjusted returns
(as measured by Sharpe Ratios) than the underlying products or an equal-
weighted combination
Lower-correlating products generate higher risk-adjusted returns
Optimized reallocation weights vary based on strategy combinations
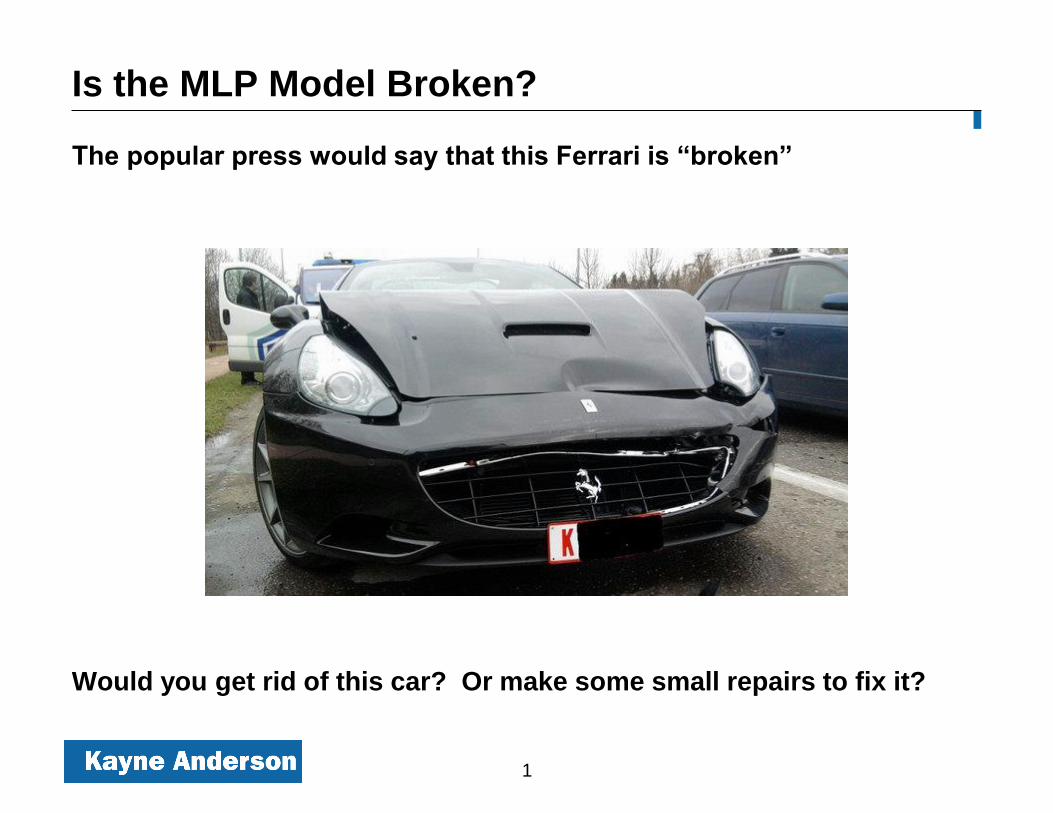
Is the MLP Model Broken?
The popular press would say that this Ferrari is “broken”
Would you get rid of this car? Or make some small repairs to fix it?
1

We strongly believe the MLP model isn’t broken!
Like the Ferrari, the MLP model was probably driving a little too fast…
…and probably deserved a speeding ticket….
So what happened?
Our view is that any problems we’ve seen in the MLP market were the result
of companies straying from the MLP model:
• In terms of how companies finance themselves
• What types of companies form MLPs – both the size and the type of
assets
• Structural protections for investors – which got whittled away in the bull
market
2

So… What Exactly is the “MLP Model”?
There are a few basic characteristics of MLPs
1) Full payout model
– “Finance as you go” model for acquisition and growth projects
2) Growth must be financed externally
– Instills discipline: if you do a bad deal, you can’t get financing
3) Predominantly fee based assets
– Minimal direct commodity risk preserves the level of cash flow
4) Incentives for General Partners to grow distributions
– Incentivize management both on the upside and the downside
3

How did we stray from the model?
Moving from an acquisition-based model to project-based model had
big challenges
– “Synchronized” financing became more difficult as capex requirements
were spread out over 2-4 years
– MLPs did not pre-finance equity portion of capex – wanted to wait until
the cash flowed
• Negative drag on DCF
– MLPs caught with huge capex obligations at a time when the capital
markets were very challenged
• Balance sheets were already stretched
4

What Should Have Happened??
In the next cycle, MLPs need to learn from the past
– Capex requirements can’t be outsized
• Have to be able to be proportionate with access to capital
– Big projects should be financed at the GP and dropped when ready
• MLPs with strong sponsors should receive a higher valuation
– Need to run leverage below target
• Leverage can fill the gap when the equity markets close
5

What Happened to Quality Control?
MLP market – both bankers and investors – strayed from the model
– More commodity risk, more volume risk and more service company risk
– Upstream model clearly doesn’t work – this is the second “blow up”
• Blew up in the 1986-1989 time frame for the exact same reasons
• Been there, done that……
– Read the fine print – what exactly does “fee based midstream mean??”
6

Non-Midstream IPOs were Frequent After 2008
40% of IPOs since 2008 were in non-midstream businesses
7
IPOs Since 2008
60%
40%
Midstream Non-Midstream
Non-Midstream Sub-Sectors
Marine (Shipping & Offshore)
Upstream
Refining
Coal
Retail Gas Distribution
Chemicals & Fertilizer
Frac Sand & Proppants
Propane Dehydrogenation
Wood Pellets
Saltwater Disposal
Ethanol Storage
Trona / Soda Ash Processing

What Happens when Quality Control Deteriorates?
No one should be surprised by the results…..
8
Relative Performance Since IPO(1) Median Relative Performance Since IPO
30%
25%
(11%)
(27%)
(40%)
(30%)
(20%)
(10%)
0%
10%
20%
30%
40%
Top 25% byMarket Cap
Top 50% byMarket Cap
Bottom 50%by Market
Cap
Bottom 25%by Market
Cap
20%
(17%)
(40%)
(30%)
(20%)
(10%)
0%
10%
20%
30%
40%
"Core Midstream" MLPs Other MLPs
___________________________
(1) Median relative performance versus the AMZ price return over the same time period. Includes 77 MLP IPOs since 2008. Return statistics as of May 18, 2016. Market capitalizations groupings as of June 30, 2015.

IDRs – Friend or Foe??
Incentive Distribution Rights have definitely worked
– MLP IDRs have been in existence since 1987
• Has been a primary driver of growth rate of 8% over the past 16 years
– IDRs provide a valuable incentive for the management – both on the
upside and the downside
• IDRs incentivize GPs to increase distributions - which in turn drives
stock price performance
• Also works on the downside, as the GP is hurt much more when an
MLP has to cut distributions
9

IDRs are Not Perfect
GP IDRs have - in some ways - worked too well
– The GP’s split of distributable cash flow is too high in the most
successful MLPs
• This effectively increases the cost of capital, and that has come under
great scrutiny lately
– Some MLPs trying to solve this issue through a “roll-in” of the LPs into
the GP
• Investors should be very wary of this – is often just a back door
distribution cut that disproportionately hurts the LPs
• That’s not how the high splits are supposed to work – the GP is
supposed to suffer more!
10

So…How Can We Solve IDR Issues?
There are several potential solutions – roll-ups not the only option!
– Giving “IDR holidays” on equity issued in times of distress is an easy fix
• Take the pledge: IDR waivers for the remainder of 2016
– Capping IDRs at 25% is also a step in the right direction
• IDRs weren’t designed with the expectation that they get this deep into the
splits – and 50%, quite frankly, looks excessive
– Could provide – at the time of IPO – an automatic reset of the IDRs at a certain
distribution amount
• Still need to give incentive to the GP – just don’t make IDRs a burden
– Finally, should consider eliminating IDRs on new equity – just on distribution
increases
11