mh370 – definition of underwater search areas · appendix f: search strategy working group...
TRANSCRIPT

Insert document title
Location | Date
ATSB Transport Safety Report[Insert Mode] Occurrence InvestigationXX-YYYY-####Final
Investigation
MH370 - Definition of Underwater Search Areas
Investigation
26 June 2014
ATSB Transport Safety ReportExternal Aviation InvestigationAE-2014-05426 June 2014 (updated 18 August 2014)

Publishing information
Published by: Australian Transport Safety Bureau
Postal address: PO Box 967, Civic Square ACT 2608
Office: 62 Northbourne Avenue Canberra, Australian Capital Territory 2601
Telephone: 1800 020 616, from overseas +61 2 6257 4150 (24 hours)
Accident and incident notification: 1800 011 034 (24 hours)
Facsimile: 02 6247 3117, from overseas +61 2 6247 3117
Email: [email protected]
Internet: www.atsb.gov.au
© Commonwealth of Australia 2014
Ownership of intellectual property rights in this publication Unless otherwise noted, copyright (and any other intellectual property rights, if any) in this publication is owned by the Commonwealth of Australia.
Creative Commons licence With the exception of the Coat of Arms, ATSB logo, and photos and graphics in which a third party holds copyright, this publication is licensed under a Creative Commons Attribution 3.0 Australia licence.
Creative Commons Attribution 3.0 Australia Licence is a standard form license agreement that allows you to copy,
distribute, transmit and adapt this publication provided that you attribute the work.
The ATSB’s preference is that you attribute this publication (and any material sourced from it) using the following
wording: Source: Australian Transport Safety Bureau
Copyright in material obtained from other agencies, private individuals or organisations, belongs to those agencies,
individuals or organisations. Where you want to use their material you will need to contact them directly.
Addendum Page Change Date
57 Additional explanatory material relating to the Perth GES partial
compensation
13 Aug 2014
58 Table 5 and Table 6 updated – Previous parameter Uplink Doppler changed
to Aircraft Doppler (uplink), notes updated for clarity. Previous parameter
Downlink Doppler (Satellite movement) separated into its two components
Satellite Doppler (uplink) and Satellite Doppler (downlink) for clarity
13 Aug 2014
58 Correction to Table 5 and 6 typographical errors introduced in13 Aug update 15 Aug 2014
58 Correction to Table 6 typographical errors introduced in 13 Aug update 18 Aug 2014

Executive summary
On 08 March 2014, flight MH370, a Boeing
777-200ER registered 9M-MRO, lost contact
with Air Traffic Control during a transition of
airspace between Malaysia and Vietnam. An
analysis of radar data and subsequent satellite
communication (SATCOM) system signalling
messages placed the aircraft in the Australian
search and rescue zone on an arc in the
southern part of the Indian Ocean. This arc
was considered to be the location where the
aircraft’s fuel was exhausted.
A surface search of probable impact areas along this arc, coordinated by the Australian Maritime
Safety Authority, was carried out from 18 March – 28 April 2014. This search effort was
undertaken by an international fleet of aircraft and ships with the search areas over this time
progressing generally from an initial southwest location along the arc in a north-easterly direction.
The location of the search areas was guided by continuing and innovative analysis by a Joint
Investigation Team of the flight and satellite-communications data. This analysis was
supplemented by other information provided to ATSB during this period. This included possible
underwater locator beacon and hydrophone acoustic detections.
No debris associated with 9M-MRO was identified either from the surface search, acoustic search
or from the ocean floor search in the vicinity of the acoustic detections. The ocean floor search
was completed on 28 May 2014.
Refinements to the analysis of both the flight and satellite data have been continuous since the
loss of MH370. The analysis has been undertaken by an international team of specialists from the
UK, US and Australia working both independently and collaboratively. Other information regarding
the performance and operation of the aircraft has also been taken into consideration in the
analysis.
Using current analyses, the team has been able to reach a consensus in identifying a priority
underwater search area for the next phase of the search.
The priority area of approximately 60,000 km2 extends along the arc for 650 km in a northeast
direction from Broken Ridge. The width of the priority search area is 93 km. This area was the
subject of the surface search from Day 21-26.
Work is continuing with refinements in the analysis of the satellite communications data. Small
frequency variations can significantly affect the derived flight path. This ongoing work may result in
changes to the prioritisation and locale of search activity.

Table of contents
Introduction ..............................................................................................................................1 Background on over-water searches 2 Air France 447 (AF447) accident search area definition 3 MH370 search area definition 4
Surface search for MH370 ......................................................................................................5 Possible impact areas 5 Drifted search areas 7 Debris sightings 10
Acoustic search .................................................................................................................... 11 Underwater locator beacons 11 Acoustic search area definition 11 Acoustic detections 11
HMS Echo 11 MV Haixun 01 11 ADV Ocean Shield 12 Analysis of acoustic detections 13 AP-3C sonobuoy acoustic search capability 13 Ocean floor sonar survey in area of Ocean Shield acoustic detections 14
Defining the search area ..................................................................................................... 16 Search area introduction 16
Position of the turn to the South 16 Aircraft performance limitations 16 Satellite data analysis 16
Satellite system Information 17 Burst Timing Offset (BTO) 18 Northern and southern aircraft performance limits 21 1
st and 7
th handshakes 22
Burst Frequency Offset (BFO) 22 Verification and validation of BFO analysis 29 Determining the width of the search area 32
Aircraft electrical system 33 SDU power-up 33 Review of previous accidents 34 End of flight scenario 34 Width of the search area - summary 35
Other information considered ............................................................................................ 37 Air routes 37
MH370 38 Southern air routes/waypoints 38 Air routes/ waypoints summary 39
Hydrophones 40
Underwater search area ...................................................................................................... 41 Acronyms 43
List of Appendices ............................................................................................................... 45 Appendix A: Information used in determining and refining search areas 46 Appendix B: Hydrophones – Curtin University Executive Summary 47

Appendix C: Accident case studies – loss of control accidents 48 Appendix D: Accident case studies – unresponsive crew/ hypoxia accidents 51 Appendix E: Accident case studies – a sample of accidents involving a glide 52 Appendix F: Search Strategy Working Group underwater search areas 53 Appendix G: Explanatory notes on BTO and BFO analysis 54
BTO Analysis 54 BFO Analysis 55

1
Introduction On 7 March 2014 at 1722 UTC
1 (8 March 0022 local time Malaysia), flight MH370, a Boeing 777-
200ER registered 9M-MRO, lost contact with ATC during a transition of airspace between
Malaysia and Vietnam. An analysis of radar data and subsequent satellite communication
(SATCOM) system signalling messages placed the aircraft in the Australian search and rescue
zone in the southern part of the Indian Ocean.
On 17 March 2014, Australia took charge of the coordination of the search and rescue operation.
Over the next 6 weeks from 18 March, an intensive aerial and surface search was conducted by
assets from Australia, Malaysia, China, Japan, Korea, UK and the USA.
During this period, the Australian Maritime Safety Authority (AMSA) and the ATSB jointly
determined a search area strategy correlating information from a Joint Investigation Team (JIT2)
located in Malaysia and other government and academic sources.
On 28 April 2014, the aerial search concluded and the search moved to an underwater phase.
More details of the search effort can be found on the Joint Agency Coordination Centre website
www.jacc.gov.au.
The ATSB is responsible for defining a search area. Since May 2014, a search strategy group,
coordinated by the ATSB, has been working towards defining the most probable position of the
aircraft at the time of the last satellite communications at 0019. The group brought together
satellite and aircraft specialists from the following organisations:
Air Accidents Investigation Branch (UK)
Boeing (US)
Defence Science and Technology Organisation (Australia)
Department of Civil Aviation (Malaysia)
Inmarsat (UK)
National Transportation Safety Board (US)
Thales (UK)
The group was faced with the challenge of using data from a communications satellite system
and aircraft performance data to reconstruct the flight path of MH370. This was in effect using a
satellite communications system as a navigation tracking system. Two pieces of information
recorded by a satellite ground station at the time of a transmission with MH370 were used to
estimate the track of the aircraft. These transmissions occurred only 7 times after loss of radar
contact.
This report presents the results of analysis conducted by this group and the ATSB’s determination
of a priority 60,000 km2 search area.
On 4 June 2014, the ATSB released a request for tender to acquire the services of a specialist
company capable of conducting a deep-water search for 9M-MRO under ATSB direction.
Bathymetry of the ocean floor in areas of the search zone commenced in mid-May using an ATSB
contracted vessel and a Chinese military vessel.
1 All times used in this report are referenced to Coordinated Universal Time (UTC) using the format hhmm.ss 2 The Joint Investigation Team comprised specialists from Malaysia, China, US, UK and France

2
Figure 1: B777 9M-MRO
Source: Seth Jaworski
Background on over-water searches
Over-water aircraft accident locations are usually found by conducting a broad-area aerial search.
The search area is generally determined by a combination of:
Position information from ground-based radar systems (maximum range is generally 250 NM)
Position information automatically transmitted from the aircraft at regular intervals
Position reports from the crew
Re-tracing the flight-planned route
Eye-witness reports (possibly located on the shore, on other aircraft or on ships)
Uncertainty in the position of an accident location increases with time from the aircraft’s last known
position (fix) so the search area will expand accordingly as the position data becomes ‘stale’.
Once floating wreckage is observed, reverse-drift techniques can be used to determine the aircraft
impact location. Only a small-area underwater search is then required to locate the wreckage and
map the wreckage field. This underwater search can be aided by the underwater locator beacons
fitted to the flight recorders. As they have a limited operational duration of nominally 30 days, and
to minimise the inaccuracies of the reverse-drift calculations, it is important that an aerial search is
commenced as soon as possible and the floating debris is found quickly.
In the case of MH370:
The aircraft departed Kuala Lumpur on 7 March 2014 at 1641
The final automatically transmitted position from the aircraft occurred at 1707
No radio notification of a problem was received from the crew
No radio communications were received from the crew after 1719
The final ATC (secondary) radar fix occurred at 1722
At 1725 the aircraft deviated from the flight-planned route

3
The final primary radar fix occurred at 1822 (Figure 2)
The satellite communications log indicated the aircraft continued to fly for another 6 hours until
8 March 0019
No confirmed eye-witness reports were received
No Emergency Locator Transmissions were received
The search in the Australian search and rescue zone commenced on 18 March (10 days after
the aircraft went missing)
Figure 2: MH370 flight path derived from primary and secondary radar data
Source: JIT/Google Earth
These factors have meant that the search area for MH370 has remained very large.
A comparison with the search for Air France flight 447, which crashed in the Atlantic Ocean on
1 June 2009, is useful. The search for the aircraft began on 1 June 2009 and the first wreckage
was discovered on 6 June 2009, 5 days after the accident.
Air France 447 (AF447) accident search area definition3
The ACARS system, is used to transmit non-voice messages between an aircraft and the ground
by VHF radio or satellite communication. The AF447 aircraft was programmed to automatically
transmit its position approximately every 10 minutes.
On 1 June 2009, the last position report occurred at 0210 and 24 maintenance messages were
received between 0210 and 0215. These messages were all transmitted via the same satellite
(Atlantic Ocean West, operated by the Inmarsat Company) and SITA’s ACARS network.
The maximum distance the aircraft could have feasibly travelled was computed from the time of its
last reported position to the time when a scheduled response from the ACARS system was not
received. The impact time was estimated based on the time of the last ACARS message received
3 BEA Report 18 March 2011: Triggered Transmission of Flight Data Working Group, page 27.

4
and the expectation (unfulfilled) of a subsequent message in the next 60 seconds. This analysis
indicated that the end of the flight occurred between 0214.26 and 0215.14, which makes a flight
time since the last reported position of about 5 minutes. Considering a maximum ground speed of
480 kt (or 8 NM/min), this makes a search area in the shape of a circle of radius 40 NM centred at
the last known position. This area extended over more than 17,000 km² and was situated more
than 500 NM from any coastline. After a search effort involving five separate phases, the aircraft
wreckage was located on 3 April 2011.
MH370 search area definition
As none of the conventional sources of data was able to be used to locate the aircraft wreckage
from MH370, novel sources of data and analysis techniques were required. This has led to a
larger than typical search area and changes in its location as refinements occur to the analysis
after validation and calibration checks have been performed.

5
Surface search for MH370 On 17 March 2014 (Day 10
4), Australia assumed responsibility for coordinating the search and
rescue effort in the southern Indian Ocean. AMSA as Australia’s search and rescue authority was
responsible for this activity. More details of the surface search effort can be found on the AMSA
website www.amsa.gov.au/media/mh370-timeline.
Possible impact areas
On 17 March 2014 (D10) the initial search area was determined by a Joint Investigation Team
(JIT)5 to be a 600,000 km
2 area approximately 2,500 km from Perth, WA. The initial search area
was determined following analysis of satellite communications data to and from MH370 during the
accident flight that was recorded at a ground station in Perth, WA. The data indicated the aircraft
flew an additional 6 hours after the last radar contact with a track south to the Indian Ocean. The
area was determined using only limited radar, satellite and performance data and assumed a
southern turn of MH370 at the north-west tip of Sumatra, Indonesia.
Areas in the Southern Indian Ocean designated S1 –S36 were defined from the aircraft’s predicted
performance and endurance (Figure 3). Two speeds resulted in the longest, straightest tracks to
the 6th arc
7 and were used to define possible impact locations within areas S1 and S2.
Figure 3: Possible southern final positions S1-S3 based on MH370 max range and time
Source: JIT/Google Earth
4 8 March 2014 is considered to be Day1 (D1), the date In Malaysia when MH370 departed Kuala Lumpur, Malaysia. 5 US and UK investigation agencies and their technical advisers with representatives from Malaysia, China and France. 6 JIT designation of areas – Note Malaysian designation of areas was in opposite direction. 7 Refer to Burst Timing Offset (BTO ) section in Defining the Search Area section of this report

6
Over the following days regions of S1 and S2 were drifted8 and provided surface search areas.
Some possible satellite debris sightings were also incorporated to produce additional search
areas.
On 27 March (D20), the JIT advised they now had more confidence in the increased speeds
provided by primary radar near Malaysia. This increased the aircraft fuel burn and the most
probable track moved north to the S3 area. The JIT additionally had more confidence that a 7th
arc was a fuel exhaustion point. Two new search areas designated S4 and S5 were defined. The
most probable impact location was moved to the bottom of the S4 area on the 7th arc within the S3
area. On 28 March (D21) a surface search of a drifted S3/S4 area (Shape A in Figure 6) was
commenced.
Figure 4: Possible final positions S4-S5 with 7th
arc and max range cruise line
Source: JIT/Google Earth
On 1 April (D25) the JIT advised AMSA/ ATSB of further aircraft performance and path analysis
starting at a distance further NW of Sumatra that had the effect of shifting the most probable area
NE within S4 and into S5. Probable impact areas red, yellow and green were defined within S4/S5
(Figure 5).
8 A drifted area is the computer modelled movement of a body of water over the period of time since 8 March to the
search day. This modelling incorporated wind and current effects on a variety of debris characteristics.

7
Figure 5: Red, yellow and green boxes within S4-S5 and M641 route
Source: JIT/Google Earth
The S4/S5 boundary on the 7th arc was considered the best starting location due to convergence
of a number of candidate paths using independent techniques and because airways route M641
passed through that location. By this stage drifted area B in Figure 6 was being searched. On
2-3 April (D26/ D27) a surface search of a drifted red area was commenced.
A summary of data used in planning search area refinements is shown at Appendix A: Information
used in determining and refining search areas.
Drifted search areas
For one month from 28 March (D21), areas along the 7th arc in the S3, S4 and S5 areas were
drifted to guide the conduct of the surface search. The original and drifted areas are shown in
Figure 6, comparison to other regions shown in Figure 7 - Figure 10.

8
Figure 6: Original and drifted search areas 28 Mar - 29 Apr (D21-D52)
Source: AMSA
Figure 7: D21-52 drifted area comparison – East Coast Australia
Source: AMSA

9
Figure 8: D21-52 drifted area comparison – Europe
Source: AMSA
Figure 9: D21-52 drifted area comparison – North America
Source: AMSA

10
Figure 10: D21-52 drifted area comparison – China
Source: AMSA
Debris sightings
A number of items were sighted by aircraft especially from Area A, though most of the sightings
were unable to be relocated by surface assets and no debris considered to be from MH370 was
recovered.

11
Acoustic search
Underwater locator beacons
The flight recorders fitted to 9M-MRO were equipped with Dukane DK100 underwater acoustic
beacons that activate on immersion in salt or fresh water. The beacons had the following
characteristics:
Operating frequency: 37.5 ± 1 kHz
Pulse Length: 10 ms
Repetition rate: 1 pulse per second
Operating life following immersion: minimum 30 days9
The nominal distance at which an underwater locator beacon (ULB) may be detected is
considered to be between 2,000 m to 3,000 m10
. However, the detection may be made at greater
range, about 4,500 m, under more favourable conditions. Many conditions influence the actual
detection range, environmental noise, the ability of the water to conduct the acoustic signal, and
the sensitivity of the equipment used to make the detection. In reality for a robust search a
maximum range to target area of approximately 1 km is used.
Acoustic search area definition
Search vessels with equipment capable of acoustic detections were en route to or near the 7th arc
on 2 April. The most probable arc crossings current on 2 April 2014 were the red/ yellow/ green
areas in Figure 6. The areas had been sized so that the primary TPL system embarked on
Australian Defence Vessel (ADV) Ocean Shield could cover the red area prior to the predicted
expiry of the flight recorder ULB batteries. ULB detection resources were deployed to commence
operations at the S4/S5 boundary within the red box and on the 7th arc.
Acoustic detections
HMS Echo
On 2 April 2014, the UK defence vessel HMS Echo, using a hull-mounted acoustic system
reported a possible ULB detection close to the 7th arc and S4/S5 boundary. The hull mounted
system was designed to provide high accuracy deep water positioning by monitoring the location
of subsea transponders operating between 27 kHz and 30.5 kHz. The acoustic system was
retuned to 37.5 kHz, by the crew of HMS Echo, to enable detection of the flight recorder ULB. On
3 April, following tests, this detection was discounted as being an artefact of the ship’s sonar
equipment.
MV Haixun 01
On the 4 April 2014, the crew of the Chinese Maritime Safety Administration vessel, MV
Haixun 01, were operating Benthos pinger detector equipment from a rescue boat at the Southern
end of the green zone in ocean depths of about 4,500m. The crew detected a pulsed signal with a
frequency of 37.5 kHz, repeating at once per second. A second detection on the same frequency
was made the next day, at a position about 3 km west of the first detection. The second detection
was reported to be a much weaker strength signal than the previous day.
9 The manufacturer predicted maximum life of the ULB batteries was 40 days. 10 Underwater Communications Specialist, Visiting Fellow, Australian Defence Force Academy, Canberra
12
The Benthos pinger locator specifications include:
Detectable frequency range: 5 kHz to 80 kHz
Practical ULB detection range: 2,000m
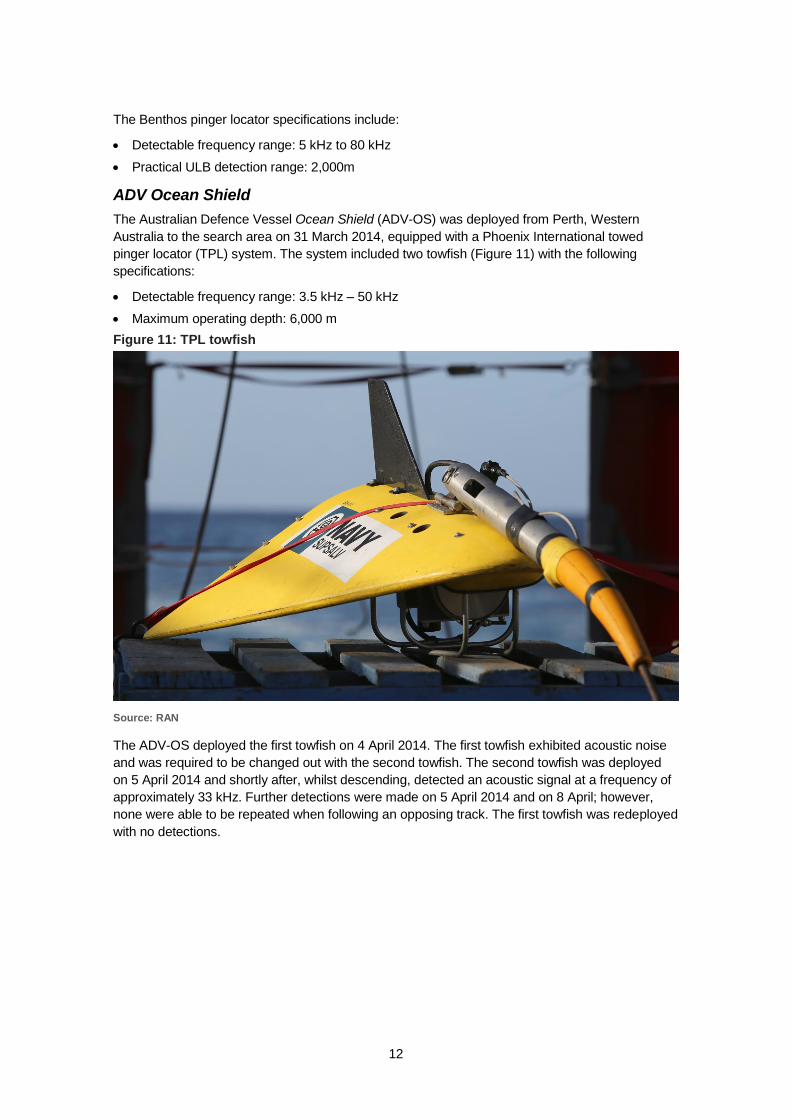
ADV Ocean Shield
The Australian Defence Vessel Ocean Shield (ADV-OS) was deployed from Perth, Western
Australia to the search area on 31 March 2014, equipped with a Phoenix International towed
pinger locator (TPL) system. The system included two towfish (Figure 11) with the following
specifications:
Detectable frequency range: 3.5 kHz – 50 kHz
Maximum operating depth: 6,000 m
Figure 11: TPL towfish
Source: RAN
The ADV-OS deployed the first towfish on 4 April 2014. The first towfish exhibited acoustic noise
and was required to be changed out with the second towfish. The second towfish was deployed
on 5 April 2014 and shortly after, whilst descending, detected an acoustic signal at a frequency of
approximately 33 kHz. Further detections were made on 5 April 2014 and on 8 April; however,
none were able to be repeated when following an opposing track. The first towfish was redeployed
with no detections.

13
Figure 12: Ocean Shield TPL search coverage 04-14 April
Source: Phoenix International
Analysis of acoustic detections
HMS Echo was tasked to the area of the MV Haixun 01 detections. HMS Echo reported that the
detections were unlikely due to the depth to the seafloor, surface noise and the equipment utilised.
A submarine tasked to the area was unable to get any detections.
A review of the Ocean Shield acoustic signals was undertaken independently by various
specialists. The analyses determined that the signals recorded were not consistent with the
nominal performance standards of the Dukane DK100 underwater acoustic beacon. The analyses
also noted that whilst unlikely, the acoustic signals could be consistent with a damaged ULB.
However, it was decided that that an ocean floor sonar search should be performed to fully
investigate the detections.
AP-3C sonobuoy acoustic search capability
When Australia joined the international effort to locate flight MH-370, the Australian Defence Force
and Australian Defence Industry worked together to enhance the search capabilities available to
the coordinating authorities. They provided an ability to detect a ULB signal at a range of up to
4,000 m water depth. This capability from an AP-3C aircraft was achieved by deploying
sonobuoys at a depth of 300m beneath the ocean surface. One sortie was capable of searching
an area of approximately 3,000 km2. Sonobuoy drops were undertaken from 6-16 April (D30-D40).
These sonobuoy drops were in the region of the 7th arc where depths were favourable and
specifically in the location of the Ocean Shield and Curtin University hydrophone bearing (see
later section) acoustic detections. No acoustic detections considered to be related to ULB
transmissions were detected using sonobuoys.

14
Ocean floor sonar survey in area of Ocean Shield acoustic detections
Based on the analysis of the acoustic detections on ADV-OS, an underwater sonar survey using
an autonomous underwater vehicle (AUV) commenced on 14 April 2014. 30 missions to depths
between 3,800 - 5,000 m were completed. The side scan sonar tasking comprising a 10 km radius
area around the most promising detection and a 3 km radius area around the other three
detections was completed on 28 May. The total area searched during this time was 860 km2 with
nil debris or wreckage detected. The ATSB considers that the search in the vicinity of the ADV-OS
acoustic detections is complete and the area can now be discounted as the final resting place of
MH370.
Figure 13: Ocean Shield AUV
Source: RAN
Further work is being carried out in an attempt to determine the likely source of the ADV-OS
acoustic detections.

15
Figure 14: Ocean Shield AUV coverage 14 April-28 May 2014 (Note Western detection was a sonobuoy detection of different frequency)
Source: RAN

16
Defining the search area
Search area introduction
Three factors were important in defining the search area along the 7th arc:
The position of the turn to the South from the previous North-West heading along the Malacca
Strait
Aircraft performance limitations
Analysis of the satellite-communications data
There was uncertainty associated with each of these factors.
Position of the turn to the South
The last primary radar return related to MH370 was at 1822 – this was the final positive fix for the
aircraft. At this time the aircraft was tracking north-west along the Malacca Strait. BFO data
associated with the satellite arc at 1825 indicated that it was likely that the aircraft was still tracking
north-west at this time. However, by the time of the 1941 arc, the BFO data indicated that the
aircraft was tracking in a south/south-easterly direction.
As no evidence was available to conclusively determine where the turn(s) to the south occurred,
two approaches were taken:
the satellite data analysis was performed using a range of assumed locations for the turn.
analyse the satellite data independently without assuming where the turn occurred. In this case
the better matching solutions should be checked for realistic times and distances between their
starting point and the position of the last primary radar point.
Aircraft performance limitations
Altitude, airspeed (Mach number at normal cruising altitudes) and wind are important parameters
in determining aircraft range and performance. At 1707, the last ACARS transmission from the
aircraft provided the total weight of the fuel remaining on board. Between that time and 1822,
while the aircraft was being tracked by primary radar, the aircraft’s speed and consequently fuel
burn could be estimated.
During the period of the aircraft tracking to the south, there was no altitude or speed data
available. While there was wind information available, it varied as a function of time, altitude and
location. As a consequence, a variety of speeds and altitudes had to be assumed when
calculating possible flight-paths using the satellite data.
The aircraft satellite transmission associated with the 7th arc is assumed to have been triggered by
power interruptions on board the aircraft caused by fuel exhaustion. The time of this transmission
is consistent with the maximum flight times expected for MH370.
Satellite data analysis
The satellite communications system comprises the on board equipment, satellite and ground
earth station. It is a reliable and high-performance communications system. In the case of MH370,
and in the absence of other data, it was necessary to use monitoring and maintenance data and,
in effect, convert a communications system into a positioning system. Without this data, it would
not have been possible to define a restricted search area at all but it should be appreciated that by
using the satellite data it was necessary to model and analyse tiny variations in otherwise very
stable signals. The satellite carrier frequencies are measured in GHz or 1 billion (1,000,000,000)
cycles per second. To put the numbers into perspective, a tolerance of ± 5 Hz in these signals
corresponds to a variation of ±0.0000005%.

17
Satellite system Information
Satellite communication (SATCOM) relies on transmissions between a ground station, a satellite
and a mobile terminal (the aircraft in this case) (Figure 15). The Boeing 777 uses a satellite link for
the following functions:
Audio communication
Interface with Aircraft Communication Addressing and Reporting System (ACARS)
In-Flight Entertainment equipment (IFE)
The system used during flight MH370 consisted of the Inmarsat Classic Aero ground station
located at Perth, Western Australia and the Inmarsat Indian Ocean Region (IOR) I-3 satellite. The
Classic Aero service uses a single global communication beam per satellite, and contains no
explicit information relating to the mobile terminal location being available.
Figure 15: Schematic of basic satellite communications
Source: Satellite Comms Working Group
The aircraft satellite communication system operates on L band11
, transmits at 1.6 GHz and
receives at 1.5 GHz for the satellite to/from aircraft RF links. The ground station to satellite RF
links use C band12
, transmitting at 6 GHz and receiving at 4 GHz.
There are a number of channels within those bands available for messages to be sent between
the satellite and earth station. One of the channels is called the P-Channel which the aircraft
continually listens to and is used for signalling and data transmissions from the ground to the
aircraft. The R-Channel is used for short signalling and data transmissions from the aircraft to the
ground.
In order to connect to the SATCOM system, the aircraft transmits a ‘log-on’ request on the
R-Channel which is acknowledged by the ground station. Once connected, if the ground station
11 L band refers to a part of the electromagnetic spectrum. 12 C band refers to a part of the electromagnetic spectrum.

18
has not heard from an aircraft within an hour13
, it will check that the connection is still operational
by transmitting a 'Log-on Interrogation’ message on the P-Channel using the aircraft’s unique
identifier. If the aircraft receives its ‘unique identifier’, it returns a short message on the R-Channel
that it is still logged onto the network. These processes have been described as handshakes.
After the last recorded primary radar data, at 1822, the following were recorded at the ground
station:
hhmm.ss
1st handshake initiated by the aircraft 1825.27
Unanswered ground to air telephone call 1839.52
2nd
handshake initiated by the ground station 1941.00
3rd handshake initiated by the ground station 2041.02
4th handshake initiated by the ground station 2141.24
5th handshake initiated by the ground station 2241.19
Unanswered ground to air telephone call 2313.58
6th handshake initiated by the ground station 0010.58
7th handshake initiated by the aircraft 0019.29
Aircraft did not respond to log-on interrogation from
the satellite earth ground station (failed handshake).
0115.56
For each R-Channel transmission, information is logged at the ground station including the burst
timing offset (BTO) and the burst frequency offset (BFO).
The recorded BTO and BFO at each transmission were used to estimate the track of the
aircraft. The BTO was used to estimate the distance of the aircraft from the satellite while the
BFO was used to estimate the speed and direction the aircraft was travelling relative to the
satellite. By combining these three parameters with aircraft performance constraints, a range of
candidate paths matching the BTO/BFO data can be found.
Two basic analysis techniques were used across the group:
Data-driven – attempting to match the BTO/BFO data exactly to a flight path with speed/
heading tolerances then filtering results for a reasonable aircraft flight path with respect to
aircraft performance.
Aircraft flight path/ mode driven – scoring a set of reasonable aircraft flight paths by their
statistical consistency with the BTO/BFO data14
.
Burst Timing Offset (BTO)15
For system efficiency and for the satellite communication to remain reliable, aircraft R-Channel
transmissions are in time slots referenced to the P-Channel as received by the aircraft. The BTO
is a measure of how long from the start of that time slot the transmission is received. This is
essentially the delay between when the transmission was expected (given a nominal position of
the aircraft) and when it actually arrives and is caused by the distance of the aircraft from the
satellite (Figure 16).
13 This time is determined by the expiration of an inactivity timer. At the time of the loss of 9M-MRO, the inactivity timer
was set to one hour. 14 The set of likelihood-weighted trajectories represents the Bayesian posterior distribution of aircraft flight path 15 Some additional information regarding BTO analysis is provided at Appendix G: Explanatory notes on BTO and BFO
analysis.

19
The BTO was only a relatively recent addition to the ground stations data set. It was added at the
suggestion of the satellite operator following the AF447 accident to assist in geo-locating an
aircraft.
Figure 16: Difference in time delays between nominal and actual locations
Source: Satellite Comms Working Group
A set of locations can be plotted on the surface of the earth at the calculated distance from the
satellite. The result is a ring of locations equidistant from the satellite (Figure 17).
Figure 17: Position ring defined by BTO measurement
Source: Satellite Comms Working Group
Ring of locations equidistant
from satellite on earth surface

20
For each completed handshake during flight MH370, the ground station recorded a BTO value
which defined a location ring solution (Figure 18).
Figure 18: BTO ring solutions for 9M-MRO
Source: Satellite Comms Working Group
An analysis of the SATCOM system parameters, and empirical comparison between the BTO
rings calculated for the time period when the aircraft was on the ground in Kuala Lumpur showed
that the tolerance was ±10 km. Figure 19 shows a section of the BTO solution for the
transmissions associated with the ACARS message overlaid on the flight track from flight MH370.
The distance between the transmission location and the BTO arc is approximately 5 km.

21
Figure 19: BTO solution arc for transmissions related to last ACARS data
Source: Satellite Comms Working Group
The aircraft estimated paths are therefore constrained to be within 10 km of the BTO defined rings
at the time associated with the recorded value. There is no information in the BTO to locate the
aircraft at any single point on that ring, however knowledge of the aircraft’s prior location and
performance speed limitations can reduce the ring to an arc.
Northern and southern aircraft performance limits
Using the remaining fuel reported at the last ACARS transmission and various assumed flight
speeds and altitudes, the range of the aircraft could be estimated. The potential search area can
be bounded by these performance limits (Figure 20).
The assumptions made for the performance calculations were the following:
The aircraft was flown at a constant altitude
The speed selected was operationally achievable for the given altitude
Aircraft required to cross the arcs at the times defined by the BTO values
Before the 1941 arc various path estimates were used including an immediate turn south after
the last radar point at 1822 and a turn at the north western limit at 1912
After the 1941 arc straight line segments between the arcs were flown
Wind effects were modelled
Modelling did not include individual engine efficiency

22
Figure 20: Performance limit of the aircraft in yellow - red lines indicate the intersection of the performance limit and the 7
th arc.
Source: ATSB
1st
and 7th
handshakes
The 1825 and 0019 SATCOM handshakes were log-on requests initiated by the aircraft. A log-on
request in the middle of a flight is not common and can occur for only a few reasons. These
include a power interruption to the aircraft satellite data unit (SDU), a software failure, loss of
critical systems providing input to the SDU or a loss of the link due to aircraft attitude. An analysis
was performed which determined that the characteristics and timing of the logon requests were
best matched as resulting from power interruption to the SDU.
Approximately 90 seconds after the 1825 log-on request, communications from the IFE (In Flight
Entertainment) system on the aircraft were recorded in the SATCOM log. Similar messages would
be expected after the 00:19 logon request, however none were received. This could indicate a
complete loss of generated electrical power shortly after the 7th handshake.
Because the location of the 0019 arc is also consistent with estimates of the aircraft range
calculated from the remaining fuel quantity provided by the last ACARS transmission, the 7th arc is
the focus of the search area.
Using the satellite system information, specifically the location rings determined from the BTO and
the current understanding of the cause of the 7th handshake (log-on request) as being related to
the fuel exhaustion of the aircraft, the focus of the search area will be along the 00:19 arc. The
distance from the arc will be discussed in the section on the search area width.
Burst Frequency Offset (BFO)16
The burst frequency offset (BFO) is the recorded value of the difference between the received
signal frequency and the nominal frequency at the Ground earth station (GES). The BFO consists
of three major components:
16 Some additional information regarding BFO analysis is provided at Appendix G: Explanatory notes on BTO and BFO
analysis.
Southern Limit
Northern Limit

23
An offset (fixed frequency bias) generated by various components
Frequency errors related to frequency translation in the satellite
Frequency errors related to the Doppler Effect on transmissions and associated
compensations
The offset could be estimated from the earlier parts of the flight where the location and behaviour
of the aircraft was known. For MH370, the estimate was 150 Hz. Due to an observed tolerance of
the data of ±5 Hz, the satellite working group used a variety of offsets from 145-155 Hz.
Frequency translation errors are introduced when the transmission frequency is shifted from the L
to the C band at the satellite. Translation errors relate to the characteristics of the local oscillators
which perform the translation. For example, the oscillators are sensitive to temperature, so when
the satellite is in eclipse (shadow of the earth) the oscillators cool down, affecting the frequency
translation.
Doppler errors are introduced by relative motion of the aircraft to the satellite, and the satellite to
the ground station. The general principle is that when two objects are moving away from each
other the frequency decreases and when they are moving towards each other the frequency
increases.
The total contributions to the BFO of the transmissions from MH370 are shown in Figure 21.
Figure 21: Total of BFO contributions
Source: Satellite Comms Working Group
The satellite communication system has controls in place to reduce the changes in frequency in
order to ensure that communications are maintained within a channel. Corrections are made on
the aircraft and at the ground station for known frequency shifts throughout the transmission.
These corrections do not remove all the errors as the magnitude of the offsets are well within the
system’s normal operating requirements.
The Inmarsat Classic Aero land earth station uses an enhanced automatic frequency control
(EAFC) module to correct for Doppler error in the satellite to ground station transmissions and a
fixed translation bias.
24
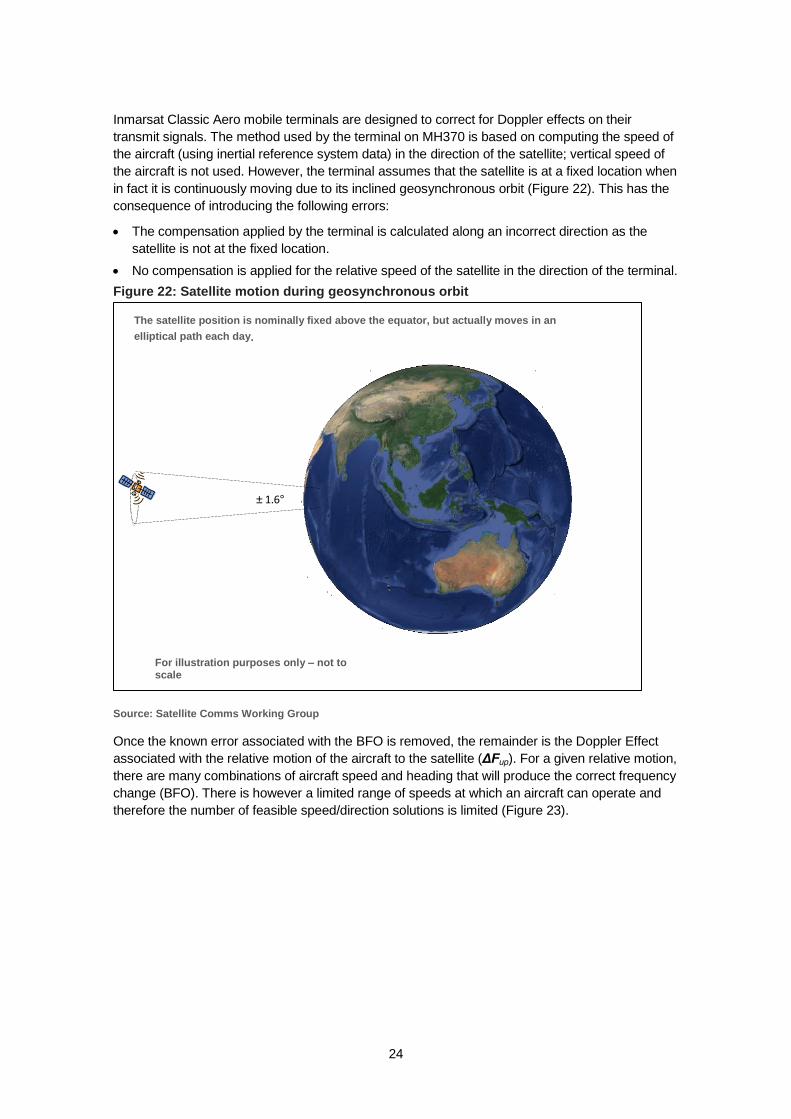
Inmarsat Classic Aero mobile terminals are designed to correct for Doppler effects on their
transmit signals. The method used by the terminal on MH370 is based on computing the speed of
the aircraft (using inertial reference system data) in the direction of the satellite; vertical speed of
the aircraft is not used. However, the terminal assumes that the satellite is at a fixed location when
in fact it is continuously moving due to its inclined geosynchronous orbit (Figure 22). This has the
consequence of introducing the following errors:
The compensation applied by the terminal is calculated along an incorrect direction as the
satellite is not at the fixed location.
No compensation is applied for the relative speed of the satellite in the direction of the terminal.
Figure 22: Satellite motion during geosynchronous orbit
Source: Satellite Comms Working Group
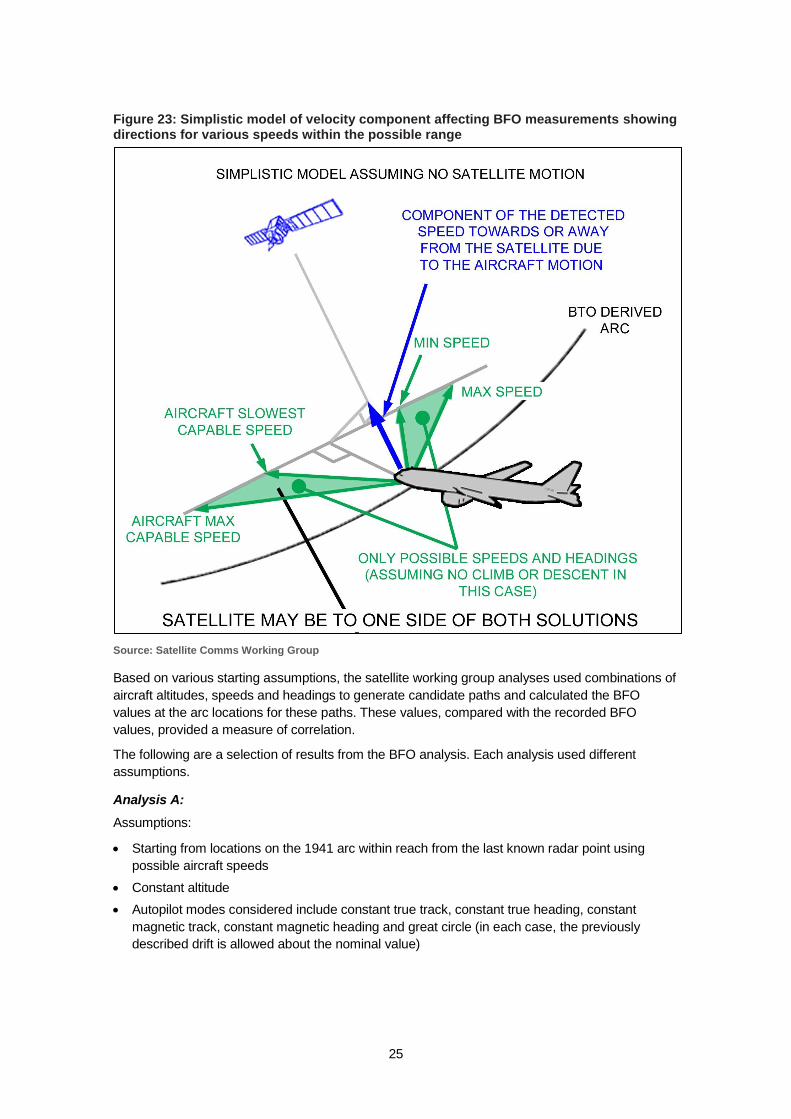
Once the known error associated with the BFO is removed, the remainder is the Doppler Effect
associated with the relative motion of the aircraft to the satellite (ΔFup). For a given relative motion,
there are many combinations of aircraft speed and heading that will produce the correct frequency
change (BFO). There is however a limited range of speeds at which an aircraft can operate and
therefore the number of feasible speed/direction solutions is limited (Figure 23).
For illustration purposes only – not to scale
The satellite position is nominally fixed above the equator, but actually moves in an
elliptical path each day.
± 1.6°
25
Figure 23: Simplistic model of velocity component affecting BFO measurements showing directions for various speeds within the possible range
Source: Satellite Comms Working Group
Based on various starting assumptions, the satellite working group analyses used combinations of
aircraft altitudes, speeds and headings to generate candidate paths and calculated the BFO
values at the arc locations for these paths. These values, compared with the recorded BFO
values, provided a measure of correlation.
The following are a selection of results from the BFO analysis. Each analysis used different
assumptions.
Analysis A:
Assumptions:
Starting from locations on the 1941 arc within reach from the last known radar point using
possible aircraft speeds
Constant altitude
Autopilot modes considered include constant true track, constant true heading, constant
magnetic track, constant magnetic heading and great circle (in each case, the previously
described drift is allowed about the nominal value)

26
Speed and heading modelled by a process17
in which values may drift over time but tend to
revert to a fixed (unknown) nominal value
Wind effects modelled
Error models used:
BTO: Gaussian standard deviation of 26 microseconds
BFO: Bias uniform (147-152). Random error Gaussian standard deviation 5 Hz
Analysis up to 0011 arc
Generated paths scored according to their statistical consistency with the measured BFO and
BTO values
Figure 24: Analysis A results - red / orange/ green paths represent the highest correlation with satellite data
Source: Satellite Working Group
Analysis B
Assumptions:
Initial track takes a northern hook around the tip of Sumatra
Constant altitude
Constant groundspeed
Heading changes allowed at each arc crossing
17 Ornstein-Uhlenbeck stochastic process.

27
Straight line segments between arcs
Figure 25: Analysis B results - white paths represent highest correlation with satellite data
Source: Satellite Working Group
Analysis C
Assumptions:
Initial track takes a northern hook around the tip of Sumatra
Constant altitude
Groundspeed can change at each arc crossing
Heading changes allowed at each arc crossing
Straight line segments between arcs

28
Figure 26: Analysis C results: Showing only the top 100 ranked tracks of 5000 candidates
Source: Satellite Working Group
The various results from the analysis were generally in agreement.
From each of the different analyses, the highest correlation paths were compared and each
crossed the 7th arc within 450 km of each other. The greatest effect on the paths was from
changing the value of the fixed frequency bias. A sensitivity study determined that a change of
1 Hz in the fixed frequency bias was approximately equal to 100 km along the 7th arc. In order to
appropriately bound the results, the most northern and southern solutions were used and an error
margin of 5 Hz (observed tolerance of the FFB) or 500 km was applied (Figure 27).

29
Figure 27: Aircraft performance bounds and narrower limits based on the higher
correlation area from the BFO analyses with 5 Hz tolerance on fixed frequency bias
Source: ATSB
Verification and validation of BFO analysis
The BFO analysis was validated by several methods:
An independent recreation of the satellite communication system model. This simulation was
able to prove definitively that the BFO value is influenced by the location, speed and heading
of the aircraft.
Paths were generated starting from the last radar point assuming a single turn followed by a
predominantly straight track. These paths were propagated in all directions, unconstrained by
the BTO data locations (Figure 28). The BFO, at the times of the handshakes, was predicted
for all the paths. In the paths that intersect the measured BFO values (red dots) are cyan and
yellow coloured paths ending in the southern Indian Ocean (Figure 29). This was able to
confirm that the southern corridor was the only valid solution.

30
Figure 28: 1000 paths generated, unconstrained by the BTO and BFO values.
Source: Satellite Working Group
Figure 29: Above 1000 paths predicted BFO - red dots are the recorded values from MH370
Source: Satellite Working Group

31
Using nine previous flights of the accident aircraft (registered 9M-MRO) and 87 other aircraft
with the same SATCOM terminal equipment in the air at the same time as MH370, some path
prediction analysis techniques were verified. Shown below are two examples of comparative
path estimations performed on sister ship flights departing Kuala Lumpur on the same day as
MH370. Using only the starting location and an equivalent number, and approximate time
spacing, of BFO and BTO values as the accident flight, predicted paths were created and
compared against the actual flight paths (Figure 30 and Figure 31).
Figure 30: MH021 07 March 2014 - The red path is predicted path from BTO/BFO values; yellow track is the actual aircraft track
Source: Satellite Working Group

32
Figure 31: MH009 07 March 2014 - The red path is predicted path from BTO/BFO values; blue track is the actual aircraft track.
Source: Satellite Working Group
Determining the width of the search area
The width of the search area across the 7th arc is shown in Figure 32.
Figure 32: Description of the width of the search area
Source: ATSB

33
The final two SATCOM transmissions from the aircraft at 0019.29 (log on request) and 0019.37
(log on acknowledge) provided the last factual data related to the position of the aircraft. These
transmissions placed the aircraft somewhere on the final arc but did not define a particular point
on the arc.
There are several reasons why the aircraft satellite data unit (SDU) might generate a SATCOM
log on request but an interruption to the aircraft electrical power supply was considered to be the
most likely reason.
Aircraft electrical system
The electrical system on the B777 supplies 115 V AC and 28 V DC power. The main power
sources are a left integrated drive generator (IDG) and a right IDG, powered by the left and right
engines respectively. An auxiliary power unit (APU) can supply power if either or both of the IDGs
are unavailable. The SDU was powered by 115 V AC from the left AC bus which was normally
supplied by the left IDG. If power from the left IDG was lost, then a bus tie breaker would close
and power would be automatically transferred from the right AC bus. Similarly, if power was lost
from the right AC bus, power would be automatically transferred from the left AC bus. This power
switching is brief and the SDU was designed to ‘hold-up’ during such power interruptions. To
experience a power interruption sufficiently long to generate a log on request, it was considered
that a loss of both AC buses or, a disabling of the automatic switching, would be required.
At 00:19, the aircraft had been airborne for 7 hours and 38 minutes18
and fuel exhaustion was a
distinct possibility. When a fuel tank was depleted, the corresponding engine would ‘flame-out’,
spool-down and the electrical generator it was driving would drop off-line and no longer provide
electrical power to its associated AC bus. Accident investigations show that when fuel exhaustion
has occurred, typically one engine will flame-out before the other. In the case of MH370 it is likely
that one engine has flamed-out followed, within minutes, by the other engine.
SDU power-up
Following the loss of AC power on both buses19
, the SDU would have experienced a power
interruption sufficiently long to force a shut-down, the aircraft’s ram air turbine20
(RAT) would
deploy from the fuselage into the aircraft’s slipstream and the APU would auto-start. The APU
would take approximately one minute to start-up and come ‘on-line’ after which time it could have
provided electrical power21
to the SDU. After power became available, the SDU would take
approximately 2 minutes and 40 seconds to reach the log on stage evidenced in the SATCOM log
at 0019.29.
If engaged, the autopilot could have remained engaged following the first engine flame-out but
would have disengaged after the second engine flamed-out. By the time of the SATCOM log on
message, the autopilot would have been disengaged for approximately 3 minutes and 40
seconds. If there were no control inputs then it would be expected that eventually a spiral descent
would develop. In the event of control inputs, it is possible that, depending on altitude, the aircraft
could glide for 100+ NM.
18 A typical flight time from Kuala Lumpur to Beijing was 5 ½ hours. 19 The earlier SDU log on request at 18:25 UTC was also considered likely to have been due to a power interruption. As
this power interruption was not due to engine-flame outs, it is possible that it was due to manual switching of the
electrical system. Therefore it is possible that the aircraft’s electrical configuration was not in the normal state (i.e. the
left IDG powering the left AC bus and the right IDG powering the right AC bus) at the time that the first engine flamed-
out. 20 The RAT provides limited hydraulic and electrical power for instrumentation and flight controls. 21 The APU is supplied with fuel from the same tank as the left engine. Operation of the APU, after the left engine
flamed-out, would be unreliable and would be of short duration before it too flamed-out.

34
Review of previous accidents
To assist in determining what may have occurred at the end of the flight, a review was performed
by the ATSB of a sample of previous accidents. This review included the results of an analysis22
by the BEA.
The ATSB reviewed three general classes of accidents that were relevant to the cruise phase of
flight:
An in-flight upset generally characterised by:
normal radio communications
normal en route manoeuvring of the aircraft
upset event such as a stall due to icing, thunderstorm, system failure etc
pilot control inputs
rapid loss of control
An unresponsive crew/ hypoxia event generally characterised by:
failure of the aircraft to pressurise during initial climb
loss of radio communications
long period without any en route manoeuvring of the aircraft
a steadily maintained cruise altitude
fuel exhaustion and descent
no pilot intervention
loss of control
A glide event generally characterised by:
normal radio communications
normal en route manoeuvring of the aircraft
engine failure/fuel exhaustion event(s)
pilot-controlled glide
Examples of these accident types are listed in Appendices C – E.
End of flight scenario
Note: Given the imprecise nature of the SATCOM data, it was necessary to make some
assumptions regarding pilot control inputs in order to define a search area of a practical
size. These assumptions were only made for the purposes of defining a search area and
there is no suggestion that the investigation authority will make similar assumptions.
The limited evidence available for MH370 was compared with the accident classes listed
previously.
In the case of MH370, there were multiple redundant communications systems fitted to the aircraft
(3 x VHF radios, 2 x HF radios, SATCOM system, 2 x ATC transponders). However, no radio
communications were received from the aircraft after 1719.29, 7 hours prior to the last SATCOM
handshake at 00:19. Analysis of the SATCOM data also showed that there were probably no large
changes to the aircraft’s track after approximately 1915, about 5 hours prior to the last SATCOM
handshake.
Given these observations, the final stages of the unresponsive crew/ hypoxia event type appeared
to best fit the available evidence for the final period of MH370’s flight when it was heading in a
generally southerly direction:
22 Metron Scientific Solutions Report: Search Analysis for the Location of the AF447 Underwater Wreckage
20 January 2011.

35
loss of radio communications
long period without any en route manoeuvring of the aircraft
a steadily maintained cruise altitude
fuel exhaustion and descent
This suggested that, for MH370, it was possible that after a long period of flight under autopilot
control, fuel exhaustion would occur followed by a loss of control without any control inputs.
Note: This suggestion is made for the sole purpose of assisting to define a search area.
The determination of the actual factors involved in the loss of MH370 are the responsibility
of the accident investigation authority and not the SSWG.
Also allowing for the fact that a maximum glide distance of 100+ NM would result in an
impractically large search area, the search team considered that it was reasonable to assume that
there were no control inputs following the flame-out of the second engine. Accordingly the aircraft
would descend and, as there would be some asymmetry due to uneven engine thrust/drag or
external forces e.g. wind, the descent would develop into a spiral.
As the BEA found in their study, in the case of an upset followed by a loss of control, all the impact
points occurred within 20 NM from the point at which the emergency began and, in the majority of
cases, within 10 NM.
For the small number of hypoxia cases that were available for review, the starting time of the loss
of control was not always as well defined as for the upset cases, so the 20 NM range might not be
as applicable. Balancing this was the consideration that, by the time of the final SATCOM log on
message, the autopilot could have been disengaged for approximately 3 minutes and 40 seconds
and the aircraft would have been descending during that period.
Width of the search area - summary
The position of the aircraft along the final arc was relatively inaccurately known due to the many
combinations of starting position, heading, altitude and ground speed that could be matched to the
BTO and BFO data.
The search strategy needed to take into account these relative accuracies and minimise the width
of the search area as far as practicable to allow a longer search distance along the arc. The
uncertainty in the width of the search area should be in balance with the uncertainty in the length
of the search area.
The BFO data showed that the aircraft track at the time of final arc was approximately across the
arc from North-West to South-East. As a consequence, the search distance to the East (right) of
the arc should be larger than the search distance to the West (left) of the arc.
Based on all the above, it seems reasonable to propose a search width of 50 NM (20 NM to the
left of the arc and 30 NM to the right of the arc). A 50 NM (93 km) search width would allow a
search distance of about 350 NM (650 km) along the arc.
A summary of assumptions to define the width is shown at Table 1.

36
Tab
le 1
: Defin
ing
the s
earc
h w
idth
Pro
bab
ility o
f
inclu
din
g th
e
wre
ckag
e s
ite:
Assu
mp
tion
s:
(Ad
d ±
5 N
M to
all th
e d
ista
nces d
ue to
the to
lera
nce in
the p
ositio
n o
f the a
rc)
Dim
en
sio
ns:
Resu
ltan
t searc
h
len
gth
alo
ng
the
arc
:
Co
mm
en
ts:
Hig
her
Low
er
Max. d
ista
nce u
npow
ere
d g
lide B
777 fro
m F
L350 (1
20 N
M).
± 1
25 N
M
(250 N
M)
70 N
M
130 k
m
Giv
en th
e u
ncerta
inty
of w
here
the
airc
raft c
rossed th
e a
rc, th
ese s
earc
h
wid
ths g
ive im
pra
ctic
ally
sm
all s
earc
h
length
s a
long th
e a
rc.
Max. d
ista
nce u
npow
ere
d g
lide fro
m O
EI a
ltitude o
f FL290 (9
0 N
M).
± 9
5 N
M
(190 N
M)
103 N
M
191 k
m
Realis
tic d
ista
nce u
npow
ere
d g
lide (6
0 N
M) fro
m F
L290 to
exte
nd ra
nge b
ut n
o tu
rn b
ack.
+ 6
5 N
M
- 20 N
M
(85 N
M)
206 N
M
381 k
m
No p
ilot o
r auto
pilo
t inputs
Use d
ista
nces fro
m B
EA
/AT
SB
stu
dy o
f loss o
f contro
l accid
ents
(20 N
M) p
lus 5
NM
± 3
0 N
M
(60 N
M)
292 N
M
540 k
m
Reasonable
searc
h w
idth
.
No p
ilot o
r auto
pilo
t inputs
Use d
ista
nces fro
m B
EA
/AT
SB
stu
dy p
lus 5
NM
Movin
g in
dire
ctio
n o
f pre
vio
us tra
ck i.e
. reduce ‘–
‘ dire
ctio
n b
y 1
0 N
M
+ 3
0 N
M
- 20 N
M
(50 N
M)
350 N
M
648 k
m
Reasonable
searc
h w
idth
.
No p
ilot o
r auto
pilo
t inputs
Use d
ista
nces fro
m B
EA
/AT
SB
stu
dy
Movin
g in
dire
ctio
n o
f pre
vio
us tra
ck i.e
. reduce ‘–
‘ dire
ctio
n b
y 5
NM
+ 2
5 N
M
-15 N
M
(40 N
M)
437 N
M
810 k
m
The B
EA
/AT
SB
case s
tudie
s
genera
lly in
volv
e ra
pid
ly d
evelo
pin
g
descents
and s
hort to
tal u
pset
dura
tions (m
ost c
ases a
re <
2
min
ute
s). M
H370 m
ay n
ot c
orre
late
well w
ith th
e c
ase s
tudie
s a
nd th
e 2
0
NM
dis
tance s
uggeste
d fro
m th
e
stu
dy m
ight n
ot b
e a
pplic
able
. A b
uffe
r
above th
e 2
0 N
M d
ista
nce is
advis
able
.
No p
ilot o
r auto
pilo
t inputs
Use d
ista
nces fro
m B
EA
/AT
SB
stu
dy
Movin
g in
dire
ctio
n o
f pre
vio
us tra
ck i.e
. reduce ‘–
‘ dire
ctio
n b
y 5
NM
Ignore
±5 N
M a
rc to
lera
nce
+ 2
0 N
M
-10 N
M
(30 N
M)
583 N
M
1,0
80 k
m

37
Other information considered
Air routes
General
All modern transport category aircraft, such as the B777, have a Flight Management System
(FMS). An FMS is an integrated suite of navigation sensors, receivers and computers, coupled
with navigation and performance databases. These systems provide performance and guidance
information to the cockpit displays and the autopilot. Among other functions, the FMS uses the
navigation database for lateral (horizontal) navigation (LNAV) which includes airway23
and
waypoint information24
. There are two different types of waypoints:
navigation database waypoints
pilot-defined waypoints
Before take-off, a flight-plan route will be entered into the FMS. The route typically consists of a
standard instrument departure from the origin airport, a series of en-route waypoints, a standard
arrival procedure at the destination airport and a missed approach procedure.
The flight-plan can be uploaded automatically using ACARS or manually entered by the crew. In
either case, the flight-planned route will be cross-checked by the crew and then must be manually
activated by the flight crew. Two routes can be stored in the FMS although only one can be active
at any time.
The standard autopilot mode for en-route lateral navigation is LNAV, where the aircraft tracks
directly between waypoints along a great circle25
route and the aircraft heading will be
automatically adjusted to allow for the wind (sensed by the inertial reference unit).
In-flight, the flight-planned route can be changed by the crew selecting a different lateral
navigation mode or maintaining LNAV and changing the route entered in the FMS. Other lateral
navigation modes include:
heading hold (either a true or magnetic heading can be selected)
track hold (either a true or magnetic heading can be selected)
With these modes the track or heading is manually selected on the mode control panel on the
glare-shield. True or normal reference is selected by the crew using a switch located on the
Captain’s inboard display panel. Normal reference is the usual setting which references magnetic
North, unless the aircraft is operating at high latitudes, in which case the reference will change to
true North. True North reference can be manually selected by the crew using the switch26
.
23 An airway is a navigation corridor along a standard air route. 24 A waypoint is a predetermined geographical position that is defined in terms of latitude/longitude coordinates.
Waypoints may be a simple named point in space or associated with existing navigation aids, intersections or fixes. 25 A great circle is the shortest distance between two points on a sphere. 26 In the case of MH370, for any possible track, fuel exhaustion would have occurred prior to reaching a latitude at which
the aircraft would have automatically selected a true North reference.

38
Figure 33: B777 LNAV mode and track/ heading hold selectors
Source: Boeing
If using LNAV, the crew can enter new waypoints or change/delete existing waypoints. There is
complete flexibility in the waypoints that can be entered, for example pilot-defined waypoints can
be defined by the following methods:
place/bearing/distance
place bearing/place bearing
along track
latitude/longitude
course intersection
MH370
Radar data showed that after take-off MH370 tracked in accordance with its flight-planned route to
waypoint IGARI and then turned right towards waypoint BITOD. Secondary radar data was lost
shortly afterwards. Primary radar data then showed that MH370 deviated from its flight-planned
route.
Primary radar data showed that the aircraft tracked along the Malacca Strait. During this time the
aircraft passed close to waypoints VAMPI, MEKAR, NILAM and possibly IGOGU along a section
of airway N571.
Southern air routes/waypoints
Air routes and waypoints were then examined to see if there was any correlation with the possible
southern tracks for MH370 obtained from the analysis of the SATCOM data. Relevant southern air
routes that MH370 may have intersected/traversed were N509, N640, L894 and M641. Waypoints
associated with these air routes were also considered as possible points on the MH370 flight path.
N509 ELATI 0200.0S 08957.7E PORT HEDLAND
N640 TRIVANDRUM BIKOK 0817.0N 07836.0E COLOMBO LEARMONTH MOUNT HOPE ADELAIDE
L894 KITAL 2003.0N 06018.0E MALE SUNAN 0028.7S 07800.0E DADAR 0200.0S 07927.1E PERTH

39
M641 MADURAI BIKOK 0817.0N 07836.0E COLOMBO COCOS IS
Figure 34: Southern Indian Ocean air routes and selected waypoints
The waypoints at MUTMI and RUNUT were also considered as possible points that MH370 may
have crossed. However ground tracks through these points did not correlate well with the most
favoured paths generated through the analysis of the BFO and BTO data.
Air routes/ waypoints summary
Although waypoints and air routes were examined and compared to possible tracks derived from
analysis of the SATCOM data, there was insufficient evidence to positively determine whether
MH370 intersected any waypoints associated with published air routes in the Southern Indian
Ocean.

40
Hydrophones
Low frequency hydro-acoustic signals present in the Indian Ocean were examined to determine
whether they could provide any information to help define the search area. These signals were
recorded by hydrophones as part of the United Nations Comprehensive Nuclear-Test-Ban-Treaty
Organisation (CTBTO) or the Integrated Marine Observing System (IMOS).
Recordings of low-frequency underwater acoustic signals from data loggers and hydrophones off
the WA coast were retrieved and analysed by Curtin University’s Centre for Marine Science and
Technology during the search for MH370.
The ATSB requested the Curtin University Centre for Marine Science and Technology (CMST)
and DSTO analyse these signals in an attempt to detect and localise underwater sounds that
could be associated with the impact of the aircraft on the water or with the implosion of wreckage
as the aircraft sank.
One acoustic event of interest was identified that occurred at a time that may have potentially
linked it to MH370. This event appeared to have been received on one of the IMOS recorders
near the Perth Canyon (RCS) and at the CTBTO hydro-acoustic station at Cape Leeuwin (HA01).
A detailed analysis of these signals has resulted in an approximate localisation for the source that
was compatible with the time of the last satellite handshake with the aircraft, but incompatible with
the satellite to aircraft range derived from this handshake.
Figure 35: Map showing most probable location for the source of the received sound signals (magenta asterisk) and the uncertainty region (yellow polygon) based on an uncertainty of +/- 0.75° in the bearing from HA01 and a +/- 4s uncertainty in the difference between signal arrival times at RCS and HA01
Source: Curtin University
The ATSB greatly appreciates the work and cooperation of Curtin University on this matter.
More information regarding these signals can be found at
http://news.curtin.edu.au/media-releases/curtin-researchers-search-acoustic-evidence-mh370/.
A summary of Curtin University analysis is shown at Appendix B: Hydrophones – Curtin University
Executive Summary. The ATSB will continue to discuss any further information with Curtin
University for the purposes of the search.

41
Underwater search area The ATSB defined underwater search areas using an aggregate of the results from five
independent analyses. Individual solutions had provided either a preferred flight path or a range of
candidate flight paths spanning a length along the seventh arc. The results showed a high degree
of correlation between the preferred paths and the high ranking candidate paths.
The search strategy working group combined this analysis with the location of the 7th arc and
width analysis discussed above to derive three search areas. These three search areas were
designated wide, medium and priority. The location, size, derivation and position are shown in
Table 2 and Figure 36.
Table 2: Designated Underwater Search Areas
Area/ Size Colour Latitude lower bound
on arc
Latitude upper bound
on arc
Width across arc
1 - Priority area Orange Priority area definition for
the RFT limited to 350 NM
(650 km) covering the high
probability area based on
the ATSB evaluation of the
working group results.
Priority area definition for
the RFT limited to 350 NM
(650 km) covering the high
probability area based on
the ATSB evaluation of the
working group results.
Loss of control study, tolerance of
the arc, balance of uncertainties
and priority area for RFT of
60,000 km².
60,450 km² -32.1 -27.4 +30 NM, -20 NM
2 - Medium area Blue Spans the highest
correlation results from
multiple analyses and error
margin based on a fixed
frequency bias tolerance of
5Hz (5Hz is equivalent to
approximately 500 km
variation at the 7th arc).
Spans the highest
correlation results from
multiple analyses and error
margin based on a fixed
frequency bias tolerance of
5 Hz (5 Hz is equivalent to
approximately 500 km
variation at the 7th arc).
Forward of the arc -
Reasonable glide distance
(performance of average pilot)
starting from 3.5 minutes before
final arc (approximately 30 NM)
Behind the arc - loss of control
limit. Both include the 5 NM
tolerance of the arc.
240,000 km² -34.7 -24.4 +60 NM,-30 NM
3 - Wide area Grey Southern range
performance limit including
a possible 100 NM along
the arc.
Northern range
performance limit including
a possible 100 NM along
the arc.
Maximum glide range from
30,000 ft including wind effects.
1,120,000 km² -39 -16.4 ±100NM
Source: ATSB
The limited data resulted in a large wide area (grey) needed to represent a high confidence in
localising the aircraft. The medium area (blue) was calculated by using the ranking of candidate
tracks contained within several of the analysis. Although still of reasonably high confidence, and
relatively large, this reduced area does not contain all the possible derived paths.

42
Figure 36: Underwater Search Areas - Wide (Grey), Medium (Blue) and Priority (Orange) shown in comparison to S3/S5 and red, yellow, green search areas
Source: ATSB
Through consideration of the convergence of the preferred paths and highest ranked candidate
paths a priority area (orange) was determined. This area is intended to be the priority area for
deployment of the underwater search assets obtained through the RFT. Should additional assets
become available, then underwater sections in the medium (blue) area may also be searched.
The potential aircraft location, where the derived flight paths cross the 7th arc, is very sensitive to
variations in BFO frequency. A 10 Hz variation in the fixed frequency bias can result in the derived
flight path at the arc moving 1,000 km.
Work is continuing by the group to define particular areas within the orange priority area in which
to commence the underwater phase of the search.
Additionally, work is continuing with incremental refinements in the BFO characterisation in
particular the EAFC .The ongoing refinement may result in search assets deployment outside the
currently defined priority area (orange) into the medium (blue) area.
A map of the recommended underwater search areas is at Appendix F: Search Strategy Working
Group underwater search areas.

43
Acronyms AAIB Air Accidents Investigation Branch (UK)
AC Alternating Current
ACARS Aircraft Communications Addressing and Reporting System
ADV Australian Defence Vessel
AF447 Air France Flight 447
AH Artificial Horizon
AMSA Australian Maritime Safety Authority
APU Auxiliary Power Unit
ATC Air Traffic Control
ATSB Australian Transport Safety Bureau
AUV Autonomous Underwater Vehicle
BEA Bureau d'Enquêtes et d'Analyses pour la Sécurité de l'Aviation Civile
BFO Burst Frequency Offset
BTO Burst Timing Offset
CMST Curtin University Centre for Marine Science and Technology
CTBO Comprehensive Nuclear-Test-Ban-Treaty Organisation
CVR Cockpit Voice Recorder
DC Direct Current
DSTO Defence Science and Technology Organisation
EAFC Enhanced Automatic Frequency Control
FDR Flight Data Recorder
FFB Fixed Frequency Bias
FL Flight Level (altitude in units of 100 ft)
FMS Flight Management System
FPM Feet Per Minute
GES Ground Earth Station
GHz Gigahertz (1 x 10⁹ cycles per second)
GMT Greenwich Mean Time
HF High Frequency
IDG Integrated Drive Generator
IFE In-flight Entertainment System
IMOS Integrated Marine Observing System
IOR Indian Ocean Region
IRS Inertial Reference System
JACC Joint Agency Coordination Centre
JIT Joint Investigation Team
KHZ Kilohertz (1 thousand cycles per second)
KM Kilometre
KT Knot (1 NM per hour)
LNAV Lateral Navigation
LOC Loss Of Control
MAS Malaysian Airline System
MH370 Malaysia Airlines Flight 370

44
MV Motor Vessel
NM Nautical Mile (1.852 km)
NTSB National Transportation Safety Board (USA)
OEI One Engine Inoperative
RAT Ram Air Turbine
SA Situational Awareness
SATCOM Satellite Communications
SDU Satellite Data Unit
SITA Société Internationale de Télécommunications Aéronautiques
SSWG Search Strategy Working Group
SW South West
TPL Towed Pinger Locator
UK United Kingdom
ULB Underwater Locator Beacon
USA United States of America
UTC Coordinated Universal Time
V/S Vertical Speed
VHF Very High Frequency
Z Zulu - a time zone reference (interchangeable with GMT & UTC)

45
List of Appendices Appendix A: Information used in determining and refining search areas
Appendix B: Hydrophones – Curtin University Executive Summary
Appendix C: Accident case studies – loss of control accidents
Appendix D: Accident case studies – unresponsive crew/ hypoxia accidents
Appendix E: Accident case studies – a sample of accidents involving a glide
Appendix F: Search Strategy Working Group underwater search areas
Appendix G: Explanatory notes on BTO and BFO analysis

46
Ap
pen
dix
A: In
form
atio
n u
sed
in d
ete
rmin
ing
an
d re
finin
g s
earc
h a
reas
Date
s
17-2
7 M
arc
h 2
014
28 M
arc
h –
01 A
pril 2
014
02 -2
8 A
pril 2
014
Ju
ne 2
014
Even
t In
itial S
urfa
ce S
earc
h A
rea
Refin
ed S
urfa
ce S
earc
h A
rea
S
econd R
efin
em
ent to
Searc
h
Pro
posed U
nderw
ate
r
Searc
h A
rea
Pro
bab
le
Imp
act a
rea
S1/S
2
S3/S
4 s
tartin
g fro
m s
outh
erly
regio
n o
f S4
S4/S
5 s
tartin
g a
t S4/S
5 b
oundary
and d
efin
ed b
y re
d/ y
ello
w/g
reen a
reas
South
erly
regio
n o
f S4
Data
used
in
pla
nn
ing
searc
h a
rea
refin
em
en
t
• Fixe
d s
ate
llite lo
catio
n
• Turn
south
occurre
d a
t the
north
ern
tip o
f Sum
atra
• Perfo
rmance p
redic
tions b
ased
on s
peed a
nd ra
nge o
nly
with
no w
ind c
onsid
era
tion
• Only
positio
nal in
form
atio
n fro
m
Mala
ysia
n p
rimary
radar d
ata
• Length
of a
rc to
the s
outh
constra
ined b
y m
axim
um
airc
raft g
roundspeed
• Late
ral n
avig
atio
n s
et to
‘track’
mode
• Tw
o s
peeds p
rovid
ed ‘b
est fit`
with
longest a
nd s
traig
hte
st
tracks re
achin
g th
e 6
th a
rc.
• Assum
ed s
peed/ a
ltitude to
last
radar p
oin
t was fin
al A
CA
RS
valu
es
• Gre
ate
r confid
ence in
incre
ased s
peeds fro
m
prim
ary
radar th
us
incre
ased fu
el b
urn
• More
confid
ence th
at 7
th
arc
was fu
el e
xhaustio
n
poin
t
• Based o
n th
e s
ate
llite tim
ing d
ata
, the a
ircra
ft will b
e lo
cate
d n
ear th
e 7
th a
rc.
• The a
ircra
ft passed c
lose to
a N
W p
oin
t at 1
912.
• The m
easure
d D
opple
r pro
file c
losely
matc
hed th
at e
xpecte
d fro
m a
n a
ircra
ft travellin
g in
a
south
erly
dire
ctio
n.
• One a
naly
sis
show
ed th
at th
e b
est fit fo
r the D
opple
r frequency w
as a
t a g
round s
peed o
f 400
kts
, with
slig
htly
'less' b
est fits
at 3
75 a
nd 4
25 k
ts. A
Monte
Carlo
sty
le a
naly
sis
, usin
g a
num
ber o
f diffe
rent s
tartin
g p
ositio
ns o
n th
e 2
nd a
rc a
lso g
ave a
best fit a
t 400 k
ts. A
most
pro
bable
speed ra
nge o
f 375 to
425 k
ts w
as s
ele
cte
d.
• One a
naly
sis
used a
com
bin
atio
n o
f airc
raft p
erfo
rmance a
nd D
opple
r data
, obta
ined fro
m th
e
sate
llite, to
genera
te a
range o
f pro
bable
best fit tra
cks. T
his
work
was s
upporte
d b
y a
Root
Mean S
quare
analy
sis
that to
ok a
ccount o
f a n
um
ber o
f varia
ble
s.
• Flig
ht p
lannin
g c
arrie
d o
ut b
y M
AS
independently
show
ed th
at th
ere
was s
uffic
ient fu
el o
nboard
the a
ircra
ft to re
ach th
e p
ositio
ns d
ete
rmin
e b
y th
e a
naly
sis
.
• The le
ngth
of th
e a
rc th
at d
efin
ed th
e m
ost p
robable
are
a w
as o
bta
ined fro
m th
e o
verla
y o
f the
results
of a
ll appro
aches.
• Giv
en th
e p
robable
batte
ry life
of th
e D
ukane b
eacon, a
nd th
e n
um
ber o
f assets
availa
ble
to
conduct th
e u
nderw
ate
r searc
h, it w
as d
ecid
ed to
bre
ak th
e u
nderw
ate
r searc
h a
rea in
to th
ree
sm
alle
r are
as.
• The w
idth
of th
e a
reas w
as d
efin
ed b
y th
e p
robable
positio
n o
f the 7
th a
rc, h
alf o
f the g
lide
range (4
0 N
M) a
nd th
e a
rea th
e to
wed d
ete
cto
r could
cover b
efo
re th
e D
ukane b
atte
ry e
xpire
d.
• The a
rea th
at w
as c
rossed b
y a
ir route
M641 w
as c
lassifie
d a
s re
d (P
riority
1), th
e n
ext tw
o
prio
rities, y
ello
w a
nd g
reen, w
ere
then d
efin
ed m
ovin
g s
outh
alo
ng th
e a
rc fro
m th
is p
ositio
n.
Effe
cts
of a
n e
clip
se
on th
e s
ate
llite d
urin
g
a p
erio
d o
f MH
370
flight ta
ken in
to
consid
era
tion
Refin
ed E
AF
C m
odel
Flig
ht p
ath
from
2nd
arc
at 1
941
Candid
ate
path
s w
ith
zero
BT
O to
lera
nce
Candid
ate
path
s w
ithin
BF
O to
lera
nce o
f 10H
z

47
Ap
pen
dix
B:
Hyd
rop
ho
nes –
Cu
rtin
Un
ivers
ity E
xecu
tive S
um
mary
The A
ustr
alia
n T
ransport
Safe
ty B
ure
au (
AT
SB
) asked the C
entr
e for
Marine S
cie
nce a
nd T
echnolo
gy (
CM
ST
) to
analy
se s
ignals
receiv
ed o
n u
nderw
ate
r sound
record
ers
opera
ted b
y C
MS
T that fo
rm p
art
of th
e A
ustr
alia
n G
overn
ment fu
nded Inte
gra
ted M
arine O
bserv
ing S
yste
m (
IMO
S),
and o
n h
ydro
-acoustic s
tations
opera
ted b
y the C
om
pre
hensiv
e N
ucle
ar
Test B
an T
reaty
Org
anis
ation (
CT
BT
O)
in a
n a
ttem
pt to
dete
ct and localis
e u
nderw
ate
r sounds that could
be
associa
ted
with the im
pact of th
e a
ircra
ft o
n the w
ate
r or
with the im
plo
sio
n o
f w
reckage a
s the a
ircra
ft s
ank.
One a
coustic e
vent of part
icula
r in
tere
st has b
een identified that occurr
ed a
t a tim
e that could
pote
ntially
lin
k it to
MH
370 a
nd a
ppears
to h
ave b
een r
eceiv
ed on
one o
f th
e IM
OS
record
ers
near
the P
ert
h C
an
yon (
RC
S)
and a
t th
e C
TB
TO
hydro
-acoustic s
tation a
t C
ape L
eeuw
in (
HA
01).
A d
eta
iled a
naly
sis
of th
ese s
ignals
has r
esulte
d in a
n a
ppro
xim
ate
localis
ation for
the s
ourc
e that is
com
patible
with the t
ime o
f th
e last sate
llite
handshake w
ith
the a
ircra
ft, but in
com
patible
with the s
ate
llite
to a
ircra
ft r
ange d
erived fro
m this
handshake. T
here
appear
to b
e thre
e p
ossib
le e
xpla
nations for
this
dis
cre
pancy:
1. T
he s
ignals
receiv
ed a
t H
A01 a
nd R
CS
are
fro
m the s
am
e a
coustic e
vent, b
ut th
e s
ourc
e o
f th
e s
ignals
is u
nre
late
d to M
H37
0.
2. T
he s
ignals
receiv
ed a
t H
A01 a
nd R
CS
are
fro
m d
iffe
rent acoustic e
vents
, w
hic
h m
ay
or
may
not be r
ela
ted to M
H370.
3. T
he s
ignals
receiv
ed a
t H
A01 a
nd R
CS
are
fro
m the s
am
e a
coustic e
vent, a
nd the s
ourc
e o
f th
e s
ignals
is r
ela
ted to M
H370, but
there
is a
pro
ble
m w
ith the
positio
n lin
e d
ete
rmin
ed fro
m the s
ate
llite
handshake d
ata
.
Of th
ese, th
e first expla
nation s
eem
s the m
ost lik
ely
as the c
hara
cte
ristics o
f th
e s
ignals
are
not unusual, it is
only
their a
rriv
al tim
e a
nd to s
om
e e
xte
nt th
e
direction fro
m w
hic
h the
y c
am
e that m
ake them
of in
tere
st.
If the s
econd e
xpla
nation w
as c
orr
ect th
en there
would
still
be s
om
e p
rospect th
at th
e s
ignal r
eceiv
ed a
t H
A01 c
ould
be r
ela
ted to the a
ircra
ft, in
whic
h c
ase the
com
bin
ation o
f th
e H
A01 b
earing a
nd the p
ositio
n a
rc d
erived fro
m the s
ate
llite
handshake d
ata
would
pro
vid
e a
n a
ccura
te location o
n w
hic
h to b
ase a
searc
h.
How
ever,
the a
naly
sis
carr
ied o
ut here
indic
ate
s that, w
hile
not im
possib
le, th
is e
xpla
nation is u
nlik
ely
.
The third e
xpla
nation a
lso s
eem
s u
nlik
ely
because o
f th
e inte
nse s
cru
tin
y the s
ate
llite
handshake d
ata
has b
een s
ubje
cte
d to, H
ow
ever,
should
the a
rc d
efined b
y
the h
andshake d
ata
be c
alle
d into
question, th
e v
arious tim
ing a
nd a
coustic c
onsid
era
tions d
iscussed h
ere
would
suggest th
at
a r
easonable
pla
ce to look for
the
aircra
ft w
ould
be n
ear
where
the p
ositio
n lin
e d
efined b
y a b
earing o
f 301.6
° fr
om
HA
01 c
rosses the C
hagos-L
accadiv
e R
idge, at appro
xim
ate
ly 2
.3°S
, 73.7
°E.
If the s
ourc
e o
f th
e d
ete
cte
d s
ignals
was the a
ircra
ft im
pacting the s
ea s
urf
ace then this
would
most lik
ely
have o
ccurr
ed in w
ate
r depth
s less than 2
000m
and
where
the s
eabed s
lopes d
ow
nw
ard
s tow
ard
s the e
ast or
south
east. T
hese c
onsid
era
tions c
ould
be u
sed to furt
her
refine the s
earc
h a
rea. If, in
ste
ad, th
e
receiv
ed s
ounds w
ere
due to d
ebris im
plo
din
g a
t d
epth
it is
much less c
ert
ain
where
alo
ng the p
ositio
n lin
e fro
m H
A01 this
would
have o
ccurr
ed.

48
Ap
pen
dix
C: A
ccid
en
t case s
tud
ies –
loss o
f co
ntro
l accid
en
ts
Date
: Lo
cation
: R
eg:
Type
: O
pe
rator:
Up
set
Du
ration
(m
m:ss):
Altitu
de
Loss
(ft):
Average V
/S: (fp
m)
Max.
Distan
ce
from
start o
f em
ergen
cy (N
M):
Type o
f Loss o
f Co
ntro
l:
23
-May-0
6
Helen
dale,C
A,
USA
N
60
0X
J Lear 2
4B
P
avair Inc.
02
:00
2
3,0
00
1
1,5
00
N
/A
Un
determ
ined
LOC
.
25
-Oct-9
9
Ab
erdeen
, SD,
USA
N
47
BA
Lear 3
5
Sun
jet Aviatio
n
02
:30
4
8,9
00
P
lann
ed:
39
,00
0
> 30
,00
0
N/A
H
ypo
xia, fuel exh
austio
n.
'Payn
e Stewart' fligh
t. Sp
iral and
'severe' d
escen
t.
01
-Jun
-09
A
tlantic O
cean
(50
0 N
M fro
m sh
ore
) F-G
ZCP
A
33
0-2
03
A
ir France
0
3:1
8
37
,92
4
11
,50
0
5
Stall.
22
-Mar-9
4
Near N
ovo
sibirsk,
Ru
ssia F-O
GQ
S A
31
0-3
08
A
eroflo
t 0
2:3
6
33
,10
0
12
,00
0
3
Ro
ll up
set, spiral an
d sp
in.
Ch
ild at co
ntro
ls.
03
-Mar-9
1
Co
lorad
o Sp
rings, C
O,
USA
N
99
9U
A
B7
37
-29
1
Un
ited A
irline
s 0
0:1
0
1,0
00
6
,00
0
1
Ru
dd
er hard
-over.
03
-Mar-7
4
Near P
aris, Fran
ce
TC-JA
V
DC
-10
-10
Tu
rkish A
irlines
01
:12
9
,00
0
7,5
00
1
1
Co
ntro
l dam
age. C
argo d
oo
r failure.
12
-Feb-6
3
Near M
iami, FL,
USA
N
72
4U
S B
72
0B
N
orth
west
Airlin
es
00
:30
1
9,0
00
> 3
0,0
00
< 1
0
Extreme tu
rbu
lence,
oversp
eed.

49
Dat
e:
Loca
tio
n:
Re
g:
Typ
e:
Op
era
tor:
U
pse
t
Du
rati
on
(m
m:s
s):
Alt
itu
de
Loss
(f
t):
Ave
rage
V
/S:
(fp
m)
Max
. D
ista
nce
fr
om
sta
rt
of
eme
rgen
cy
(NM
):
Typ
e o
f Lo
ss o
f C
on
tro
l:
01
-Dec
-74
N
ear
JFK
air
po
rt, N
J,
USA
N
24
7U
S B
72
7-2
51
N
ort
hw
est
Ori
ent
01
:23
2
4,8
00
1
6,5
00
<
20
P
ito
ts b
lock
ed, s
tall
an
d s
pir
al d
ive.
26
-May
-91
N
ear
Ban
gko
k,
Thai
lan
d
OE-
LAV
B
76
7-3
29
ER
Lau
da
Air
00
:29
(i
nfl
igh
t b
reak
-up
~1
0,0
00
ft)
24
,70
0
> 3
0,0
00
N
/A
Asy
mm
etri
c th
rust
. Th
rust
re
vers
er d
eplo
yed
in
flig
ht.
07
-Dec
-95
N
ear
Gro
sse
vich
i, R
uss
ia
RA
-8
51
64
TU
-15
4B
A
ero
flo
t 0
0:5
7
31
,00
0
32
,00
0
8
Ro
ll u
pse
t, s
pir
al.
Fuel
imb
alan
ce.
19
-No
v-0
1
Nea
r K
alya
zin
, R
uss
ia
RA
-7
58
40
IL
-18
V
IRS
Aer
o
00
:59
2
6,0
00
2
6,0
00
4
D
ive
fro
m c
ruis
e an
d s
pir
al.
21
-Dec
-02
N
ear
Pen
ghu
Isla
nd
s,
Taiw
an
B-2
27
08
A
TR7
2
Tran
s A
sia
00
:40
1
8,0
00
2
7,0
00
2
Ic
ing
and
sta
ll.
16
-Au
g-0
5
Nea
r M
ach
iqu
es,
Ven
ezu
ela
HK
-4
37
4X
M
D-8
2
Wes
t C
arib
bea
n
03
:30
3
1,0
00
1
2,0
00
1
7
Stal
l du
rin
g cr
uis
e.
22
-Au
g-0
6
Nea
r D
on
etsk
, U
krai
ne
R
A-
85
18
5
TU-1
54
M
Pu
lko
vo
02
:46
3
9,0
00
1
4,0
00
3
St
all d
uri
ng
cru
ise
and
sp
in.

50
Date
: Lo
cation
: R
eg:
Type
: O
pe
rator:
Up
set
Du
ration
(m
m:ss):
Altitu
de
Loss
(ft):
Average V
/S: (fp
m)
Max.
Distan
ce
from
start o
f em
ergen
cy (N
M):
Type o
f Loss o
f Co
ntro
l:
01
-Jan-0
7
Makassar Strait, In
do
nesia
PK
-KK
W
B7
37
A
dam
Air
01
:45
3
5,0
00
2
0,0
00
9
R
oll u
pset.
IRS m
alfun
ction
.
15
-Jul-0
9
Near Q
azvin,
Iran
EP-C
PG
TU
-15
4M
C
aspian
Airlin
es
01
:30
2
4,0
00
1
6,0
00
5
R
oll u
pset an
d sp
iral.
12
-No
v-01
N
ew Yo
rk, U
SA
N1
40
53
A
30
0-6
05
R
Am
erican A
irline
s 0
0:2
4
2,3
00
5
,75
0
1.5
V
ertical stabiliser failu
re.
10
-Oct-8
5
Near Syd
ney,
Au
stralia V
H-IW
J IA
I 11
24
P
el-Air A
viation
0
0:2
5
5,0
00
2
0,0
00
(last 9
seco
nd
s) < 5
Simu
lated e
mergen
cy in
strum
ent fligh
t con
ditio
ns
check at n
ight.
Loss o
f SA.
09
-Ap
r-08
N
ear Sydn
ey, A
ustralia
VH
-OZA
SA
22
7-A
C
Airtex
00
:30
4
,34
0
10
,40
0
< 2
Spatial d
isorien
tation
at n
ight. A
H u
np
ow
ered.
03
-May-0
5
Near Stratfo
rd,
New
Zealand
ZK
-PO
A
SA2
27
-AC
A
irwo
rk (NZ)
~ 01
:20
2
2,0
00
1
5,0
00
< 2
Steep
spiral d
escen
t, o
verstress an
d b
reak-up
. Fu
el trimm
ing u
sing ru
dd
er.
26
-Jan-9
0
Near M
eekatharra,
Au
stralia V
H-M
UA
M
U-2
B-6
0
Great W
estern
A
viation
~ 0
2:0
0
21
,00
0
10
,50
0
< 5
Icing &
stall. A
ircraft entered
a spin
. Steep
, near vertical, d
escen
t.
07
-Oct-0
7
Near N
anch
es, WA
, U
SA
N4
30
A
C2
08
A
Kap
ow
sin A
ir Sp
orts
~ 02
:00
1
5,0
00
8
,00
0
3
Hyp
oxia an
d stall.
Pilo
t con
sciou
s bu
t hyp
oxic.

51
Ap
pen
dix
D:
Ac
cid
en
t case s
tud
ies –
un
resp
on
siv
e c
rew
/ h
yp
oxia
accid
en
ts
Dat
e:
Loca
tio
n:
Re
g:
Typ
e:
Op
erat
or:
U
pse
t
Du
rati
on
(m
m:s
s):
Alt
itu
de
Lo
ss
(ft)
:
Av.
V/S
: (f
pm
)
Max
. Dis
tan
ce
fro
m s
tart
of
em
erg
ency
(N
M):
Loss
of
Co
ntr
ol:
25
-Oct
-99
A
ber
dee
n, S
D,
USA
N
47
BA
Le
ar 3
5
Sun
jet
A
viat
ion
0
2:3
0
48
,90
0
Pla
nn
ed:
39
,00
0
> 3
0,0
00
U
nav
aila
ble
.
Hyp
oxi
a, f
uel
ex
hau
stio
n. L
oss
of
con
tro
l. 'P
ayn
e St
ewar
t'
flig
ht.
Sp
iral
an
d 's
eve
re'
des
cen
t.
14
-Au
g-0
5
33
km
NW
Ath
ens,
G
reec
e
5B
-DB
Y B
73
7-3
1S
Hel
ios
A
irw
ays
11
:52
N
/A
No
LO
C
08
49
:50
FL3
40
left
en
gin
e fl
ame
-ou
t.
08
51
:40
Sta
rt o
f d
esce
nt.
0
85
9:4
7 7
,00
0 f
t ri
ght
engi
ne
flam
e-o
ut.
0
90
3:3
2 Im
pac
t.
Hyp
oxi
a, f
uel
ex
hau
stio
n. U
nd
er t
he
par
tial
co
ntr
ol o
f a
cab
in
crew
me
mb
er.
04
-Sep
-00
Q
ld,
Au
stra
lia
VH
-SK
C
Bee
ch 2
00
M
inin
g
Ch
arte
r Fl
igh
t U
nav
aila
ble
5
,00
0
Un
avai
lab
le
Un
avai
lab
le.
Gra
du
al s
tead
y d
esce
nt
ove
r a
per
iod
of
ho
urs
.
Pla
nn
ed c
ruis
e le
vel w
as
FL2
50
. Ob
serv
ed a
t FL
34
3. H
ypo
xia,
fu
el
exh
aust
ion
. Lo
w le
vel
loss
of
con
tro
l. N
o C
VR
o
r FD
R.
07
-Oct
-07
N
ear
Nan
ches
, WA
, U
SA
N4
30
A
C2
08
A
Kap
ow
sin
A
ir S
po
rts
~ 0
2:0
0
15
,00
0
8,0
00
3
H
ypo
xia
and
sta
ll.
Pilo
t co
nsc
iou
s b
ut
hyp
oxi
c.

52
Ap
pen
dix
E: A
cc
iden
t case s
tud
ies –
a s
am
ple
of a
ccid
en
ts in
vo
lvin
g a
glid
e
Date
: Lo
cation
: R
eg:
Type
: O
pe
rator:
Du
ration
(m
m:ss):
Altitu
de
Lo
ss (ft):
Av.
V/S:
(fpm
)
Max. D
istance
from
start of
eme
rgency
(NM
):
Co
mm
ents:
14
-Oct-0
4
Jefferson
City, M
O,
USA
N
83
96
A
CL-6
00
P
inn
acle Airlin
es
20
:30
4
1,0
00
2
,00
0
81
D
ual en
gine flam
e-o
ut.
21
54
:36
Stick-shaker.
22
15
:06
Imp
act.
23
-Jul-8
3
Gim
li, C
anad
a C
-GA
UN
B
76
7-2
33
A
ir Can
ada
17
:00
2
8,5
00
1
,70
0
39
‘G
imli G
lider’. Fu
el exh
austio
n. H
igh fo
r lan
din
g and
side
-slipp
ed.
24
-Au
g-01
A
zores,
Po
rtugal
C-G
ITS A
33
0-2
43
A
ir Transat
19
:00
3
4,5
00
1
,80
0
65
Fu
el leak, fuel exh
austio
n.
16
-Jan-0
2
Serenan
, In
do
nesia
PK
-GW
A
B7
37
-30
0
Garu
da In
do
nesia
~ 4:0
0
18
,50
0
4,6
00
~ 3
5
Du
al engin
e flame
-ou
t du
e to
water/h
ail inge
stion
.

53
Ap
pen
dix
F:
Searc
h S
trate
gy W
ork
ing
Gro
up
un
derw
ate
r searc
h a
reas

54
Appendix G: Explanatory notes on BTO and BFO analysis
This appendix provides some explanatory notes on the BTO and BFO calculations used by the
satellite communications group. The organisations within the group worked independently using
different techniques but collaboratively came to a consensus on the results of their analysis.
BTO Analysis
The BTO measurement comprises two components: a bias component caused by fixed delays in
the system, plus a variable component caused by the time taken for the outbound radio wave to
pass from the GES to the aircraft and the inbound radio wave to make the return journey. This
allows a simple equation to be developed relating satellite to aircraft distance to timing delay.
(1)
where
bias is a fixed (and constant) delay due to GES and AES processing
c is the speed of light
To determine the bias value, and to get an indication of the accuracy of the technique, signals
exchanged between the GES and aircraft, historical values were analysed with the known aircraft
location.
BTO Example
An example of this would be to use the values in the 30 minutes prior to take off. During this 30
minute period the satellite moved 122 km. Table 1 shows the location of the satellite, aircraft and
GES during this period, expressed in an Earth Centred Earth Fixed (ECEF) coordinate system
where the centre of the earth is the origin, the z-axis is due North and the x and y axes are in the
equatorial plane with 0° and 90° longitude respectively. Note: this example uses a simplified
ellipsoid Earth model.
17 measurements taken during this 30 minute period can be processed to estimate the fixed
timing bias. The mean bias of -495,679 µs is then used to predict the path length from the
measured data (Table 2 right hand columns), showing a high degree of consistency. The peak
error out of all 17 measurements is 17.7 km in the distance from GES to AES and back,
equivalent to less than 9 km in the distance between the satellite and the AES.
Terminal Lat Lon Time
X Y Z °N °E (UTC) X Y Z GES (km) AES (km)
GES (Perth) -2368.8 4881.1 -3342.0 -31.8 115.9 16:00:00 18118.9 38081.8 706.7 39222.7 37296.0
AES (KLIA) -1293.0 6238.3 303.5 2.7 101.7 16:05:00 18119.6 38081.5 727.9 39225.0 37296.4
16:10:00 18120.3 38081.2 748.7 39227.3 37296.7
16:15:00 18120.9 38080.9 769.2 39229.6 37297.1
16:20:00 18121.6 38080.6 789.4 39231.8 37297.4
16:25:00 18122.2 38080.3 809.1 39233.9 37297.8
16:30:00 18122.9 38080.0 828.5 39236.1 37298.1
Table 1: BTO Calibration Geometry
Location (km) Satellite Location (km) Dist to Satellite

55
With the bias value determined from the ground measurements the in-flight measurements can be
processed to determine the satellite to aircraft distance at each measurement point.
Additional information
The signals at 18:25:27 and 00:19:37 were both generated as part of a Log-on sequence after the
terminal has likely been power cycled, contrasting with the other messages which were generated
as part of a standard ‘Log-on/Log-off Acknowledgement’ (LLA) exchange. Each power up
sequence starts with a Log-on Request message which has been found to have a fixed offset of
4600 µs relative to the LLA message exchange by inspecting historical data for this aircraft
terminal. The subsequent messages during the Log-on sequence have variable delay, and so are
not helpful in this analysis. This means that the BTO data for 18:25:34 and 00:19:37 should be
ignored, but that corrected BTO values of 12520 and 18400 µs may be derived from the Log-on
Request messages at 18:25:27 and 00:19:29 respectively.
BFO Analysis
Unlike the timing calculation, which predicts the location of the aircraft relative to the satellite from
the BTO measurement, the frequency calculation works backwards, taking the aircraft location
and velocity at a given time and calculating the BFO that this would generate. This enables the
likelihood of potential flight paths to be evaluated, depending on how well the projected BFO
values align with the measured values during the flight.
The BFO may be calculated by combining the contributions of several factors:
(2)
where
Time BTO Path Transmission Bias Predicted Error
(UTC) (µS) (km) Delay (µs) (µs) Path (km) (km)
16:00:13 14820 153037 510478 -495658 153044 -6.3
16:00:17 14740 153037 510478 -495738 153020 17.7
16:00:18 14780 153037 510478 -495698 153032 5.7
16:00:18 14820 153037 510478 -495658 153044 -6.3
16:00:23 14740 153037 510478 -495738 153020 17.7
16:00:23 14820 153037 510478 -495658 153044 -6.3
16:00:32 14820 153037 510478 -495658 153044 -6.3
16:09:37 14840 153048 510514 -495674 153050 -1.7
16:09:47 14840 153048 510514 -495674 153050 -1.7
16:11:04 14840 153048 510514 -495674 153050 -1.7
16:11:13 14860 153048 510514 -495654 153056 -7.7
16:27:59 14920 153068 510581 -495661 153074 -5.5
16:28:16 14860 153068 510581 -495721 153056 12.5
16:29:17 14860 153068 510581 -495721 153056 12.5
16:29:42 14920 153068 510581 -495661 153074 -5.5
16:29:50 14940 153068 510581 -495641 153080 -11.5
16:29:52 14920 153068 510581 -495661 153074 -5.5
Average: -495679
Table 2: BTO Calibration (Kuala Lumpur International Airport)

56
ΔFup is the Doppler on the signal passing from the aircraft to the satellite
ΔFdown is the Doppler on the signal passing from the satellite to the GES
δf comp is the frequency compensation applied by the aircraft
δf sat is the variation in satellite translation frequency
δf AFC is the frequency compensation applied by the GES receive chain
δf bias is a fixed offset due to errors in the aircraft and satellite oscillators
BFO Example
The uplink and downlink Doppler may be calculated from the relative movement of the aircraft,
satellite and GES using the signal frequencies of 1646.6525 MHz (uplink) and 3615.1525 MHz
(downlink). The satellite location and velocity are accurately documented by Inmarsat for satellite
station keeping and collision avoidance activities and a selection are shown in Table 3 for the key
times used in the analysis.
The aircraft terminal adjusts its’ transmit frequency to compensate for the Doppler induced on the
uplink signals by the aircraft velocity. Aircraft heading and ground speed are used to calculate the
Doppler shift the signal would experience if the satellite was at its nominal location over the
equator. This only partially compensates for the Doppler associated with aircraft velocity as it does
not allow for vertical movement (which introduces discrepancies when the aircraft is climbing/
descending) and the satellite is rarely at its nominal location: these small errors are immaterial to
the communications performance, but do affect the BFO. This is δf comp in equation 2.
Signals received by the satellite are translated in frequency, amplified and relayed to the GES.
The satellite translation frequency is derived from an ultra-stable oscillator which is maintained in a
temperature controlled enclosure to improve its stability, nevertheless its temperature (and hence
frequency translation) varies throughout the day. During eclipse periods when the satellite passes
through the earth’s shadow, the satellite temperature drops significantly resulting in a further
variation in translation frequency. Such an eclipse occurred during the flight of MH370 starting at
19:19 and ending at 20:26. The changes of satellite oscillator frequency with time are represented
by δf sat in equation 2.
The GES translates the frequencies it receives from the satellite to an Intermediate Frequency (IF)
before passing them to the equipment that demodulates and processes them. The translation
frequency it applies is controlled by an Automatic Frequency Control (AFC) loop to compensate
for the downlink Doppler. The AFC loop works by monitoring the absolute frequency of a
reference signal transmitted through the satellite, and using these measurements to determine the
Time
(UTC) x y z x' y' z'
16:30:00 18122.9 38080.0 828.5 0.00216 -0.00107 0.06390
16:45:00 18124.8 38079.0 884.2 0.00212 -0.00114 0.05980
16:55:00 18126.1 38078.3 919.2 0.00209 -0.00118 0.05693
17:05:00 18127.3 38077.6 952.5 0.00206 -0.00120 0.05395
18:25:00 18136.7 38071.8 1148.5 0.00188 -0.00117 0.02690
19:40:00 18145.1 38067.0 1206.3 0.00189 -0.00092 -0.00148
20:40:00 18152.1 38064.0 1159.7 0.00200 -0.00077 -0.02422
21:40:00 18159.5 38061.3 1033.8 0.00212 -0.00076 -0.04531
22:40:00 18167.2 38058.3 837.2 0.00211 -0.00096 -0.06331
00:10:00 18177.5 38051.7 440.0 0.00160 -0.00151 -0.08188
00:20:00 18178.4 38050.8 390.5 0.00150 -0.00158 -0.08321
Satellite Location (km) Satellite Velocity (km/s)
Table 3: Satellite Location and Velocity (ECEF)

57
appropriate translation frequency to apply over a 24 hour period. The hardware used to implement
this AFC loop in the Perth GES only partially compensates for the downlink Doppler, and the
translation frequency cannot readily be deduced by arithmetic calculation, however its effects can
be measured. This is δf AFC in equation 2.
The reason for the partial compensation is that the Perth EAFC receiver was not designed to
handle the case where the reference Pilot signal is transmitted from a different hemisphere to that
in which it is received. In the MH370 situation the reference Pilot signal was transmitted from the
Burum GES in the Netherlands, and received at Perth, resulting in the equipment only being able
to partially remove the C Band Doppler component.
The EAFC receiver at Perth is an old unit that is unable to accept negative latitude values to
service southern hemisphere locations as described. Inmarsat operates the unit in such a manner
that it reduces the effect of the C Band Doppler rather than removing it completely. Such an
approach is perfectly serviceable for communications use.
An algorithm was used which enabled determination of the frequency translation variations
applied in the GES due to the EAFC receiver. However this is of limited utility to the analysis as
there is still the uncertainty related to the translation frequency applied by the satellite.
Inmarsat compared the measured frequency of the Burum LC Pilot signal received at the Perth
GES (after passing through the satellite and the Perth receive chain) with the frequency that would
have been expected due to the effect of Doppler shift due to satellite movement. This determined
the combined effect of satellite translation frequency and GES EAFC frequency variation. This
combined factor was used to determine the ‘Satellite and EAFC Effect’ in the BFO calculations.
The final component in the frequency calculation is a fixed bias component related to the aircraft
and satellite oscillator errors. Whilst manufactured to high tolerances, the oscillators on the aircraft
and the satellite exhibit small fixed frequency errors which result in a bias value appearing in the
BFO associated with any particular terminal. As the value is constant it can be determined through
calibration measurements when the aircraft location and velocity are known. This is δf bias in
equation 2.
A key problem in solving equation 2 is determining the values of δf sat and δf AFC at the arc
crossing times. This was resolved by measurements taken on a fixed frequency L Band reference
signal that was transmitted from Inmarsat’s GES in Burum (Netherlands) through the 3F1 satellite
and received in the Perth GES, where its final frequency was recorded after passing through the
EAFC controlled down conversion chain. These measurements allowed the combined value of δf
sat and δf AFC to be determined at the appropriate times, as documented in Table 4.
Time (δf sat + δf AFC)
UTC Hz
16:30:00 29.1
16:42:00 27.6
16:55:00 25.8
17:07:00 24.1
18:25:00 10.7
19:41:00 -0.5
20:41:00 -1.5
21:41:00 -18.0
22:41:00 -28.5
00:11:00 -37.7
00:19:00 -37.8
Table 4: Satellite and AFC values

58
Tables 5 and 6 present an example BFO calculation during the early phase of flight MH370 when
the aircraft location, ground speed and heading are known. They illustrate the sensitivity of the
BFO frequency calculation to heading and latitude errors, showing that the calculation works and
that it is reasonably sensitive to errors in aircraft location and heading.
Table 5: BFO Sensitivity to Aircraft Heading Errors
Measurement Heading
Parameter -25° True +25° Unit Notes
Time 17:07 17:07 17:07 UTC
Aircraft Latitude 5.27 5.27 5.27 °N
Aircraft Longitude 102.79 102.79 102.79 °E
Aircraft Ground Speed 867 867 867 kph
Aircraft Heading 0 25 50 °ETN
Bias Component 152.5 152.5 152.5 Hz From Calibration
Aircraft Freq. Compensation 108.9 489.5 777.8 Hz Calculated (for 64.5°E satellite)
Aircraft Doppler (uplink) -75.3 -459.4 -756.8 Hz Aircraft velocity towards satellite
Satellite Doppler (uplink) -3.2 -3.2 -3.2 Hz Satellite velocity towards aircraft
Satellite Doppler (downlink) -71.9 -71.9 -71.9 Hz Satellite velocity towards Perth GES
Satellite and EAFC Effect 24.1 24.1 24.1 Hz Measured
Predicted BFO 135.1 131.7 122.5 Hz
Measured BFO 132.0 132.0 132.0 Hz Measured
Error 3.1 -0.3 -9.5 Hz Close match at true heading
Table 6: BFO Sensitivity to Aircraft Latitude Errors
Measurement Latitude
Parameter -5° True +5° Unit Notes
Time 17:07 17:07 17:07 UTC
Aircraft Latitude 0.27 5.27 10.27 °N
Aircraft Longitude 102.79 102.79 102.79 °E
Aircraft Ground Speed 867 867 867 kph
Aircraft Heading 25 25 25 °ETN
Bias Component 152.5 152.5 152.5 Hz From Calibration
Aircraft Freq. Compensation 398.3 489.5 577.1 Hz Calculated (for 64.5°E satellite)
Aircraft Doppler (uplink) -367.9 -459.4 -547.5 Hz Aircraft velocity towards satellite
Satellite Doppler (uplink) -7.6 -3.2 +1.1 Hz Satellite velocity towards aircraft
Satellite Doppler (downlink) -71.9 -71.9 -71.9 Hz Satellite velocity towards Perth GES
Satellite and EAFC Effect 24.1 24.1 24.1 Hz Measured
Predicted BFO 127.5 131.7 135.5 Hz
Measured BFO 132.0 132.0 132.0 Hz Measured
Error -4.5 -0.3 3.5 Hz Close match at true latitude

AT
SB
Transp
ort S
afety Rep
ort
External A
viation Investigation
MH
370 - Definition of U
nderwater S
earch Areas
AE
-2014-054
26 June 2014 (updated 18 August 2014)
Investigatio
n
Australian Transport Safety Bureau
Enquiries 1800 020 616Notifications 1800 011 034REPCON 1800 011 034Web www.atsb.gov.auTwitter @ATSBinfoEmail [email protected]