mg alloys development and surface modification for biomedical
TRANSCRIPT

7
Mg Alloys Development and Surface Modification for Biomedical Application
Shaokang Guan, Junhua Hu, Liguo Wang, Shijie Zhu, Huanxin Wang, Jun Wang, Wen Li, Zhenwei Ren, Shuai Chen, Erchao Meng,
Junheng Gao, Shusen Hou, Bin Wang and Binbn Chen Materials Research Centre, Zhengzhou University
China
1. Introduction
The development of biodegradable implants has grown into one of the important areas in medical science (Mani et al., 2007), since they can be gradually dissolved, absorbed, consumed or excreted in human body environment, and then disappear spontaneously after the bone tissues heal. The biodegradable materials available in the current market are mainly made of polymeric or ceramic materials, while these implants have an unsatisfactory mechanical strength when used for load-bearing parts (Staiger et al., 2006). Compared with the currently approved biomaterials, Mg alloys have a lot of advantages (Song et al., 2007; Witte et al., 2007; Witte et al., 2005; Song et al., 2007). First, with high strength/weight ratio, Mg alloy exhibits an appropriate mechanical integrity and is more suitable for load-bearing implantation. Its fracture toughness is higher than ceramic biomaterials (e.g. HA), and the elastic modulus and compressive yield strength of magnesium are closer to those of natural bone than other metallic implants (Table 1.1). Thus it will help to reduce or avoid “stress shielding effects” that can lead to reducing stimulation of new bone growth and remodeling. Moreover, magnesium has little toxicity to human body. Magnesium is essential to human metabolism and is naturally found in bone tissue. It is the fourth most abundant cation in the human body, with an estimated 1 mol of magnesium stored in the body of a normal 70 kg adult. Approximately, half of the total physiological Mg is stored in bone tissue. Thirdly,
Material Density (g/cm3) E (Gpa)
Compressive yield strength (Mpa)
Fracture toughness (MPa.m1/2)
Natural bone 1.8-2.1 3-20 130-180 3-6 Mg 1.74-2.0 41-45 65-100 15-40
Ti alloy 4.4-4.5 110-117 758-1117 55-115 Co–Cr alloy 8.3–9.2 230 450–1000 /
Stainless steel 7.9-8.1 189-205 170-310 50-200 Synthetic HA 3.1 73-117 600 0.7
PLA 1.25-1.29 2.2-3.3 / /
Table 1.1. Properties of various implant materials (Staiger et al., 2006; Gupta et al., 2007).
www.intechopen.com

Magnesium Alloys - Corrosion and Surface Treatments
110
magnesium is biodegradable in human body. Because it has very low standard electrode potential (-2.37 V), magnesium can be gradually dissolved and adsorbed after implanting in human body. The produced Mg2+ ions are absorbed by surrounding tissues or excreted out by human body fluids. Compared with the permanent implants, the second surgery for the removal of implant might be avoided, which decreases costs of the health care system and further morbidity to the patients. Lastly, magnesium is naturally abundant in the earth’s crust and sea water, and its price is low, approximately equal to one third of titanium. In this chapter, the corrosion resistance and biocompatibility of Mg based implants produced by several approaches will be investigated in vitro and in vivo.
2. Materials and experiments
2.1 Alloy development To develop a new alloy, we took the toxicity and strengthening effect of alloy elements into consideration comprehensively. The effect of alloying elements on Mg alloys and their toxicological characteristics have been summarized (F.Witter 2008). For new Mg-Zn-Ca alloys, the content of zinc hould be moderate (G.Song, 2007). High content of zinc would deteriorate the corrosion resistance of alloys, and low content would not improve the mechanical properties (Li et al., 2008; GU et al., 2009). The Mg-Zn-Y-Nd alloys were developed basing on the following considerations. When the atomic Zn/Y≈ 6:1 in Mg-Zn-Y alloys with low Zn content under certain solidification rate, I-phase (icosahedral quasicrystal phase Mg30Zn60Y10) would appear which possesses many interesting properties, such as high corrosion resistance, high hardness and low interface energy; Nd was chosen to improve the plasticity. Mg–Zn–Y–Nd alloy was prepared by melting high purity Mg, high purity Zn, Mg–Y and Mg–Nd master alloys in an electronic resistance furnace and casting into a mild steel crucible at approximately 740oC under CO2/SF6 atmosphere. For Mg-Zn-Ca alloy casting, pure magnesium was melt at approximately 730°C, and pure zinc and other alloy elements were added subsequently. To add silicon, the temperature should be raised. Ca was added after other alloys were completely melted and the temperature was decreased slightly to avoid the burning loss of it. Then, the liquid was stirred and stewed. At the temperature of 680oC, the molten metal was poured into a steel model.
2.2 Alloy processing technique (1)The Mg-Zn-Y-Nd alloys were extruded at 340oC, with the extrusion ratio of 17.4 and extruded diameter of 12 mm. (2) The sub-rapidly solidified bars were prepared by copper mould splat cooling method at 700oC under Ar atmosphere. The cooling rate of prepared Φ2mm bars was about 200K/s, which was within the cooling rate range of sub-rapid solidification.
2.3 Surface modification Before electrochemical deposition, the samples were polished by silicon carbide papers of 100~1000 grits, then cleaned ultrasonically in acetone for 10min to remove residual grease. The clean substrates were activated with 40% HF for 10 min; then the treated specimens were dried for deposition. (1) Constant current electrochemical deposition (CED). An electrochemical workstation (RST5200) was used to deposit HA coating. Deposition was
www.intechopen.com

Mg Alloys Development and Surface Modification for Biomedical Application
111
carried out at an optimized current density of 0.4 mA/cm2 at 85 oC for 60 min. The electrolyte was a solution with 0.042 mol/l Ca(NO3)2, 0.025 mol/l NH4H2PO4 and 0.1 mol/l NaNO3. During the electrochemical deposition, a graphite plate was used as an anode, while the Mg alloy specimen was cathode. After coated, alloys were removed from the electrolyte and rinsed in distilled water. Additionally, alkali-heat treatment was conducted by immersion as-deposited samples in 0.25 mol/l NaOH solution at 80 oC for 4h.(2)Pulsed
electrochemical deposition (PED). The pulse reverse current (PRC) parameters were used (H.X.Wang,et.al 2010). Note that the positive pulse was wider than negative one in order to develop a Ca–P coating of certain thickness. The deposition process lasted for 30 min at about 85 oC, after which the sample was removed from the electrolyte, rinsed with distilled water and dried for about 4 h in air.(3)Micro-arc oxidation (MAO)/ electrochemical
deposition (ED). The MAO process was conducted with a 10-kW power supply. The Mg-Zn-Ca alloy samples were used as the anode, while the stainless steel plate as the cathode. The electrolyte for the MAO was prepared as a solution of sodium phosphate and sodium hydroxide with concentrations of 0.5mol/l and 0.05mol/l, respectively. Samples were treated in the electrolyte with the cell potential increased step by step till 225V for 30 min. During the experiment process, the electrolyte was stirred at 40oC. The Mg-Zn-Ca alloy samples treated by MAO were used as the cathode. The deposition process was the same as described in CED section (2.3.1). (4) Liquid phase deposition (LPD). TiO2 layer was prepared by hydrolysis of modified ammonium hexafluorotitanate [NH4]2TiF6 with concentration of 0.2mol/l. After pre-treatment, the AZ31 samples were immersed into the mother solution and suspended therein vertically for 20h. After deposition, the annealing process was carried out in the vacuum furnace (2×10⁻⁴Pa). The annealing temperature was from 250 ~ 380°C and the annealing time was 1~3h. (5) Magnatic sputting. A direct current magnetic sputtering machine was used to deposit Ti-O film. The base pressure in the chamber was 5×10⁻⁵Pa, and the working pressure was 0.5Pa. The target was titanium dioxide (99.999%) with a dimension of 150mm×40mm×5mm. The working gas was argon (99.999%) with a constant flow of 40sccm. The working voltage was about 390V, and current was 0.45A. The deposition rate was about 2nm/min. The HA coating was deposited under a constant current model as described in section CED(2.3.1).
2.4 In vitro performance (1) Potentiodynamic polarization. A three-electrode cell was used for electrochemical measurements. The counter electrode was made of platinum and the reference electrode was saturated calomel electrode (SCE). The scanning rate was 5mV/s. The test solution was simulated body fluid (SBF), and the temperature was 37oC. The potentiodynamic polarization was also measured in a dynamic SBF (flow 2ml/100mlmin-1)(J.wang, et.al. 2010). (2) Electrochemical impedance spectroscopy. The electrochemical impedance spectroscopy (EIS) test and the polarization curve experiment were both conducted with an electrochemical workstation (RST5000). The signal amplitude of EIS test was 10mV and the frequency ranged from 100 kHz to 0.001Hz.The sweep rate of the polarization curve measurement was 0.5mV/s. (3) Slow strain rate tensile (SSRT) testing. The mechanical properties of the alloys were studied using slow strain rate tensile (SSRT) testing in SBF at 36.5±0.5 oC. Cylindrical tensile specimens with gauge dimensions of 10×φ4mm were used in SSRT test. These samples were pulled at a strain rate of 2.16×10⁻⁵mm/s until fracture.(4)
www.intechopen.com

Magnesium Alloys - Corrosion and Surface Treatments
112
Immersion test. The immersion test was carried out in SBF. The pH of SBF was adjusted with HCl and (CH2OH)3CNH2, and the temperature was kept at 37oC using water bath. The immersion solution was refreshed every 24h. The sample weight was measured before and after the immersion test. The corrosion rate was calculated by following equation (2.1), Where, Wo: original weight; W1: weight after immersion; S: original surface area exposed to the test solution; t: immersion time. (5)Hydrogen evolution test. The hydrogen evolution test was carried out in SBF at a temperature of (36.5±0.5) ºC. The volume of evolved hydrogen was measured everyday. The pH value of the solution was also recorded during the hydrogen evolution tests.
CR=(Wo-W1)/(St) (2.1)
2.5 Materials characterization The microstructures of the alloys were observed by optical microscopy (OM). The crystal structure of coated/uncoated alloy was investigated by X-ray diffraction (XRD) instrument (Philips PW-1700X; Bruker D8 Advance) with Cu Kα (=0.15406nm). The surface and cross-section morphology were observed with scanning electron microscopy (FE-SEM JEOL-6700F; SEM Philips Quanta-200). Energy dispersive spectroscopy (EDS) was employed to determine the elements composition of the layers. Transmission electron microscope(TEM, Fischione model 1010)was used to characterize samples in detail.
2.6 Mechanical properties measurement The hardness of the alloys was measured on microhardness instrument (HX-100M). The tension and compression strength were measured on a universe material testing machine (Instron). According to ASTM F 1044-05, the shear strength of the coating and substrate was evaluated with a universal tensile machine (Hitachi AG-IS 10KN) according to (Wei & Ruys, 1999). The adhesion strength data were reported as the average values of three samples.
2.7 In vivo experiment All animal experiments were conducted according to the ISO 10993-2:1992 animal welfare requirements. The rod samples were implanted into the left femoral shaft of rabbits. Intravital staining was performed monthly using subcutaneous injections of acheomycin(0.3mg/kg) to observe the newly formed bone. (1)Ion concentration tests. Blood and urine samples were taken from the rabbits at 8, 12 and 18 weeks after surgery. The ion concentrations of Mg2+ in the blood and urine were examined. (2) Radiographic and
pathological evaluation. Radiographs were used to observe the change around the implants. Heart, kidney, spleen and liver tissues from the rabbits were inspected to verify whether degradation of the magnesium alloy harmed these visceral organs. Bone samples including implants after 8 and 12 weeks implantation were taken out to observe os integration and assess the bioactivity of samples. The micro-computed tomographic were used to evaluate the residual volume of the implants. The volume of implants was measured at 8, 12 and 18 weeks post-implantation. (3) In vivo mechanical integrity. The rod samples were taken out of the bone at 8, 12 and 18 weeks for mechanical measurement. The compression tests were carried out with INSTRON universal tensile testing machine to observe the influence of weight loss on mechanical integrity.
www.intechopen.com

Mg Alloys Development and Surface Modification for Biomedical Application
113
3. Novel Mg alloys development for implants
3.1 Mg-Zn-Ca alloy The content of zinc in Mg-Zn alloy was fixed in 2 wt. %. Calcium was added to improve the mechanical properties. The microstructure of the as-cast alloy was shown in Fig.3.1 (a). Second phase (Ca2Mg6Zn3) distributed incontinuously. But when the calcium content reached to 0.46%, the second phases distributed along grain boundaries continuously. With the increase of calcium content, the amount of second phase increased, while the grain size of matrix decreased. The formation of Ca2Mg6Zn3 restricted the grain growth, which was beneficial to the improvement of mechanical properties. It was reported that the addition of calcium in Mg-Zn alloys should be controlled within 0.3%. Above the leve, the formation of second phases might generate embrittlement. Moreover, in Fig.3.1, the second phases distributing in the alloy uniformly will contribute to the grain refinement of matrix. So the content of calcium must be moderate. As shown in Tab.3.1, there was a slight improvement in yield strength among the alloys with different calcium content. The yield strength was about 83MPa, while the tensile strength varied between140~170MPa. However, there was a significant difference in elongation among the alloys. The alloy with 0.22 wt% Ca exhibited the highest elongation and best tensile strength. When the content of calcium was below 0.22%, the amount of second phase increased with the increase of calcium, which contributed to the higher tensile strength and elongation for their pinning effect. But when calcium was above 0.22%, the increase in calcium content resulted in the decreased elongation, which may be because excessive brittle intermetallic phase deteriorated the mechanical properties. Fig.3.2 showed the bending and compression strength of the alloys with different calcium content, respectively. The bending and compression strength of the alloys were optimized when the calcium content reached to 0.22%. The increasing of calcium content above 0.22% reduced the bending strength, but didn't deteriorate the compression strength.
Fig. 3.1 SEM images of as-cast alloys with different Ca contents: (a) 0.024%Ca; (b) 0.22%Ca; (c) 0.29%Ca; (d) 0.46%Ca.
The polarization curves in SBF (Kokubo. 2006) (Fig.3.3) showed that the alloy with 0.22%Ca held the highest corrosion potential of about -1.7V; while the alloy with 0.46%Ca possessed
www.intechopen.com

Magnesium Alloys - Corrosion and Surface Treatments
114
the lowest potential of about -1.8V. The change in calcium content in alloys didn't give a significant effect on the corrosion resistance. In Tab.3.2 the corrosion current of each alloy was summarized. The corrosion rate in human body could be evaluated according to the mass loss in SBF approximately. In Fig.3.4, among the alloys, the alloy with 0.22%Ca possessed the lowest degradation rate. At the beginning of the tests, the weight of the samples increased for the sake of absorption of water and deposits from solution. The corrosion behaviors of the alloys were also assessed by the pH evolution tests. The sample with 0.22%Ca held the lowest increase rate.
Alloy Yield strength /MPa Tensile strength /MPa Elongation /% 0.024% Ca 80 141 8 0.220 %Ca 84 172 11 0.290% Ca 83 156 7 0.460 %Ca 85 154 5
Table 3.1. The tensile test of as-cast alloys
Fig. 3.2. Bending and compression strength of the as-cast alloys with different calcium contents
Fig. 3.3. The polarization curves of different alloys in SBF at 37°C
www.intechopen.com

Mg Alloys Development and Surface Modification for Biomedical Application
115
With the increase of calcium, the amount of Ca2Mg6Zn3 increased. In SBF, primary cell units formed between Ca2Mg6Zn3 as cathodes and α-Mg as anodes. The cell unites helped the generation of Mg(OH)2 on α-Mg and the corrosion product could protect matrix from further corrosion. But the increasing amount of Ca2Mg6Zn3 deteriorated the α-Mg corrosion resistance because the increasing interface between Ca2Mg6Zn3 and α-Mg prevented the formation of Mg(OH)2.
Alloy Corrosion potential (Ecorr, V) corrosion current (Icorr, A/cm2)
0.024Ca -1.77 5.6×10⁻⁴
0.220Ca -1.71 1.3×10⁻⁴
0.290Ca -1.76 5.1×10⁻⁴
0.460Ca -1.82 4×10⁻⁴
Table 3.2. The corrosion potential and current of the alloys
-2 0 2 4 6 8 10 12 14 16
-0.01
0.00
0.01
0.02
0.03
0.04
0.05
Mg-2.1Zn-0.22Ca
ma
ss loss(
g)
t(days)
Mg-1.99Zn-0.17Ca-0.51Si
Mg-2Zn-0.22Mn
A
Fig. 3.4. The pH evolution (left) and mass loss (right) of alloys in the corrosion test
3.2 Mg-Zn-Y-Nd for stent implant 3.2.1 As-cast Mg-Zn-Y-Nd with varied Zn and Y contents and fixed Zn/Y ratio
Fig. 3.5. Microstructures of as-cast alloys with different Zn, Y contents: (a) 1#: Zn/Y=1/0.23 ; (b) 2#: Zn/Y=2/0.46 ; (c) 3#: Zn/Y=3/0.69.
www.intechopen.com

Magnesium Alloys - Corrosion and Surface Treatments
116
Fig. 3.6 XRD patterns of as-cast alloys (a) 1#alloy (b) 2#alloy (c) 3#alloy
In Mg-Zn-Y-Nd alloy, the Nd content was fixed at 0.5wt.% And the Zn/Y weight ration was 6:1. In Fig.3.5, the content of Zn/Y had evident effects on the microstructure of alloys. In Fig.3.5 (b), 2# alloy was with the smallest dendrite size and the lowest second phase volume percentage among the three alloys. The distribution of the second phase changed from continuous in Fig.3.5 (a) into diffusive in Fig.3.5 (b) and semi-continuous in Fig.3.5(c). With the combination of Zn, Y, Nd addition into Mg, these elements interacted with each other, resulting in the decreased solid solubility in α-Mg. Meanwhile, the metal molds used here had high cooling rate. The factors mentioned together resulted in gross dendritic crystals. Fig. 3.6 showed the XRD spectra of 1#~3#alloys. With the increasing content of Zn and Y, the phase compositions were α-Mg, Mg2Zn11, Nd3Zn11; α-Mg, Nd3Zn11; α-Mg, Mg2Zn11, Mg3Y2Zn3, Nd3Zn11, respectively. This result together with microstructures (Fig.3.5), indicated that when Y content was low in α-Mg, no phase containing Y was discovered due to its solid solubility up to 12.4%; as Zn content increased, the amount of Mg2Zn11 and Nd3Zn11 phases in 3# alloy increased apparently. Due to the simultaneous increase of Zn and Y content, Mg3Y2Zn3 phase appeared in 3# alloy. Corrosion polarization curves and immersion experiments were conducted in SBF (Kokubo et al, 2006).From Fig.3.7, it can be seen that with the addition of 2wt% Zn, the corrosion potential was improved to a certain extent. The Ecorr of 2# alloy was higher than that of 1# and 3#; meanwhile, Icorr of 2# was lower than that of 1# and 3#, indicating 2# alloy possessed the best corrosion resistance. The electrochemical parameters were summarized from the polarization curves of as-cast alloys and shown in Table 3.3
Alloys Ecorr1(V) Ecorr2(V) Icorr(A.cm-2)
1# -1.81 -1.80 4.36×10⁻⁴
2# -1.80 -1.76 5.30×10⁻⁵
3# -1.82 -1.79 3.13×10⁻⁴
Table 3.3. Electrochemical parameters summarized from polarization curves of as-cast alloys.
www.intechopen.com

Mg Alloys Development and Surface Modification for Biomedical Application
117
1E-7 1E-6 1E-5 1E-4 1E-3 0.01 0.1
-2.1
-2.0
-1.9
-1.8
-1.7
-1.6
-1.5
-1.4
-1.3
a Mg- 1Zn- 0. 23Y- 0. 5Nd
b Mg- 2Zn- 0. 46Y- 0. 5Nd
c Mg- 3Zn- 0. 69Y- 0. 5Nd
Pote
nti
al(
V)
Current density( A/cm2)
a
c
b
Fig. 3.7. Corrosion polarization curves of (a) 1# alloy (b) 2# alloy (c) 3# alloy
Fig. 3.8. SEM morphology of (a) 1# alloy (b) 2# alloy (c) 3# alloy after immersion for 12 h.
Moreover, Fig.3.8 revealed that after immersion in SBF for 12h, deposits containing O, C, P, Ca and Na etc formed on the surface. Among these three alloys, 2# alloy, with thin and homogenous film of corrosion products and second phases, indicated the best corrosion resistance, which was consistent with corrosion polarization results. 2#alloy possessed the favorable microstructure and corrosion resistance and would be optimized further concerning Nd content in the section 3.2.2.
3.2.2 As-cast Mg-Zn-Y-Nd alloys with varied Nd content In Fig.3.9, with the increasing content of Nd, the amount of the second phases increased, and the distribution of the second phase changed from continuous in Fig.3.9a into diffusive in Fig.3.9b and semi-continuous distribution in Fig.3.9c. Meanwhile, with Nd addition, the interdendritic distance was reduced. This might be mainly because the added Nd accumulated in the front of solid-liquid interface, and increased the constitutional under-cooling in the diffusion layer, leading to decreased grain size. In Fig.3.10, with the increase of Nd content, the phase compositions were α-Mg, Y2Zn3→α-Mg, Nd3Zn11→α-Mg, Mg41Nd5 and NdZn. The electronegativity difference between Zn and Y(0.43) is much higher than that between Mg and Y (0.09), and electronegativity difference between Zn and Nd is the highest (0.51). So Zn and Nd have the priority to form Nd3Zn11 phase.
www.intechopen.com

Magnesium Alloys - Corrosion and Surface Treatments
118
Fig. 3.9. Microstructures of as-cast alloys: (a) 4#0.0Nd (b) 5#0.5Nd (c) 6#1.0Nd.
Fig. 3.10. XRD patterns of (a) 4#0.0Nd (b) 5#0.5Nd (c) 6#1.0Nd.
3.2.3 Extruded Mg-Zn-Y-Nd alloys with varied Nd contents Extrusion can effectively improve the mechanical properties of Mg alloys through optimizing microstructure, such as refining grains, eliminating casting defects, homogenizing both α-Mg and second phases. The alloys prepared in section 3.2.2 were extruded at 340oC with extrusion ratio of 17.4. We re-marked the extruded ones as 7#, 8# and 9#, respectively. After extrusion, the microstructures were shown in Fig.3.11. Clearly, inhomogeneous grains could be found in Fig.3.11 (a) when no Nd was added in the Mg-Zn-Y alloys. With the addition of Nd(0.5% and 1.0%), a narrow grain size distribution and equiaxed grains could be observed from Fig.3.11 (b) and (c) evidently. Second phases with billet-shape morphology on grain boundaries (Fig.3.11b) changed gradually to line-shape (Fig.7c) and the amount of granules in matrix increased. All the alloys had equiaxed grains
Fig. 3.11. Microstructures of the extruded alloys (a) 7#0.0Nd (b) 8#0.5Nd (c) 9#1.0Nd.
www.intechopen.com

Mg Alloys Development and Surface Modification for Biomedical Application
119
with an average size of 3 ~ 4m, among which the optimized structure appeared in 8# alloys. In terms of the microstructure, a modest mount of Nd was preferred. As shown in Fig.3.12 (a) and (b), the addition of Nd led to the increase in amount of second phases. Phases like Mg2Y, Mg41Nd5, and NdZn2 were detected when the content of Nd reached 1.0w% in Fig.3.12 (b). EDS analysis confirmed the existence of Nd-riched phase in grain boundaries (Fig.3.12 c~f). Nd, Zn and Y formed new second phases and the amount of these phases rose with the increase of Nd addition.
Fig. 3.12. XRD patterns of extruded alloys (a) 7#alloy (b) 9#alloy; EDS mapping of 9# alloy
Fig. 3.13. Corrosion polarization curves of the alloys with different Nd content
Alloys Ecorr/V Icorr/ A.cm-2
7# -1.792 6.361×10⁻⁴ 8# -1.735 5.275×10⁻⁴ 9# -1.673 9.56×10⁻⁵
Table 3.4. Electrochemical parameters summarized from Fig. 3.13
www.intechopen.com

Magnesium Alloys - Corrosion and Surface Treatments
120
With the increase of Nd, corrosion potential shifted positively as showed in Fig.3.13. Electrochemical parameters summarized from Fig.3.13 were listed in Tab.3.4. These results proved that with the increasing amount of Nd addition, corrosion potential was improved and corrosion current density was decreased, demonstrating Nd’s effective enhancement in corrosion resistance of extruded Mg-Zn-Y-Nd alloys. Furthermore, possible reasons for the improvements in anticorrosion properties of alloys by Nd addition were listed below. (1) The addition of Nd could raise the electrode potential of matrix so as to improve corrosion resistance, which was exhibited from the variation of the slope of anodic polarization curves. (2) The second phases, with favorable passivity, morphology and distribution, formed after the addition of Nd and protected matrix in which they could block corrosion process. (3) The homogenization of the extruded microstructure, especially the grain size, as a consequence of addition of Nd, together with the small granule phase might effectively enhance the corrosion resistance. (4) Nd, as a kind of rare earth element, can purify melt and eliminate as-cast defects and impurities. (5) Nd mightimprove the compactness of oxidation film to prevent further corrosion.
Alloys 7# 8# 9# Micro-hardness (HV) 60.00 62.00 64.00
Tensile strength(MPa) 270.56 268.96 281.47
Elongation(%) 20.00 24.00 16.00
Table 3.5. Strength and elongation of extruded alloys with different Nd content
Fig. 3.14. Fracture morphology of the alloys (a) 7#alloy, (b) 8#alloy, (c) 9# alloy.
The effects of Nd addition on the final mechanical properties of extruded Mg alloys were investigated and summarized in Table 3.5. The micro-hardness increased slightly with the addition of Nd, which could be ascribed to dispersion strengthening caused by second phases and solid solution strengthening of Nd. Addition of 0.5wt% Nd improved the ductility (20% to 24%), with a slight decrease in tensile strength (270.56MPa to 268.96MPa). When the content of Nd was up to 1.0%, strength increased from 268.96MPa to 281.47MPa at the expense of decrease of ductility, which remarkably reduced from 24% to 16%. Mechanical properties of alloys are mainly determined by their composition and microstructure; and here, the content of Nd in the extruded alloy decided the microstructure features, such as the grain size, amount and distribution of second phases. The increasing addition of Nd had slight influence on grain size and thus the evolution of second phases played a significant role on properties. A small mount of Nd addition resulted in the formation of granules in matrix and consequently the elongation of the alloy was improved.
www.intechopen.com

Mg Alloys Development and Surface Modification for Biomedical Application
121
However, with further addition of Nd, when the second phase transformed to line-shape and continuous distribution along grain boundaries, tensile strength increased due to dispersion strengthening of second phase and solution strengthening of Nd; whereas, the ductility decreased significantly because of the morphology and nature of second phase. In Tab3.4, 8# alloys showed the best mechanical properties. This phenomenon was also confirmed by the fracture morphology in Fig.3.14. Compared with 7# and 9# alloys, the ductile dimples in 8# fracture were more homogenous and deeper. Additionally, many second phases were found resided in the center of the dimples, especially in 9# alloy. The mechanical properties of extruded alloy can meet the requirement of vascular stent.
3.2.4 Sub-rapid solidified Mg-Zn-Y-Nd alloy and Mg-Y-Gd-Nd alloy (WE43) Mg-Zn-Y-Nd and Mg-4Y-1Gd-2Nd (supplied by National Engineering Research Center of Light Alloys Net Forming, Shanghai Jiao Tong University) alloys were used as mater alloys. From Fig.3.15, as cast Mg-Y-Gd-Nd alloy was mainly composed of equiaxed grains and partially divorced interdendritic eutectics (by A), with average grain size about 70m. In Fig.3.16a, the main intermetallic compound in as cast Mg-Y-Gd-Nd alloy was MgGd3 phase. After sub-rapid solidification at 700oC, Mg2Y and Mg41Nd5 appeared. However, the microstructure of the as-cast Mg-Zn-Y-Nd alloy consisted of two kinds of phases: a-Mg and some small particles (Nd3Zn11), shown in Fig.3.15 (c) and Fig.3.16(c). The corresponding sub-rapid solidified Mg-Zn-Y-d alloy had new phases: I-phase (Mg3YZn6) and Mg41Nd5, identified in Fig. 3.16(d). Furthermore, the average grain size of as sub-rapid solidified both Mg-Y-Gd-Nd and Mg-Zn-Y-Nd alloy was reduced significantly to about 15m compared with as cast ones. The increase in cooling rate resulted in solute closure, notable decrease of grain size, more second phases and uniform distribution of elements.
Fig. 3.15. Optical images of alloys: (a) as cast Mg-Y-Gd-Nd; (b) sub-rapid solidified Mg-Y-Gd-Nd; (c) as cast Mg-Zn-Y-Nd; (d) sub-rapid solidified Mg-Zn-Y-Nd
A small amount of I-phase (Mg3YZn6) was detected in XRD pattern (Fig.3.16d). SEM microstructure in Fig.3.17(a) revealed that its morphology was spherical. Mg3Zn6Y (I-phase) in Mg-Zn-Y alloys was primarily reported by (Luo et al, 1994). But Mg3Zn6Y (I-phase) in Mg-Zn-Y-Nd alloys with low Zn and low Y content (Zn/Y atom ratio 6) was firstly discovered in this study. The average grain size of quasicrystal was about 500 nm. For both Mg-Y-Gd-Nd and Mg-Zn-Y-Nd alloys, sub-rapid solidification resulted in the formation of new phases: Mg2Y and Mg41Nd5 in Mg-Y-Gd-Nd while I-phase and Mg41Nd5 in Mg-Zn-Y-Nd alloy. The solidification rate should be beyond certain threshold to avoid the transformation of I-phase to crystallite; meanwhile, I-phase formed by nucleation and growing, which were controlled by diffusion process. Since the sub-rapid solidification has certain restrictions on atom diffusion, it is favorable to the formation of I-phase. However, the growing mechanism of quasicrystal still remains an unsolved and debating problem. Because of the special
www.intechopen.com

Magnesium Alloys - Corrosion and Surface Treatments
122
quasicrystal nature, including both crystal and non-crystal character, the alloys with I-phase will exhibit excellent corrosion-resistance.
Fig. 3.16. XRD patterns of corresponding alloys shown in Fig.3.15.
Fig. 3.17. (a) SEM morphology of spherical I-phase; (b) EDS of I phase.
Fig. 3.18. Polarization curves of alloys under different process conditions in dynamic SBF
Alloys State Ecorr/V Icorr(A/cm2)
As cast -1.95 1.86×10⁻⁴ Mg-Y-Gd-Nd Sub-rapid solidification -1.83 1.45×10⁻⁴
As cast -1.76 5.3×10⁻⁵ Mg-Zn-Y-Nd Sub-rapid solidification -1.57 2.62×10⁻⁵
Table 3.6. Corrosion potential and corrosion current
www.intechopen.com

Mg Alloys Development and Surface Modification for Biomedical Application
123
Fig. 3.19. Weight loss (a) and corrosion rate (b) of alloys shown in Fig.3.18
From results of the polarization curves in Fig.3.18 and immersion results in Figs.3.19, the sub-rapidly solidified Mg-Zn-Y-Nd alloy showed the highest corrosion resistance than others. The sub-rapid solidification not only refined grains, but also expanded the scope of the alloying and made the composition and microstructure more uniform. After sub-rapid solidification, the grain size became more uniform and the stability of grain boundary increased, which can reduce the amount of local pitting, thus, significantly improve corrosion resistance. For as cast alloys, the corrosion potential (-1.95 V for Mg-Y-Gd-Nd and -1.76 V for Mg-Zn-Y-Nd) was lower than that of as sub-rapidly solidified ones (-1.83 V for Mg-Y-Gd-Nd and -1.57 V for Mg-Zn-Y-Nd)( Table 3.6). Meanwhile, the current density of as cast or as sub-rapidly solidified Mg-Zn-Y-Nd alloy was much lower than that of Mg-Y-Gd-Nd alloy, demonstrating the corrosion properties of Mg-Zn-Y-Nd alloys, as sub-rapid solidification or as cast, were better than that of the Mg-Y-Gd-Nd alloys. The main reasons were as follows: Firstly, I-phase, which had low interfacial energy making it possess stable interface, appeared in as sub-rapidly solidified Mg–Zn–Y–Nd alloys; Secondly, I-phase owned excellent corrosion resistance itself; Thirdly, it has been widely accepted that Zn can reduce the detrimental effects of Fe, Ni on corrosion resistance and then improve the anticorrosion properties of Mg alloys (C.J. Boehlert, 2006). In Fig. 3.19, the corrosion rate of every alloy increased with the time increasing before 72 h, achieving the maximum at 72 h. After 72 h, the corrosion rate of every alloy declined with the time increasing. In the initial corrosion stage, the entire surface was exposed to the corrosive medium and the attack of medium was intensive. With the immersion time increasing, the corrosion products accumulated on the surface, which deposited and covered part of the surface, blocking the direct contact between the medium and the surface of samples and exhibiting certain protective effects. Thus, the corrosion rate of every alloy declined. In Fig.3.20, for the same alloy, the corrosion potential improved by about 80 mV in dynamic SBF (D-SBF) compared with that in static SBF. Firstly, in the SBF, the concentration of Cl- had a great influence on corrosion resistance. The Cl- converts Mg(OH)2, which was protective to alloy surface, into dissoluble MgCl2. Secondly, Cl-, with small radius, could penetrate the surface film easily. Then Cl- took the place of O2- and OH- which were absorbed onto the surface of alloys to form the soluble complex. The continuously cycling of dynamic SBF resulted in the stable and lesser Cl- concentration in the sample chamber, which made the corrosion morphology of alloys more uniform and then the corrosion rate slower. While in static SBF, as anodic reaction occurred, more and more Mg2+ dissolved into the solution; HCO3- and HPO42- were consumed, making the concentration of Cl- increase relatively and then the corrosion potential reduced and corrosion resistance decreased.
www.intechopen.com

Magnesium Alloys - Corrosion and Surface Treatments
124
1E-8 1E-7 1E-6 1E-5 1E-4 1E-3 0.01 0.1
-2.1
-1.8
-1.5
-1.2
a
cb
d
Pote
nti
al(
V)
Current density(A/cm2)
Fig. 3.20. Polarization curves of as sub-rapid solidification alloys: Mg-Y-Gd-Nd alloy in static (a) and dynamic (c) SBF; Mg-Zn-Y-Nd alloy in static (b) and dynamic (d) SBF.
4. Surface modification of Mg alloy
Although magnesium alloys are usually alloyed with elements, such as aluminum, manganese and zinc to improve corrosion resistance, further surface treatment is also required to physically prevent contact with the environment. The coating technologies, including the electrochemical deposition(ED), micro arc oxidation (MAO), liquid phase deposition (LPD) were used to achieve the corrosion resistance
4.1 TiO2/AZ31 prepared by LPD Fig.4.1 showed the XRD patterns of TiO2/AZ31 prepared at different conditions. As comparison, a standard powder diffraction file (PDF) of anatase TiO2 was shown in Fig. 4.1(d).In Fig.4.1, diffraction peaks corresponding to anatase TiO2 were observed, and the
Fig. 4.1. (a) XRD patterns of TiO2/AZ31 prepared at the annealing temperature of (A)250 °C,(B)300 °C, (C)350 °C and (D)380 °C for 1.5 h. The diffraction peaks of anatase TiO2 and AZ31 were shown by the mark of triangle and circle, respectively. (b) XRD patterns of TiO2/AZ31 prepared at the annealing temperature of 250 oC for 1h (A), 2h (B) and 3h(C). (c) XRD patterns of TiO2/AZ31 prepared at the annealing temperature of 380 oC for 2h with heating rate of 5°C/min(a), 15°C/min(b) and 30 °C/min(c).
www.intechopen.com

Mg Alloys Development and Surface Modification for Biomedical Application
125
spectra agreed with that of PDF file. The peak intensity of anatase TiO2 increased with the increase in annealing temperature or time, which proved that crystallinity of anatase can be improved by the increase in annealing temperature or time. The (101) peak intensity of anatase was almost independent of heating rate. The crystallinity of anatase was not influenced by heating rate at the fixed temperature. From Fig.4.2(a), which showed the image of an as-deposited TiO2 layer, the loosely deposited particles on the substrate can be found. As shown by the XRD results in Fig. 1(a), after annealing, the crystallization of anatase was improved, which can also be proved by the morphology evolvement revealed in Fig.2(b) and (c). In Fig. 2(b), pinholes can be found on the surface of TiO2 layer annealed at 250 °C. And they got eliminated by the annealing at 350 °C as shown in Fig.4.2(c). In Fig.4.2(c), the surface of the layer, consisting of fine particles, was finished, uniform and compact. Fig.4. 2(d) shows the enlarged image of one
Fig. 4.2. FE-SEM images of surface morphology of TiO2 layer. (a) as-deposited TiO2 layer; annealed at 250 °C(b),at 350 °C(c); (d) enlarged image of the particles (c).
Fig. 4.3. (a) Tafel polarization curves of samples prepared at different annealing temperature of 380 °C (a), 300 °C (b) and 250 °C (c) for 1.5h. The polarization curve of an as-deposited specimen was presented as (d). Fig.4.3 (b).Tafel polarization curves of samples prepared at the annealing time of 3h (a), 2h (b) and 1.5h(c) at the annealing temperature of 250 °C.
www.intechopen.com
Magnesium Alloys - Corrosion and Surface Treatments
126
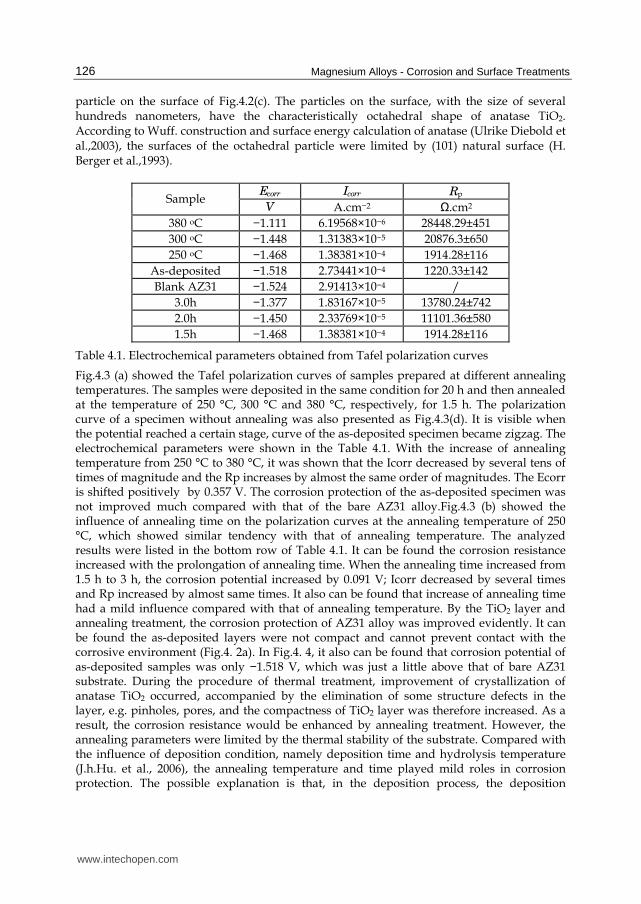
particle on the surface of Fig.4.2(c). The particles on the surface, with the size of several hundreds nanometers, have the characteristically octahedral shape of anatase TiO2. According to Wuff. construction and surface energy calculation of anatase (Ulrike Diebold et al.,2003), the surfaces of the octahedral particle were limited by (101) natural surface (H. Berger et al.,1993).
Ecorr Icorr Rp Sample V A.cm−2 Ω.cm2
380 oC −1.111 6.19568×10⁻⁶ 28448.29±451 300 oC −1.448 1.31383×10⁻⁵ 20876.3±650 250 oC −1.468 1.38381×10⁻⁴ 1914.28±116
As-deposited −1.518 2.73441×10⁻⁴ 1220.33±142 Blank AZ31 −1.524 2.91413×10⁻⁴ /
3.0h −1.377 1.83167×10⁻⁵ 13780.24±742 2.0h −1.450 2.33769×10⁻⁵ 11101.36±580 1.5h −1.468 1.38381×10⁻⁴ 1914.28±116
Table 4.1. Electrochemical parameters obtained from Tafel polarization curves
Fig.4.3 (a) showed the Tafel polarization curves of samples prepared at different annealing temperatures. The samples were deposited in the same condition for 20 h and then annealed at the temperature of 250 °C, 300 °C and 380 °C, respectively, for 1.5 h. The polarization curve of a specimen without annealing was also presented as Fig.4.3(d). It is visible when the potential reached a certain stage, curve of the as-deposited specimen became zigzag. The electrochemical parameters were shown in the Table 4.1. With the increase of annealing temperature from 250 °C to 380 °C, it was shown that the Icorr decreased by several tens of times of magnitude and the Rp increases by almost the same order of magnitudes. The Ecorr is shifted positively by 0.357 V. The corrosion protection of the as-deposited specimen was not improved much compared with that of the bare AZ31 alloy.Fig.4.3 (b) showed the influence of annealing time on the polarization curves at the annealing temperature of 250 °C, which showed similar tendency with that of annealing temperature. The analyzed results were listed in the bottom row of Table 4.1. It can be found the corrosion resistance increased with the prolongation of annealing time. When the annealing time increased from 1.5 h to 3 h, the corrosion potential increased by 0.091 V; Icorr decreased by several times and Rp increased by almost same times. It also can be found that increase of annealing time had a mild influence compared with that of annealing temperature. By the TiO2 layer and annealing treatment, the corrosion protection of AZ31 alloy was improved evidently. It can be found the as-deposited layers were not compact and cannot prevent contact with the corrosive environment (Fig.4. 2a). In Fig.4. 4, it also can be found that corrosion potential of as-deposited samples was only −1.518 V, which was just a little above that of bare AZ31 substrate. During the procedure of thermal treatment, improvement of crystallization of anatase TiO2 occurred, accompanied by the elimination of some structure defects in the layer, e.g. pinholes, pores, and the compactness of TiO2 layer was therefore increased. As a result, the corrosion resistance would be enhanced by annealing treatment. However, the annealing parameters were limited by the thermal stability of the substrate. Compared with the influence of deposition condition, namely deposition time and hydrolysis temperature (J.h.Hu. et al., 2006), the annealing temperature and time played mild roles in corrosion protection. The possible explanation is that, in the deposition process, the deposition
www.intechopen.com

Mg Alloys Development and Surface Modification for Biomedical Application
127
condition controlled the deposition rate, particle size and increase of thickness. Usually, formation of structure defects and increase of thickness, which played decisive roles in the protection of substrate, correlated with the deposition process.
4.2 HA coating prepared by CED The XRD patterns of as-deposited and alkali-heat -treated samples were shown in Fig.4.4, which indicated that the as-deposited coating was the mixture of HA and CaHPO4.2H2O (DCPD). However, the mixture transformed into HA single phase completely after post-treated with NaOH solution. The following reaction showed the transforming process:
10CaHPO4·2H2O → Ca10(PO4)6(OH)2 +4H3PO4 +18H2O (4.1)
The (002) peak is dominant in XRD patterns. According to Scherrer’s formula, the (002) peak was chosen to calculate the average crystallite size of the HA. The calculated particle size of the as-deposited HA and DCPD was about 40 nm. And after post-treated with NaOH solution, the crystallite size of HA was about 35 nm.
20 25 30 35 40
CaHPO4.2H
2O
HA
Mg
2θ /°
inte
nsit
y(a
.u.)
(b)
(a)
Fig. 4.4. XRD patterns of (a) as deposited coating, (b) post-treated coating on AZ31.
The surface morphologies of the as-deposited and post-treated coatings were shown in Fig.4.5 (a) and (c), respectively. Both the as-deposited and post-treated coatings exhibited morphologies like chrysanthemum flowers aggregating on the surface of the substrate. The as-deposited coating was mainly composed of radial plates-like structure, while nearly needle-like phase was presented on the post-treated coatings. A small mount of DCPD contained in the as-deposits was the possible reason for the morphology difference. The EDS in Fig.4.5 (b and d) showed that the coating was consisted of Ca, P, O, Na, Mg and C elements. The Mg2+and Na+ ions might substitute the Ca2+, which was similar with the composition of biological apatite from natural bone mineral. It was found that Ca/P atom ratio was always improved to a certain extent after post-treatment by NaOH, due to transmission of DCPD to HA. The average Ca/P atom ratios of as-deposited and post-treated was calculated about 1.40 and 1.50, respectively. Both were Ca-deficient HA (CDHA) coatings.
www.intechopen.com

Magnesium Alloys - Corrosion and Surface Treatments
128
Fig. 4.5. Morphology and EDS of coatings: (a, b) as-deposited; (c, d) post-treated by NaOH.
a
110
001
0.472nm
b
0.690nm
Fig. 4.6. TEM images of particles of post-treated coating: (a) TEM; (b) HRTEM.
-10 -8 -6 -4 -2 0-2.0
-1.9
-1.8
-1.7
-1.6
-1.5
-1.4
-1.3
-1.2
-1.1
-1.0
post-treated
as-deposited
Mg substrate
E/(
V,v
s.S
CE
)
logI/cm2(A/cm2
) Fig. 4.7. Polarization curves in SBF (Hank’ssolution) of specimen.
www.intechopen.com

Mg Alloys Development and Surface Modification for Biomedical Application
129
TEM was employed to study the microstructure of post-treated coating. Needle-like particles of 1000 nm in length and 35 nm in diameter (Fig.4.6a) had a slenderness ratio about 28.6. A typical crystallographic structure was shown by HRTEM (Fig.4.6b). The distances between the lattice lines are 0.690 and 0.472nm, respectively, which was comparable with the standard (001) and (110) planes distances of 0.688 and 0.472nm of HA. The FFT inset in Fig.4.6 (a) showed the incident direction of electron beam and growth direction of nano needle, which agreed with that analyzed from Fig.4.6 (b). The average grain size of HA crystal face (002) was about 35nm from Fig.4.6 (a), which was similar with the calculated value by using XRD pattern. Compared with blank magnesium alloy substrate, the Ecorr increased from -1.6 to -1.42 V significantly after surface was modified by HA. According to the polarization curves, it was observed that Icorr of substrate reduced from 2.51 × 10⁻⁵ to 2.51 × 10⁻⁸ A/cm2. It was clear that HA coating could improve effectively corrosion resistance of the substrate in SBF. It could also be seen that the Ecorr hardly had any change after alkali treatment. However, there was an evident Icorr change from 3.98 × 10⁻⁸ to 2.51 × 10⁻⁸ A. It could be concluded that the alkali treatment could help to decrease the degradation rate.
5 10 15 20 25 30
-1.5
-1.0
-0.5
0.0
0.5
c
b
a
spe
cifi
c m
ass
loss
(%
)
t (days)
a:substrate
b: as-deposited HA-coated specimen
c:post-treated HA-coated specimen.
Fig. 4.8. The specific mass loss of specimens immersed in SBF
Fig. 4.9. SEM images of corresponding specimens in Fig.4.8 immersed for 7 days.
In vitro test was performed by immersion in SBF for 30 days. There was a sharp mass loss of bare magnesium alloy in the first 2 days (Fig.4.8a), because there was high Cl- concentration in SBF. After 7 days’ immersing, the mass loss rate was not as fast as before, for the possible reason of the Ca-P-Mg deposits on substrate would inhibit the further corrosion. SEM image in Fig.4.9 (a) testified the deposition of Ca-P-Mg apatite. There was also corrosion pits observed on specimen surface of Mg alloy substrate after 7 days’ immersing. The deposits were mainly made up of Ca, P, O, C, Na and Mg elements from the EDS analysis. Fig.4.8 (b) and (c) were the as-deposited and post-treated coatings, respectively. There was obvious
www.intechopen.com

Magnesium Alloys - Corrosion and Surface Treatments
130
specific mass gain on both specimens for initial 10 immersing days. In the initial corrosion stage, the release of Mg2+ would increase its concentration on the interface. The Mg2+ rich interface would help the deposition of Ca-P-Mg apatite. The Ca-P-Mg apatite would increase the thickness of the coating and protect the substrate from further corroding. There was much more mass gain on post-treated coating than as-deposited coating. The mass lose of as-deposited specimens kept stable, while the mass gain of post-treated specimens increased slightly in the following 20 days. Compared with the as-deposited specimen in SBF, post-treated coating containing single HA phase was much more stable. The needle-like morphology would offer a much larger surface to contact with SBF solution and induce more apatite to deposit. The morphology of as-deposited and post-treated coating immersed in SBF for 7 days were showed in Fig.8 (b) and (c). There was apatite with Ca/P ≈1.60 deposited on post-treated coating. But the deposition of apatite on as-deposited coating was not evident.
4.3 Pulsed electrochemical deposition In a traditional cathodic ED process, when a static potential is applied, loose, porous and low adhesive coatings can be easily developed. The main reasons are: first, a polarization in concentrations is formed, since the speed of ion diffusion from the main body of the solution to the surface of the metallic substrate is too low; secondly, H2 is produced in the cathode due to the reduction of H2O. To solve this problem, it is suggested that pulsed power be used for depositing the adherent coating. Fig.4.10 showed the XRD patterns of HA coated magnesium and bare substrate. Clearly, peaks of the coating can be ascribed to the hexagonal HA (PDF No. 09-432). The lattice constants of the as-deposited HA were a = 9.397 Å and c = 6.838 Å, which did not match stoichiometric HA (a = 9.418 Å and c = 6.884 Å). The reason for this might be trace doping of Mg2+, Na+. According to Scherrer’s formula, the (0 0 2) peak was chosen to calculate the average grain size of the as-deposited HA (Li et al., 2008). The crystallite size of HA was about 40 nm.
.20 30 40 50 60
0
400
800
1200
(a)
Mg
HA
Inte
nsi
ty
2θ /°
(b)
Fig. 4.10. XRD patterns of Mg-Zn-Ca alloy (a) without and (b) with the as-deposited coating.
Fig.4.11 presented SEM micrographs of the Ca-P coating. Two different morphologies of the coating were observed (Fig.4.11a): a tabular region consist of irregular flake-like structure of approximately 100nm in thickness (Fig.4.11b), and a fluffy region composed of fine floc structure with less than 100 nm in diameter (Fig.4.11c) which partly covered plate-like coating. The acicular structure was regarded as the new nuclei of crystal and grew into the platelet ones gradually, as can be seen from the structures of the coatings deposited at 30
www.intechopen.com

Mg Alloys Development and Surface Modification for Biomedical Application
131
and 60 s (Fig.4.12a, b). Moreover, it can be seen from the images that these flakes develop almost perpendicularly to the substrate. It may be beneficial to have a flake-like structure for bone growth, since the inorganic apatite in bone has a plate-shaped morphology 2~3 nm in thickness and tens of nanometers in length and width. Moreover, it can be seen from Fig.4.12, that there were no cracks in the deposited coating though the stress introduced by the thermal cycling. The EDS results of the as-deposited coating showed that the Ca/P atomic ratio was approximately 1.34 evidently lower than 1.67. The reason might be trace doping of Mg2+, Na+. These Mg2+ and Na+ ions might substitute the Ca2+, which was similar with the composition of biological apatite from natural bone mineral. The as-deposited coating was proved to be composed of Ca-def. HA. This just meets the requirements for biodegradable implants, because many studies have indicated that the dissolution of HA in the human body after implantation is too slow to achieve optimal results, while Ca-def HA seems to be more soluble and may induce precipitation of a new bonelike apatite after implantation (Guan et al., 2008). The bonding strength between the coating and Mg alloy measured by a shear strength test was 41.8±2.7 MPa . This value was higher than the measured shear strength of natural cortical bone (35 MPa), was also greater than that of HA coatings prepared by traditional electrodeposition methods (14 MPa), and close to that of Ca-P coatings deposited on titanium by pulse electrodeposition (35-52 MPa). So HA coating prepared in pulse electrochemical deposition is of acceptable mechanical properties for using in high load-bearing conditions as an implant biomaterial.
Fig. 4.11. SEM images of the as-deposited coating: (a) low magnification (b) high magnification of the tabular region and (c) high magnification of the fluffy region
Fig. 4.12. HA coatings deposited at the initial stage. (a)30 s and (b)60 s.
Small amount of Mg element was also detected on the coating surface, which was probably caused by the diffusion of Mg cations. Mg2+ ions, which were produced from Mg substrate when the high anode current density (-20 mA/cm2) was applied, played an important role in increasing the adhesion strength as it was incorporated in the coatings. The inter-
www.intechopen.com

Magnesium Alloys - Corrosion and Surface Treatments
132
diffusion of Mg and O indicated the formation of metallurgic bonding on the HA/Mg alloy interface due to ready formation of O-Mg band. Generally speaking, surface modified implants are expected to have a well adhered interface, namely metallurgic bonding interface, which will improve their stress resistance and avoid the peeling-off of the coating during service. Those loose HA particles may be resolved, thus only adherent HA particles can continue to grow. Based on the above results, it is clear that the adherent Ca-def HA coating can be directly formed by the proper pulse electrode position process without any post-treatment. Similar to Ti alloy (Yamasaki et al., 2002), the principle of the pulse electrodeposition of Ca–P phases on the Mg alloy was analyzed. In this process, when a high cathode current density (10 mA/cm2) was applied, the cathodic polarization of the Mg alloy led to an increase in pH at the interface between the alloy and the electrolyte due to the formation of OH- ions. This sudden increase in pH triggered crystal nucleation and initiated crystal growth of the desired Ca–P phase directly on the substrate surface. There are four kinds of calcium phosphates, which are, in order of increasing solubility: Ca10(PO4)6(OH)2(HA), Ca2(PO4)3.nH2O (TCP), Ca8H2(PO4)6.5H2O (OCP) and Ca(HPO4).5H2O (DCPD). Under local strongly basic conditions, HA is the most stable calcium phosphate and is hence deposited on the Mg substrate according to the following reaction.
10Ca2++6PO43-+2OH-→Ca10(PO4)6(OH)2 (5.2)
Representative electrochemical polarization curves for different samples in SBF (Kokubo,2006) were given in Fig.4.13. The cathodic parts of the curves in Fig.4.13 indicated that the cathodic polarization current of the hydrogen evolution reaction on the Ca-def HA-coated Mg alloy was much higher than that on the uncoated Mg substrate. The overpotential of the cathodic hydrogen evolution reaction was lower on the Ca-def HA-coated Mg alloy than that on the uncoated Mg substrate. This also revealed that the cathodic reaction was easier kinetically on the Ca-def HA-coated specimen than on the bare one, which may be due to the existence of the Ca-def HA coating. For the uncoated Mg alloy, the anodic polarization curve showed a passivation-like region, which indicated the existence of some protective film on its surface. Kannan and Raman (Denissen et al., 1980) reported that phosphate, sulphate and calcium ions in modified SBF could precipitate on the surface of Mg alloy, causing the same effect. For the Ca-def. HA-coated Mg alloy, however, there was no such phenomenon in the range of ~250 mV. Values of the corrosion potential Ecorr and the corrosion current density Icorr were extracted from these curves and were shown in Table5.2. Due to the presence of the Ca-def HA coating, the Ecorr values were increased by about 230 mV, while the corrosion current density Icorr was about one order of magnitude lower than that of the uncoated magnesium. This result further indicated that the corrosion resistance of magnesium had been improved by the Ca-def HA coating. This was because the phosphorus in HA formed a gel-like layer and covered the surface completely, thereby protecting the underlying coating from environmental attack. The increase in resistance would greatly reduce the initial corrosion rate of implants and was important for maintaining the implant’s mechanical strength in the initial bone reunion period. In terms of the design of degradable implants, this means that a thinner or less bulky bone plate could be used compared with untreated Mg implants having the same service life. Basing on the hydrogen evolution rate (which is proportional to the metal dissolution or corrosion rate), Song (Dumelie et al., 2008) has suggested that a potential magnesium-based implant should possess a six times lower hydrogen evolution rate than AZ91 alloy. When
www.intechopen.com

Mg Alloys Development and Surface Modification for Biomedical Application
133
comparing the present electrochemical experimental results of the Ca-def. HA-coated Mg alloy with those of AZ91 alloy, the improvement in the corrosion resistance achieved was very encouraging, i.e. the Icorr value of the Ca-def HA-coated Mg alloy was about one-third as high as that of AZ91 alloy. Note that the data for AZ91 were taken from the literature reported by Kannan and Raman (Denissen et al., 1980). Thus Mg–Zn–Ca alloy coated with Ca-def HA is a promising candidate for biodegradable orthopaedic implants. The slow strain rate tensile (SSRT) results of uncoated and Ca-def HA-coated Mg alloy in air and in SBF were given in Table 5.3. The mechanical properties of bare Mg alloy decreased by only 11.1% (for UTS) and 11.3% (for TOF) when tested in SBF, in comparison with those in air. This illustrated that Mg–Zn–Ca alloy was not highly susceptible to stress corrosion. Because of the protection of Ca-def. HA coating, the mechanical properties of the coated alloy increased by 5.6% (for UTS) and 16.6% (for TOF) when tested in SBF, which were closer to those of the uncoated alloy in air. If only considering the alloy’s strength, the mechanical properties of bare and Ca-def HA-coated Mg alloy in SBF were both great enough to use as an implant material, because the maximum stress in bones during running or jumping was considered to be of the order of 100 MPa (Manso et al., 2000). However, the Ca-def HA coating delayed the decrease in strength of the Mg alloy, which would be helpful in supporting the fractured bone for a longer time. Moreover, the mechanical properties of the coated Mg alloy were similar to those of the substrate when tested in air (Kuo & Yen, 2002).
Fig. 4.13. Polarization curves in SBF of (a) uncoated and coated(b) Mg-Zn-Ca alloy.
Sample Corrosion
potential,Ecorr(mV) Corrosion current density,Icorr
(μA/cm2)
Bare Mg alloy -1645 110 Ca-def. HA/Mg alloy -1414 25
Table 4.2. Electrochemical parameters obtained from the polarization curves.
In SBF In air Sample TOF(h) UTS(MPa) TOF(h) UTS(MPa)
Bare Mg alloy 38.6±1.4 144±3 43.5±0.8 162±2 Ca-def. HA/Mg alloy 45.0±1.0 152±5 44.3±0.5 175±3
Table 4.3. SSRT results of Mg alloy with and without Ca-def HA coating. UTS:ultimate tensile strength; TOF: time of fracture.
www.intechopen.com

Magnesium Alloys - Corrosion and Surface Treatments
134
4.4 Micro-arc oxidation (MAO)/ electrochemical deposition (ED) composite coatings Micro-arc oxidation (MAO) had been well developed as a room-temperature electrochemical process suitable for the formation of native ceramic films with porous structure on the surface of Ti, Al, Mg alloys. It was found that the MAO coating offered porous surface and good adhesion strength with the substrate. When the MAO coating was introduced as a transition layer, it is expected that the pores on MAO coating can provide pinning sites for the ED coating. Fig.4.14 showed the surface morphology of the single MAO (a) coating and the composite coating of HA/MAO (b). The pores with different size were randomly distributed on the single MAO coating (Fig.4.14a), which resulted from the molten oxide and gas bubbles thrown out of micro-arc discharge channels. No micro-cracks existed on the surface of the MAO coating though the rapid solidification of the molten oxide in the cooling electrolyte always caused stress. The porous surface of the MAO coating provided a template for the ED process. It can be clearly seen that the composite coatings were composed of irregular needle-like structure (Fig.4.14b), which uniformly distributed on the sample surface. Compared with the HA grown on the Mg alloy substrate directly in section 4.2, the HA/MAO coating had quite low dimensions. The pores which formed during MAO treatment (Fig.4.14a) were the conductive channel in the ED process. Under the electric field, ions in the electrolyte moved into the pores and deposited on the wall of the pores. The nucleation and growth of HA were limited physically by these pores structure. For the ED process in the low deposition temperature which reduced the thermal stress, there were no micro-cracks appeared on the composite coatings. The surface of the composite coatings composed of the nanoneedle-like structure still retained the porous characteristic of the single MAO coating. As a bone implant material, porous surface is beneficial to cell attachment, propagation, bone tissue growth and anchoring of implant to bone.
Fig. 4.14. Morphology of (a) single MAO coating and (b) composite coatings and corresponding EDS spectra.
EDS analysis of the surface of the MAO coating and the composite coatings were showed in Fig.4.14(c) and (d), respectively. The element of the single MAO coating consisted of Mg, O, P, C, Na and Zn elements (Fig.4.14c). The element Mg and trace Zn were derived from the Mg-Zn-Ca alloy transferring through micro-pores, and other elements were from electrolyte. Compared with the elemental composition of single MAO coating, the element Ca was deposited on the composite coatings (Fig.4.14b). In addition, the amount of element Mg was decreased sharply. It was possible that the Mg element was sealed in the substrate and MAO coating by the HA coating. The cross-section morphology and corresponding elemental distribution across the composite coatings were analyzed with SEM and EDS line analysis and shown in Fig.4.15 (a) and (b), respectively. From the cross-section morphology (Fig.4.15a), the thickness of the composite coatings was about 15 m and no apparent defects were observed. Moreover,
www.intechopen.com
Mg Alloys Development and Surface Modification for Biomedical Application
135
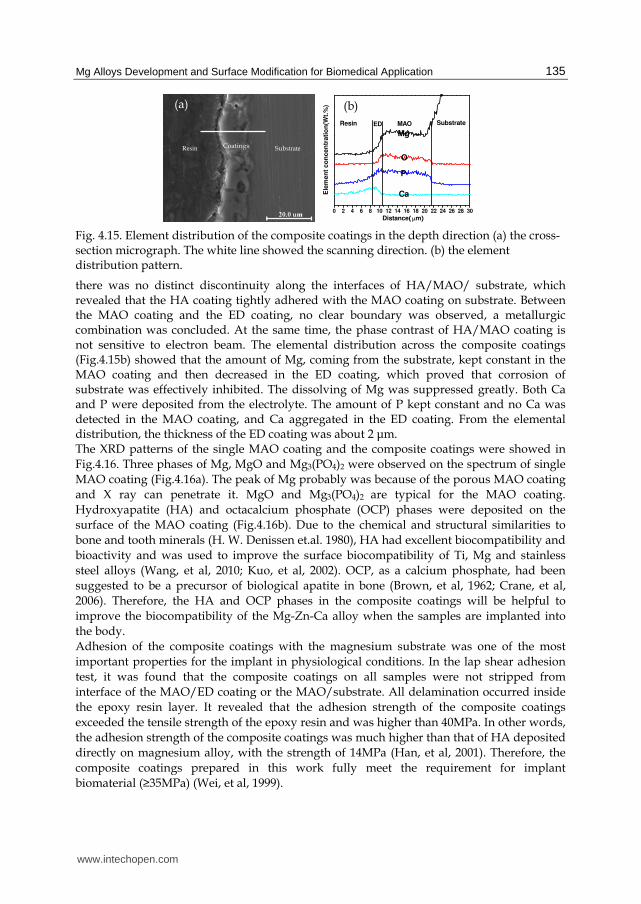
Fig. 4.15. Element distribution of the composite coatings in the depth direction (a) the cross-section micrograph. The white line showed the scanning direction. (b) the element distribution pattern.
there was no distinct discontinuity along the interfaces of HA/MAO/ substrate, which revealed that the HA coating tightly adhered with the MAO coating on substrate. Between the MAO coating and the ED coating, no clear boundary was observed, a metallurgic combination was concluded. At the same time, the phase contrast of HA/MAO coating is not sensitive to electron beam. The elemental distribution across the composite coatings (Fig.4.15b) showed that the amount of Mg, coming from the substrate, kept constant in the MAO coating and then decreased in the ED coating, which proved that corrosion of substrate was effectively inhibited. The dissolving of Mg was suppressed greatly. Both Ca and P were deposited from the electrolyte. The amount of P kept constant and no Ca was detected in the MAO coating, and Ca aggregated in the ED coating. From the elemental distribution, the thickness of the ED coating was about 2 m. The XRD patterns of the single MAO coating and the composite coatings were showed in Fig.4.16. Three phases of Mg, MgO and Mg3(PO4)2 were observed on the spectrum of single MAO coating (Fig.4.16a). The peak of Mg probably was because of the porous MAO coating and X ray can penetrate it. MgO and Mg3(PO4)2 are typical for the MAO coating. Hydroxyapatite (HA) and octacalcium phosphate (OCP) phases were deposited on the surface of the MAO coating (Fig.4.16b). Due to the chemical and structural similarities to bone and tooth minerals (H. W. Denissen et.al. 1980), HA had excellent biocompatibility and bioactivity and was used to improve the surface biocompatibility of Ti, Mg and stainless steel alloys (Wang, et al, 2010; Kuo, et al, 2002). OCP, as a calcium phosphate, had been suggested to be a precursor of biological apatite in bone (Brown, et al, 1962; Crane, et al, 2006). Therefore, the HA and OCP phases in the composite coatings will be helpful to improve the biocompatibility of the Mg-Zn-Ca alloy when the samples are implanted into the body. Adhesion of the composite coatings with the magnesium substrate was one of the most important properties for the implant in physiological conditions. In the lap shear adhesion test, it was found that the composite coatings on all samples were not stripped from interface of the MAO/ED coating or the MAO/substrate. All delamination occurred inside the epoxy resin layer. It revealed that the adhesion strength of the composite coatings exceeded the tensile strength of the epoxy resin and was higher than 40MPa. In other words, the adhesion strength of the composite coatings was much higher than that of HA deposited directly on magnesium alloy, with the strength of 14MPa (Han, et al, 2001). Therefore, the composite coatings prepared in this work fully meet the requirement for implant biomaterial (≥35MPa) (Wei, et al, 1999).
Resin Coatings Substrate
(a)
0 2 4 6 8 10 12 14 16 18 20 22 24 26 28 30
Ele
me
nt
co
nc
en
tra
tio
n(W
t.%
)
Resin Substrate
Mg
O
P
Ca
Distance(μm)
MAOED
(b)
www.intechopen.com

Magnesium Alloys - Corrosion and Surface Treatments
136
10 20 30 40 50 60 70 80
2000
4000
Inte
nsi
ty/a
.u
2θ/degree
MgMg3( PO4) 2MgO
(a)
10 20 30 40 50 60 70 80
2000
Inte
nsi
ty/a
.u.
2θ(degree)
HA
Mg3(PO4)2OCP
MgO
(b)
Fig. 4.16. XRD patterns of (a) the single MAO coating and (b) the composite coatings on Mg-Zn-Ca alloy
The corrosion resistances of the substrate, MAO/substrate and HA/MAO/substrate samples were evaluated through potentiodynamic polarization tests in SBF solution at 37°C (Kokubo, 2006). Fig.4.17 showed the polarization curves for different samples. In Fig.4.17, the anodic polarization curve of the substrate and the MAO coating modified samples showed a passivation-like region, which indicated the deposition of some protective films on their surface. Kannan and Raman (Kannan, et al, 2008) reported that phosphate, sulphate and calcium ions in modified SBF could precipitate on the surface of Mg alloy. But the composite coatings modified samples did not have such phenomenon. The corrosion potential (Ecorr) and corrosion current density (Icorr) were extracted from the polarization curves and summarized in Table 5.4. As can be seen in Tab.5.4, the corrosion potential Ecorr of the single MAO coating and the composite coatings modified samples were -1.614V and -1.495V, respectively. Both of them showed more positive than the substrate with -1.705V, while the corrosion current density Icorr of two coatings were about two orders and three orders of magnitude lower than that of the substrate, respectively. These results indicated that the corrosion resistance of magnesium alloy had been evidently improved by the single MAO coating and the composite coatings, and these also showed that the corrosion resistance of the sample with the composite coatings was better than the single MAO coating. The improvement of corrosion resistance will effectively reduce the initial corrosion rate of implants and greatly maintain the mechanical strength of the implants in the pre-bone healing.
-9 -6 -3 0
-1.8
-1.6
-1.4
-1.2
Po
ten
tia
l/V
Log Current Density A/cm2
ab
c
Substrate
MAO
MAO+ED
abc
Fig. 4.17. Polarization curves of different samples in SBF solution at 37°C
www.intechopen.com

Mg Alloys Development and Surface Modification for Biomedical Application
137
Sample Corrosion potential (Ecorr, V) Current density (Icorr, A/cm2) Bare Mg alloy -1.705 3.84×10⁻⁴
MAO /Substrate -1.614 6.51×10⁻⁶ MAO/ED/Substrate -1.495 9.13×10⁻⁷
Table 4.4. Electrochemical parameters of the samples obtained from the polarization curves
The protection capacity of the single MAO coating and the composite coatings to the Mg-Zn-Ca alloy was also evaluated by the hydrogen evolution test. Hydrogen volume was shown in Fig.4.18 as a function of immersion period. There was sharp hydrogen evolution of Mg-Zn-Ca substrate in the first 3days (Fig.4.18a), because there was high Cl- concentration in SBF which caused the substrate to corrode fast. As the time increased, the corrosion rate of the magnesium alloy decreased. The possible reason was that Ca-P compounds deposited on the specimens surface, forming a new protective layer, and reducing the corrosion rate. Fig.4.19 (a) showed the surface morphology of the substrate immersed for 7 days. The particles and the cracks were observed on the surface of the Mg-Zn-Ca alloy, and the element of the particles mainly consisted of Ca, P, C, O, Na, Mg and Zn from the EDS analysis, which was in agreement with the literature (Kannan, et al, 2008). Fig.4.18 (b) showed the amount of hydrogen evolution of the MAO/substrate sample, which was much less than the substrate, and the increase rate decreased as the immersion time. As can be seen in Fig.4.19(b), the surface of MAO/substrate sample was modified slightly after soaking for 7 days in SBF, and deposits particles were observed on the surface and in the pores. The ions in the SBF penetrated through the micro-pores and deposited in the pores and surface. Therefore, the corrosion rate of the single MAO/substrate sample was reduced as the immersion time because the pores were sealed little by little during immersion period. The corrosion rate of ED/ MAO/substrate sample was slower than the single MAO/substrate samples. The hydrogen evolution rate was about 0.04 ml/cm2/day after immersion for 3 days. It was about two-third of that of hydrogen evolution rate of AZ91D (Song, 2007). The reported value was little higher than the tolerated level, which was used to screen out biodegradable candidates for human body implants. The entire surface of the
0 2 4 6 80
2
4
6
8
10
Hy
dro
gen
vo
lum
e/(m
l/cm
2)
Time(days)
Substrate
MAO
MAO+EDa
b
c
Fig. 4.18. The amount of hydrogen evolution of specimens immersed in SBF: (a) substrate, (b) the MAO/substrate sample and (c) the ED/ MAO/substrate sample.
www.intechopen.com

Magnesium Alloys - Corrosion and Surface Treatments
138
Fig. 4.19. SEM images of corresponding specimens in Fig.4.18 immersed in SBF for 7days
ED/ MAO/substrate sample after immersion for 7 days was covered by deposits (Fig.4.19c). The new deposits layer was shown in detail in Fig.4.19 (d), which showed the new layer was composed by many rod-like precipitates. The main elements of the new layer were Ca, P and O, which revealed that the composite coatings could induce the Ca/P salt deposition and had fine biomimetic mineralization ability. The new layer improved the thickness of the composite coatings and further enhanced the protection effect to the substrate. Additionally, the surface morphology evolution of the ED/ MAO/substrate sample after immersion for 7 days proved that the composite coating had better Ca-P salt induction property than that of pure HA coating (Wen, et al, 2009). Fig.4.20 showed the compressive load of the substrate and the ED/ MAO/substrate immersed in SBF for different time. The results of the compressive load and compressive strength of the samples were shown in Tab.5.5 (The corrosion area changed of the cross-section was neglected to calculate the compressive strength). In Fig.4.20, the compressive load and strength of the ED/ MAO/substrate were higher than those of the substrate after 2 and 6 weeks immersion. The results indicated that the composite coatings delayed the strength loss of the Mg-Zn-Ca alloy. As shown in Tab.5.5, the compressive loads of the substrate were decreased to 19.5 KN and 13.9 KN after 2 and 6 weeks immersion, and the compressive strength were 248.2 MPa and 177.2 MPa respectively. Because of the protection of the composite coatings, the compressive load and strength of the ED/ MAO/substrate were 21.7 KN and 276.1 MPa after 2 weeks immersion, and 18.2 KN and 231.1 MPa for 6 weeks immersion. Generally, the compressive strengths of human bones were 100~230 MPa in cortical bone and 2~12 MPa in cancellous bone (A. Rakngarma, 2009). Therefore, the composite coatings effectively delayed the decrease in mechanical properties of the Mg-Zn-Ca alloy, and provided adequate support for the pre-healing of fracture bone.
ED/ MAO/substrate
MAO/ substrate
Sample Before immersion 2
weeks 6
weeks 2
weeks 6
weeks
Compressive load(KN) 26.1 21.7 18.2 19.5 13.9
Compressive strength(MPa)
332.9 276.1 231.1 248.2 177.2
Table 4.5. Compression test results after immersion for a period.
www.intechopen.com

Mg Alloys Development and Surface Modification for Biomedical Application
139
0 10 20 300
10
20
30
Co
mp
ress
ive
lo
ad(K
N)
Compressive strain(%)
12
34
5
Befor immersed
Coatings after 2weeks immersed
Substrate after 2weeks immersed
Coatings after 6weeks immersed
Substrate after 6weeks immersed
12345
Fig. 4.20. The compression curse of the immersed samples
4.5 HA / Ti-O film / Mg alloy In the research of NiTi stents, it was found that titanium oxide film formed because of oxidization, and the film improved the biocompatibility (Christine et al., 1997). N.Huang fabricated titanium oxide film on permanent stent, and demonstrated the improved biocompatibility and good bonding strength with substrates (Huang et al.,2003). In this section, titanium oxide was deposited on magnesium alloy substrate and served as intermediate layers to protect from rapid corrosion. Hydroxyappatite, as outer layer, was deposited on titanium oxide film. Fig.4.21 showed the XRD patterns of the samples. It could be seen that the sample with titanium oxide film exhibited only magnesium peaks. No peaks of titanium dioxide were found. It has been proved that without heat treatment, it is hard to form rutile and anatase. So the titanium oxide on the sample should be amorphous. It was reported that the amorphous Ti-O film had evident biocompatibility, though less than crystalline Ti-O films. The XRD pattern of hydroxyappatite was also shown in Fig.4.21, the diffraction peaks of HA could be observed. The diffraction at 25.6° is seen as the typical peak of hydroxyapatite. So it could be sure that the hydroxyapatite was deposited on the titanium oxide.
20 30 40 50 60
Inte
nsi
ty
Diffraction angle 2θ
Mg
HA
Fig. 4.21. The XRD patterns of the sample with Ti-O film and composite coating
www.intechopen.com

Magnesium Alloys - Corrosion and Surface Treatments
140
Fig. 4.22. The morphology of Ti-O film and hydroxyappatite
1E-6 1E-5 1E-4 1E-3 0.01 0.1
-2.0
-1.6
-1.2(a)
Po
ten
tia
l/V
Current density/Acm-2
Substrate
Ti-O film
Composite coating
0 10 20 30 40 50 60 70 80
7.4
7.6
7.8
8.0(b)
substrate
Ti-O film coated
composite coatingP
H v
alu
e
immersion time/h Fig. 4.23. (a) The polarization curves of the sample in SBF,(b) pH value change of SBF.
It could be observed from the FESEM images that the titanium oxide film was uniform, no crack was found in Fig.4.22 (a). According to the calculation by the deposition rate, the titanium oxide was with a thickness of about 200nm, after deposition for 2 hours. The outer layer was composed of flake-like HA, which was typical morphology for HA. The EDS results showed that only three elements were detected in the Ti-O/substrate sample. Because the thickness of the film was about 200nm the substrate was detected by X-ray, so it couldn't be concluded that there was magnesium atoms in the titanium oxide film while in the EDS results of HA/Ti-O coating, calcium, magnesium, oxygen, phosphorus, sodium were observed. Calcium, oxygen, and phosphorus were all components in HA. During the formation of HA, the magnesium and sodium would take the place of calcium in crystal structure, thus the Ca/P atomic rate was reduced. The tests in section 4.3 have showed that calcium-deficient HA coatings were more susceptive to degradation. In Fig.4.23(a), it could be observed that the potential of magnesium substrate in SBF(Kokubo et al., 2006) was about -1.8V. And the corrosion potential was improved by 200mV and 300mV by Ti-O film and Ti-O/HA composite coating, respectively. The titanium oxide film prevented the interaction of substrate with the fluid, and the deposition of HA coatings improved the corrosion resistance further. The improvement in corrosion resistance by Ti-O film and composite coating was also demonstrated by pH value test. With the protection of Ti-O film and composite coating, the corresponding pH value increased with a low rate and reached to 7.75 and 7.63 ,respectively.. The bare substrate reacted with the solution quickly, and caused a sudden increase of PH value even in the first immersion day. In the first day, the pH value increased up to 7.95.
5. In vivo biodegradation
A wide consideration has been given to improve the biocompatibility and corrosion resistance of Mg alloy. Almost all the evaluations have been done in the SBF environment.
www.intechopen.com

Mg Alloys Development and Surface Modification for Biomedical Application
141
The in vivo performance of implants requires further experiment due to the difference between the simulated physiological environment and real condition even in the dynamic SBF system.
5.1 HA/AZ31 Fig.5.1.(a-d) showed the surface SEM images of the uncoated and HA-coated AZ31 implants after 6 weeks implantation. As seen in Fig.5.1(a, c), uncoated sample surface was coarse and the surface presented a crackled appearance maybe due to fast degradation. For the HA-coated sample, the surface coverage was uniform and no localized corrosion was observed (Fig.5.1b). The coated implant surface was covered by a new mineralized layer (Fig.5.1d). The original HA surface was also found somewhere where the typical needle-like HA coating was exposed (typically area A, inset in Fig.5.1d). The EDS results showed that the presence of carbon, oxygen, phosphorus, calcium, magnesium and aluminum on the surface of the uncoated implant, and the calcium and phosphorus atomic ratio of deposition was 0.87. In contrast, the HA-coated sample was only rich in carbon, oxygen, phosphorus, and calcium, no magnesium and aluminum were detected. The calcium and phosphorus atomic ratio was 1.82, higher than the theoretical value 1.67 of HA.
Fig. 5.1. SEM micrographs of (a) uncoated (b) HA-coated implant after 6 weeks implantation, (c) and (b)high magnification images of selected area in (a) and (b), respectively.
After 12 weeks implantation (Fig.5.2), the uncoated sample was covered with corrosion products. The surface integrity was destroyed due to severe selective corrosion. As shown in Fig.5.2 (a), besides the formation of serious crack, sample surface was undermined and some deep pits were left on the surface (by white arrow in Fig.5.2a).The surface of HA-coated sample was covered by the Ca-P deposits partly. The EDS analysis results showed that the surface contained a little zinc and Mn. Both of them were not detected after 6 weeks implantation. The EDS spectrum difference proved the continuous corrosion of alloy. In the case of HA-coated sample, the flower needle-like HA coating dissolved (Fig.5.2b). Some positions of the coating exhibited the peeled-off feature (Fig.5.2b).
Fig. 5.2. SEM images of (a) uncoated, (b) HA-coated implants after 12 weeks implantation.
www.intechopen.com

Magnesium Alloys - Corrosion and Surface Treatments
142
Fig.5.3a-c illustrated the surface of the HA-coated AZ31 after18, 24, 30 weeks, respectively. Selective corrosion pits were not observed on the surface with increasing implantation time. The surface of implants was attached by more and more porous network structure gradually from 18 weeks to 30 weeks. The pore structure was conducive to the growth of bone cells and tissue recovery. EDS results (Fig.5.3d) showed that composition of selected area B in Fig.5.3a was mainly composed of calcium and phosphorus and a small amount of Mg, Al, Zn. A. L. Boskey pointed out that Mg2+ concentration has a great effect on mineralization process, if magnesium and calcium atomic ratio is more than 0.2, it will hamper mineralization transformation from precursor amorphous HA (ACP) to the HA (Boskey & Posner, 1974). In contrast, the area A in Fig.5.3a was highly rich in carbon and oxygen and little amount of calcium and phosphorus. It could be also seen that carbon content increased significantly with the increasing implantation time. It was conclude the deposition of protein from physiological environment and growth of new body tissue occurred from 18 weeks. It might be hypothesized that precipitations of calcium phosphates and corrosion products such as magnesium oxides and magnesium hydroxides formed a complex corrosion layer on the implants in vivo that may slow down the corrosion process and played a further protection role (Witte et al., 2005).
Fig. 5.3. SEM micrographs of coated implants at (a) 18 weeks, (b) 24 weeks , (c) 30 weeks, (d) EDS spectrum of area A in (a), (e) EDS spectrum of area B in (a), and (f) EDS spectrum of (c).
Fig.5.4 showed the weight change of the HA/AZ31 rods after 6, 12, 18, 24, 30 weeks implantation. There was obvious mass gain for initial 12 weeks implantation. Then the mass decreased throughout the following implantation period, indicating a continuous biodegradation process inside the rabbit femora. The average biodegradation rate of HA-coated AZ31 alloy rods was calculated to be about 0.21 mg/cm2/day. But for the uncoated sample, (35±0.22)% mass loss happened after 12 weeks implantation, the average biodegradation rate was calculated to be about 0.54 mg/cm2/day. Intake of a certain amount of magnesium (300-400 mg/day) is normally required for the human body's metabolic activities. According to the measured weight loss rate of HA-coated samples (0.21 mg/cm2/day), as long as the total surface area is less than 1429 cm2, for uncoated samples (0.54 mg/cm2/day) as long as the total surface area is less than 556 cm2, the dissolved magnesium would be easily absorbed or consumed by the human body. Fig.5.5 showed the radiographs of rabbit femora with implantation of uncoated AZ31 rods at 6, 12 weeks and HA/AZ31 rods at 6, 12, 18, 24 and 30 weeks. In contrast to uncoated samples at 6, 12 weeks (Fig.5.5a~d), the profiles of HA-coated samples were clearer at the corresponding time (Fig.5.5e~h). Fig.5.5 indicated degradation process of uncoated and HA-coated AZ31 robs during the whole experiment period, which was evaluated by the reducing diameter of rods. From Fig.5.5a~d, it was proved that uncoated samples degraded fast because rod profiles presented an irregular shape and were fuzzier than that of 6 weeks. What is more, gas shadows (arrow in Fig.5.5b) were observed in soft tissues and bone marrow cavity around the uncoated samples at 6 weeks. After 12 weeks implantation, the
www.intechopen.com

Mg Alloys Development and Surface Modification for Biomedical Application
143
Fig. 5.4. Weight change of the HA/AZ31 rods during implantation period.
gas shadows vanished (Fig.5.6d) without a special treatment. Compared to uncoated samples, gas shadows were not detected during the whole experiment period. HA-coated samples maintained original column shape during the first 18 weeks (Fig.5.5e-j). After 18 weeks, the profiles of HA-coated samples were not distinct, indicating the evident degradation of sample. Moreover, the periosteal reaction was observed around the HA-coated samples which indicated the formation of new bone. (Fig.5.5k~n). Fig.5.6 showed histological analysis of the bone tissue response to the uncoated samples at 6, 12 weeks and HA-coated samples at 6, 12, 18, 24 and 30 weeks. It could be clearly seen that the newly formed bone lamellar trabecula was formed in the bone tissue around both uncoated and coated samples (Fig.5.6a~f). There is growing evidence that if the releasing of magnesium is acceptable by human body, it will help to stimulate the healing of bone tissue. There were some inflammation response and congestion phenomena in uncoated sample group at 6, 12weeks (rectangles marked in Fig.5.6a, c), without any multinucleated giant cells. In contrast, not any inflammation response and congestion phenomena were observed in HA-coated sample group. The newly formed bone was clearly seen in HA-coated sample group, which was evident by a large number of osteoblasts (ellipses in Fig.5.6b, d~g). Osteoblasts and osteocytes increased and became more orderly with the time increasing from 6 weeks to 18 weeks (Fig.5.6b, d~c), then they stabilized at the following stage (Fig.5.6f). Periosteum ossification phenomenon was found after 30 weeks implantation (Fig.5.6g). The presence of HA coating improved the bone-biomaterial interface absorptiveness, which showed the histological attachment of bone to the implant surface. This result indicated that HA/AZ31 actually has good osteoconductivity and stimulatory effect on the growth of new bone tissue due to its functional roles and presence in the bone. It was reported that the presence of magnesium on orthopedic implants could enhance the adhesion of osteoblastic cells and promote optimal osteogenesis (Zreiqat et al., 2002). Table 6.1 listed the the serum magnesium and calcium concentration levels of rabbits before and after implantation at different periods. No significant difference was found in each item before implantation and after 6, 12, 18, 24, 30 weeks implantation. It is improtant that the alloy was degradated in an appropriate rate that the rabit can aborb the released Mg2+ untill the new bone grew. The physiological equilibrium of magnesium in the body could keep the serum level constant. Mg element maybe absorbed into the muscle and the bone as storage areas, while the excess magnesium in the serum would be metabolized via the kidneys.
www.intechopen.com

Magnesium Alloys - Corrosion and Surface Treatments
144
Fig. 5.5. Femora radiographs of rabbits with implants at different periods. Uncoated AZ31 alloy rods at (a& b) 6 weeks, (c & d) 12 weeks implantation, and HA-coated AZ31 alloy rods at (e& f) 6 weeks, (g & h) 12 weeks, (i & j) 18 weeks, (k &l) 24 weeks, (m & n) 30 weeks implantation. The parallel images are from different directions.
Fig. 5.6. Histological photographs of the bone tissues around uncoated implants at (a) 6 weeks, (b) 12 weeks, and HA-coated implants at (c) 6 weeks, (d) 12 weeks, (e) 18 weeks, (f) 24 weeks, and (g) 30 weeks. Ellipses indicate osteoblast; rectangles indicate inflammation response and congestion phenomena. Magnification: 20×).
www.intechopen.com

Mg Alloys Development and Surface Modification for Biomedical Application
145
Item Magnesium(mmol/l) Calcium(mmol/l)
Before implantation 0.845±0.16 1.196±0.13
Uncoated implants (6 weeks) 0.881±0.25 1.197±0.18
Uncoated implants (12 weeks) 0.926±0.18 1.369±0.10
HA-coated implants (6 weeks) 0.878±0.09 1.411±0.08
HA-coated implants (12 weeks) 0.869±0.13 1.409±0.06
HA-coated implants (18 weeks) 0.852±0.10 1.210±0.13
HA-coated implants (24 weeks) 0.807±0.17 1.155±0.05
HA-coated implants (30 weeks) 0.815±0.12 1.181±0.07
Table 5.1. Serum magnesium and calcium concentration of rabbits.
5.2 HA/MAO/ Mg-Zn-Ca alloy The degradation of the naked and HA/MAO coated Mg-Zn-Ca alloy in the rabbit femoral shaft after 8, 12 and 18 weeks implantation were in suit observed non-destructively by micro-CT with 3D reconstruction (Fig.5.7). The implants were in the os integumental and marrow cavity. It could be clearly observed, within the 12weeks, that the substrate samples degraded (volume loss) much more rapidly than the HA-coated samples, and serious pitting occurred on the substrate samples. In Fig.5.7(d), within the 12th week, the HA-coated sample could still keep the integrity and can absorb load apparently. So it could be concluded that the composite coatings delayed the rapid corrosion of substrate, which was also demonstrated in the following research. Fig.5.8(a) showed the compressive strength of the samples after implantation for different time. It was observed that the loss of mechanical integrity was much greater than the following period, which was attributed to the local corrosion in the early period. After implantation for 8 weeks, the compressive integrity of substrate was about 116.2 MPa. It was reported that the compression strength of natural bone was about 100~230 MPa. So it was demonstrated that after 8 weeks implantation, the substrate samples could absorb the load effectively. While the compressive strength of samples with composite coatings after implantation for 8 and 18 weeks were 218.6 and 119 MPa, respectively, which were much higher than that of substrate samples, and could fully meet the requirement of bone implants. The compressive integrity of samples in vivo test showed that the samples after modification with composite coatings could compromise mechanical integrity and degradation rate perfectly during the healing period, which provided clinical application with valuable data. Fig.5.8 (b) showed the calcium and zinc ion concentration in the blood and urine of rabbits after implantation for different time. It was seen that before implantation the magnesium ions in urine of the two groups was about 1.8mmol/l, higher than that in the blood, which could be ascribed to the metabolism of magnesium ions by kidney. The concentration of magnesium ions in the blood of two groups in 8th, 12th, 24th week fluctuated between 0.7 and 0.8mmol/l, which was quite low. Extremely higher concentration of magnesium ions than the standard (Brown W.,1962) didn't appear in the test, it was indicated that the excess
www.intechopen.com

Magnesium Alloys - Corrosion and Surface Treatments
146
magnesium ions could be absorbed and exported by rabbits properly. The magnesium ions concentrations in the urine in the two groups were similar and acceptable. After implantation for 8, 12, 18, 24 weeks, the concentration of zinc ions in urine of the two groups was close to that before implantation (Fig5.8c). No superfluous zinc ions were found in the blood and urines in both group, which illustrated the good biocompatibility of the substrate and HA-coated samples.
Fig. 5.7. (a),(c) and(e) show the cross-section images of the bone with residual implants at 8 week, 12 week and 18 weeks; (b),(d) and (f) show the cross-section images of the bone with coated implants at the corresponding weeks. All the three-dimensional reconstruction images of residual implants was shown in Fig.5.7 (a-1) ~(f-1), respectively.
The pathological analysis proved that the typical tissues in heart, liver, kidney, spleen was normal and healthy with regular structure. Slight congestion presented in spleen tissue with normal splenic corpuscles and cords, it might be caused during the sacrifice but did not indicate diseases. The corrosion products including metallic ions didn't deteriorate the function of the important tissues, such as circulation, immunity and urination. Fig.5.9 showed the radiographs of rabbits leg bones implanted by alloy and coated alloy after 1, 8 and 18 weeks implantation. No gas bubbles were observed around the implants, which showed that the gas bubbles disappeared through physiological action, and without side effects. In Fig.5.9 (a), (c) the profile of substrate and coated samples was the same as that before implantation. No evident degradation was observed. There was gap between samples and bone tissues. It was reported that after implantation of AZ31D samples for 1 week, gas bubbles were observed, and gradually disappeared during 2~3 weeks. It indicated that the gas could be absorbed and exported by animals, but the hydrogen evolution rate was higher than the rate of being absorbed. In this study, after implantation for 1 week, no gas bubbles was observed, which demonstrated the better biocompatibility of AZ31 than AZ91D alloy. After implantation of substrate samples for 8 weeks, evident degradation was observed, and the gap between samples and bone tissue was wider than that at 1 week. It could be attributed to the rapid corrosion, and the newly formed bone could not occupy the space after corrosion. While the HA-coated samples degraded more slowly, it could be seen from the dim interface between samples and bone tissues. The
www.intechopen.com

Mg Alloys Development and Surface Modification for Biomedical Application
147
newly formed bone tissues grow closely along surface of the implants. After implantation for 12 weeks, although there was still gap between coated samples and bone tissue and the degradation continued, the newly formed bone was more than that in 8th week. The bone density was close to that of mature bone, but due to the weaker inducing, the healing rate of bone was slower than that contact with coated samples. It must be noticed that gap appeared in the 12th week, it might be caused by rapid corrosion after the dissolution of composite coatings.
0 5 10 15 20 25 300
2500
5000
Co
mp
res
siv
e lo
ad
(N
)
Compressive strain( %)
1 Before implantation
2 Substrate implanted 8weeks
3 Coatings implanted 8 weeks
4 Substrate implanted 12weeks
5 Coatings implanted 12 weeks
6 Coatings implanted 18 weeks
7 Substrate implanted 18weeks1
3
5
24
67
(a)
0 4 8 12 16 20 240.0
0.5
1.0
1.5
2.0 (b)
Co
nce
ntr
ati
on
(mm
ol/
L)
Time(weeks)
Substrate blood
Coated blood
Substrate urine
Coated urine
0 4 8 12 16 20 24 280
100
200
(c)
Co
nce
ntr
ati
on
(mm
ol/
L)
Time(weeks)
Substrate blood
Coated blood
Substrate urine
Coated urine
Fig. 5.8. (a) Compression curve of residual implants after implantation for different period; Calcium and zinc ions concentration in the blood and urine of rabbits after implantation for 8, 12, 18, 24 weeks: (b) substrate; (c) with composite coating.
Fig. 5.9. The radiograph of rabbit bone after implantation for different time: (a) substrate, 1 week; (b) substrate, 8 weeks; (c) coated, 1 week; (d) coated, 8 weeks; (e) coated, 12 weeks.
In Fig.5.10(a), the sample was surrounded by spongy bone and the red circle showed the initial outline of substrate sample. On the surface of substrate, serious pitting was observed. The EDS showed us the distribution of element Ca, P, Mg. The element Ca, P could approximately indicate the existence of bone adhered to the substrate, while the Mg could explain the dissolution and degradation of magnesium. The concentration of calcium and phosphate in the spongy bone was close to that of mature bone, but the concentration of magnesium in pitting sites (pointed by red arrows) was higher than that in bone tissue and lower than that in implant. It was seen that magnesium ions were released from the sample and aggregated around the sample, and excess magnesium ions caused inflammation observed in 8th week. In Fig.5.10(b) the sample didn't degrade rapidly, which was accordant to the previous analysis. The distribution of magnesium was uniform, and no aggregation of magnesium ions was observed in local areas. It indicated that the composite coating improved the corrosion resistance of the sample, and the release rate of magnesium ions was lower than absorbing and exporting rate. The EDS result showed the similar
www.intechopen.com

Magnesium Alloys - Corrosion and Surface Treatments
148
concentration of calcium and magnesium, which indicated the formation of new bone, and good compatibility and bone-inducing ability of composite coatings (Crane N.,2006)
Fig. 5.10. The SEM and EDS results of samples: (a) substrate; (b) coated alloy.
6. Conclusion
A wide range of techniques were taken into account to develop novel Mg alloys based materials for implants. The degradation of Mg-based materials, including existing off-the-shelf alloy, newly developed alloy and surface treated alloy, in SBF and physiological environment have been investigated systemically. The corrosion resistant variations and non-toxicity of related Mg-based materials have been thoroughly evaluated. The alloy with different microstructures and surface coatings with various morphologies determines the electrochemical performance in terms of corrosion potential and corrosion current density. Fig.6.1 summarized the historical progress of the corrosion performance of alloys involved in the chapter. It is clear that the substrate alloys play important roles in the corrosion performance of the samples. Although the newly developed alloys possessed low corrosion potential, a comparable Ecorr value can be obtained by the composite coating techniques. In the Fig.6.1, the improvement in the corrosion potential of Mg-Zn-Ca and Mg-Zn-Y-Nd by composite coating was in a wider range than that by single coating and alloy processing techniques. By composite coating, Icorr decreased to the magnitude of 10-5 or 10-6. At the same time, the implanted alloy can keep acceptable mechanical integrity in the healing (or virtual) period. All these results indicate a promising prospect of Mg-based materials for implant application. To develop a novel alloy for clinical application, a more systematic approach is needed. The developed alloys based on the physiological toxicity consideration had more negative corrosion potential and higher corrosion current density than the existing alloys (Fig.6.1). And the traditional approaches by adding rare earth elements and aluminum etc were not recommended (F.Witter 2008). At the moment, the list of potential medical applications for biodegradable Mg alloys seems still limited.
www.intechopen.com

Mg Alloys Development and Surface Modification for Biomedical Application
149
Fig. 6.1. Progress in involved Mg-based materials for implants application.
The evident improvement in corrosion resistance has been obtained by HA coating in different systems although the HA exhibited a typical porous surface. Further study about the conjunction structures in detail is required to control their degradation behaviors intentionally. The inherent micron/nano porous surface of HA coating makes it can be endowed with the local drug delivery functions, which will enlarge the application fields of biodegradable Mg-based materials. At the same time, it is suggested that other surface modification techniques could be applied to improve the corrosion resistance of Mg alloys, such as surface alloying, ion implantation and surface silidification. There are numerous studies about Mg alloy corrosion. Corrosion behaviors of different alloys in different environments were compared. Researchers also proposed some practical designs to avoid serious corrosion, and summarized various effects of environmental and metallurgical factors on the corrosion of magnesium alloys. All these results provide us empirical information to design degradable materials for implants. However, there have been very few mechanism studies and some fundamental questions are still not clear. If the role of phases, microstructures and the coating with different morphology in the corrosion process are well understood, we can design more elaborated corrosion resistance material system and control the degradation rate in different environments. It is likely that further research will improve the corrosion resistance of Mg-based implants, and that low-priced, high performance magnesium alloys will be commercially available. The long-term joint efforts from multidisciplinary researchers will be needed to make significant advances for the benefit of patients.
7. Acknowledgment
We are grateful for the financial support of the National Basic Research Program of China (Grant No. 2008CB617509) and the National Natural Science Foundation of China (No.
www.intechopen.com

Magnesium Alloys - Corrosion and Surface Treatments
150
30870634). The authors would like to thank Prof. Yisheng. Wang at Medical College of Zhengzhou University for his operation on animals. The authors also would like to thank Dr. S.H. Wang and Mr. J.L. Xue at the Laboratory Animal Center of Henan Province for the assistance in the animal experiments.
8. Reference
Berger, H.; H., Tang and F., Levy. (1993). Growth and Raman spectroscopic characterization of TiO2 anatase single crystals, J. Cryst. Growth 130, 1-2, 108-112, ISSN 0022-0248.
Boehlert, C.J; K.; Knittel; K., Venkatesan. (2006). The microstructure, tensile properties and creep behavior of Mg-Zn alloys containing 0~4.4% Zn, Mater. Sci. Eng. A, 417: 315-321, ISSN 0921-5093.
Boskey, A., L.; A., S., Posner (1974). Magnesium stabilization of amorphous calcium phosphate: A kinetic study. Mater Res Bullet, 9, 7, 907-16, ISSN 0025-5408.
Brown, W; et.al. (1962). Crystallographic and chemical relations between octacalcium phosphate and hydroxyapatite. Nature, 196, 15, 1050-1055, ISSN 0028-2836.
Christine, Trépanier; Maryam, Tabrizian; et.al. (1999). Effect of modification of oxide layer on NiTi stent corrosion resistance. Journal of Biomedical Materials Research Part B:
Applied Biomaterials. 48,1, 433-40, ISSN 1552-4981. Crane, N; Popescu, V; Morris, M; Steenhuis, P; Ignelzi, MJ,. (2006). Raman spectroscopic
evidence for octacalcium phosphate and other transient mineral species deposited during intramembranous mineralization, Bone, 39,3, 434-442,ISSN 8756-3282.
Denissen, H.W.; K., de Groot; et.al.(2004). Tissue response to dense apatite implants in rats, J. Biomed. Mater. Res. 14,6,713–721,ISSN 1549-3296.
Dumelie, N.; H., Benhayoune; D., Richard; et al.. (2008).In vitro precipitation of electrodeposited calcium deficient hydroxyapatite coatings on Ti6Al4V substrate. Mater. Charact. 59,2, 129–133,ISSN 1044-5803.
Gupta, A.P.; Vimal, Kumar. (2007). New emerging trends in synthetic biodegradable polymers polylactide: a critique, Eur. Polym. J., 43, 10, 4053-4074. ISSN: 0014- 3057.
Gu, Xuenan; Zheng, Yufeng; et al. (2009). In vitro corrosion and biocompatibility of binary magnesium alloy, Biomaterials, 30,4 484–498 ISSN 0142-9612..
Han, Y; Fu, T; Lu, J. (2001). Characterization and stability of hydroxyapatite coatings prepared by electrodeposition and alkaline-treatment process, Journal of Biomedical
Materials Research. 54,1, 96-101, ISSN: 1552-4965. Huang, N; Yang, P;et al. (2003). Hemocompatibility of titanium oxide films, Biomaterials.
24,13,2177-87, ISSN 0142-9612. Hu ,J.h.; S.k. ,Guan; et.al. (2006). Corrosion protection of AZ31 magnesium alloy by a TiO2
coating, Corr. Sci. Protec. Tech., 2003, 13,2017-2020, ISSN1002-6495. Kannan, M., Bobby; R.K., Singh, Raman. (2008). In vitro degradation and mechanical
integrity of calcium-containing magnesium alloys in modified-simulated body fluid, Biomaterials. 29: 2306-2314, ISSN 0142-9612.
www.intechopen.com

Mg Alloys Development and Surface Modification for Biomedical Application
151
Kokubo, T; Takadama, H. (2006). How useful is SBF in predicting in vivo bone bioactivity? Biomaterials. 27: 2907–15, ISSN 0142-9612.
Kuo, M.C.; S.K., Yen. (2002). The process of electrochemical deposited hydroxyapatite coatings on biomedical titanium at room temperature, Materials Science and
Engineering C. 21,1-2,153-160, ISSN: 0928-4931. Li, Zijian; Gu, Xunan; et al. (2008). The development of binary Mg-Ca alloys for use as
biodegradable materials within bone, Biomaterials, 29, 10, 1329–44, ISSN 0142-9612.
Luo, Z. P.; S. Q., Zhang; Y. L., Tang; et al. (1994). On the stable quasicrystals in slowly cooled Mg-Zn-Y alloys, Scripta Mater 32, 9, 1411-1416, ISSN: 1359-6462.
Manso, M.; C., Jime′ nez; C. Moranta.(2000).Electrodeposition of hydroxyapatite coatings in basic conditions,Biomaterials 21,17, 1755–1761,ISSN 0142-9612
Rakngarma, A.; Y., Mutoh. (2009). Characterization and fatigue damage of plasma sprayed HAp top coat with Ti and HAp/Ti bond coat layers on commercially pure titanium substrate. J. Mech. Behav. Biomed. Mater., 2,5, 444-453, ISSN 1751-6161.
Song, Guangling; Shizhe, Song. (2007). A Possible biodegradable magnesium implant material, Adv. Eng. Mater.,9, 4, 298-302,ISSN 1527-2648.
Staiger., M.P; Pietak., A.M, Huadmai; Dias., J, G. (2006). Magnesium and its alloys as orthopedic biomaterials. Biomaterials, 27,8,17-28, ISSN 0142-9612
Ulrike Diebold. (2003) . The surface science of titanium dioxide. Surf. Sci. Rep. 48, 5-8., 53-229, ISSN 0167-5729.
Wang, H.X.; S.K., Guan; X., Wang; et al. (2010). In vitro degradation and mechanical integrity of Mg-Zn-Ca alloy coated with Ca-deficient hydroxyapatite by the pulse electrodeposition process. Acta Biomaterialia. 6, 5,1743-1748, ISSN 1742-7061
Wei, M.; A.J., Ruys; Swain, M.V.; Kim, S.H.;Mithorpe, B.K.; Sorrell, C.C. (1999). Interfacial Bond Strength of Electrophoretically Deposited Hydroxyapatite Coatings on Metals. Journal of Materials Science: Materials in Medicine. 10, 7,401-409,ISSN 0957-4530.
Wen, C.L; S.K., Guan; L.,Peng; C.X., Ren; et al. (2009). Characterization and degradation behavior of AZ31 alloy surface modified by bone-like hydrozyapatite for implant applications. Applied Surface Science. 255, 13-14, 6433-6438, ISSN 0169-4332.
Witte, F.; H, Ulrich; et al.( 2007). Biodegradable magnesium scaffolds: Part I: appropriate inflammatory response. J. Biomed. Mater. Res. A, 81, 4, 748-756, ISSN 1549- 3296.
Witte, F.; V., Kaese; H., Haferkamp; et al.( 2005). In vivo corrosion of four magnesium alloys and the associated bone response, Biomater., 26,17, 3557-3563, ISSN 0142-9612.
Witte, Frank; et. al. (2008). Degradable biomaterials based on magnesium corrosion. Current Opinion in Solid State and Materials Science, 12,5-6, 63–72, ISSN: 1359- 0286.
www.intechopen.com

Magnesium Alloys - Corrosion and Surface Treatments
152
Yamasaki, Y; Yoshida, Y; Okazaki, M; Shimazum, A; Uchida, T; Kubom T; et al. (2002). Synthesis of functionally graded MgCO3 apatite accelerating osteoblast adhesion. J Biomed Mater Res, 62, 1,99-105, ISSN 0021-9304.
www.intechopen.com

Magnesium Alloys - Corrosion and Surface TreatmentsEdited by Frank Czerwinski
ISBN 978-953-307-972-1Hard cover, 344 pagesPublisher InTechPublished online 14, January, 2011Published in print edition January, 2011
InTech EuropeUniversity Campus STeP Ri Slavka Krautzeka 83/A 51000 Rijeka, Croatia Phone: +385 (51) 770 447 Fax: +385 (51) 686 166www.intechopen.com
InTech ChinaUnit 405, Office Block, Hotel Equatorial Shanghai No.65, Yan An Road (West), Shanghai, 200040, China
Phone: +86-21-62489820 Fax: +86-21-62489821
A resistance of magnesium alloys to surface degradation is paramount for their applications in automotive,aerospace, consumer electronics and general-purpose markets. An emphasis of this book is on oxidation,corrosion and surface modifications, designed to enhance the alloy surface stability. It covers a nature ofoxides grown at elevated temperatures and oxidation characteristics of selected alloys along with elements ofgeneral and electrochemical corrosion. Medical applications are considered that explore bio-compatibility ofmagnesium alloys. Also techniques of surface modifications, designed to improve not only corrosion resistancebut also corrosion fatigue, wear and other behaviors, are described. The book represents a valuable resourcefor scientists and engineers from academia and industry.
How to referenceIn order to correctly reference this scholarly work, feel free to copy and paste the following:
Shaokang Guan, Junhua Hu, Liguo Wang, Shijie Zhu, Huanxin Wang, Jun Wang, Wen Li, Zhenwei Ren, ShuaiChen, Erchao Meng, Junheng Gao, Shusen Hou, Bin Wang and Binbin Che (2011). Mg Alloys Developmentand Surface Modification for Biomedical Application, Magnesium Alloys - Corrosion and Surface Treatments,Frank Czerwinski (Ed.), ISBN: 978-953-307-972-1, InTech, Available from:http://www.intechopen.com/books/magnesium-alloys-corrosion-and-surface-treatments/mg-alloys-development-and-surface-modification-for-biomedical-application

© 2011 The Author(s). Licensee IntechOpen. This chapter is distributedunder the terms of the Creative Commons Attribution-NonCommercial-ShareAlike-3.0 License, which permits use, distribution and reproduction fornon-commercial purposes, provided the original is properly cited andderivative works building on this content are distributed under the samelicense.