mf-$0.75 !!c -$1.85 plus postage · (author/rc) a. institute for developmt studies ... who...
TRANSCRIPT
DOCUMENT RESUME
ED 100 198 HE 006 091
AUTHOR Rastad, Svein-ErikTITLE University Students and the Employment Market--A
Profile of Present Graduates from University College,Nairobi. Staff Paper No. 74.
INSTITUTION University Coll., Nairobi (Kenya).PUB DATE Jun 70NOTE 46p.
EDRS PRICE MF-$0.75 !!C -$1.85 PLUS POSTAGEDESCRIPTORS College Graduates; Employment; *Graduate Surveys;
*Guidance Programs; *Higher Education; *InternationalEducation; Job Market; Questionnaires; StatisticalData; Student Characteristics; *Surveys
IDENTIFIERS Kenya; Nairobi; *University College
ABSTAACTThere are various assumptions underlying the
University Tracer Project at the University College, Nairobi, Africa:(1) that there is a relationship between subjects studied inuniversity and the employment sought and found; (2) that thisrelationship will increase as competition for jobs increases; (3)
that this relationship is sufficiently flexible to allow for careerguidance; and (4) that the experience of earlier graduates willprovide a meaningful source of information for the guidance of latergraduates. The interview questionnaire, which was administered to all.Kenyan third year students at University College, Nairobi inmid-April 1970, had three basic objectives: (1) to learn somethingabout the student approach to the employment market; (2) to learnsomething about the reasons guiding the students' choice of subjectsIn university; (3) to familiarize the graduating students with theobjective of career guidance and thereby enlist their support andcooperation later. This paper is a brief review of the questionnaire.Statistical tables display the results in the following areas: totalDumber of students by discipline, year of birth by discipline, homeprovince by discipline, religion, sex, father's occupation, mother'seducation, postgraduate qualification desired, how job was found,status of job. (Author/RC)

A
INSTITUTE FOR DEVELOPMT STUDIES
UITIVERSITY COLLEGE,
Staff Paper No. 74
University Students and the aaployment Market .
A Profile of Present Graduates
from University College, Nairobi
by
.1vein.Erik Eastad
tt s Olt PhIlf101101t Of 14111L714.
EDUCATION II Yttelltag01TIONISSINSTOUff
Of
etAtChTiON
Yttis 00.00141 tut.. nttN lit Plan
OW 1 D Ift.itt AS lit ( 110ED 1 YOM
t Ht Pt W SON OW Oi1 r ,AAI, f AT ION 011.(0,4
At 04(, 11POINtS Ut vf 0. Ow OPINIONS
S !Alt 0 DO 040141(1W.w it * wEpe
Sit° ot I( itlit. htookit,.4%outf ot
f Ou( 0104POVTION Ow
PM ,C I
June, 1970
t.41
Any views expreened in this paper are thoJe of the author. Theyshould not be interpreted a3 refleotin the views of the Institutefor JkoreiloPzeak :;tudies or of the University Collece,

3
University Students anC the Ilnploym Larket A Profile.
There are various assumptions underlying the University Tracer
Project:.(i) that there is a relationship between subjects studied in
university and emplOyMateaught and 'ourall:(2) that this relationship will
increase as competition for.jobs increases,. (3).that this relationShip4s..
stiffioiently flexible to allow for careers zuidance; (4) that the experience
of earlier graduates will provide a meaningful source of information for the
.guidance of later graduates. The centrul feature of these assumptions is that
of enlisting the cooperation of earlier..graduates. One additional dimension
would be added if one also knew haw. the students approaoh, the employment
market and how it appears to respond.1.1.11
The interview questionnaire whieh.was administered to al?. Kenyan,
third year students at University College, Nairobi in mid.April 1970 had
three basic objectivew, (1) to learn something about the student approach
to the. employment market; (2) to learn something abdut the reasons guiding..
the student's choice of subjecto in university; (3) to familiarize the
graduating students with the objective of careers guidance and hopefUlly
thereby enlist their support and cooperation later. This paper is a brief
review of the questionnaire* primarily written as a, report to Mr. J.K. Koinange,
Assistant Dean of Students at.University College, Nairohil.under whose auspices
the questionnaire was administered*. and under whose authority the career
guidance service will be established.
The Interviews (Table I)
188 students were interviewed, out of a total of 220. The interview
was explicitly voluntary, and the 32 studontu not interviewed include students
who pre.ferred not to participate as well as students who were not located.
The reception was very i;ood, sometimes enthusiastic, as it was evident that
most students agreed with the objective of careers guidance.
..
The interview team consisted of six assistantsslUos Jalapa° i.lwambia,'14
1111
Lt.. Gregory Chybire, Mr. Peter Kinyanjui, Wilfred Uwangi, Yr.
Eliud, ligariuku, Mr. Naurice Yambo plus the author, Two of the nasistants
were on vacation from Makerere Univers ity College, one on vacation from The
aY University College, Dar as Salaam, one a recent Israduato from Th University8
College, Dar ea Salaam, plus two were third year students from Uni..oraity
02College, Nairobi. The latter carried a li,';hter load than the others, but
served no advisors, both during the prqtest na well as durini; the interview
period itself.

at The interview questionnaire which. was administered to all Kenyan;
0am!. third year students at University College, Naltrobi it midr.April 1970 had
three basic objectives:... (1) to learn somthing about. the studpnt approach
del to the.eRployment markets (2) to learn.something abdut the reasons guidi*am
the stiudent's choice of subjects in university; (3) to familiarize the "
graduating students with the objective of careers guidance and hopefully
thereby enlist their support and cooperation later. This paper is a brief
review of the questionnaire, primarily written as a, report to Mr. J.K. Koinange,
Assistant. Dean of Students at .University Colleget.Nalrobil.uhder whose auspices
the questionnaire was administere4:and under whose authority the career
guidance service will be established.
The Interviews (Table 1).
188 students wore interviewed, out of a total of 220. The interview
was explicitly voluntary, and the 32 students not interviewed include students
who preferred not to participate as well as students who were not located.1
The reception was very deed, sometimes enthusiastio, as it was evident that
most students agreed with the objective of careers guidance.
The interview tooth consisted of six assistantsiMiss Salome Mwambiat.
am Mr. Gregory Chybire, Mr. Peter Kinyanjui, Iir* Wilfred Mwangi, Mr*
Elludygariuku, Mrd'Ilaurice Yambo plus the author. Two of the assistants
ha were on vacation from Makerere University College, one on vacation from Tha
g; University College, Dar cs Salaam, one a recent graduate from The UniversityC5
Colleges Dar 03 Salaam, plus two were third roar students from University
raaa
College, Nairobi. Tho latter carried a li5htor load than the others, but
served as advisers, both during the prqteut as well as during the interview
period itself.
The period chosen for the,intetwiew, 11 to 19 April did fall close
enough to exams to have n. slight ef.ect or participation, but as the Public
Service Commission had Npited the university oollege only a few days
previously out timing proved quite fortunate. In fact, some of the students
came almost fresh from interviews with th4 Public Servine Comntosion when our
interviews were undertaken. fi

-2 .5
For the 32 students not interviewed basic background data was
collected, so in some of the tables which follow the total reaches 220.
It ahouid be noted that these tables resent a_profIle on;E. Detailed
analysis would require comparative data. It is expected that comparative
studies over time will provide the most interesting approadh to this data,
Once such data is availblee''
Census data also allow for interesting dOmparisons, and iudhanalysis
bill'be-ddfiZ At a laZir stage. Furthermore, comparisons will be made with
secondary eehoo3 students. In.general, the tables epeak for themselves, but
a brief discussion follows.
Background of students (Tables 2.18)11
4,11By age, there is a remarkable epread, with year of birth aqywhere
betweeir1930 1 1949 with thti.majoriny born between 1944 and 1947.' As
one would expee., almost all old graduates are in the faculty of:Arts,EI
(Table 2)
. By k.01003 province, the most y.):111,us provinces of dentra, Nyanza,
,.gnd Western dominate, but the eitiet.i of rairobi and Mombasa are very
strongly Tepresentedo North-Eastern Province has no graduate this year.
(Table 3)
By religion, almost half the students are Protestants, while the
ratio of protestants in the total populzion of Kenya is little more than
one third. Catholic:a are very correctly represented among the graduating
students, at 220, while Mislims are greatly overrepresented at 105 of the
students. (Tab1074)
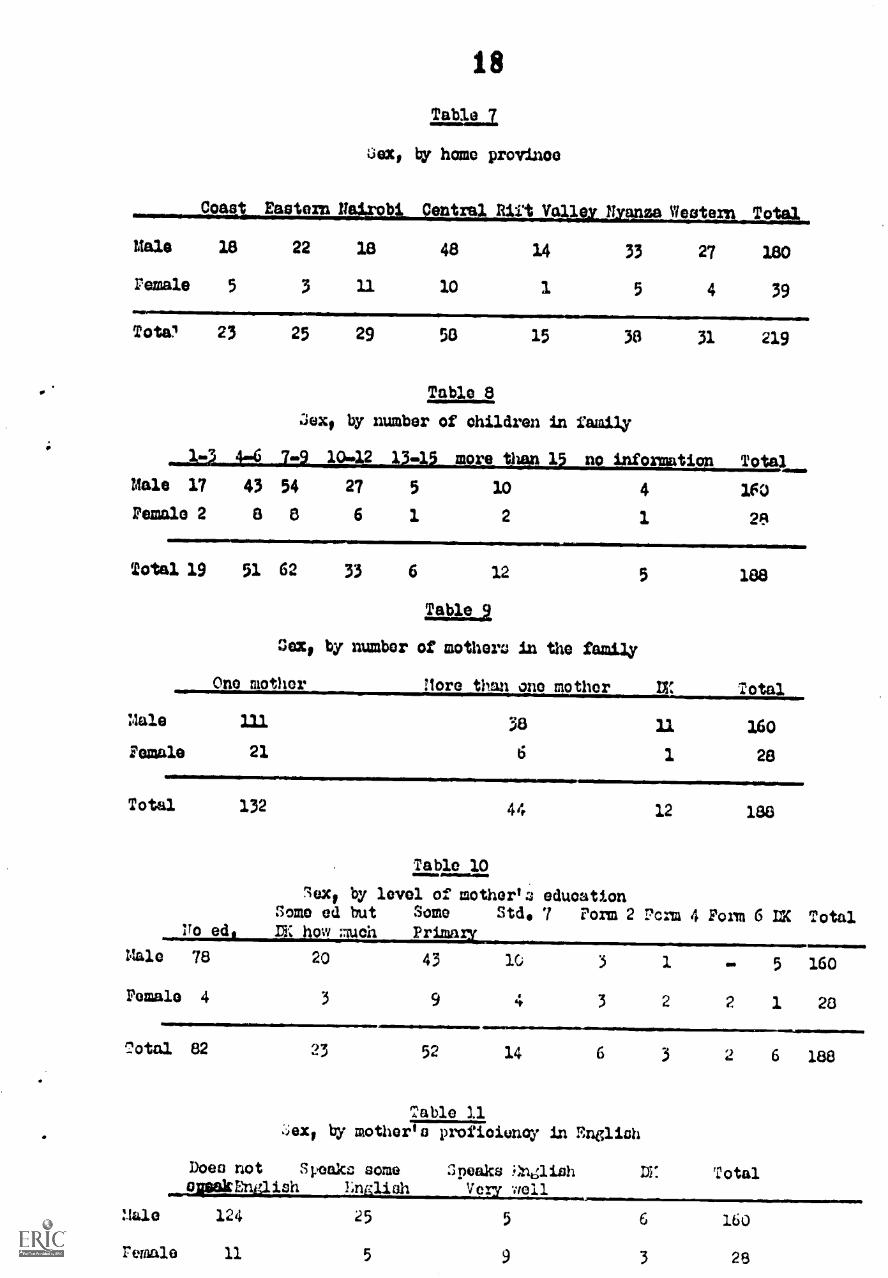
By sex, only 1W of the sty-lents are .women, who very heavily favoex
the faculty'of Arts. (Table 5)
Sex by religion shows that a woman ie a bit less likely to attend
uqiversity if she is born into a protestant :amftly rather than a Catholic
or Muslim family, but the difference is quite amall. (Table 6)
Sex by province shows the.t a woman is more likely tJ attend college
if she is born in Mombasa and Nairobi. Gable 7)
Both r..en and women come from families of very different size, with
Background of students (Tables 2-18)
J."1
cc
By age, there is a remarkable spread, with year of birth anywhere
betweeh,1930 and 1949 with theLmajority born .between 1944 and 1947.' As10,5
one would expect, almost all ci.ld graduates are in .the faculty of Arts.oQ
(Table .2)
. By home province, the most populius provinces of Oentral, Nyanza,
ow:Western dominatep but the cities of 'Nairobi And Mombasa are very
strongly epresented. North-Eastern Province has no graduate this year.
(Table 3)
By religion, almost half the students are Protestants, while the
ratio of protestants in the total population of Kenya is little more than
one third. Catholic:6 are very correctly represented among the graduating
students, at 22%, while nuslims are greatly overrepresented at 1pro of the
students. (Table74)
By sex, only l& of the staents are women, who very heavi.'.y favour
the faculty 'of Arts. Table 5)
Sex by religion shows that a woman is a bit less likely to attend igzsufliversity if she is born into a protestant family rather than a Catholic
or ',maim family, but the difference is quite mall. (Table 6) i
Sex by province shows that a woman is mo7..e likely t4 attend college
if she is born in Mombasa and Nairobi. (Table 7)
Both men and women come from families of very different size, with
7 to 9 brothers and.sIstors the most eommon. (Treble 8)
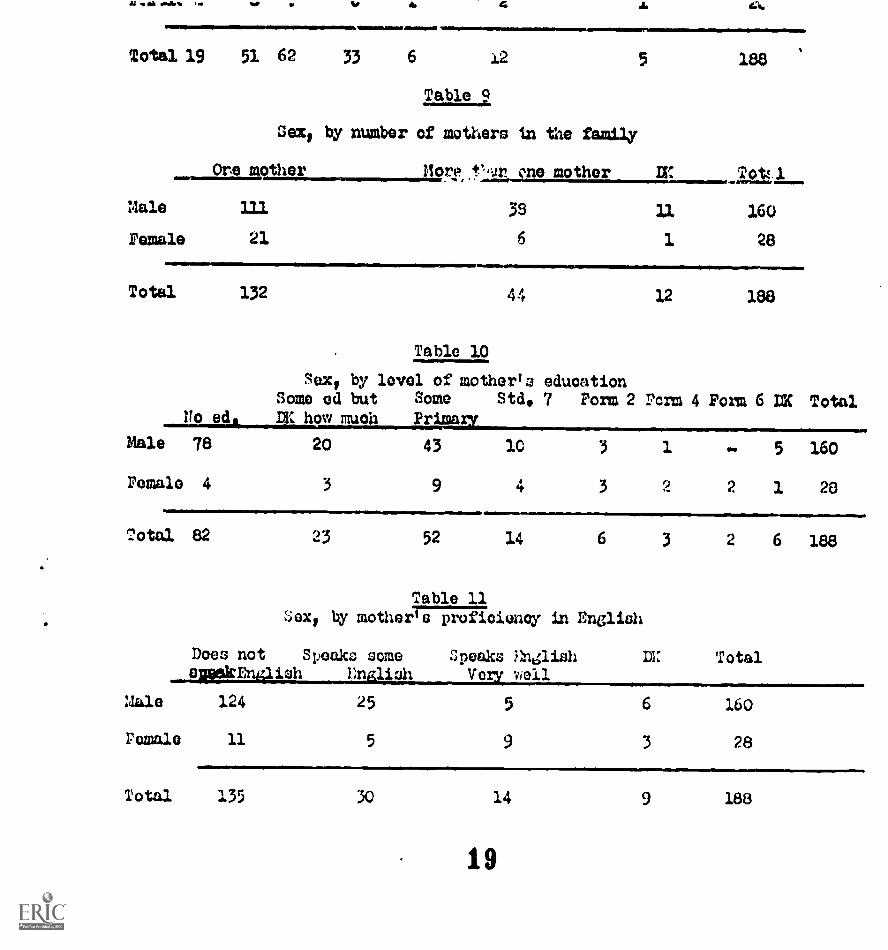
7C of the studeeus coma from families with only one mother, but
there .is no differenaetfor mmn or women from families with one or more
mothers. .. (Table 9)
4

.3
For a woman to attend college, her chances are much better if her
uxther has a certain amount of education, .'or men it does not leatter
whether the mother has any educatiov4 (Table 10)
For a woman it is also a great advantage if her mother speaks English.
For men it does noe meter if the mother does not speak any English.4411 (Table 11)
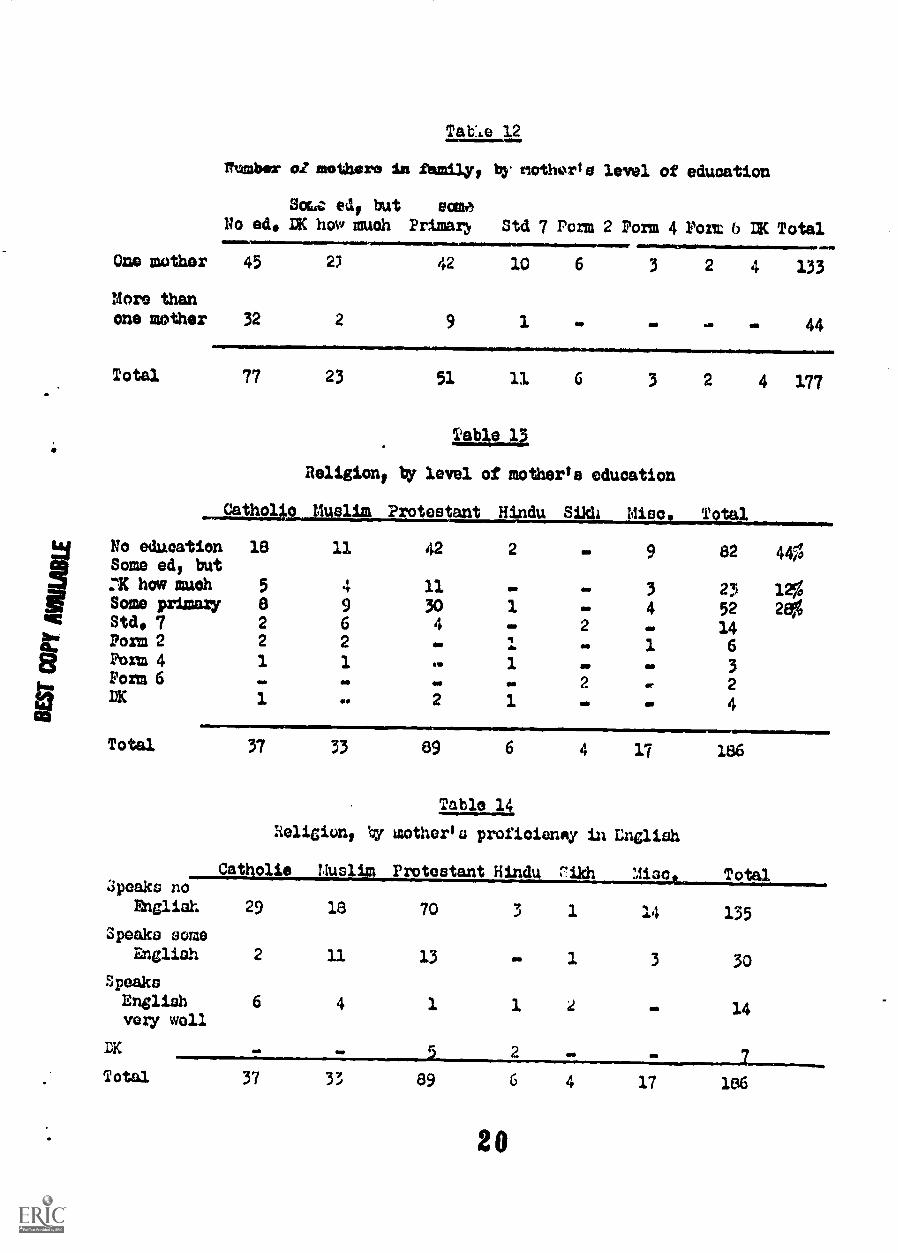
zo-oc It is very clear in Table 12 that the mother's education is very
much related to her status as the only mother in the family. l'resumablyEi
this means that monogamous wives nave mere education than polygamous wives.
E3aa
Protestant mothers have less education than mothers of other religions,
but there is great social mobility for all groups, as less than 1Q of all
mothers have more than primary education. (Table 13).
Not surprisingly, the mother's proficiency in English is. also less
for Prctestants, but again less than 10r. of all mothers speqc I glish very,,
well. (Table 14).
.
The educational level of fathers is iliGher then that of maUers,
with about 2G with more than primary education. Not eurprieing,49 the
most educated fathers tend to be in professional, adx..;..nistrative, or
entrepreneurial occupations. While almoct.half the mothers. had no education,
only 17;:, of the fathers 5 weal reported have no education, Lens than..
4070 of the fathers arc farmers, with almost 25;'i in professional, teaching,.
or c .erica1 occupations. (Table 15)
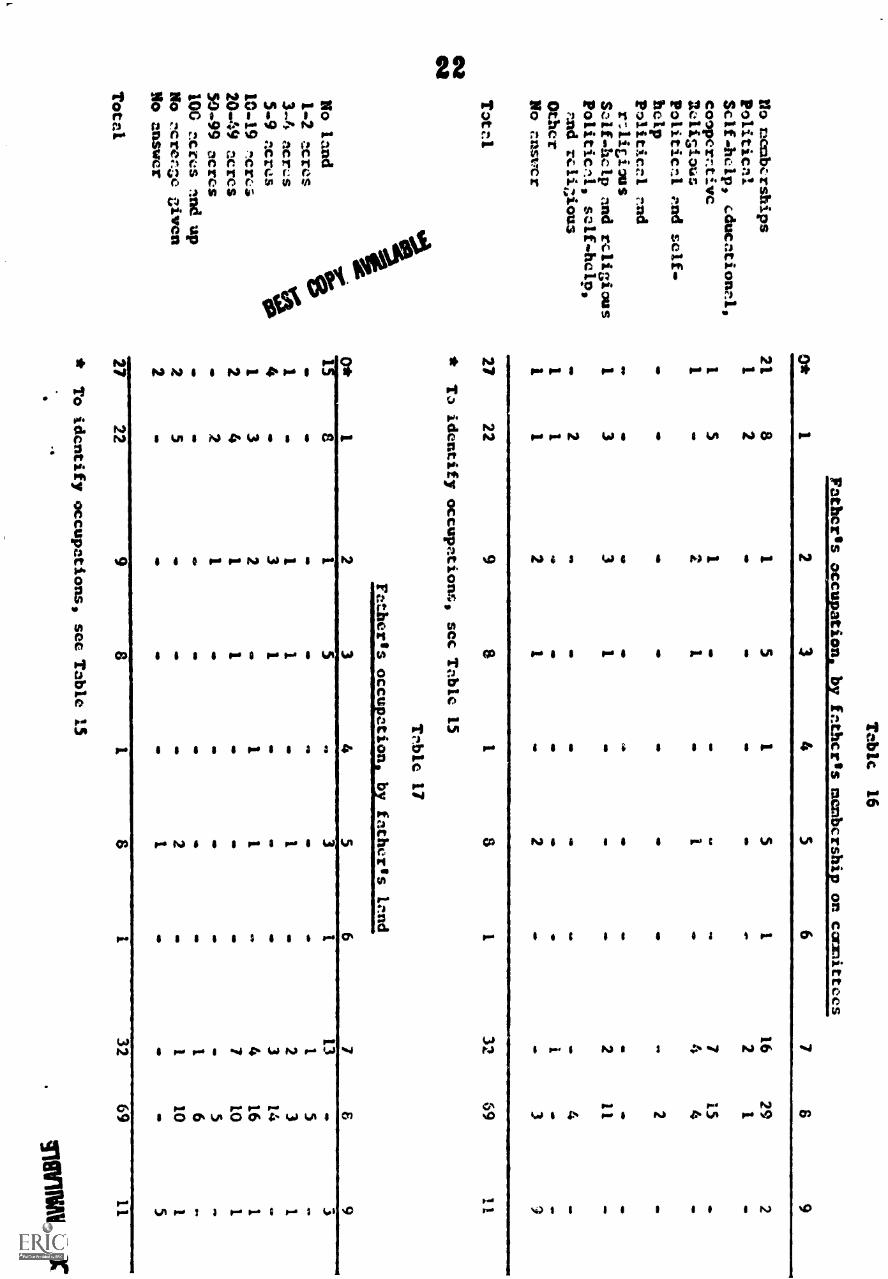
Almost half -ale fathers do not participate in any locc..1 oronizations,
while one third of all fz.therl are active in self -help and/or religion°
a4 orgailizations4, (Table 16)
. 40*
02
One forth of all fathers are reported without tiny farra.1;uld of their
own, This =primarily reflects the large number of students from :!ombasa and
Nairobi. The most common acreage if. between E) and 19 acres, but both 5-9
and 20.49 acres is quite common, but larger farms are aloe represented. Very
small farna are few. (Table 17)
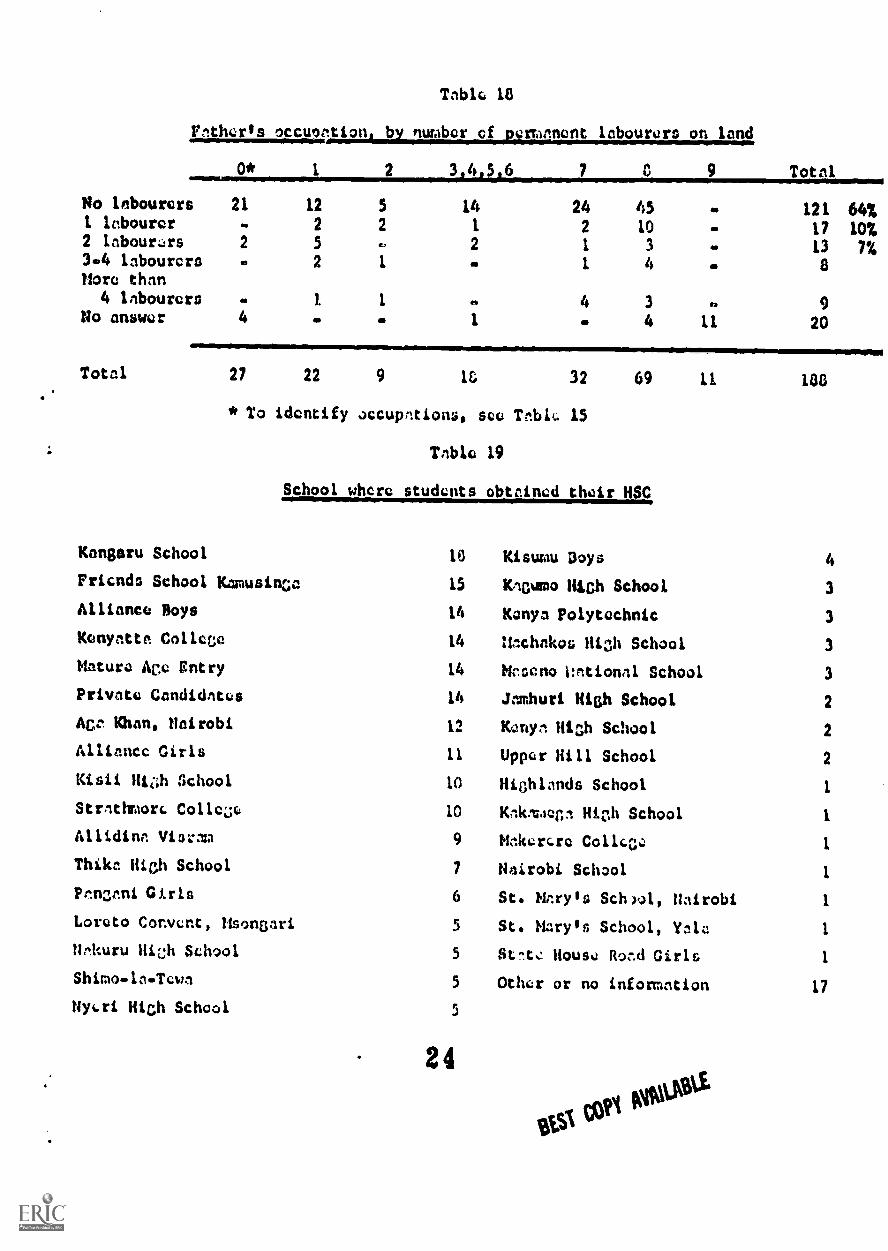
Only one third of all fn.rws employ pomanent labourfa.8, and very
www4v.....wlaav am,14,Ar&or .1..001.0 WiAJAULL WJAUAUWILILIMIA0 VJ. eldnkow zeixglons,
but there is great social mobility for all groups, as less than 10% of all
mothers have more than primary education. (Table 13).
Not surprisine4y, the motheris proficiency in English is also less! I
forProtestants, but again less then 101, of all mothers speek English very.,
well. (Table 14),
The educatiOnal level of father::: is higher than that of mothers,
with about 20% with more than primary education.. Not surprisingly, the
most educated fathers.tend to be in professional, administrative, or
entrepreneurial occupations, While almoet.half the mothers_had n9 education,
only M of the fathers 5 were reported to have no education, Loss than.
406 of the fathers arc farmers, with almost 2Z in professional, teaching,
or clerical occupations. (Table 15)
Almost half the fathers do not participate in any local organizations,
while kae third of all fc..thers are active in self-help and/or religions
igorganizations. (Table 16)
ZS
col One forth of all fathers are reported without liny garm.land of their02 own. This primarily reflects the large number of tudents from :lomhasa and
Jairob.... The most common acreage is between 10 and 19 acres, but both 5-9
and 20.49 acres is quite common, but lar,:er, farms are also represented. Verysmall farms ale few. (Table 17)
Only one third of all farms employ permanent laboun.lro, and very
few farms employ more than 2 permanent labcarers. Most farmers work their
farms themselves. (Table 18)
It should be pointed o'tt that none of thee tables on social badk6ruund
have btu eentroled for othnicit;r.
al VI. *lb
Academic Backvaund (Tables 19.28)
The present graduates come from au wally as 30 different Perm 6 schools,
but 8 schools supplied more than half, 1:Iiiture Age and Private Candidates
both number as many as 14. ( Table 19)6
Performance in major HSC subjects show that one third of all grades
were E; tke lowest principal pass, Only 5% were As, heavily clustered in
Geography and History, the most popular subjects overall, One quarter of
all grades were subsidiary passes, with only a total of 6,71 failures for
both principal and subsidia ry subjects. (Table 20)
The faculties of Arts and Science both have many students who ft
Elactually preferred another faculty sots= more than me third (Table 21),
but not as many student° would now want to change (Table 22), riaam
Not uurprisiligly, half the Commerce graduates °hese that faculty
for reasons of employment oppertunities, and more than one third of both
Arts and Science graduates chose those, faculties simply from general interest
on the whole, Odly 24,.,of the graduates preferred their faculties for reasons
of employment opportunities, which is almost the samu as the number of
graduates who did not obtain admissio.1 to the faculty of first e-aoiceo
Almost half the students chose their faculty for general or apcuifio academic
reabons. (Table 23)0.
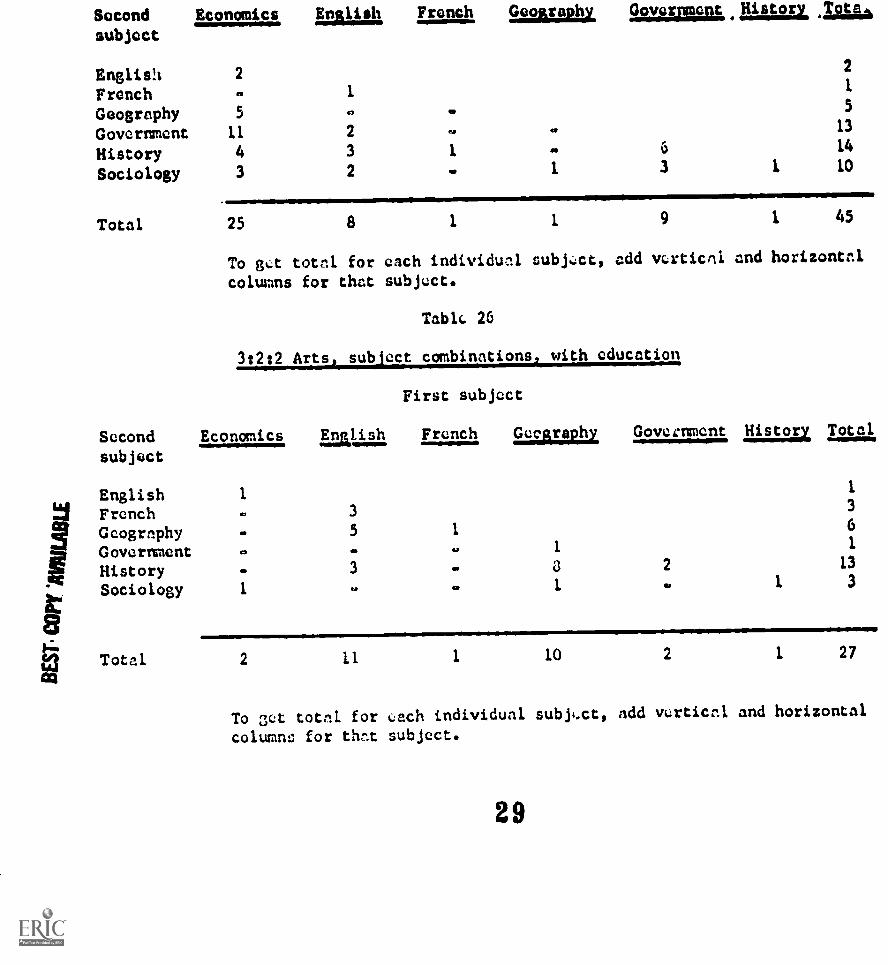
Less than ono third of the Arts zraduatos took a 3 :1:1. eption,
' am. half 'f them took the education option, Virtually all the History 3:1 a
had education option, while Economics and English did not take the education
obtion (Table 24) Economics and Owernment are the most popular courses for
3:2:2 Arts without education option (Table 25), while geography and History 1.111
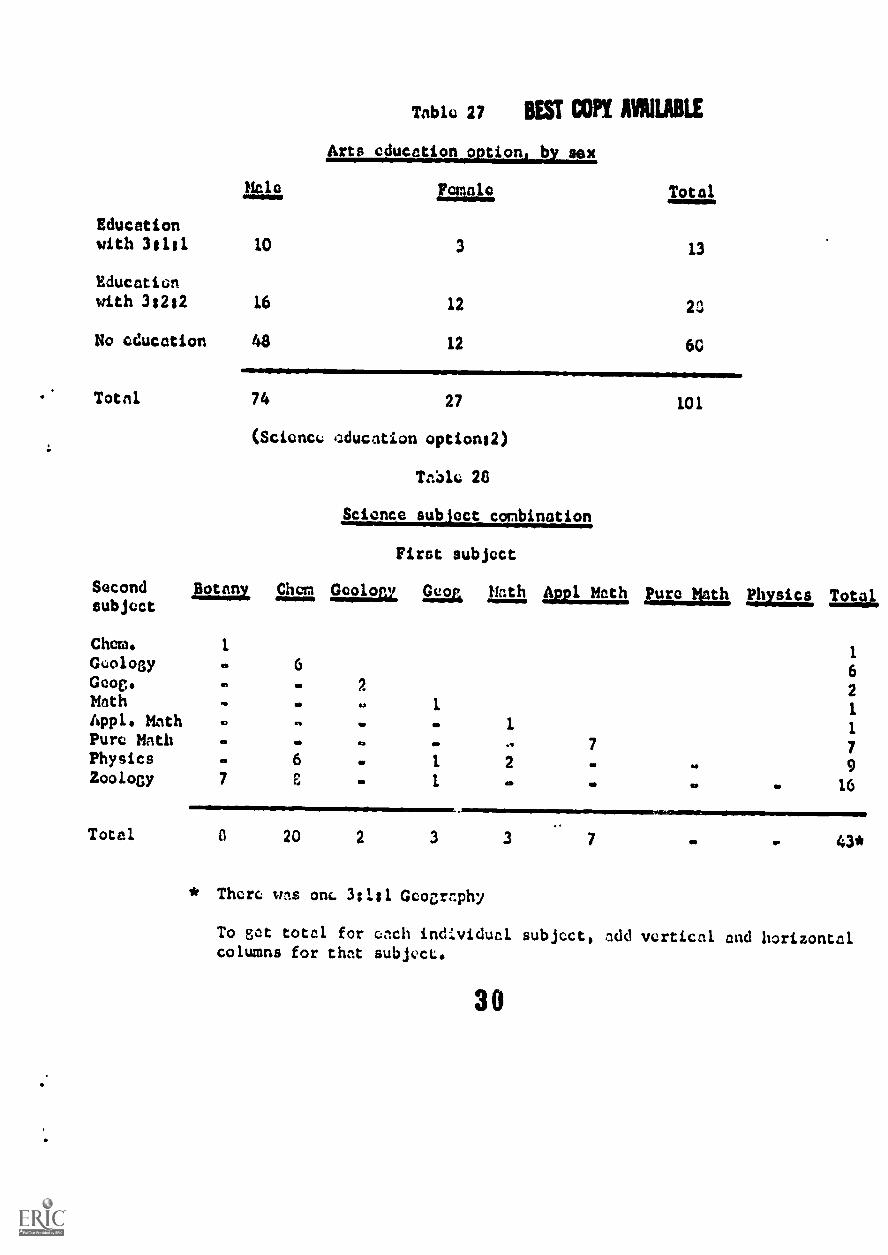
are the most popular with education option (Table 26).11mowe
As expected, the majority of the Arts wenen take the education option, it
while only one third cr:): the Arts men do (Tata° 27) El
ZS .
CIn 3oience, Rhemistry is by far the moat popular subject, with
Zoology a strong second. (Table 28)
t 1
5 MP 1 0
Postgraduate Studies (Table 29..34)
Virtually one third of :all the students who were interviewed wantsome form of
.
farther education, most of them at the masters level. (Table 29).
By faculty, Science has the largest proportion of students, almost half,who want to continue their education, Approximatelyons fourth of Arts studentswant to continue. (Table 30)
II
There is a very even.distribution in the reasonu for wanting moreeducation between academic, research, and employment reasons, with one thirdfbr eaoh. (Table 31)
Almost one third of the students who want 2arther education have donenothing to obtain admission, or even enquire about the%possibilities. Fewof them are likely to actually get further education. /lore than one thirdhave already submitted their applications and are awaiting their final
examinations before they will get an answer to their applications. (Table
students seem to have quiz* realistic views on their chances foradmission to postgraduate studies, with final examination results the majorfactor for the optimistic students., and leak of finance the major faotor forthe "Small chance" category, (Table 33)
Not surprisingly, thoae who want further education have hardly startedto look for employment yet. (Table 34)
aneloyment profile (Tables 35-48)
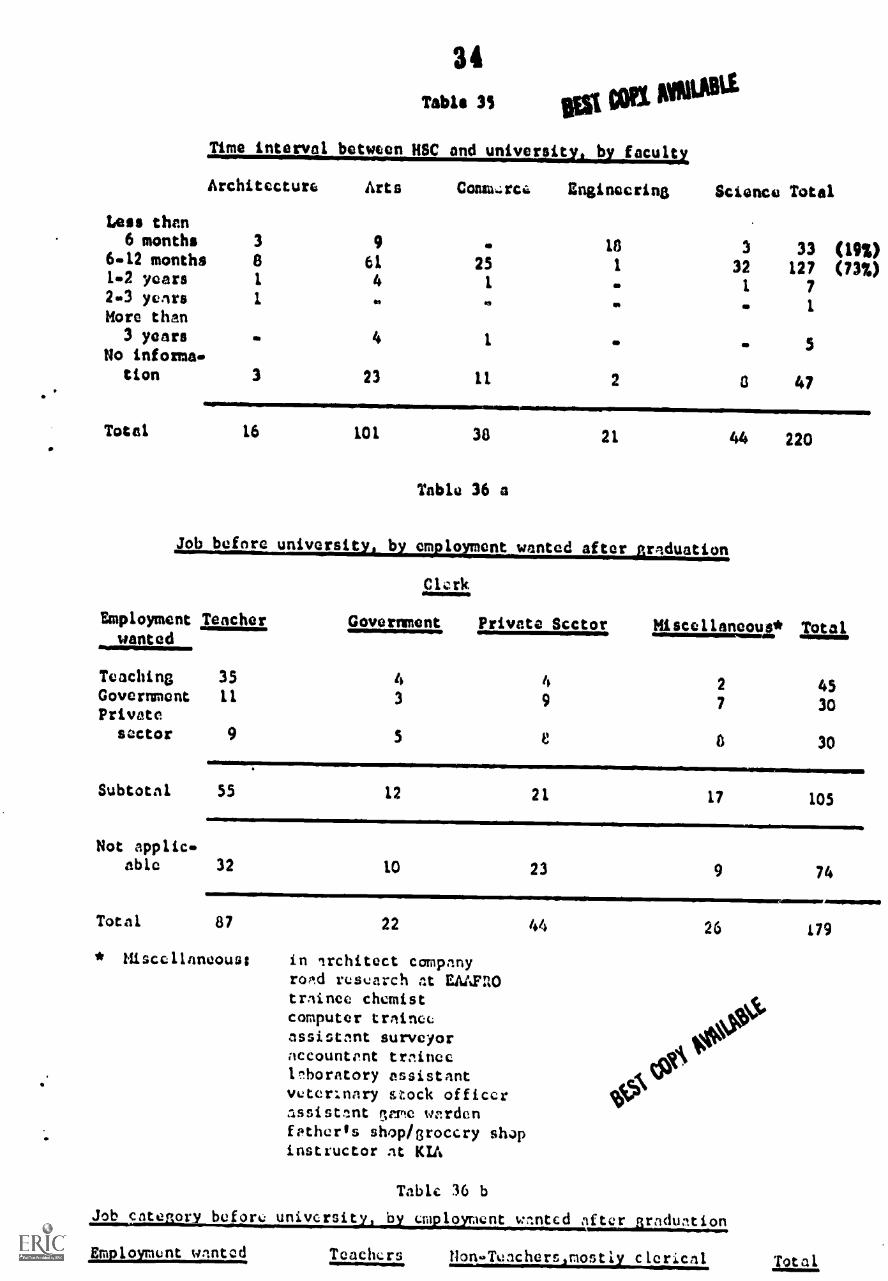
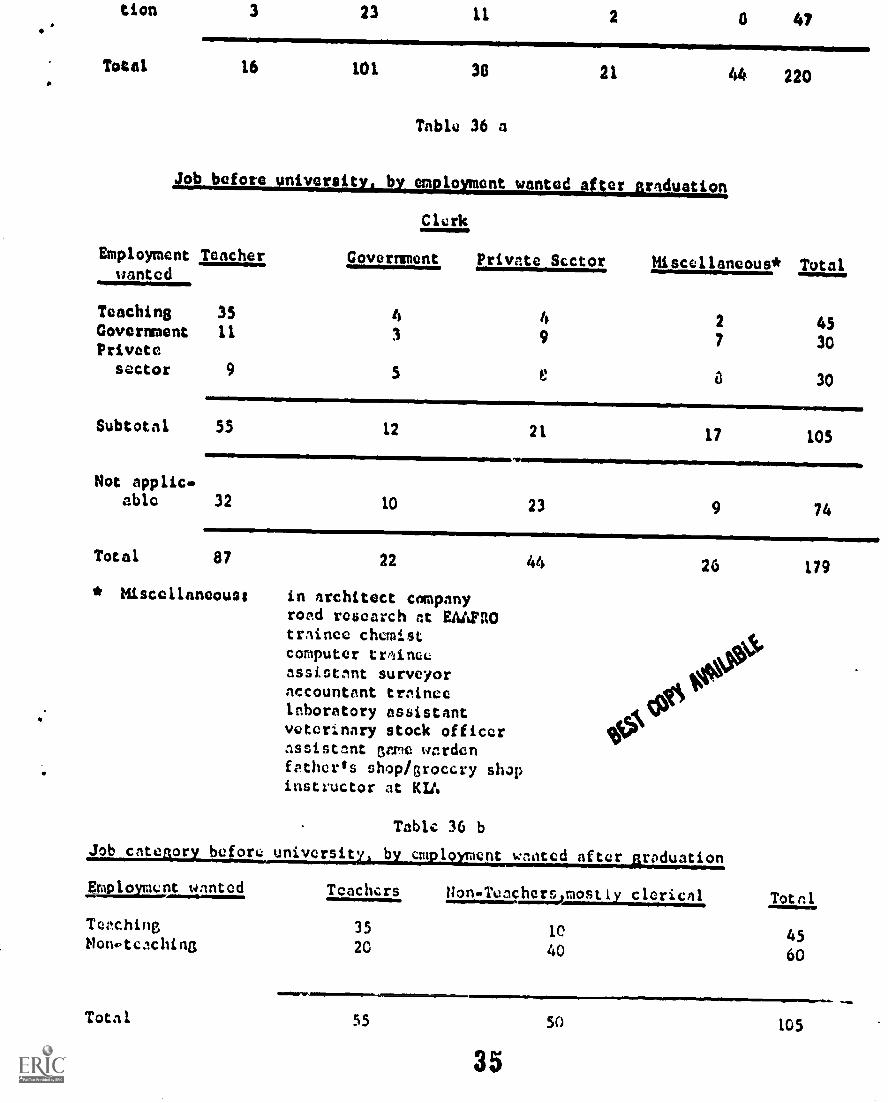
Very few students spent more than the normal nine months between completing!fisher School Certificate and beginning university education. This is a factof a= interest for university intake estimates. (Table 35)
half the students take employment au teachers between 1130 and university,
In addition, many of the utudents who are listed under different employmentalso did teaching for come time. This mane that a very large number of
university studen,s have had direct experience of teaching as a profession.When simply listed under teaching and nonte...a.Ang there iu a clear relationship
between employment between IM.0 and university and career intontio...-.4 afteruniversity graduation. raybe a close study o: tic elationship could developan early warning system on changes in employment expectations of universitygraduates. The range of employment opportunities afterii% is rather narrow,

O
Almost one =Ira or tne. students who want further edueation have done
nothing to obtain admission, or even enquire about the possibilities, Pew
of them are likely to actually, get further education, More than onethird
have already submitted their. applications and are awaiting their final
examinations before they will get an answer to their applications, (Table 2)
Students seem to have quite realistic views on their-ehanceS for
admission to postgraduate studiesl.with final examination results the major
factor for the optimistic: students., and lack of finance the major factor for
the "Small chance" category. (Table 33)
Not surprisingly, those who want AwAher education have hardly started
to look for employment yet, (Table 34)
azil.ozeritLprofile (Tables 35-48)
Very few students spent more than the normal nine months between'completing
Higher School Certificate and beginning university education, This is a fact
of some interest fur university intake estimates, (Table 35)
Half the students take employment as teachers between H3C and.university.
In addition, many of the students who are listed under different employment
also did teaching for some time, This means that a very large number of
university students have had direct experience of teaching as a profession.,
When simply listed under teaching and non-teaching there is a clear relationsh.ip
between employment bAwien HSC and university and career intentions after
university graduation. Haybe a close study of this relationship could develop
an early warning system on changes in employment expectations of university
graduates. The range of employment opportunities after. HOC is rather narrow,
however, and it is possible that this could only serve as an indicaterto the
attitudes towards teachings which is likely to remain a major employment.
opportunity for some tikes (Tables 3t.: and 36b)
41 11
" -6- 12....... .
Almost half the students who wish to take up employment as soon as possible
after'graduation base that decision on financial considerations. This usually
. is expressed in terms of supIortinE the family and pay school fees. Academic
reasons account for one third. (Table 37)
More than half, of ell students graduating this year wish to take upemployment as soon as possible after they graduate.
Almost half the students who wien to take up employment as soon as possible
after graduation had already found jobs as of mid.april. Only lo;' at that
time did not have a definite idea about the job they wanted, and about 15r.,
had not yet started looking for a job. There was apparent difference in the
status of the job hunt by their motives for finding employment. (Table 36).
There is a very significant difference in the job hunt between Science
students and the others. ANayfew of the Science students have even started
looking for employment, but this does not mean that Science students are
undetermined about a career. This of course partly reflects the large
proportion:of Science students who wish to pursue farther education, but
it could also reflect great confidence in the demand for Soience graduates.
One might have expected, however, tit rngineers, Architects, and Commerce
graduates would have reflected a similar confidence. (Table n)
Professional graduates, in Architecture, Commerce, and Engineering see
their employment as a continuation of their training and education, and
so do the scientists. Arts graduates have a wider range of motivations,
including idealism, which otherwise is almost non. - existent. (Table 40)
There is Lo relationship between the status of the job hua: and the
economic sector where the job is sought. There are a number of students.,
however, who are definite about the job they want .but who are net too
particular about where they work. These include, as examples, odministrators, ,2g
who do not have very clear preferences between government and the private
a
ow
sectors, and chemists, who want to do roseate'', either in business or at the
univ3rsity. (Table 41)
While it is not surprising that students who wish to teach come from
either the faculty of Arts or Science, it is interesting that Architects
and..Engineerte prefer the government while all the Commerce craduatcs want
co join the private sector. Scientists are evenly spread, (Table 42)
The only interesting aspect of how the jobs have been fellnd is the Large
number of jobs found through sponsorship or bond, or by returning to a
A 4A*,+-. ar,14^ .1,f1r,a liftW 1iThc ar,-4 fr,w1,1 1141 k+41, in

buaawnlits kind utile puners. -,0x5-74ew O. Axle. .Liclience sus:lent.° nave min ell,dvued
looking foremployment, but :this does not mean that toience students are
undetermined about a careers This of course partly reflects the large
proportion:of 3oienoe students rho wish to ; rsue farther edUcation, but
it could also reflect groat confidence in the demend for Science graduates.
One might have expected, however, that engineers, Arehitects, and Commerce
graduates would have reflected a similar confidence. (Table 39)
Professional graduates, in A:chitecture, Commerce, and Engineering see
their employment as a continuation of their training and eduCation, and
so do the scientists. Arts graduates have a wider range of motivations,
including idealism, which otherwise is almost non-existent. (Table 40)n
There is no relationship between the status of the job hunt and the
economic sector where the job is sought. .there are a number of students,
however, who are definite about the job they want .but who are. not too
particular about where they work. These include, as examples, administrators,
who do not have very clear preferences between government and the private
sectors, and chemists, who want to do research, either in business or at the
university. (Table 41) ".
While it is not surprising that students who wish to teacn comp from
either the faculty of Arts or Science, it is interesting that Architects
and4Engineere prefer the government while all the Commerce graduates want
to join the private sector. Scientists are evenly spread. (Table 42).
.1'
The only-interesting aspect of how the jobs have been found is the large
number of jobs found through sponsorship or bond, or by returning to a
previous job. This of course reflects how jobs are found while still in.
univerbty, and all later jobs are most likely to be found in other ways.
It is not clear if the "bonded" teachers infaot have found a job or just:1.
assume that since they were bonded to teach they will soon be given a job.
It 13

14-
This does 00= a fair aosumption, but the whole bonding situation leave
some students passively awaiting the initiative of government. (''able 43)
The students who by mid -April did not have obvious channels through
which to find jobs, be: who neverthelesv 1,ad started looking for jobs, almost
all had submitted applications to one or more prospective employer, and
almost half of them had bean to job interviews. Almost all had a definite
idea what job they wanted. (Table 44)
There is a suggestion that the decision to become a teacher was motivated
by financial need. It is also suggested that the academically motivated
decide against teaching, but this must be controlled by faculty. (Table 45)
It is interesting that those who have decided against teaching appear
more frustrated in their job hunt. One m{ :t hazard a guess that some of
them will find their way into teaching after all, in particular the ones
who would prefer a different job but arcs hut really opposed to teaching.
(Table 46)
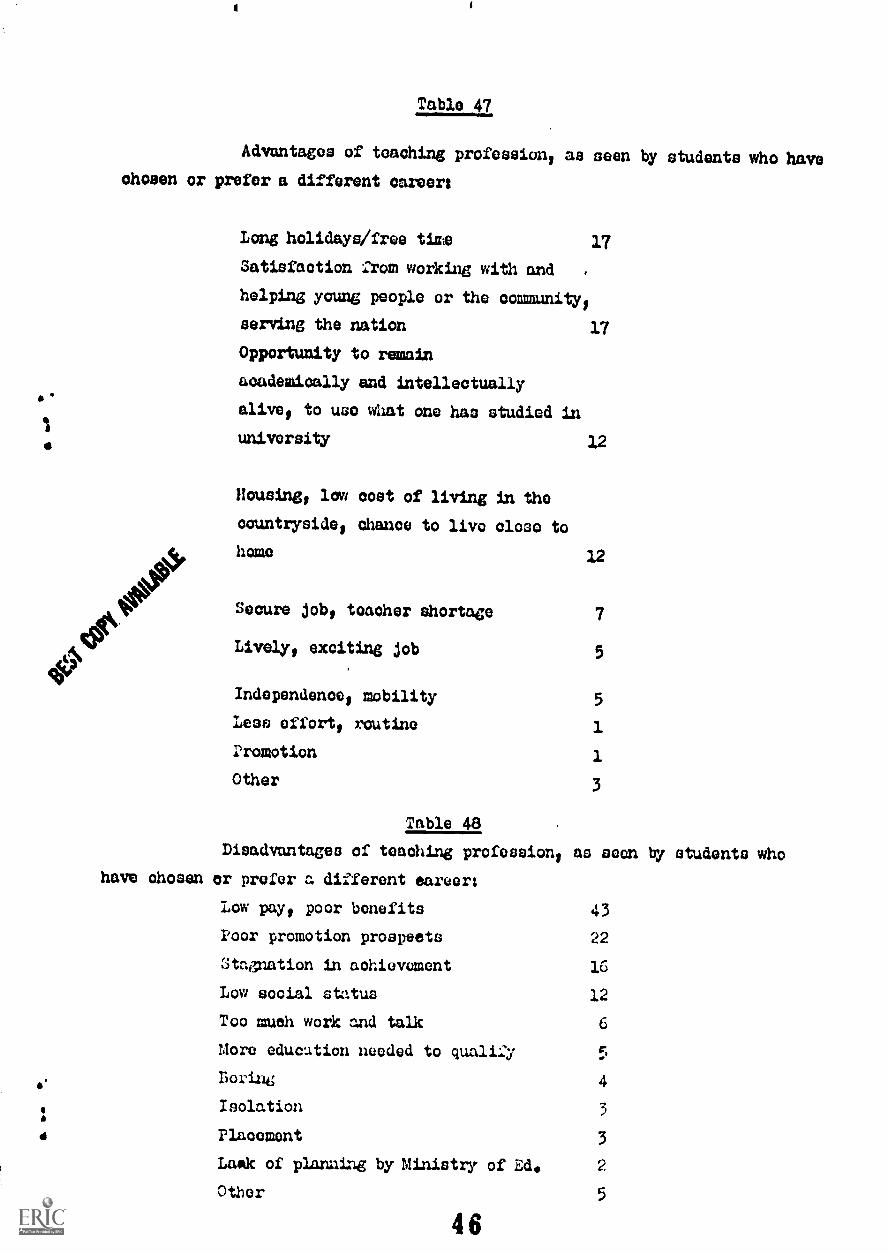
As one indication of the status of teacing as a profession, tables. 47
and 43 list the advantai;es and disadvantages of the teaching profession,
as seen by those who prefer not to teach. it is almost curious that idealism
COM03 high among the advantagoe, while in Leneral the advantages are seen as
quite diverse. In sharp contrast, the diadvantaces are much more concentrated,
with low pay md poor promotion the overti:Ielmini; discouragements.
This brief review does little more than aut;gc:ot themes for further
study, but it should establish the project ::ruitful and worth pursuing.
BEST COI 1011ABLE
15Table. 1
Total number of third year Kenyan students, University College, Nairobi,1970, with number of interview participants, by faculty
Arcilitecture Arts Commerce Iln4ieering Soienoe Total
Interviewed 14 89 29 19 37 188
Not Interviewed 2 12 9 2 7 32
Total 16 101 38 21 44 220
Before 1942
1942
1943
1944
1945
1946
1947
1948
1949
Don't know
Total
There also were 8 Kenyan graduatee from the Paoulty ofVeterinary Sciente, but they left the university beforethe questionnaire was administered.
Architecture
Table 2
Et ineerinq 3cienoe Total
Year of birth, by faculty
Arts Commeroe
2 11'4 1 OS 14
1 6 OS OS 1 8
1 7 4 1 1 14
3 13 9 2 4 31
5 20 8 8 6 47
2 13 11 5 3 11 42
2 13 2 2 10 29
4 1 2 8 15
5 2 1 3 11
9 9
16 101 38 21 44 220
* Mature Age Entry. These 11 are evenly distributed back to 1930
:$ Table 3Q.
dc/1/4 Architecture Arts Commerce Engineerina_2cience Total
Home province, by faculty
.414, Outside Kenya - 1
. Cost 2 a
North- Eastern - -
Eastern 1 10
Nairobi 3 11
Central 6 24
. . . 1
1 6 3 23
- - - -
12 . 2 . 25
3 1 11 29
13 9 6 58

Before 1942
1942
1943
1944
1945
1946
1947
1948
1949
Don't know
Total
2
1
11*
6
1 -
-
-
1
14
8
1 7 4 1 1 14
3 13 9 2 4 31
5 20 8 8 6 47
2 13 11 5 ) 11 42
2 13 2 2 10 29
- 4 1 2 8 15
. 5 2 1 3 11
. 9 - - - 9
16 101 38 21 44 220
* Mature Age Entry. Those 11 are evenly distributed back to 1930.
..&Ar&VNF
rIHome
Architecture
Table 3
province, by faculty
Arts Commerce Engineering Science Total
Outside Kenya - 1 . . 1
Cost 2 8 1 6 e0 23
North-Eastern - - - - - -
Eastern 1 10 12 - 2 25
Nairobi 3 11 3 1 11 29
Central 6 24 13 9 6 58
Rift Valley 1 7 2 - 5 15
Nyanza 2 17 4 5 11 39
;.astern 1 23 3 .).., 3 30
Total 16 101 38 21 44 220
16
Table
:ieligion, by 2aculty
Architecture Arts Commeroe ...ty`11.ineeriN.L4cienoe Tottl
227
18d%
47 0
Catholic 6 25 11 4 3 49
Muslim 2 11 4 6 16 39
Protestant 7 47 20 8 21 103
Hindu - 4 - - 3 7
Sikh 1 2 . - 1 4
Other . . 1 . - 1
No religion . 10 2 2 - 14
Donit knots - 2 . 1 - 3
Total 16 101 38 21 44 220
Total Kenya population:
2rotestants: 361Catholios: 24.;
Muolime:(Cram table 31 fertzel, olduchmidt, otchild (eda): government and Politicoin Konya (Uairobi: nast African Publishinc House, 1969) p. 54.
Table
Sox, by faculty
Architecture Arts Commerce 'Niaineerimj Science
Male 16 74 35 2C 36
2seine 27 3 1 8
Total 16 101 38 21 44
Table 6
Jex, by religion
Catholic !luslim Proteutant
Mule 38 31 90
emale 11 13
T otal 49 39 103i
Total
181 7010
39 18!
220
Kindu Sikh Other None
3 2 2 13
4 2 - 1
7 4 2 14
DK Total
2 161
- 39
2 220
18
Tja1.2.2.
ciex, by home province
Coos Eastern Nairobi Central Rift Vail N ansa Western T
Male 18 22 18 48 14 33 27 180
',male 5 3 11 10 1 5 4 39waif VIIMINEMMINm mlinsINV
Total 23 25 29 50 15 38 31 219
Table 8
3ext by number of children in family
1- 4 6 .7 -9 10..12 13 -15 more than 15 no information Total
Male 17 43 54 27 5 10 4 160
Female 2 8 8 6 1 2 1 2$3
Ifia INA
Total 19 51 62 33 6 12 5 188
Table,
Cox, by number of mothers in the family
Ono mother !tore than one mother Ih Total
Male 111 38 11 160
Female 21 6 1 28
Total 132 44 12 188
Table 10
lex, by level of mother's education
To egAsome ed butIF.; how much
Some
Primary
Std, Form 2 ?crm 4 Form 6 IBC Total
AIN
Male 78 20 43 10 3 1 5 160
Female 4 3 9 4 3 2 2 1 20
Total 82 52 14 6 3 2 6 188
Table 11..,ext by mother's profioiunoy in English
Does not speaks some Speaks ;:n;lish DK Total...218dItEnglish bnglish Very well
Mule 124 25 5 6 160
Female 11 5 9 3 28
Total 19 51 62 33 6 i2
Table (I
Sex, by number of =t1 erm in the family
Ore mother
Male 111
Female 21
Total 132
Mor,rz.l!'iur .one mother
39
6
lowavolnil .sue
44
5
Table 10
Sexy by level of mother's education
188
I
11
_TotE
160
1 28
12 188
Pic ed.Some od but
hog+ rnuohSome
P4e417
Std, 7 Form 2 Porn 4 Form 6 DK Total
Male 78 20 43 1C 3 1 5 160
Female 4 3 9 4 3 2 2 1 28
Total 82 23 52 14 6 3 2 6 188
Table 11:Ax, by mother's proficienoy in English
Does not Speaks someJoh En-lish
peaksVe
Jai) Day
wailTotal
Mule 124 25 5 6 160
Female 11 5 9 3 28
Total 135 30 14 9 188
19
One mother
More thanone mother 32
Tab...e 12
mobs's. oz stouter& in filly, by nether's level of education
Sou: eds but sawNo ed. DK how much Primary Std 7 Form 2 Form 4 Form b DK Total
45
Total 77
2)
2
23
42
9
51
3.0
3.
11
6 3 2 4 133
IS tat 44
3 2 4 177
Table 13,
Religions by level of mother's education
....alholiojayslim Protestant Hindu Sid Misc. Total
No education 18 11 42 2 - 9 82 40Some eds but:K how much 5 4 ' 11 - . 3 23 12%Some primary 8 9 30 1 - 4 52 0%Std, 7 2 6 4 - 2 14
.Porm 2 2 2 - 1 - 1 6Form 4 1 1 . 1 - - 3Form 6 - - . . 2 ., 2DK 1 . 2 1 - - 4
4Total 37 33 89 6 17 186
Table 14
Religion, sqy mother's profioisnay in English
Catholie ?Muslim Protestant Hindu t'ikh Misot Totalspeaks no
Englidh 29 18 70 3 d 1 14 135
Speaks someEnglish 2 11 13 . 1 3 30
SpeaksEnglish 6 4 1 1 2 - 14very wellDK. -
Total 37 33 89 6 4 17 106
20
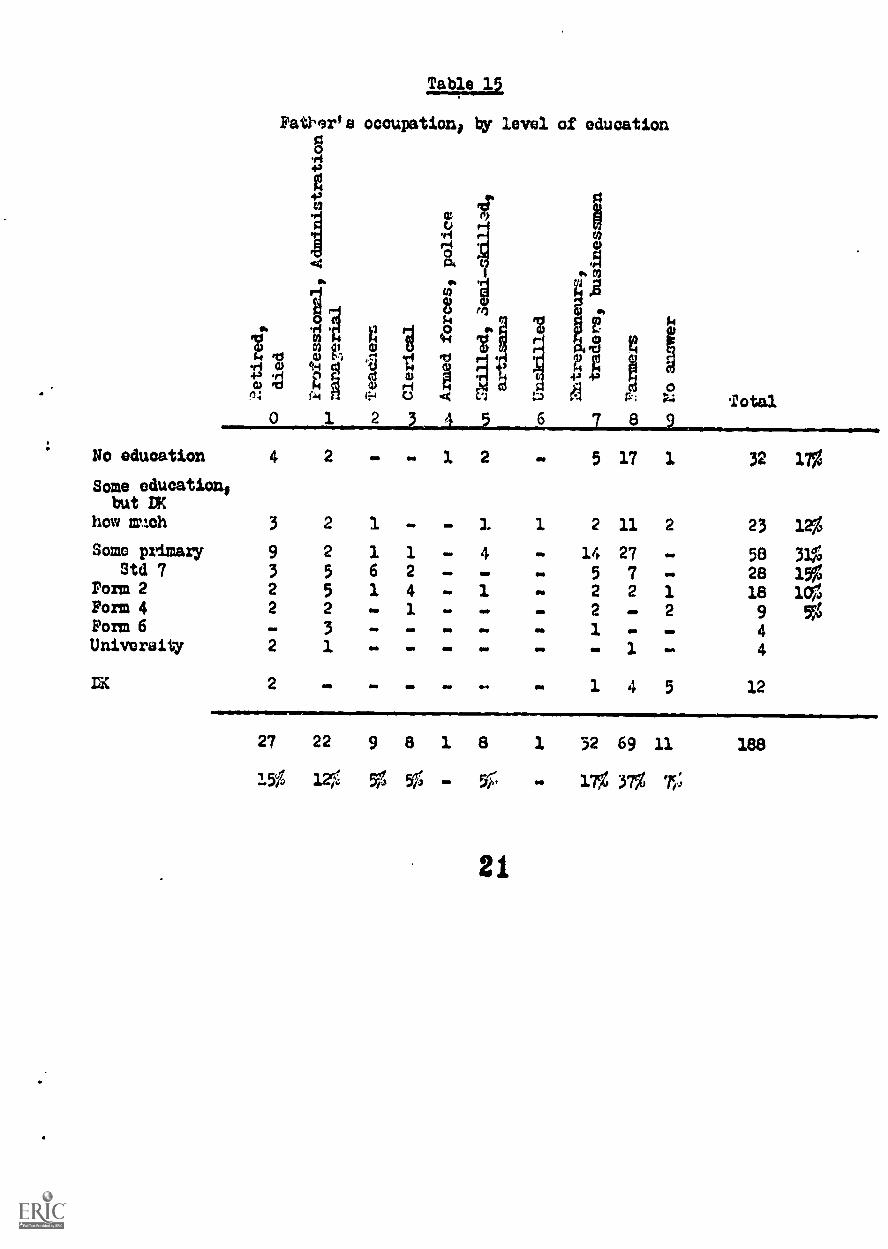
Table 15,
Patk,or's occupatian, by level of education
j4
gIfr-iv-i0
0CO
N
a4
ig
.4.
0of .11ti rg ei4 4 48 1 1077
1
0 k
irl CD
;4 'CS CD gil SI'ti VI0
liM
:L
EPel
l 8(I)
tcl'44 I r.--i 0 44 C'Ja' r-1 4 1 11
ta +A re4 Total0 1 2 1...1...05 6 8
No education 4 2 . . 1 2 - 5 17 1 32 17%
Some education,but LC
how mach 3 2 1 - - 3. 1 2 11 2 23 141
Some primary 9 2 1 1 - 4 - 14 27 - 58 32%Std 7 3 5 6 2 - - - 5 7 . 28 19/4
Porm 2 2 5 1 4 - 1 - 2 2 1 18 1C%Form 4 2 2 - 3. - - . 2 2 9 5%Form 6 - 3 - - - - - 3. - . 4Univeraity 2 1 NO On ON MO - 06 1 M 4
2 On on MO 0.0 1 4 12
27 22 9 8 1 8 1 32 69 11 188
15% 12 g, 91 9% - - 17% 37% 7r,
21
Father's occu ation b father's membcrshi
on committees
0*
12
34
No nembcrships
21
81
51
Political
1.2
..
Sclf-help, educational,
cooperative
15
1-
-Ri:ligious
1-
21
.Politicai. and self-
help
--
--
-Political and
r-..1iLims
--
..
.
Self -help and religious
13
31
.Politic-A, salf.help,
and religious
.2
..
.
Other
11
--
-No nnsvcr
11
21
.
Total
27
22
98
1
CM
* Ta identify occupation4, see Table 15
Olt
IIt
0*
No land
lii
137
1-2 acres
.
3-4 acm:s
15.4 acr@s
It
410 -19 -..crel
1
20-49 acres
2
50-99 acres
-
LOG across and up
-
No acreage given
2
NO answer
2
Total
T7
56
76
9
51
16
29
21
_-
715
1.
44
--
-2
.-
-.
-.
-2
11
..
-.
i2
--
39 2
4
MID
4WD
a1
32
69
11
12
Table 17
Father's occupation, by father's land
34
5
81
5.
3
..
..
.
.1
1-
1.
31
..
32
.1
1
41
1-
.2
1.
.-
--
--
-
5-
--
2
--
--
1
22
98
16
67
69
I13
.3
.1
5-
.2
31
.3
14
-
.4
16
1
.7
10
1
..
5-
.1
6-
-1
10
1
--
-5
132
69
11
* To identify occupations, sec Table 15
Utr

Table
16
7222pccuationtjg fnthergs membership oncommittees
23
45
6
15
15
1
-.
1.
-.
.
21
.1
.
--
--
-
..
..
.
31
--
--
--
--
-.
21
.2
.
'4,MIN
IOM
404146
98
18
1
Aspntions, sec Table 15Tnble 17
Father*s.occupction, by filtheres land
23
45
6
1321
5
4.
OS
46014
1
3014
014
I014
014
014
014
C.014
011
410
9
014
2I
a1
8
cupations, see Table 15
78
9Total
162
291
2.896
477.
715
.29
15%
44
...
13
7%
-2
.2
..
.-
211
21
114
-4
-5
1-
.3
.3
919
32
69
11
1&8
Ce3
Total
426%
56
23
10
314
25
13%
416
29
154
710
I25
13%
58
67
110
121
58
32
69
11
188
MIN
NId03
Father's occuontion
Table 16
b number of ermanent labourers on land
0 1 2 3 4 5 6 7 0 9 Total
No lnbourers 21 12 5 14 24 63 121 64%1 labourer 2 2 1 2 10 17 10%2 Inbourc:rs 2 5 2 1 3 13 7%3.4 labourers 2 1 41111 4 SHon thin
4 labourers 1 1 4 3 9No answer 4 GI 4 11 20
Total 27 22 9 16 32 69 1.1 166
* To identify occupations, see MU.. 15
Table 19
School where students obtained their HSC
Kamm School 10 Kisumu Boys 4
Friends School Kamusinga 15 Kagumo High School 3
Alliance Boys 16 Konya Polytechnic 3
Kenyntta College 14 liachnkos High School 3
Nature Ace Entry 14 Masano imtional School 3
Private Candidates 14 Jamhuri High School 2
Act Khan, Nairobi 12 Konya High School 2
Alliance Girls 11 Upper Hill School 2
Kisii Nigh School 10 Highlands School 1
Strathmore College 10 Kakamegft Hick School 1
Allidina. Visra 9 Nakercre 1
Thika High School 7 Nairobi School 1
P^n2ani Girls 6 St. Wry's Sch)ol, Nairobi
Loreto Convent, HIsongari 5 St. Mary's School, Yale
Nakuru High School 5 HOUSQ Rw.d Girls
Shimola.Tewa 5 Other or no information 17
Nyri High School 5
24
istsitort MOO.
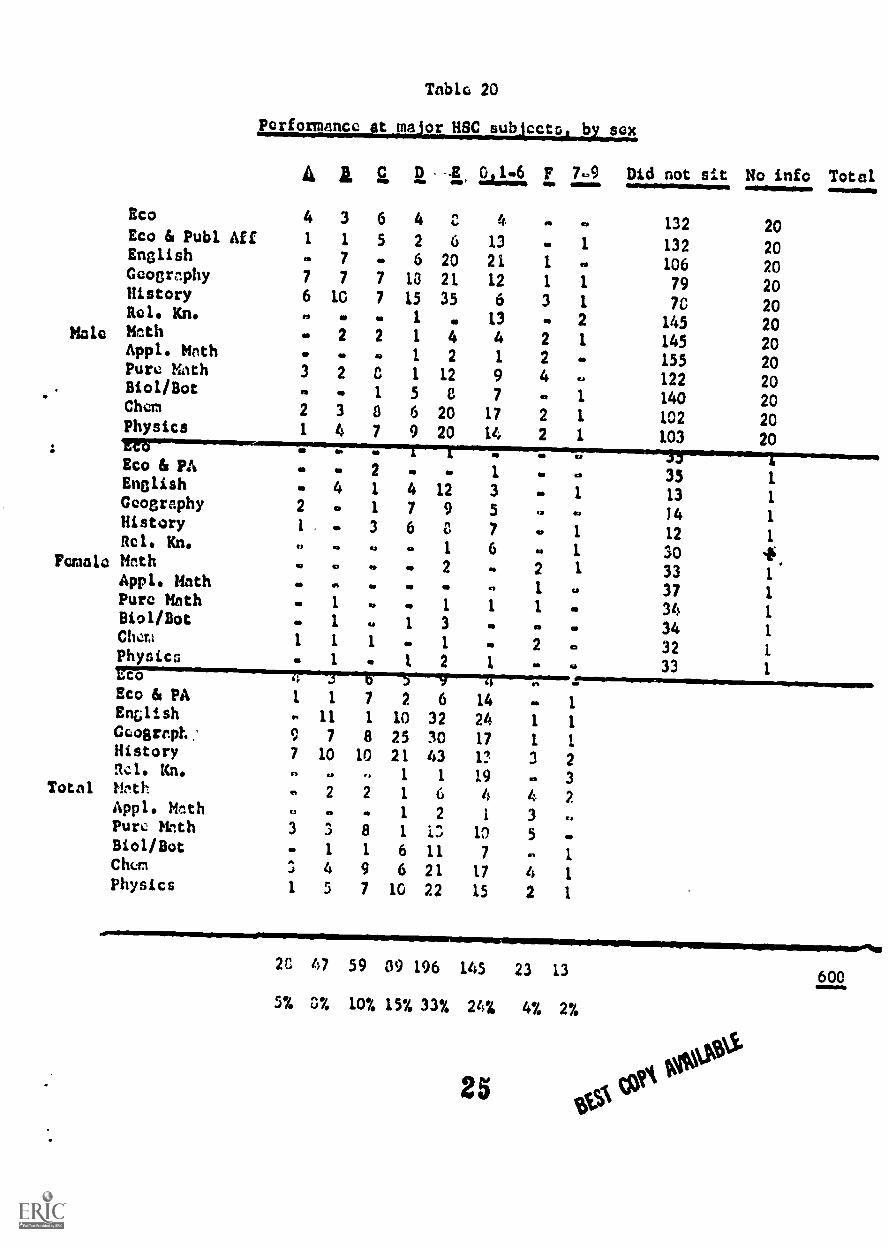
Table 20
Performance at na
C D F 7.9 Did not sit No info Total
Eco 4 3 6 4 C 4 . . 132 20Eco & Publ Aff 1 1 5 2 6 13 . 1 132 20English . 7 . 6 20 21 1 106 20Geography 7 7 7 13 21 12 1 1 79 20History 6 10 7 15 35 6 3 1 70 20Re 1. Kn. . . . 1 . 13 2 145 20Male Math - 2 2 1 4 4 2 1 145 20Appl. Math . . . 1 2 1 2 . 155 20Pure Mnth 3 2 0 1 12 9 4 122 20Eiol/Bot . . 1 5 0 7 . 1 140 20Chem 2 3 0 6 20 17 2 1 102 20Physics 1 4 7 9 20 14 2 1 103 20
. . . . . .Eco 61 PA . - 2 . . 1 al 35 1English . 4 1 4 12 3 .
1. 13 1Geography 2 1 7 9 5 . 14 1History 1 . 3 6 C., 7 1 12 1Rel. Kn. . . . 1 6 . 1 30 +Ferah1a Math . . . 2 2 1 33 1Appl. Math . a 4 I . 37 1Pure Mhth . 1 . 1 1 1 . 34 1Biol/Bot . 1 . 1 3 . . . 34 1Chem 1 1 1 . 1 . 2 . 32 1Physics 1 . 1 2 1 . 33 1ILCO 4 J b S -V iEco & PA 1 1 7 2 6 14 . 1English 11 1 10 32 24 1 1Geograph: 9 7 8 25 30 17 1 1History 7 10 10 21 43 13 3 2R.:I. Kn. . . 1 1 19 . 3
Total tinth . 2 2 1 6 4 4 2Appl. 14*th . . . 1 2 1 3Pure Mhth 3 3 8 1 15 10 5 .Riol/Bot . 1 1 6 11 7 1.
Chem 5 4 9 6 21 17 4 1Physics 1 5 7 10 22 15 2 1
AmillIMIN=1111111.
20 47 59 89 196 145 23 13 600
5% 0% 10% 15% 33% 24% 4% 2%
25to°

Facultyof
first choice
ArchitectureArts
CommerceEngineeringLa;MedicineScienceVet. Science
Total
Facultynow
wanted
ArchitectureArtsCommerceEngineeringLawMedicineScience
Vet. Science
Total
26Table 21
Faculty of study, bLLsailty51UI.125c12o1..
Architecture Arts Commerce Engineering Science Taal
111
a
1
2
65
12a
29
19
a
1
7
13
67
41.
279 a 1 10
a a 4 41 1 a 22 24
a a a 2 2
14 89 29 19 37 188.
Table 22
Faculty of study) by faculty now wanted
Architecture Arts Commerce Engineering Science Total
13 1 a 141 75 1 3 80
2 29 a 31a 18 1. 19
7 a a 7
2 24 a 30 34
a a a1. 1
14 89 29 19 37 183
Table 23
Lcally...aUllsilx1.17 reasons for studying_ in thc.t faculty,
Architecture Arts
GeneralinterestParticular sub.ject interest 3
Employmentopportunities 5
PreviousemploymentexperienceRecommended byfriends, teachers 2
Did not get admisasion to facultyof first choice
37
7
16
1.
24
Commerce Engineering
5
3
15
3
7
J
6
1.
2
Science Total
14 63 34%
5 21 11%
3 45 24%
a 4
6
15 42 22%

Faculty of study) by facultx now wanted
Facultynow
wanted
Architecture Arts Commerce Engineering Science Total
Architecture 1.3 1. 14Arts 1 75 1 3 80Commerce 2 29 31Engineering 18 1. 19Law 7 7Medicine
2 2Science 4 30 34Vet. Science
1
Total 14 89 29 19 37 188
Table 23
Faculty of study, by reasons for stud in in that facult
EngineeringArchitecture Arts Commerce
GeneralinterestParticular sub.ject interestEmploymentopportunitiesPreviousemploymentexperience
Recommended byfriends, teachersDid not get admis-sion to facultyof first choiceOther, no ans,...r
Total
Science Total
37 5 7 14 63 34%
3 7 3 3 5 2111%
5 1.6 15 45 24%
3 4
2 1 1 2 6
3 24 111P 15 42 22%1 4 2 elb O 7
14 69 29 19 37 188
27

EconomicsEnglishGeographyHistory
Total
28Table 24
3:1:1 Arts degrees
Without education option With education option Total
3
6
41
1
4
9
47
3
10
AMP
411, N11111111111111
14
Tabl4; 25
15 29
Secondsubject
3:2:2 Axts subject combinations, without education
First subject
Economics EnAlish French Geography Government History, ,Tots
English 2 2
French 1
Geography 5 5
Government 11 2 C . 13
History 4 3 1 6 14
Sociology 3 2 . 1 3 1 10
Total 25 8 1 1 9 1 45
To get total for each individual subj.xt, add vertical and horizontal
columns for that subject.
Tabl. 26
3:2:2 Arts, sublect combinations, with education
First subject
Second Economics English French Geography Government History Total
subject
EnglishFrenchGeographyGovernmentHistory
bowSociology
El
t3 Totalam
1
O
1
3
5 1
3
1
a1
2
2
1
3
6
1
13
3
27
To Set total for Lcch individual subj..ct, add v.rtical and horizontal
columns for that subject.
Second Economics English, French Geography Government .Mister
subject
EnglishFrenchGeographyGovernmentHistorySociology
Total
22
1
5
11 2 eJ 13
4 3 1 1111 6 14
3 2 1 3 1 10
25 8 1 1 9 1 45
To get total for each individual subject, add verticni and horizontal
columns for that subject.
Table 26
3:2:2 Arts, subject combinations, with education,
First subject
Second Economics ELVish French GccAraphy Government Hists.0 Total
subject
English
al FrenchiGeographyGovernmentHistorySociology
Total
11
3 3
5 1 6
1 1
3 3 2 13
1 1 1 3
2 11 1 10 2 1 27
To ['jet total for each individual subjt.ct, add vertical and horizontal
columns for that subject.
29
Male
Table 27 BEST COIN ANIKABLE
Arts education option,' by sex
Female Total
Educationwith 38111 10 3 13
Educationwith 3:232 16 12 23
No education 48 12 6C
Total 74 27 101
(Science education options2)
Ta'ale 28
Science subject combination
First subject
Second Be = Chcm Geolonv, ie2.4 Math Ara Math Pure Math 11s Totalsubject
Chem. 11
Geology 6 6Geog. 2 2Math 1 1ppl. Math
1. 1Pure Math 7 7Physics 6 1 2 1111 9Zoology 7 1 16
Total 0 20 2 3 3 7 43*
* There was one 3:111 Geogrcphy
To get total for cach individual subject, add vertical and horizontalcolumns for that subject.
30
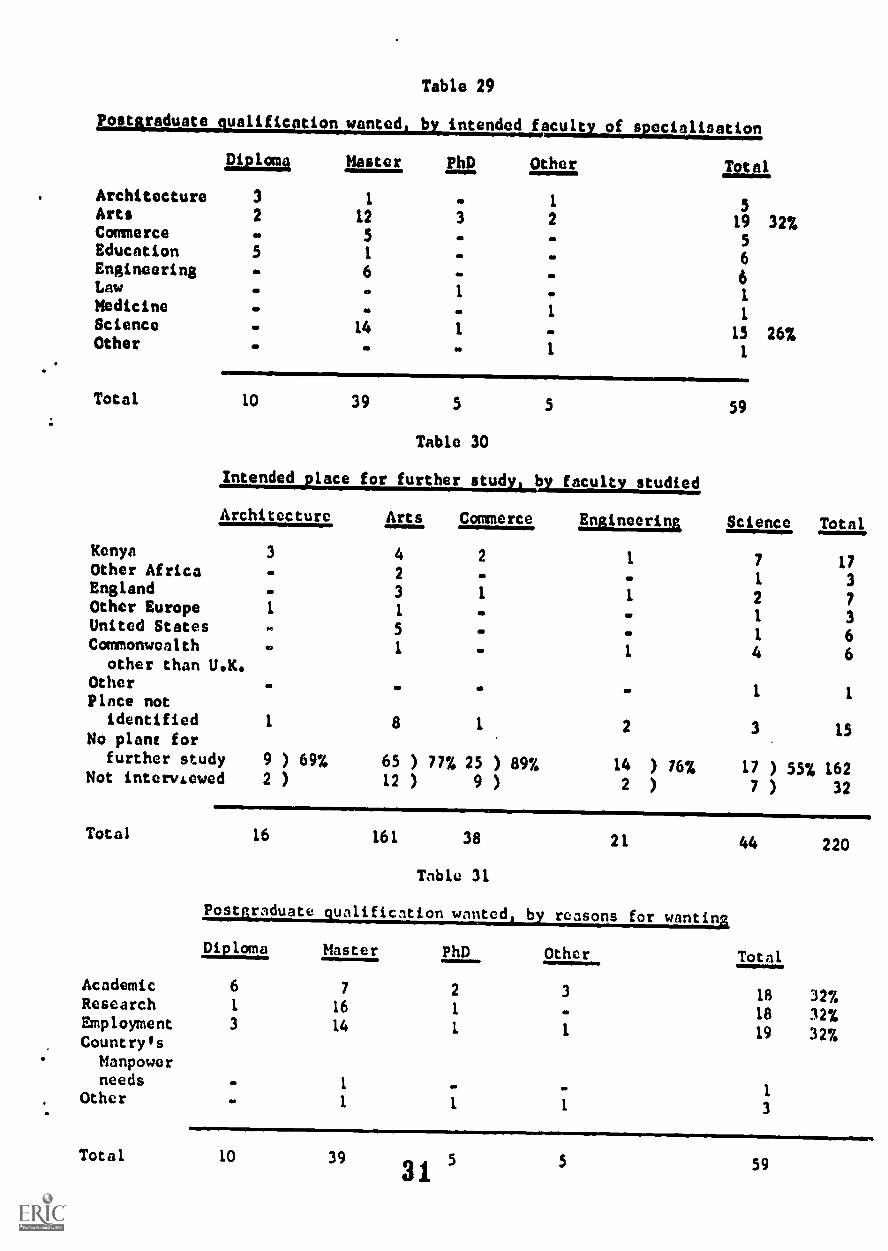
Table 29
Postgraduate qualification wanted, by intended famiuslAinusalluLlum
Master PhD Other Total
Architecture
,Diploma,
3 1 . 1 5Arts 2 12 3 2 19 32%Commerce . 5 . 5Education 5 1 . 6Engineering . 6 - . 6Law . . 1 . 1Medicine .
1 1Science - 14 - 15 26%Other . . 1 1
Total 10 39 5 5 59
Table 30
Intended lace for further stud b facult studied
Architecture Arts Commerce Engineering Science Total
Kenya 3 4 2 1 7 17Other Africa 2 1 3England 3 1 1 2 7Other Europe 1 1
1 3United States 5 1 6Commonwealth 1
other than U.K.1 4 6
Other1 1
Place notidentified 1 8 1 2 3 15
No plant forfurther study 9 ) 69% 65) 777. 25 ) 89% 14 ) 76'2, 17 ) 55% 162
Not interviewed 2 ) 12) 9 ) 2 ) 7) 32
Total 16 161 38 21 44 220
Table 31
Postvaduate qualification wanted, b reasons for wanting
:Diploma Master PhD Other Total
Academic 6 7
Research 1 16
Employment 3 14
Country'sManpowerneeds . 1
Other . 1
Total 10 39
31
2 3
1 .
1 1
- .
1 1
55
18 32%18 32%19 329.
1
3
59

32Table 32
pstgraduate qualification wantedijaxeps taken to obtain admission
Diploma Master PhD Other Total
Has done nothing 3 9 2 2 16 28%Discussed with
UCN staff 2 7 - 1 10 177,Written for
information . 2 - . 2
Received applicaLion forms 3 . . 3
Submitted applica.Lion 3 14 2 1 20 34%
Been admitted 2 1 - 3Arrangements
being madeby UCN staff 2 2 . 4
No information - - . 1 1
Total 10 39 5 5 59
Table 33
Postgraduate Qualification wanted, by perceived chances for admission
Diploma Master
Very good 4 8
Fairly good 4 21Small chance 1 8No answer 1 2
Total 10 39
P_ hD Other Total
2 2 16
2 2 291 . 10. 1 4
Table 34
5 5 59
Postgraduate qualification wanted, by action taken to secure job
aploma
Have foundjob
Have startedlooking
Have not startedlooking but
hnve definiteidea 9
Have not startedlooking, anddo not havedefinite idea 1
Master
2
PhD
SS
Other Totil
2 4
25 3 2 39 677.
12 2 1 16

Total 10 39 5 5 59
Table 33
Postgraduate Qualification wanted, by perceived chances for admission
Diploma Master PhD Other Total
Very good 4 8 2 2 16Fairly good 4 21 2 2 29Small chance 1 8 1 . 10No answer 1 2 1 4
Total 10 39 5 5 59
Table 34
Postgraduate qualification wanted, by action taken to secure job
,Diploma, Master PhD Other Total
Have found aJob 2 o 2 4
Have startedlooking
Have not startedlooking but
have definiteidea 9 25 3 2 39 67'!.
Have not startedlooking, anddo not havedefinite idea 1 12 2 1 16
Total IC 39 5 5 59
33
34Table 3, gig Oratati
Less than
Time interval between HSC and university, by faculty
Science TotalArchitecture Arts Comal..ace Engineering
6 months 3 9 16 3 33 (19%)6.12 months 8 61 25 1 32 127 (73%)1.2 years 1 4 1 1 72.3 years 1 .
... 1More than3 years . 4 1 . . 5
No informa.tion 3 23 11 2 8 47
Total 16 101 38 21 44 220
Table 36 a
Job before universit b cm lo ent wanted after rnduation
Clerk
Government Private Sector,Employment Teacher Miscellaneous* Totalwanted
Teaching 35 4 4 2 45Government 11 3 9 7 30Private
sector 9 5 6 30
Subtotal 55 12 21 17 105
Not applic.able 32 10 23 9 74
Total 87 22 26 179
* Miscellaneous: in architect companyroad research at EAAP:10trainee chemistcomputer traineeassistant surveyoraccountant traineelnhoratory assistanttouter:nary stock officerassistant r, !e warden
father's shop/grocery shopinstructor at KIA
Table 36 b
Job cite or bcforc univcrsit' b 1 cnt wanted after raduntion
Employment wanted Teachers Non- Teachers,nosti clerical Total
tion 3 23 11 2 8 47
Total 16 101 30 21 44 220
Tablu 36 a
Job before university. by employment wanted after graduation
Clurk
Employment Teacher Government Private Sectorwanted
Teaching 35Government 11
Privatesector 9
Subtotal 55
4 43 9
5 e
en NO I I I MI I =ft.
12 21
Not applic.able 32 10 23
Total 87 22 44
* Miscellaneous* in architect companyroad research at EAU=trainee chemistcomputer traineeassistant surveyoraccountant traineelnboratory assistantveterinary stock officerassistant gnme wardenfather's shop /grocery shopinstructor at Kt&
Miscellaneous* Total
2 457 30
8 30
17 105
9 74
26 179
Table 36 b
1212LatIWILIELML univcrsit' b cm lo gent wanted after roduation
kaployrwt wnnted
TeachingNons,teaching
Total
Teachers
35
20
55
ton- Teachers mosti clerical Total
10 4540 60
50 105
35

Reasons for wanting
Table 37
to work after graduation, by facu'
Reasons to work Architecture Arts Commerce
Financial 2 33 0
rEnnineerinR
3
Academic 5 10 10 4
Employment
Idealism
.
.
C,
3
4 5
N.rsonzl . 5 1
Total 7 57 23 12

Table 37
for wantin to work after cireduction, by faculty
Arts COM:me
33 8 3
10 10 4
6 4 5
3 . .
5 1 -
57 23 12
Science Total
5 51 47%
5 34 31%
. 15 14%
. 3
. 6
109

Status job hunt
Table 38
Reasons to work right away, by status of lob hunt
Financial Academic Rimoloyment Idealism
Found job,happy 22 43% 11 327. 6 40% 2
Found job, 2
OD not happy 3 5 2
CIDStuted looking,not found,definite ideajob prafklrence
3
16 312, 9 26% 6 40% 1
Started looking,not found,not sure job
preference
4
3 2
Not startedlooking,
definite ideajob preference
5
4 5
Not st'rtcdlooking,
not sure jobpreference
6
3 2 ft*
Total 51 34 15 3
Table 38
asons to work right away, by status of job hunt
:cademic
327,
26%
pnoloyment
40%
40%
Idealism Personal Total
39%
9%
31'L
10%
42
10
34
7
11
5
11
5
9
2
S
2
6
2
6
IP
2
.
1
1
.
2
2
34 15 3 6 109

1
Table 39
Status of job hunt, by faculty
Status iob hunt* Architecture Arts Commerce Engineering,INIMMINE
1 6 24 11 6
2 ..e 1 1
3 3 17 10 5
4 a 6 a a
5 4 24 6 2
6 1 12 1 5
Total 14 89 29 19
* To identify Job hunt categories, see Table 38
Table 40
Reasons Architecture Arts Comerce Enginceriu
Financial 9
Academic 10 19 17 10
Employment 3 19 9 4
Idealism 16
Personnl O 9 2
No answer 17 5
Total 14 89 29 19

Table 39
Status of job huntyby faculty
Commerce Engineering Science Total
11 6 a 47 251
101
54
2
12
376/0414011V
20%2 8
6 2 21 57 30%5 C 27 14%
188
categories, .cc Tvble 38
Table 40
'sons for preferring particular job, by faculty
ScienceComerce Engineering
. - 2
17 10 14
9 4 7
. - 1
2 - 3
1 5 10
29 19 37
Total
11 G%70 37%42 22%17 9%14 7%34
Table 41
Job fund, happy
Status lob hunt, by employer wanted
Job found, not happy Started looking, not
but definite job prof
Goverment, pnrastntaland E.A. Comm. 12 4 8
Teaching 19 6 4Private Sector 14 1 8
Subtotal 45 11 20
Occupation definite,but economic sectornot identified 2 1 17
Total 47 12 37
Table 42
Definite employer wanted, by Faculty
Architecture arts Commerce tra
Government, parastnt:1and E.A. Comm. 6 14
Tenching a 39
Private Sector 1 6 17
Total 7 59 17
Table 41
lakulltaLulLaaelatuaraLl
happy Started looking, not found, Not sr--ted looking, Tottl
but definite job preference but definite job pref.
8 a 324 17 460 9 32
20
17
34 110
23 43 28%
37
Table 42
tc employer wanted, by faculty
57 153 VDSI
Commerce Enpineerinq Science Total
5 7 32
7 4617 2 6 32
17 7 20 110
se $

Table 43
Social Scientists
Teachers servicecommission
How job was found, by occupation found
Public service Direct employer Vacationcommission contact Previous
3
Engineers 2
Surveyors . 4ArchitectsTeachers 10
AccountantsGovernment administrators 2
wompany executives 1
Total 10 5 7
Table 43
was found, by occupation found
a Direct amployer Vacation employment, Sponsored,contact Previous employment bonded
WNW
Total
. 32 - 3 54 1 1 6., 2 2- 3 10 23- 3 2 5
.. 1 . 3
1 6 . 7
7 14 18 54
26% 33%
/11
I
Table 47
Advantages of teaching profession, as seen by students who have
chosen or prefer a different careers
Long holidays/free tine 17
Satisfaction :rem working with and
helping young people or the oommunity,
serving the nation 17
Opportunity to remain
academieally and intellectually
alive, to use what one has studied in
university 12
Housing, low cost of living in the
countryside, chance to live close to
home 12
Secure job, teacher shortage
Lively, exciting job 5
Independence, mobility
Less effort, routine
Promotion
Other
5
1
1
3
Table 48
Disadvantages of teaching profession, as seen by students who
have chosen or prefer a different eareor:
Low pay, poor benefits 43
Poor promotion prospects 22
Stagnation in aohievument 16
Low social status 12
Too mush work and talk 6
More education needed to qualify
Loring; 4
Isolation 3
Placement 3
Leak of planning by Ministry of Ed. 2
Other 5
46