mexico's transition towards a low-emission and climate ... · towards a low-emission and...
TRANSCRIPT
| 0
Mexico’s transition towards a low-emission and climate resilient development.
Francisco Barnes-RegueiroPresidentNational Institute of EcologyINE / SEMARNATMEXICO
August 2011

| 1
▪ To describe our Policy Instruments on Low Emission Development and adaptation
▪ To describe our effort to develop a Climate Change Center in Mexico
Objectives

| 2
-0.6
2.7
-0.3
0.2
3.7
3.2
In 2006, México generated 709 MtCO2e. Energy transformation and consumption accounted for 60% of total emissions
1 HFCs, PFCs y SF6 Emissions are not includedSource: GHG National Registry (INEGEI), INE 2009
2.2
37
4732
1996
347
100
82
56
383634
Transportation
Electricity transformation
Manufacturing andconstruction
Hydrocarbon production
Fugitive emissionsOther
2006
430
145
112
57
CO2 Emission – Energy Sector 1TgCO2
CAGR (%)
CO2 Emission TotalsTgCO2, Percentage, 2006
14
10
69
Waste
Forestry and land
AgricultureIndustrial processes
Energy
60
100% = 709 TgCO2

|
Internationally, Mexico has pledged to reduce its emissions by 50 Mtons by 2012 and by 30% vs. business as usual by 2020
“Mexico adopted its Special Climate Change Program in 2009 including a set of nationally appropriate mitigation and adaptation actions to be undertaken in all relevant sectors. The full implementation of the Programme will achieve a reduction in total annual emissions of 51 million tons of CO2e by 2012, with respect to the business as usual scenario.
Mexico aims at reducing its GHG emissions up to 30% with respect to the business as usual scenario by 2020, provided the provision of adequate financial and technological support from developed countries as part of a global agreement.”
Emissions reduction pledge in Copenhagen Accord
Source: Copenhagen Accord, Appendix II

|
This administration has set as a priority taking action on climatechange…
Source: Towards Green Growth, OECD; Green Economy UNEP; Internal analysis4
National Development Plan (2007-2012). For the first time Sector Programs (2007-2012) of several Secretaries propose strategies to face climate change
Intersecretarial Commission on Climate Change: Has coordinated the activities of the offices of the Federal Public Service on mitigation and adaptation
The Fifth National Communication of Mexico to UNFCCC is in preparation, will be updated the GHG Inventory to 2009. To be presented in COP 18 (2012)
Special Program on Climate Change: Identifies opportunities to reduce 50 MTons by 2012 across all sectors. Includes commitment for continued and periodical monitoring and review process
State Programs on Mitigation and Adaptation: Identifies mitigation and adaptation actions by sector: 4 Concluded, 22 Underway
15 Year Energy Policy Outlook: Sets targets on renewable penetration, Gas Flaring, Energy Efficiency
15 Year Water Policy Outlook: Identifies actions to decrease water scarcity and alleviate water related disasters
Climate Change Law: Several law initiatives have been submitted to Congress that include binding targets on mitigation, increased funding for research, etc.
|http://www2.ine.gob.mx/sistemas/peacc/
4 State Plans have been concluded and 22 more are underway
Source: INE

|
Sector
Source: Programa Especial Cambio Climático
▪ Incorporate more land into the Sustainable Forestry Management system▪ Design and implement an incentive scheme to reduce degradation of
forests and deforestation▪ Create payment mechanisms for forestlands▪ Incorporate terrestrial ecosystems into the UMAS system▪ Incorporate lands into forestry ecosystems of the ANP▪ Establish a commercial forestland
Forestry
0.61.11.41.4
3.04.4
Represent 50% of goal
Initiative ImpactMtCO2
▪ Injection of gas in Cantarell▪ Operational oil and gas efficiency projects▪ New operation of a cogeneration plant in PEMEX
Oil & Gas
0.91.2
6.9
▪ Substitute appliances including refrigerators, air conditioners, and other equipment and light bulbs with more energy efficient devices
▪ Install efficient wood burning stoves▪ Promote eco-friendly technologies in homes through “green mortgages”
Buildings
1.21.6
2.7
▪ Increase train share of federal cargo▪ Create 38 new stretches of highways▪ Take 15 K "clunkers" out of federal transport system▪ Increase clean cargo and passenger transport under Semarnat’s "Clean
Transport“ program
Transport
0.91.11.21.6
▪ Develop 29 projects aimed at reducing or eliminating landfill emissionsWaste 4.4
▪ Partner with private investors to increase renewable energy in self-generation for private sector by 2 GW
▪ Increase CFE generation of wind power ▪ Finish CFE thermoelectric project in Manzanillo ▪ Finish the construction of hydroelectric plant La Yesca
Power
1.11.2
3.7
0.8
▪ Implement a planned grazing use on pasturelandAgriculture 0.8
Code Description
▪ M.64▪ M.78
▪ M.66▪ M.65▪ M.67▪ M.73▪ M.01▪ M.03▪ M.04
▪ M.37
▪ M.43▪ M.39▪ M.31▪ M.27▪ M.29▪ M.26
▪ M.82
▪ M.18
▪ M.15▪ M.11▪ M.14
▪ M.63
PECC identifies 50 Mtons of abatement opportunity up to 2012 with 22 initiatives delivering 85% of target

|
National Energy Strategy sets targets on renewable penetration, energy consumption, and gas flaring
Goals
Baseline scenario
99.4
2024
90.2
2009
90.2
9.2
Natural gas usagePercentage
Final energy consumption savingsTWh
▪ Identified saving potential in the “Programa Nacional para el Aprovechamiento Sustentable de la Energia 1”
Clean technology electric generation capacityPercentage
25
27
35
20242009
10
▪ Includes large hydroelectric, nuclear and renewable
1 197.4 TWh related to transport sector savings in gasoline and diesel
0
280
20242009
Source: Estrategia Nacional de Energía

|
PROGRAMAS ESTATALES DE ACCIÓN ANTE EL CAMBIO
CLIMÁTICO
Its usefulness:• Strengthen the descentralization process
analysis, design of actions, and implementationof policies related to climate change.
• Induce cooperation and exchange ofexperiences between institutions at all levelsand in all relevant areas of government,academia, the private sector, between statesand society in general.
• Take into account the knowledge "local" onthe problem and related factors, to supportcapacity development.
• Will form a important part in the critical path forclimate change policy in Mexico.
• Sustain the policies and actions related toclimate change at the state level.
State plans strengthen descentralizaton, cooperation exchange and take into account local knowledge
Objective:That PEACC be an instrument to support planning and development of public policieson climate change at the state level

|http://www2.ine.gob.mx/sistemas/peacc/
4 State Plans have been concluded and 22 more are underway
Source: INE
|
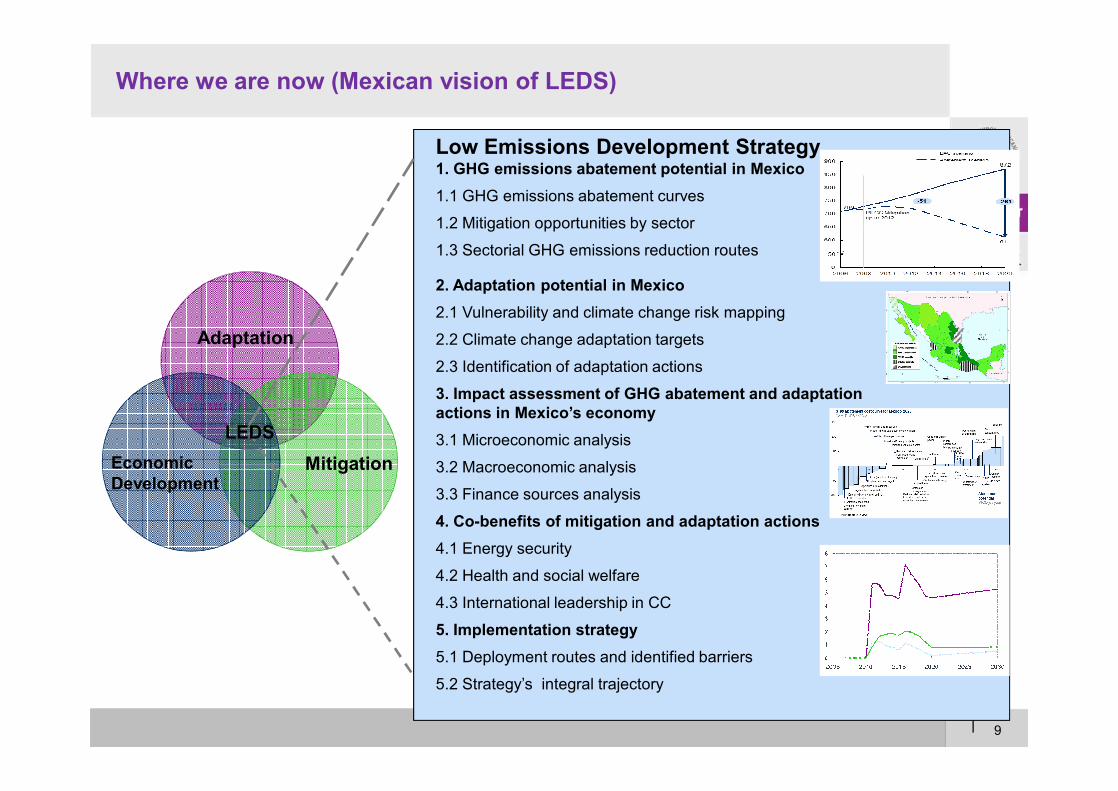
Low Emissions Development Strategy1. GHG emissions abatement potential in Mexico1.1 GHG emissions abatement curves
1.2 Mitigation opportunities by sector
1.3 Sectorial GHG emissions reduction routes
2. Adaptation potential in Mexico2.1 Vulnerability and climate change risk mapping
2.2 Climate change adaptation targets
2.3 Identification of adaptation actions
3. Impact assessment of GHG abatement and adaptation actions in Mexico’s economy3.1 Microeconomic analysis
3.2 Macroeconomic analysis
3.3 Finance sources analysis
4. Co-benefits of mitigation and adaptation actions 4.1 Energy security
4.2 Health and social welfare
4.3 International leadership in CC
5. Implementation strategy5.1 Deployment routes and identified barriers
5.2 Strategy’s integral trajectory
Adaptation
Economic Development
Mitigation
Where we are now (Mexican vision of LEDS)
LEDS
9

|
0
100
200
300
400
500
600
700
800
900
1,000
PowerGeneration
Transport
Industry
Buildings
Waste
Agriculture
Forestry
Petroleum& Gas
2030
995
2020
872
2012
772
2006
709
Projected baselineMt CO2e
SOURCE: 20090701 Emisiones línea base PECC energía.xls; CONAPO; Team Analysis
Mexico’s emissions are expected to grow from 709 to 872 MtCO2e between 2006 and 2020

| 11
2006 2008 2010 2012 2014 2016 2018 2020
900
850
800
750
700
650
600
50
0
611
872
709-261
Our LEDS identifies a potential to reduce 261 MtCO2by 2020, with respect to the BAU baseline scenario
Abatement scenario
BAU scenario
Theoretical mitigation potentialMtCO2e / year
Sector Abatement potential by 2020
1 Includes the abatement potentials of energy efficiency levers in the residential and the commercial sectors, as well as the mitigation levers of the industry sector
19
26
37
42
60
78
Total 261
Oil & gas
Waste
Transport
Residential, commercial & industry1
Energygeneration
Forestry & agriculture
| 12
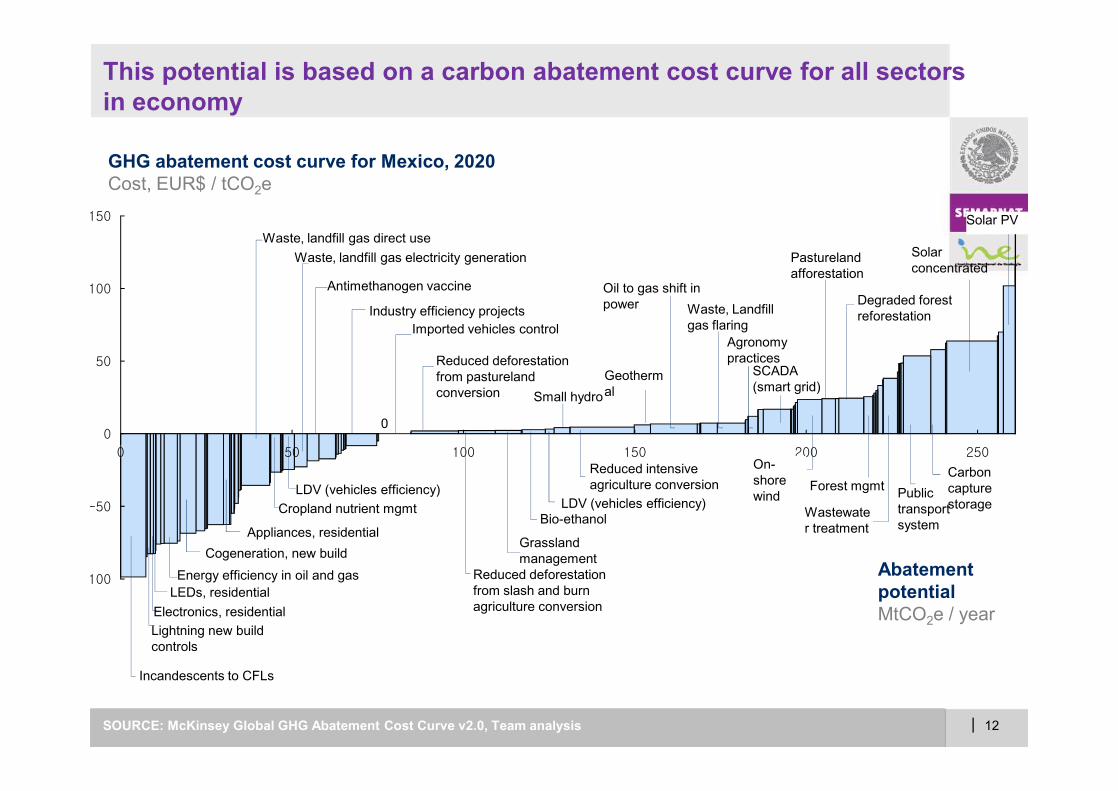
0
0 100 150 200 25050
0
100
150
50
-100
-50
This potential is based on a carbon abatement cost curve for all sectors in economy
LEDs, residential
Lightning new build controls
Electronics, residential
Waste, landfill gas direct use
Cropland nutrient mgmtLDV (vehicles efficiency)
Waste, landfill gas electricity generation
Antimethanogen vaccine
Small hydro
Reduced deforestation from slash and burn agriculture conversion
Grassland management
Oil to gas shift in power
SCADA (smart grid)
Pastureland afforestation
Degraded forest reforestation
Solar concentrated
Solar PV
Energy efficiency in oil and gas
Waste, Landfill gas flaring
Agronomy practices
Forest mgmt
Geothermal
Reduced intensive agriculture conversion
Bio-ethanol Wastewater treatment
Public transport system
On-shore wind
Appliances, residential
Incandescents to CFLs
Imported vehicles control
Cogeneration, new build
Industry efficiency projects
Reduced deforestation from pastureland conversion
LDV (vehicles efficiency)
GHG abatement cost curve for Mexico, 2020Cost, EUR$ / tCO2e
SOURCE: McKinsey Global GHG Abatement Cost Curve v2.0, Team analysis
Abatement potentialMtCO2e / year
Carbon capture storage
| 13
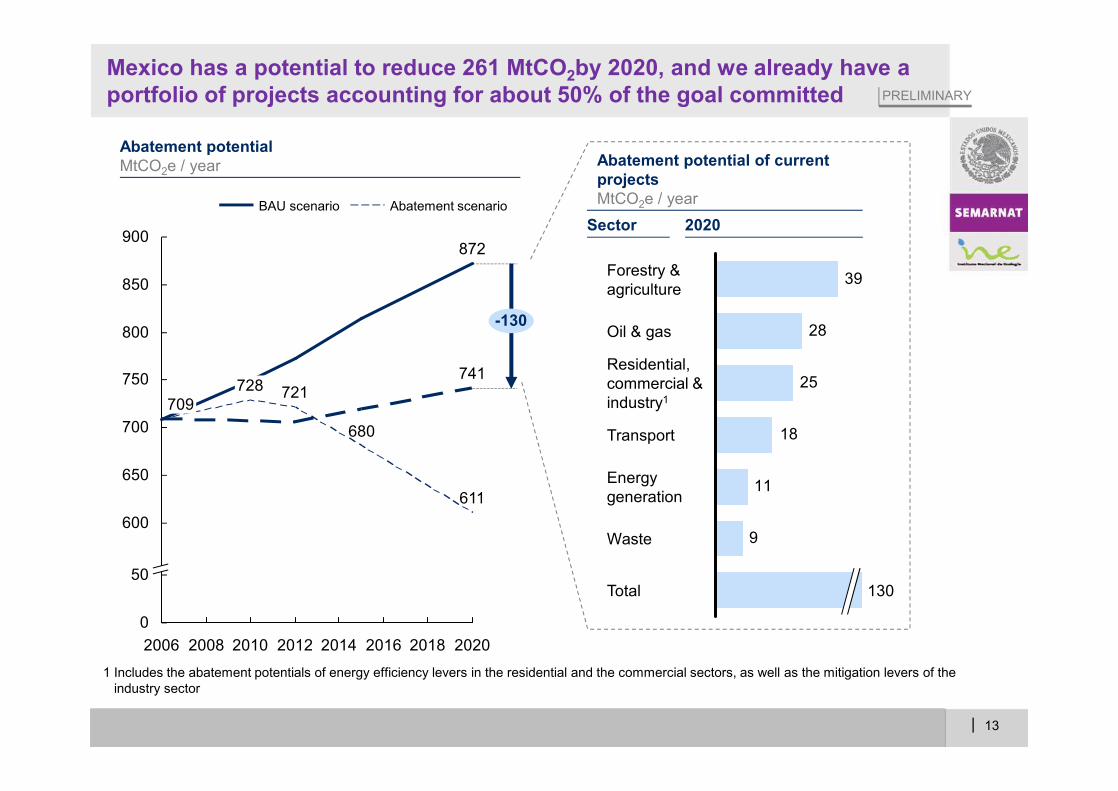
2006 2008 2010 2012 2014 2016 2018 2020
741
872
680
50
0
900
850
800
750
700
650
600
709728 721
611
709
-130
BAU scenario Abatement scenario
Abatement potentialMtCO2e / year
Sector 2020
Abatement potential of current projectsMtCO2e / year
9
11
18
25
28
39Forestry & agriculture
Total 130
Waste
Energygeneration
Transport
Residential,commercial &industry1
Oil & gas
Mexico has a potential to reduce 261 MtCO2by 2020, and we already have a portfolio of projects accounting for about 50% of the goal committed
1 Includes the abatement potentials of energy efficiency levers in the residential and the commercial sectors, as well as the mitigation levers of the industry sector
PRELIMINARY

| 14
31,053
76,545
6,570
8,170
Investment by local governments
11,948
Investment by the private sector
18,674
3,3505,378
TotalInvestment
6,700
26,844
Incremental cost of efficient technologies transferred to
final consumer1
3,350
Investment by federal government
Pending of budgetBudgeted
2013-2020
12,132
2010-20126,541
Investment horizon
1 Upfront cost can be alleviated by federal social programs. These projects are profitable if final energy savings are taken into account.
USD Millions
Investment needed adds to around USD 76.5 Billions for which Mexico will need support from international community
Main projects ▪ Energy efficiency standards for general lighting and light vehicles
▪ Forestry Programs
▪ Operational Efficiency in Pemex and CFE
▪ Government programs
▪ Electricity co-generación in lprivate industry
▪ Wind Power generation
▪ BRT systems and infraestructure optimization
▪ Waste management
PRELIMINARY

|
At the same time, emissions reduction could drive a low-carbon investment boom that increases GDP and creates jobs
0
1
2
3
4
5
6
7
8
2005 2010 2015 2020 2025 2030
GDPJobs
Investment
Low carbon case difference from reference case,percent
Source: Cambridge Econometrics E3MG model; Low Carbon Growth Plan, A Potential Path for Mexico, Centro Mario Molina, McKinsey
▪ Investment in low carbon technology and infrastructure could stimulate the rest of the economy
▪ This can increase economic growth by up to 1 percent (thereby spurring even more investment across the non-carbon economy)
▪ While some jobs would be lost e.g., in oil and gas sector, the net impact is estimated as an addition of half a million jobs by 2030

|
Mexico will need to determine how to allocate efforts and resources to most vulnerable areas to increase resilience and mitigate the expected climate change effects
▪ Estimate of potential loss– Hazard: Develop
frequency and severity scenarios for most relevant hazards
– Value: Quantify what is at risk in terms of population, assets and income value in area at risk
– Estimate potential loss for relevant hazard-sector-region intersections
▪ Set of adaptation measures– Identify potential
adaptation measures
– Determine basic feasibility of potential measures through interviews with country experts
– Determine societal costs and benefits (in terms of decreased expected loss) of implementing measures
▪ List of funding options– Agree on
potential funding sources
– Refine these sources based on affinity to measures and country capabilities
– Develop a solicitation strategy
▪ Map of areas at risk– Identify most
relevant hazard(s) in case country
– Identify areas that are most at-risk, by overlaying hazard(s) on:▫ Population
(including vulnerable population)
▫ Economic value (Assets, GDP)
Where and from what is the
country most at
risk?
What is the magnitude
of the expected
loss?
What measures should be
considered?
How can those measures
be funded?
Input into adaptation
strategy
SOURCE: McKinsey Climate Change Special Initiative; Economics of Climate Adaptation
| 17
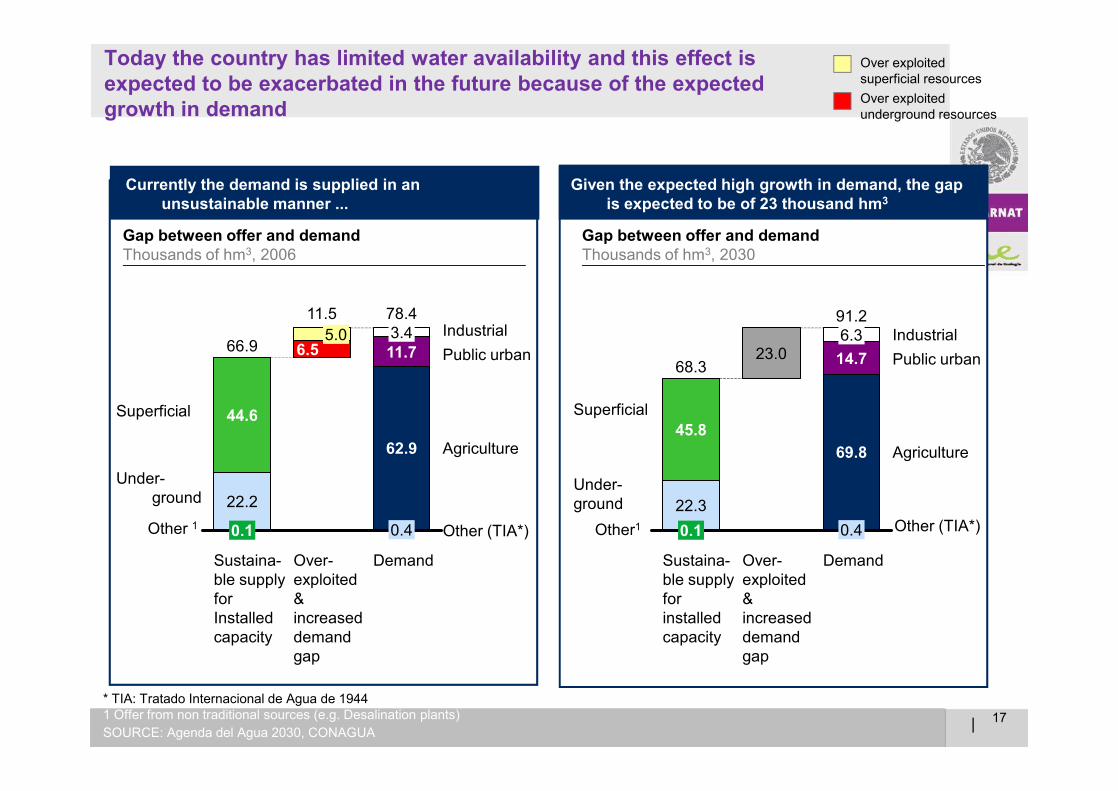
Today the country has limited water availability and this effect is expected to be exacerbated in the future because of the expected growth in demand
SOURCE: Agenda del Agua 2030, CONAGUA
Industrial
Demand
91.2
0.4
69.8
23.0 14.7
Sustaina-ble supplyfor installedcapacity
6.3
68.3
Over-exploited & increased demand gap
0.1
Agriculture
Public urban
22.3
45.8Superficial Superficial
Under-ground
Other (TIA*) Other (TIA*)Other 1
Under-ground
Over exploitedunderground resources
Other1
Gap between offer and demandThousands of hm3, 2030
Currently the demand is supplied in an unsustainable manner ...
Given the expected high growth in demand, the gap is expected to be of 23 thousand hm3
Gap between offer and demandThousands of hm3, 2006
Agriculture
Public urbanIndustrial
Demand
78.4
0.4
62.9
11.73.4
Over-exploited & increased demand gap
66.9
0.1
11.5
6.5
22.2
44.6
5.0
Sustaina-ble supplyforInstalledcapacity
Over exploitedsuperficial resources
* TIA: Tratado Internacional de Agua de 19441 Offer from non traditional sources (e.g. Desalination plants)

|
▪ Construction of dams, wells, canals, desalination plants and reuse of treated water
Increase the automation and irrigation efficiency in agriculture
Increase the automation and irrigation efficiency in agriculture
Measures to achieve ~60% of the solution are agricultural sector focused initiatives
SOURCE: ; Team analysis
1
Continue to build infrastructure to supply growth areas
Continue to build infrastructure to supply growth areas
Increase the use of water efficient technologies in industry
Increase the use of water efficient technologies in industry
Promote municipal efficiency leak repair pro-grams and use of more efficient technologies
Promote municipal efficiency leak repair pro-grams and use of more efficient technologies
2
0.2
1.8
-4.4
Marginal cost ($/m3)
-3.4
SOURCE: Agenda del Agua 2030, Conagua
4
3
61%
% of the solution 1
19%
4%
16%
100%
29%
% invest-ment
24%
6%
41%
100%1 Solution defined as covered 2030 gap out of the ~21,500 hm3
▪ Implement pressurized irrigation (sprinkler and localized), real-time irrigation and tillage optimal in ~ 2 million hectares
Action
▪ Use of faucets and toilets with less use of water and repair leaks in urban areas
▪ Use water saving technologies, dry cooling, dry rinsing and dry lubrication conveyor systems
The measures can reduce a total of ~21,500 hm3
from expected gap
Total investments account for ~24
billion USD

|
Achieving our short term aims
Minister of Environment and the Office of the President
Ministry of Energy
Ministry of Economy
Ministry of Foreign Affairs
Ministry of Treasury
Ministry of Social
DevelopmentMinistry of
Health
Ministry of Agriculture
Ministry of State
19
Cross-sectorialeffort
COP 17 Durban
Rio + 20G 20 MexicanPresidency
Updated projectportfolioidentified
Macroeconomicimplications
Inclusion of social co-benetifs
Job creationsStrategy completed
Sharing with theinternationalcommuntiy
Implementation of the strategy
Mexican contribution
to international fora
|
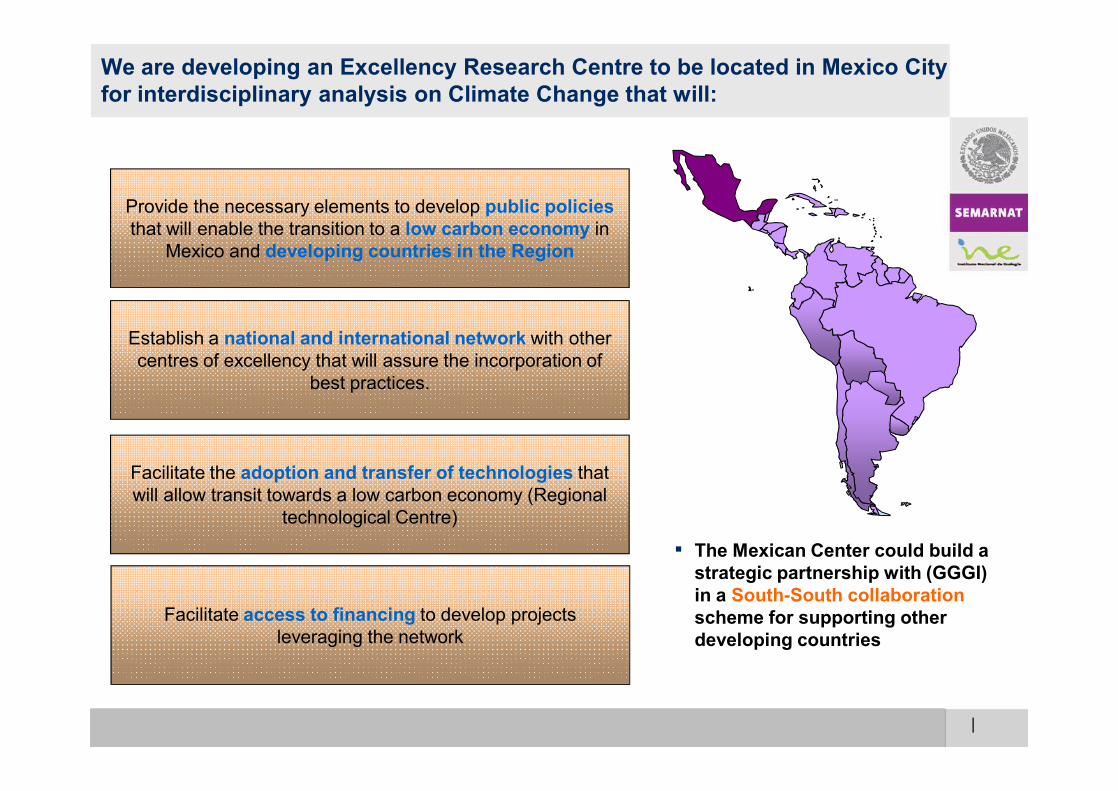
We are developing an Excellency Research Centre to be located in Mexico City for interdisciplinary analysis on Climate Change that will:
Provide the necessary elements to develop public policiesthat will enable the transition to a low carbon economy in
Mexico and developing countries in the Region
Establish a national and international network with other centres of excellency that will assure the incorporation of
best practices.
Facilitate the adoption and transfer of technologies that will allow transit towards a low carbon economy (Regional
technological Centre)
Facilitate access to financing to develop projects leveraging the network
▪ The Mexican Center could build a strategic partnership with (GGGI) in a South-South collaborationscheme for supporting other developing countries
|
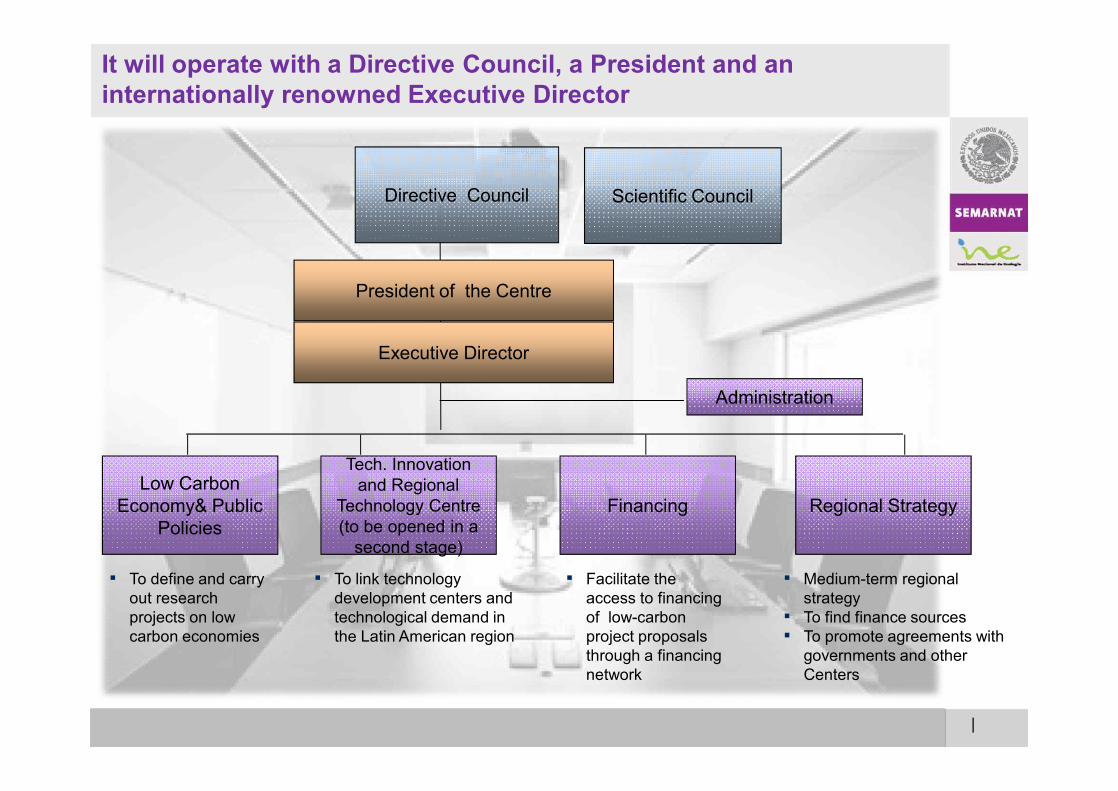
Low Carbon Economy& Public
Policies
Scientific Council
Regional StrategyFinancing
President of the Centre
Executive Director
▪ To link technology development centers and technological demand in the Latin American region
▪ To define and carry out research projects on low carbon economies
▪ Medium-term regional strategy
▪ To find finance sources ▪ To promote agreements with
governments and other Centers
▪ Facilitate the access to financing of low-carbon project proposals through a financing network
Tech. Innovation and Regional
Technology Centre(to be opened in a
second stage)
It will operate with a Directive Council, a President and an internationally renowned Executive Director
Directive Council
Administration
|
Thank You
Dr. Francisco Barnes RegueiroPresidentNational Institute of Ecology
Please visit our web page:http://www.ine.gob.mx/
Climate Change Portal:http://cambio_climatico.ine.gob.mx/

|
7. Territorial Planning
6. Sustainableuse ofland,
water andforests
3. Sustainableuse of energy
2. Preservation of biodiversity
1. ClimateChange
mitigationand
adaptation
4. Air PollutionPrevention
5. Wastemanagement
Mexico is pursing a Green Growth Strategy along seven dimensions
Source: Towards Green Growth, OECD; Green Economy UNEP; Internal analysis
Pricing Mechanisms/ Taxation
Focalization of subsidies
Regulatory Standards
Infrastructure Investment Programs
Innovation Policies and Finance and Technology Transfer
Institutional and Governance Capacity
WHAT WILL WEACCOMPLISH?
HOW DO WE DO IT?
WHERE DOWE FOCUS?
Achieve economic growth
Generate employment and alleviate poverty
Preserve our natural capital
Reduce Vulnerability
Contribute to our common but differfentiated responsabilities
Ensure security of supply of food, energy and water
Focus of document