mexico: human capital effects on wages …siteresources.worldbank.org/intlacregtopeducation/... ·...
TRANSCRIPT

MEXICO: HUMAN CAPITAL EFFECTS ON WAGES AND PRODUCTIVITY#
Gladys López-Acevedo (Sr. Economist, LCSPP)
Monica Tinajero (Consultant)
Marcela Rubio (ETC, LCSPP)
JEL Codes: J31, J71, J81
World Bank Policy Research Working Paper 3791, December 2005 The Policy Research Working Paper Series disseminates the findings of work in progress to encourage the exchange of ideas about development issues. An objective of the series is to get the findings out quickly, even if the presentations are less than fully polished. The papers carry the names of the authors and should be cited accordingly. The findings, interpretations, and conclusions expressed in this paper are entirely those of the authors. They do not necessarily represent the view of the World Bank, its Executive Directors, or the countries they represent. Policy Research Working Papers are available online at http://econ.worldbank.org.
# We wish to thank Eli Berman, Hong Tan, William Maloney, and Jesse Sandoval for their valuable comments and help. Also, we thank Abigail Duran, Alejandro Cano (INEGI – Aguascalientes) for valuable help in processing the information.
WPS3791

Abstract
We follow the Hellerstein, Neumark, and Troske (1999) framework, to estimate marginal productivity differentials and compare them to estimated relative wages, in order to provide evidence on productivity and non-productivity-based determinations of wages. Special emphasis is given in this paper to the effects of human capital variables, such as education, experience, and training, on wages and productivity differentials. Higher education yields higher productivity; however, highly educated workers earn less than their productivity differentials would predict. On average, highly educated workers are unable to fully appropriate their productivity gains of education through wages. On the other hand, workers with more experience are more productive in the same proportion that they earn more in medium and large firms, meaning they are fully compensated for their higher productivity. Finally, workers in micro and small firms are paid more than what their productivity would merit. Training benefits firms and employees since it significantly increases workers’ productivity and their earnings.

1
MEXICO: HUMAN CAPITAL EFFECTS ON WAGES AND PRODUCTIVITY
I. INTRODUCTION
Human capital is a stock of skills produced by education, experience and training
(Welch, 1970; Mincer, 1989). The empirical evidence on the links between human
capital, on the one hand, and productivity and/or wage growth on the other, is strong.
Human capital is viewed not only as an investment, but also as a factor of
production. Numerous studies using worker and firm level data have shown that more
educated and/or trained individuals are more productive. In a work environment that is
rapidly changing due to technological advances, the cognitive abilities for workers to
process new information become increasingly important and thus command higher
wages, and in turn higher incomes (Welch, 1970; Mincer, 1989; Tan and López-Acevedo,
2002; Hellerstein and Neumark, 2004). Moreover, highly educated workers have a
comparative advantage with respect to the adjustment and implementation of new
technologies, by being able to adopt them more easily or faster than non-educated
workers. For this reason, the productivity of highly educated workers, relative to less-
educated workers, is greater (Bartel and Lichtenberg, 1987, Tan and López-Acevedo,
2002; Hellerstein and Neumark, 2004).
Similarly, there is limited, but growing, empirical literature on the link between
human capital and a firms’ performance (Koning, 1994; Ravenga, 1995; Batra and Tan,
1995; Barrett and O’Connell, 1998; World Bank, 1998a, 1998b, 1999, 2000, 2001a,
2001b; Dearden, Reed, and Van Reenen, 2000). Using panel data, several studies have
demonstrated the positive impact of education and training on productivity (Nielsen and
Rosholm, 2002; Batra and Tan, 1995; Dearden, Reed, and Van Reenen, 2000).
In addition, extensive literature has been compiled in the closely related field of
human capital and its effects on workers’ wages. A near-consensus suggests that earnings
increase with more training (Middleton et al., 1993; Dar et al., 2000; Nielsen and
Rosholm, 2001).

2
The problem with the traditional approach of estimating wage regressions to test
theories of wage determination is that, without independent measures of worker
productivity, it is difficult to determine whether wage differentials associated with
workers’ characteristics reflect productivity differential or some other factors. For
example, typical wage regressions report positive coefficients on age (conditional on a
variety of controls). These positive coefficients neither imply that older workers are more
productive than younger ones, nor that wages rise faster than productivity. Similarly,
without direct measures of the relative productivity of workers, factors associated to
wage differentials cannot be established.
Verner (1999) analyzes the determinants of wages and productivity in Zimbabwe,
using a matched employee-employer manufacturing sector data, the Regional Program on
Enterprise Development (RPED) survey data from 1993. The number of firms and
employees interviewed are 201 and 1609, respectively. In each firm, about 10 randomly
selected workers from different occupational categories are interviewed to obtain the
worker level data. Here workers are the unit of observation and firms are included in the
individual vector of variables. The main conclusions from this study were that formal
education, training, and experience impact wages and productivity positively, and that
females were being paid less than male employees, despite that females are not
measurably less productive. This analysis is innovative; nonetheless, this model uses
firm-level productivity as a measure of the individual productivity, while the worker
characteristics variables and the endogenous wage variable are at the individual level –
regardless of the differences in education and training, all workers in the firm are
assigned the same productivity measure. The problem is that the effect of worker
characteristics on productivity will not be properly identified when there is no variation
in the workers’ productivity within a firm but differences in workers’ characteristics
exist.1
Hellerstein, Neumark, and Troske (1999) use a unique plant-level dataset in the
United States, the Worker Establishment Characteristics Database (WECD), which
matches long-form respondents to the 1990 Decennial Census of Population to data on
1 Verner (2000) uses the same methodology to analyze wages and productivity gaps in Ghana.

3
their employers from the Longitudinal Research Database (LRD). Since they have plant-
level information on costs, they can estimate plant-level earnings equations, which
represent the aggregation of individual-level wage equations over workers employed in a
plant. It is worth pointing out that Hellerstein, Neumark, and Troske (1999) estimate the
wage regression at the worker and firm levels to test the robustness of the firm-level
estimations and do not find significant differences. They proposed an innovative model
discussed in Section IV to estimate firm level equations since productivity is available at
the firm level only. The model, based on traditional economic theory, includes an
extended Cobb-Douglas production function and a standard wage determination model.
By simultaneously estimating production functions and wage equations at the plant level,
they compare relative marginal products to relative wages of different types of workers,
leading to new evidence on productivity-based and nonproductivity-based explanations
of the determination of wages. This represents an improvement over Verner (1999) since
it allows for variation in human capital characteristics to have a differentiated impact in
worker productivity. They find that the higher wages of medium-aged and older workers
is justified by their higher relative productivity. On the other hand, even though women
earn lower wages, they are not significantly less productive, indicating the existence of
discrimination.2
This paper follows Hellerstein, Neumark and Troske’s (1999) approach to the
study of wage regressions by linking them to productivity functions. This paper uses a
unique Mexican data set that combines data on manufacturing firms and their workers to
estimate relative marginal products and compare them with relative wages. The paper is
organized as follows: section II introduces the data, section III presents the variables used
in this work along with some descriptive statistics, section IV presents the framework and
explains the methodology, section V analyzes the results, in general, by firm size and
examines training by gender, and section VI offers conclusions.
2 Hellerstein and Neumark (1999) use the same methodology to test for gender discrimination in Israel. Hellerstein and Neumark (2004) use the 1990 Decennial Employer-Employee Dataset (DEED), a more recently constructed matched employer/employee data set for the United States that contains detailed demographic information on workers (most notably, information on education). Using the same methodology, they use the new to update and expand on previous findings.

4
II. DATA
This paper uses the latest National Survey of Employment, Wages, Technology
and Training (ENESTYC), fielded in 2001. The ENESTYC is a periodic establishment
survey fielded by INEGI (Instituto Nacional de Estadística Geografía e Informática) on
behalf of the Ministry of Labor and Social Welfare. The ENESTYC’s universe is the
manufacturing establishments numbered in the Economic Census updated with the EIM –
Encuesta Industrial Mensual – and with information from the petrochemical industries.
The sampling design is random and stratified for each of the 54 activity branches of the
Clasificación Mexicana de Actividades y Productos (CMAP) 1994 and by firm size. The
sample size for 2001 was 8,179 firms, which represents 333,647 firms. As its name
suggests, ENESTYC contains detailed information about the firm – production, output
and input cost, capital assets, size, location, division of activity, ownership, technology3,
quality control methods and ISO 9000 certification, and research and development – and
attributes of the workforce – gender, wage and non-wage compensation by occupation
and gender, and training, both in-house training and external formal training.
In both 1993 and 1999, INEGI selected a sub-sample of the establishments
interviewed in the ENESTYC. From each of those firms, a randomly selected sample of
10 workers from different occupational categories was interviewed to elicit the National
Survey of Employment to Workers in the Manufacturing Sector (ENTRAM). This is a
worker level dataset which includes information on basic data of the worker, educational
level, job conditions, remunerations, training, and work history. Though the linked
ENESTYC-ENTRAM yields an employee-employer dataset with very rich information at
the worker level, it was not suitable for our analysis because the methodology in Section
IV requires data for the entire workforce and the ENESTYC-ENTRAM only has only a
small sample of workers by firm, especially for the larger firms, which would produce an
incomplete characterization of the firms’ workforce. The excellent quality of the
ENESTYC and the detail of the information elicited allow us to estimate plant-level
3 Such as use of different types of technology (manual equipment to robots) and ICT, including workplace practices.

5
production function and earning equations as in Hellerstein, Neumark, and Troske
(1999).
The information on individual establishments that INEGI gathers through its
questionnaires (which firms are required to answer by law) is legally confidential.
Therefore, we followed an established procedure in which most data analysis was done at
INEGI’s Aguascalientes headquarters with the support of INEGI personnel. Nevertheless,
the reader should bear in mind the limitations for data analysis imposed by this
institutional arrangement.
III. WORKERS’ AND FIRMS’ CHARACTERISTICS
The observation unit in ENESTYC is the firm, and includes detailed information
on the characteristics of its workforce. The workers’ characteristics included human
capital characteristics: education, experience, and training; and gender, whether the
employee belongs to a union and the type of contract. We used the firm-level data, the
shares of the workforce with these attributes.
The training analysis focuses on formal training only, which is the training
provided by ‘training professionals.’ Formal in-house training courses are given by
specialized firm personnel (not peers), while external training describes formal training
courses given by professional external agents, which is mostly provided by private
institutions.
The distribution of workers’ characteristics is tabulated, with sampling weights, in
Table 1. We find the percentage of women employees is significantly less than men, with
men representing nearly 73 percent of the workforce. With respect to educational
attainment, 71 percent of the employees had no more than lower secondary education,
while 19 percent of them received upper secondary education and the remaining 10
percent of employees received university-level education. The majority of workers in
these firms (48 percent) had less than three years of experience in the firm, while only 15
percent had worked more than ten years in that firm.

6
TABLE 1. DISTRIBUTION OF WORKERS’ CHARACTERISTICS Gender Training
Women 27.2% None 41.1% Men 72.8% In-house training 39.8%
Education External formal training 19.1% Lower secondary or less 71.2% Belonging to a union Upper secondary 18.6% No 57.8% University or more 10.2% Yes 42.2%
Experience in the firm Type of Contract Three years or less 47.6% Temporary 10.7% From 3 to 10 years 37.5% Permanent 89.3% More than 10 years 14.9%
Source: Calculations based on ENESTYC 2001.
According to the survey, we estimate that the majority of employees receive some
form of training, though most was internal. The share of employees receiving formal in-
house-sponsored training was 40 percent, while the number not receiving any training
was roughly the same at 41 percent, with only one-fifth of employees receiving external
formal training. The differences in education and training (both in-house and external)
are very small between women and men in Mexico. In-house training was 40 percent for
men and 36 percent for women, while external training was 20 and 16 percent,
respectively.
Less than half of these employees, 42 percent, were unionized. Also, 89 percent
were employed via permanent forms of contracts.
The characteristics of a firm used in this analysis are size, division of activity,
region, whether the foreign capital of the firm exceeds one-half, if the firm exports over
50 percent of its output, investment in research and development (R&D), quality control
certification, and technology adoption.

7
TABLE 2. DISTRIBUTION OF FIRMS’ CHARACTERISTICS Size Region
Micro (less than 16 employees) 90.2% North 19.3% Small (16-100 employees) 7.8% Center 49.2% Medium (100-250 employees) 1.2% South 21.0% Large (more than 250 employees) 0.7% Mexico City 10.6%
Division of activity Firm's exports are more than 50% of output Food, beverages, and tobacco 35.6% No 99.1% Textiles, clothing and leather 14.3% Yes 0.9% Wood and wood products 12.9% The firm invests in research & development Paper, paper products, printing, and publishing 6.8% No 92.8% Chemicals, oil derivatives, and coal 3.2% Yes 7.2% Non-metallic mineral products 8.1% The firm has quality control certifications Basic metallic industries 0.1% No 96.8% Metallic products, machinery, and equipment. 17.3% Yes 3.3% Other manufacturing industries 1.8% The firm adopted new technology since 1999
Foreign capital is over 50% No 61.6% No 99.5% Yes 38.4% Yes 0.5%
Source: Calculations based on ENESTYC 2001. With respect to firm size, 90 percent are micro in size, 8 percent are considered
small, 1 percent medium, and almost 1 percent large, which is consistent with economic
census data. Of these, the majority of manufacturing firms seem to be most concentrated
in Central Mexico, accounting for 49 percent of the total, with the remainder evenly
distributed between the Northern and Southern regions, and Mexico City. According to
the division of activity, food, beverages and tobacco account for the largest share of firms
with 36 percent; metallic products, machinery and equipment come second with 17
percent. Basic metallic industry ranks last, with only 0.1 percent. With respect to foreign
openness, the percentage of firms with more than 50 percent foreign capital is only 0.5
percent and only 1 percent of firms export at least half of their output. The share of firms
that invest in research and development (R&D) is 7 percent, whereas the percentage of
firms that adopted new technologies is 38 percent. Only 3 percent of the firms have some
quality control certification.
IV. FRAMEWORK AND METHODOLOGY
We follow Hellerstein, Neumark, and Troske’s (1999) model to compare the
relative marginal products and relative wages of workers. Consider a simple economy

8
with firms that produce output with only two types of workers, A and B, which are
perfect substitutes. Let φ be the marginal product of type A relative to type B and λ be
the relative wage. If λφ = , firms in this economy will be indifferent among any
combination of type A and type B under a profit-maximizing or cost-minimizing
behavior.4 However, if the inequality does not hold, firms will hire only one kind of
labor. Then, the only equilibrium in this economy is when the marginal product equals
the relative wage.
Whenever wage and productivity differentials are not equal then there is a
deviation from the competitive spot labor markets assumption. It can be the case that
long-term contracts justify a lower relative wage in exchange for job security, or that
firms and workers do not share evenly the benefit from some productivity-enhancing trait
– such as better training – because of unequal bargaining power.
We use simultaneous non-linear production functions and earnings equations at
the plant level to obtain estimates of parameters φ (marginal productivity of one type of
worker relative to the base case) and λ (relative wage of one type of worker to the base
case) using maximum likelihood methods. The equations that make up the system are the
following5:
μβγα φ +Χ⋅+++= )()ln()ln()ln( gQLKaY (1)
ελ ++= )ln(')ln( QLaw (2)
where:
Y value added productivity in the firm
w wages paid to all workers in the firm6
K capital (fixed assets) 4 Whenever 1≠φ , we say that the types of labor are distinguished by a different quality of labor. 5 The production function is an extended Cobb-Douglas function. The wage equation is a definitional equation, not a behavioral equation. Suppose two types of labor, A and B. Then, if we define wages in a firm as the weighted average of each type of labor’s wages:
[ ]ABABABBBAA LLwLLwLwLwLww )1()( −+=−+=+= λλ . In logs and aggregating over all firms, this would yield equation (2) with the quality of labor aggregate as defined in (3) below. 6 In the survey, all monetary figures are in nominal terms, corresponding to December 2000, except for the wages which are presented in June 2000 prices. Therefore, to express the wages in December 2000 prices as well we used wage price indices produced by Banco de México.

9
iQL quality of employment aggregates (see below for detailed explanation)
Χ vector of variables associated to the firm (size, region, manufacturing sub-
sector, proxies for openness of the firm, technology adoption, quality
control, and R&D)
For each firm, the measure of productivity used was value added productivity,
which was calculated as the value of production minus the cost of materials. The wage
variable is calculated as the sum of all wages, salaries, and compensations paid by the
firm to its workforce.
The quality of labor aggregate takes into account the productivity of different
types of labor. Take the simple economy set up above. Quality of employment is defined
for the production function by:
( ) ⎥⎦⎤
⎢⎣⎡ −+=+=
LLLLLQL A
BA 11 φφφ (3)
where:
L total workers in the firm
AL type A workers in the firm
BL type B in the firm7
φ is the marginal productivity of type A workers relative to type B
By substituting (3) into (1), we obtain a non-linear production function from
which we can estimate φ , using firm-level data on value added, capital, and the number
of workers and type decomposition of the workforce. Similarly, the quality of labor is
introduced into the wage equation:
( ) ⎥⎦⎤
⎢⎣⎡ −+=+=
LLLLLQL A
BA 11 λλλ (4)
However, we want to test these relationships for more than two types of labor.
The types of labor are characterized by different categories in the following
characteristics:
7 BL , the number of type B workers in the firm is the reference group.

10
(i) gender: women or men
(ii) education: complete lower-secondary or less; upper-secondary; or tertiary
education
(iii) experience: less than three years working in the firm; three to ten years; or
more than ten years
(iv) training: none; in-house; or external formal training
(v) belonging to a union: no or yes
(vi) type of contract: temporary or permanent
The rationale for the choice of the above variables has been well documented in
several studies since they have an impact in either wages or productivity of the workers.
Gender might reveal information on a possible gender wage gap (Katz and Correia,
2001). Human capital is important to enhance productivity and long-term economic
growth (Dearden, Reed, and Van Reenen, 2004). A more educated work force increases
worker productivity and facilitates the adoption and use of new technologies. Higher
skilled workers can more easily adjust to changes in the economy than less skilled
workers. Institutions such as union membership might be important in determining wages
(Maloney and Pontual, 1999). Long-run employment relationships might be beneficial for
both employers and employees, helping to build and retain firm-specific skills (Verner,
2000), which implies that permanent contracts might affect productivity. Also, we have
controlled for other worker and firm characteristics, such as size, region, sector of
activity, R&D, export orientation, technology adoption, firm ownership, and quality
control.
Thus, the composition of the workforce would be characterized by the share of
workers in each of the 216 possible combinations or types of labor. Consideration of
many variables poses a critical challenge in terms of the data since the characterization of
the workforce encompasses 216 categories. From ENESTYC we cannot obtain the
number of workers in every narrowly defined subgroup (i.e. number of women with
lower secondary or less, less than three years of experience, with no training, not
belonging to a union and with a temporary contract; etc.). To reduce the dimensionality
of the problem, we make two assumptions as Hellerstein, Neumark, and Troske did:

11
• The relative marginal products of two types of workers within one demographic
group are equal to the relative marginal products of those same two types of
workers within another demographic group.
• The proportion of workers in an establishment defined by a demographic group is
constant across all other groups.
Then, the quality of labor term for both equations would be:
( ) ( ) ( ) ( ) ⎥⎦⎤
⎢⎣⎡ −+××⎥⎦
⎤⎢⎣⎡ −+−+×⎥⎦
⎤⎢⎣⎡ −+=
LP
LE
LE
LGLQL PEEG
2322 11111112322
φφφφφ K (5)
( ) ( ) ( ) ( ) ⎥⎦⎤
⎢⎣⎡ −+××⎥⎦
⎤⎢⎣⎡ −+−+×⎥⎦
⎤⎢⎣⎡ −+=
LP
LE
LE
LGLQL PEEG
2322 11111112322
λλλλλ K (6)
where:
L total workers in the firm
2G number of male workers
2E number of workers with upper-secondary
3E number of workers with tertiary education
M
2P number of permanent workers in the firms
iφ is the marginal productivity of the ith group relative to the base case8
iλ is the relative wage of the ith group relative to the base case
Notice that the setup of the equation system implies that productivity and wage
differentials between groups are indicated when the estimate of the relevant ϕ or λ is
significantly different from one (rather than zero). The advantage of estimating wages
and productivity simultaneously is that we can test the hypothesis of equality of
productivity and wage differentials. Whenever λφ = , there is a deviation from the
competitive spot labor markets assumption.
8 The reference group for the worker characteristics includes women, with lower secondary or less, until three years working experience in the firm, does not belong to a union, without training, and temporary worker.
12
It should be noted that the identification of productivity differentials associated
with characteristics comes from covariation across firms.9 If we find evidence suggesting
that, for example, women are less productive than men, the firm-level data does not
enable us to determine whether the estimated lower productivity of women comes from
the segregation of women into low-productivity firms, or from the lower productivity of
women relative to men within firms. This should be considered when interpreting the
results.
V. RESULTS
The production function (1) and the wage equation (2) were estimated jointly,
with the quality of labor aggregate as defined by (5) and (6) respectively, for all firms in
ENESTYC 2001. Table 3 below shows the estimates for the marginal productivity
differentials and relative wages, φ and λ , respectively for the characteristics which
affect employee performance and/or wage negotiations: (i) gender, (ii) schooling, (iii)
experience, and (iv) training.10 The full results of the estimation are shown in Table A.1.
The last column presents an asterisk if we reject the null hypothesis of equality between
the productivity and wage differentials.
9 This means that all workers within a firm are associated to the same productivity level. Therefore, the estimated productivity differential is related to productivity differences between firms, not within. 10 As explained in the previous section, we include many other worker and firm characteristics for a complete identification of the model. However, the object of this paper is only gender, schooling, experience, and training. The analysis of the effect of other characteristics is the scope of another study.

13
TABLE 3. MARGINAL PRODUCTIVITY DIFFERENTIALS AND RELATIVE WAGES Productivity Relative Reject Variable Differential Wage iioH λφ =:
Ho: coefficient=1 2.05 * 1.52 * * Men (0.13) (0.04) 1.84 * 1.44 * * Upper secondary (0.13) (0.04) 3.82 * 2.37 * * University or more (0.28) (0.07) 1.12 * 1.19 * (3 - 10] years in the firm (0.05) (0.03) 0.76 * 0.97 * (10 - +) years in the firm (0.04) (0.02) 1.25 * 1.16 * In-house training (0.06) (0.03) 1.49 * 1.24 * * External formal training (0.08) (0.04)
Adjusted R2 0.90 0.96 Observations 6,866
Notes: Calculations based on ENESTYC 2001. Standard errors are shown in parenthesis. * denotes significance at 5 percent level. The Wald statistic was used to test the equality of the estimated wage and productivity differential. Reference group: women, lower secondary or less, until three years of experience in the firm, and without any form of training.
With respect to gender, the results show that men are significantly more
productive – 105 percent – than women. Likewise, their wages are 52 percent higher, but
not as high as their productivity (we reject the equality of both differentials). This implies
that even though men are better paid relative to women because they are more
productive, their salary increase does not fully compensate for their higher productivity.
In the case of education, the results show that workers with upper secondary
education are 84 percent more productive with respect to the base case (the base case
being workers with lower secondary or less) and workers with higher education are 282
percent more productive with respect to the base case. However, they earn less compared
to what can be justified by the productivity differentials. These workers earn 44 percent
and 137 percent more respectively. On average, the workers are not able to fully
appropriate the productivity gains of education through wages. This issue might point to
institutional rigidities that are beyond the scope of this paper.

14
As for experience, we also find some interesting results. Workers with three to ten
years of tenure in the firm are 12 percent more productive and earn 19 percent more than
those with less than three years of experience. However, there is no evidence to reject the
equality of both differentials; meaning that if they are paid more it is because they are
proportionately more productive. This is consistent within a competitive labor market. On
the other hand, workers with more than 10 years of tenure are 24 percent less productive
and earn practically the same as those with less than three years of experience. In this
case, these workers are paid more than what their productivity would merit. We might
venture to say that workers with more years in the firm have a higher bargaining power
with their employers, thus allowing them to negotiate higher wages than their
productivity justifies. This issue will be discussed further in the paper.
Training benefits firms and employees since it significantly increases workers’
productivity and their earnings. Workers that have received in-house training are 25
percent more productive and earn 16 percent more than those without any form of
training. Those workers that have received external formal training are 49 percent more
productive and earn 24 percent higher wages. Notice that for those workers with in-house
training, the differentials are similar, but for those with external formal training the wage
differential is lower than the productivity differential. This implies that both workers and
employers share equally the benefits of in-house training, but that employers receive a
higher proportion of the benefits of external formal training. However, we do not know
the distribution of the cost of this training. Generally, we would expect that the larger
share of the cost, if not all, is covered by the employer. Thus, this uneven sharing of
benefits from training could be reflecting the fact that the employer is recovering the
investment in training.
a. Results by Firm Size
The results presented above aggregate across all firm sizes. However, firms vary
considerably by size. For this reason, in order to avoid aggregation biases we decided to
analyze the impact of the above-mentioned variables on wages and productivity
differentials by firm size. We adjusted by doing estimations for two separate groups:

15
micro or small firms and medium or large firms. The human capital effects are shown in
Table 4; the complete results are shown in Tables A.2 and A.3.
TABLE 4. MARGINAL PRODUCTIVITY DIFFERENTIALS AND RELATIVE WAGES BY FIRM SIZE
Micro and Small Firms Medium and Large Firms Productivity Relative Reject Productivity Relative Reject Variable Differential Wage iioH λφ =: Differential Wage iioH λφ =:
Ho: coefficient=1 1.68 * 1.33 * * 2.22 * 1.57 * * Men (0.16) (0.05) (0.24) (0.07)
1.61 * 1.36 * 2.22 * 1.46 * * Upper secondary (0.18) (0.07) (0.24) (0.06)
3.06 * 1.99 * * 5.09 * 2.72 * * University or more (0.35) (0.11) (0.57) (0.11)
1.03 1.19 * * 1.25 * 1.15 * (3 - 10] years in the firm (0.07) (0.04) (0.10) (0.04)
0.5 * 0.81 * * 1.56 * 1.39 * (10 - +) years in the firm (0.05) (0.03) (0.13) (0.05)
1.27 * 1.19 * 1.25 * 1.13 * * In-house training (0.11) (0.05) (0.07) (0.03)
1.55 * 1.29 * * 1.44 * 1.19 * * External formal training (0.15) (0.07) (0.09) (0.03) Adjusted R2 0.84 0.93 0.69 0.82 Observations 3,301 3,565
Notes: Calculations based on ENESTYC 2001. Standard errors are shown in parenthesis. * denotes significance at 5 percent level. The Wald statistic was used to test the equality of the estimated wage and productivity differential. Reference group: women, lower secondary or less, until three years of experience in the firm, and without training.
In the case of gender, the main conclusion still holds independent of firm size.
The higher wages of men is explained by their higher productivity relative to women.
Nevertheless, the productivity differential for men with respect to women is larger than
the wage differential. However, for micro and small firms, the differentials are much
smaller: 68 percent for productivity, and 33 for wages. The medium and large firms have
slightly higher differentials than before: 122 percent for productivity and 57 percent for
wages.
The results for education demonstrate a robust relationship between higher
education and higher productivity. The major difference is that in micro and small firms
we cannot reject the equality of the productivity and wage differentials for workers with

16
upper secondary. This implies that they are fully compensated for their increased
productivity over those workers with lower secondary education or less. The differentials
are much larger in medium and large firms than before, showing that education has a
higher impact in productivity and is more valued in larger firms.
Regarding experience, the story changes slightly. Workers with three to ten years
of experience are not more productive than those with less experience in the micro and
small firms. But they are paid 19 percent more, which is not justified given their lack of
incremental productivity. Workers with ten or more years of experience in micro and
small firms are 50 percent less productive, but only earn 19 percent less, implying they
too are overpaid. In medium and large firms, workers with more experience are more
productive in the same proportion that they earn more, meaning they are fully
compensated. There is no evidence to reject the equality of the differentials.
In micro and small firms, workers with in-house training are 27 percent more
productive and earn 19 percent more than those without any form of training. Those with
external formal training are 55 percent more productive and earn 29 percent higher
wages. Those workers with in-house training earn as much as their productivity
differential, but for those with external formal training the productivity differential is
higher than the wage differential. This suggests an important point – that both workers
and employers share equally the benefits of in-house training, but that employers receive
a higher proportion of the benefits of external formal training; a consistent finding. In
medium and large firms, workers with in-house training are 25 percent more productive
and earn 13 percent more than those without any training. Those with external formal
training are 44 percent more productive and earn 19 percent higher wages. For both types
of training, the productivity differential is larger than the wage differential, meaning that
employers receive a higher proportion of the benefits of any kind of training. One
implication of the external training results is that policies that encourage increased
training will lead to larger productivity gains for the economy. Gains that firms receive
from training are shared with employees in the form of higher pay.

17
b. Training by Gender
The reason behind the two, rather limiting, assumptions imposed in this paper
(introduced in section IV) is due to data limitations. For each firm, we do not have data
on the actual number of workers in each of the possible combinations of the demographic
characteristics. However, there is enough data to relax these assumptions allowing
variations for training by gender. Therefore, we present this exercise to asses the
restrictiveness of our assumptions and whether there are important effects on the
estimates.
Now, suppose the workforce is distinguished by gender – 1G and 2G – and
training11 – 1T and 2T . Then the quality of labor aggregate (when the base case is non-
trained women) would be defined as:
( ) ( ) ( ) ⎥⎦⎤
⎢⎣⎡ −+−+−+=
LTG
LTG
LTGLQL TGTGTG
222112 1111222222
IIIφφφφφ (6)
where:
12 TG I number of non-trained men
21 TG I number of trained women
22 TG I number of trained men
The first assumption implies that 122=TGφ and the second that ⎟
⎠
⎞⎜⎝
⎛⋅=L
GTTG 2
222 I ;
⎟⎠
⎞⎜⎝
⎛ −⋅=L
GTTG 2
221 1I ; and ⎟⎠
⎞⎜⎝
⎛ −⋅=L
TGTG 2
212 1I . Substituting this into (6) we obtain a
similar equation to (4).
As we mentioned previously, our aim is to investigate the effects of training on
productivity and wages, for women and men separately. The main results are in Table 5
below and the complete results presented in Tables A.4-A.6.
11 In this example we only distinguish training vs. no training for sake of simplicity.

18
TABLE 5. MARGINAL PRODUCTIVITY DIFFERENTIALS AND RELATIVE WAGES FOR TRAINING BY GENDER
Productivity Relative Reject Variable Differential Wage iioH λφ =:
Ho: coefficient=1 1.97 * 1.54 * * Men within non-trained workers (0.15) (0.04) 1.14 1.23 * In-house training within women (0.17) (0.08) 1.25 1.23 * External formal training within women (0.29) (0.13) 1.28 * 1.14 * * In-house training within men (0.07) (0.03) 1.55 * 1.24 * * External formal training within men (0.10) (0.05)
Adjusted R2 0.90 0.96 Observations 6,662
Notes: Calculations based on ENESTYC 2001. Standard errors are shown in parenthesis. * denotes significance at 5 percent level. The Wald statistic was used to test the equality of the estimated wage and productivity differential. Reference group: women without training.
As can be seen in the table, among workers that received no training, men are 97
percent more productive and earn 54 percent higher wages. These results are consistent
with what was previously found on the effects of gender, even among those workers that
have received no training. In the same way, the results for education and experience are
practically the same as we had before. This shows that our model is robust to the
assumptions that we made.
With respect to training, there is no evidence that women who receive either in-
house or external formal training are more productive than those without training.
However, even though they are paid 23 percent more, we cannot reject the equality of the
wage and productivity differentials. This means that both trained women and their
employers share the benefits equally. As for men, those with in-house training are 28
percent more productive, and those with external formal training, are 55 percent more
productive. Respectively, men earn 14 percent and 24 percent higher wages. In this case,
there is significant evidence that the productivity differential is larger than the wage
differential. The results are very similar to the ones we had before relaxing the
assumptions.

19
VI. CONCLUSIONS
Using manufacturing sector data, this paper examined the determinants of wages
and productivity differentials in Mexico. We used both worker and firm characteristics in
our model specification, to see whether the wage differentials were justified by the
productivity differentials.
First, men are better paid relative to women because they are significantly more
productive. However, their salary increase does not fully compensate for their higher
productivity. There is no evidence of gender discrimination in Mexico since wage
differentials are explained by equal or larger productivity differentials, though this is a
topic for further research.
Second, the wage premium increased with additional years of schooling.
Additional years of schooling were also shown to increase productivity. Wages
associated with years of schooling do not, however, have similar significant positive
effects: workers with upper secondary education were found to be 84 percent more
productive (than the base case), and workers with higher education were found to be 282
percent more productive. Yet, they earn 44 percent and 137 percent more respectively.
On average, the workers are not able to fully appropriate the productivity gains of
education through wages. This issue deserves further research beyond the scope of this
paper.
Third, workers with more experience are more productive in the same proportion
that they earn more in medium and large firms, meaning they are fully compensated. On
the other hand, workers in micro and small firms are paid more than what their
productivity would merit. Those with more than 10 years of tenure are 50 percent less
productive and earn only 20 percent less than those with less than three years of
experience. Workers with three to 10 years of experience are equally productive, but earn
20 percent higher wages in micro and small firms. These findings should be investigated
in more detail.
Fourth, both employees and employers benefited the most from external formal
training. For both types of training, the productivity differential is larger than the wage
differential, meaning that employers receive a higher proportion of the benefits of any
20
kind of training. In general, the trends indicate lack of adequate compensation for
training, both in-house and external among employees. However, the differential is
highest among workers in medium and large firms who see a wage increase of less than
half their improvement in productivity. Among men, workers with in-house training are
28 percent more productive, and those with external formal training are 55 percent more
productive. Respectively, they earn 14 percent and 24 percent higher wages, indicating a
significantly larger productivity differential than wage differential. However, among
women, training does not significantly increase productivity.
The results showed that education and external formal training are positively
associated with wages and productivity. Training effects are significantly larger for
productivity than for wages, suggesting that the employers benefit more from external
formal training than workers. However, the type of training also has a major influence on
the productivity outcome. Formal external training has the highest productivity gains,
while in-house training has the lower (though still high) gains. This leads us to think that
Mexico underinvests in training given the large returns.
Furthermore, the results on the effects of training by gender remained robust as
compared to the previous estimates. This finding shows that our model is robust to the
assumptions that we made. Therefore, this analysis provides robust insights into the
determinants of wage and productivity differentials in Mexico.

21
VII. APPENDIX
TABLE A.1. JOINT PRODUCTION FUNCTION AND WAGE EQUATION ESTIMATES
Productivity equation (1) Wages equation (2) Prob.
Variable Coef. Std. Error Prob. Coef. Std. Error Prob. iioH λφ =:
Worker characteristics (Ho: coefficient=1) Men 2.05 0.13 0.000 1.52 0.04 0.000 0.00 Upper secondary 1.84 0.13 0.000 1.44 0.04 0.000 0.00 University or more 3.82 0.28 0.000 2.37 0.07 0.000 0.00 (3 - 10] years in the firm 1.12 0.05 0.018 1.19 0.03 0.000 0.18 (10 - +) years in the firm 0.76 0.04 0.000 0.97 0.02 0.197 0.00 Union 1.32 0.06 0.000 1.21 0.03 0.000 0.05 In-house training 1.25 0.06 0.000 1.16 0.03 0.000 0.11 External formal training 1.49 0.08 0.000 1.24 0.04 0.000 0.00 Permanent worker 1.50 0.13 0.000 1.10 0.04 0.011 0.00 Firm characteristics (Ho: coefficient=0) Capital assets 0.20 0.01 0.000 Small firm 0.55 0.05 0.000 0.50 0.02 0.000 Medium firm 0.65 0.07 0.000 0.62 0.02 0.000 Large firm 0.70 0.10 0.000 0.71 0.02 0.000 North Region 0.39 0.04 0.000 0.35 0.02 0.000 Center Region 0.36 0.04 0.000 0.33 0.02 0.000 Mexico City 0.55 0.05 0.000 0.39 0.02 0.000 Sector 32 -0.31 0.04 0.000 -0.22 0.02 0.000 Sector 33 -0.46 0.05 0.000 -0.13 0.03 0.000 Sector 34 -0.01 0.05 0.870 0.13 0.03 0.000 Sector 35 -0.04 0.04 0.321 0.09 0.02 0.000 Sector 36 -0.50 0.05 0.000 -0.05 0.03 0.096 Sector 37 0.05 0.09 0.569 0.03 0.06 0.663 Sector 38 -0.29 0.03 0.000 -0.06 0.02 0.001 Sector 39 -0.33 0.10 0.001 -0.06 0.06 0.255 More than 50% of foreign capital 0.00 0.00 0.000 0.00 0.00 0.000 The firm exports at least 50% of its products -0.02 0.05 0.679 0.02 0.03 0.357 Research and development 0.02 0.03 0.549 0.04 0.02 0.020 Quality Control 0.17 0.03 0.000 0.11 0.02 0.000 Technology adoption 0.11 0.03 0.000 0.06 0.01 0.000 Adjusted R2 0.90 0.96 Number of observations (firms) 6,866
Notes: Calculations based on ENESTYC 2001. The Wald statistic was used to test the equality of the estimated wage and productivity differential. Reference group for the worker characteristics: women, lower secondary or less, until three years working experience in the firm, does not belong to a union, without training, temporary worker. Reference group for the firm characteristics: micro firms, South region, sector 31, the firm exports less than 50% of its products, does no research and development, no quality control, no technology adoption.

22
TABLE A.2. JOINT PRODUCTION FUNCTION AND WAGE EQUATION ESTIMATES MICRO AND SMALL FIRMS
Productivity equation (1) Wages equation (2) Prob.
Variable Coef. Std. Error Prob. Coef. Std. Error Prob. iioH λφ =:
Worker characteristics (Ho: coefficient=1) Men 1.68 0.16 0.000 1.33 0.05 0.000 0.02 Upper secondary 1.61 0.18 0.001 1.36 0.07 0.000 0.15 University or more 3.06 0.35 0.000 1.99 0.11 0.000 0.00 (3 - 10] years in the firm 1.03 0.07 0.633 1.19 0.04 0.000 0.02 (10 - +) years in the firm 0.50 0.05 0.000 0.81 0.03 0.000 0.00 Union 1.31 0.10 0.002 1.20 0.05 0.000 0.27 In-house training 1.27 0.11 0.011 1.19 0.05 0.000 0.42 External formal training 1.55 0.15 0.000 1.29 0.07 0.000 0.05 Permanent worker 1.57 0.24 0.016 1.04 0.06 0.499 0.02 Firm characteristics (Ho: coefficient=0) Capital assets 0.19 0.01 0.000 0.45 0.03 0.000 Small firm 0.54 0.07 0.000 0.47 0.04 0.000 North Region 0.59 0.07 0.000 0.41 0.03 0.000 Center Region 0.48 0.06 0.000 0.50 0.04 0.000 Mexico City 0.72 0.07 0.000 -0.23 0.03 0.000 Sector 32 -0.25 0.06 0.000 -0.10 0.05 0.035 Sector 33 -0.43 0.08 0.000 0.08 0.05 0.092 Sector 34 -0.08 0.09 0.413 0.12 0.04 0.007 Sector 35 0.05 0.08 0.533 -0.05 0.04 0.198 Sector 36 -0.53 0.07 0.000 0.03 0.09 0.721 Sector 37 0.14 0.15 0.372 -0.02 0.03 0.507 Sector 38 -0.19 0.06 0.001 -0.03 0.08 0.732 Sector 39 -0.25 0.14 0.072 0.00 0.00 0.002 More than 50% of foreign capital 0.00 0.00 0.007 0.14 0.05 0.012 The firm exports at least 50% of its products 0.18 0.09 0.053 0.04 0.03 0.176 Research and development 0.01 0.05 0.918 0.13 0.04 0.001 Quality Control 0.29 0.06 0.000 0.08 0.02 0.000 Technology adoption 0.14 0.04 0.001 Adjusted R2 0.84 0.93 Number of observations (firms) 3,301 Notes: Own calculations based on ENESTYC 2001. The Wald statistic was used to test the equality of the estimated wage and productivity differential. Reference group for the worker characteristics: women, lower secondary or less, until three years of working experience in the firm, does not belong to a union, without training, temporary worker. Reference group for the firm characteristics: micro firms, South region, sector 31, the firm exports less than 50% of its products, does no research and development, no quality control, no technology adoption.

23
TABLE A.3. JOINT PRODUCTION FUNCTION AND WAGE EQUATION ESTIMATES MEDIUM AND LARGE FIRMS
Productivity equation (1) Wages equation (2) Prob.
Variable Coef. Std. Error Prob. Coef. Std. Error Prob. iioH λφ =:
Worker characteristics (Ho: coefficient=1) Men 2.22 0.24 0.000 1.57 0.07 0.000 0.01 Upper secondary 2.22 0.24 0.000 1.46 0.06 0.000 0.00 University or more 5.09 0.57 0.000 2.72 0.11 0.000 0.00 (3 - 10] years in the firm 1.25 0.10 0.014 1.15 0.04 0.000 0.33 (10 - +) years in the firm 1.56 0.13 0.000 1.39 0.05 0.000 0.22 Union 1.34 0.08 0.000 1.20 0.03 0.000 0.06 In-house training 1.25 0.07 0.000 1.13 0.03 0.000 0.08 External formal training 1.44 0.09 0.000 1.19 0.03 0.000 0.01 Permanent worker 1.47 0.16 0.003 1.14 0.05 0.005 0.05 Firm characteristics (Ho: coefficient=0) Capital assets 0.19 0.01 0.000 Large firm 0.07 0.04 0.104 0.09 0.02 0.000 North Region 0.15 0.06 0.011 0.17 0.03 0.000 Center Region 0.17 0.06 0.002 0.17 0.03 0.000 Mexico City 0.31 0.06 0.000 0.21 0.03 0.000 Sector 32 -0.27 0.05 0.000 -0.13 0.03 0.000 Sector 33 -0.42 0.09 0.000 -0.14 0.05 0.003 Sector 34 0.02 0.06 0.719 0.17 0.03 0.000 Sector 35 -0.08 0.05 0.092 0.09 0.02 0.000 Sector 36 -0.40 0.06 0.000 0.00 0.04 0.924 Sector 37 0.00 0.10 0.984 0.04 0.07 0.582 Sector 38 -0.31 0.04 0.000 -0.04 0.02 0.059 Sector 39 -0.33 0.17 0.056 -0.03 0.09 0.731 More than 50% of foreign capital 0.00 0.00 0.000 0.00 0.00 0.000 The firm exports at least 50% of its products -0.06 0.04 0.152 -0.01 0.02 0.687 Research and development 0.03 0.03 0.397 0.03 0.02 0.029 Quality Control 0.12 0.03 0.000 0.10 0.02 0.000 Technology adoption 0.06 0.04 0.086 0.01 0.02 0.575 Adjusted R2 0.69 0.82 Number of observations (firms) 3,565 Notes: Calculations based on ENESTYC 2001. The Wald statistic was used to test the equality of the estimated wage and productivity differential. Reference group for the worker characteristics: women, lower secondary or less, until three years of working experience in the firm, does not belong to a union, without training, temporary worker. Reference group for the firm characteristics: medium firms, South region, sector 31, the firm exports less than 50% of its products, does no research and development, no quality control, no technology adoption.
24
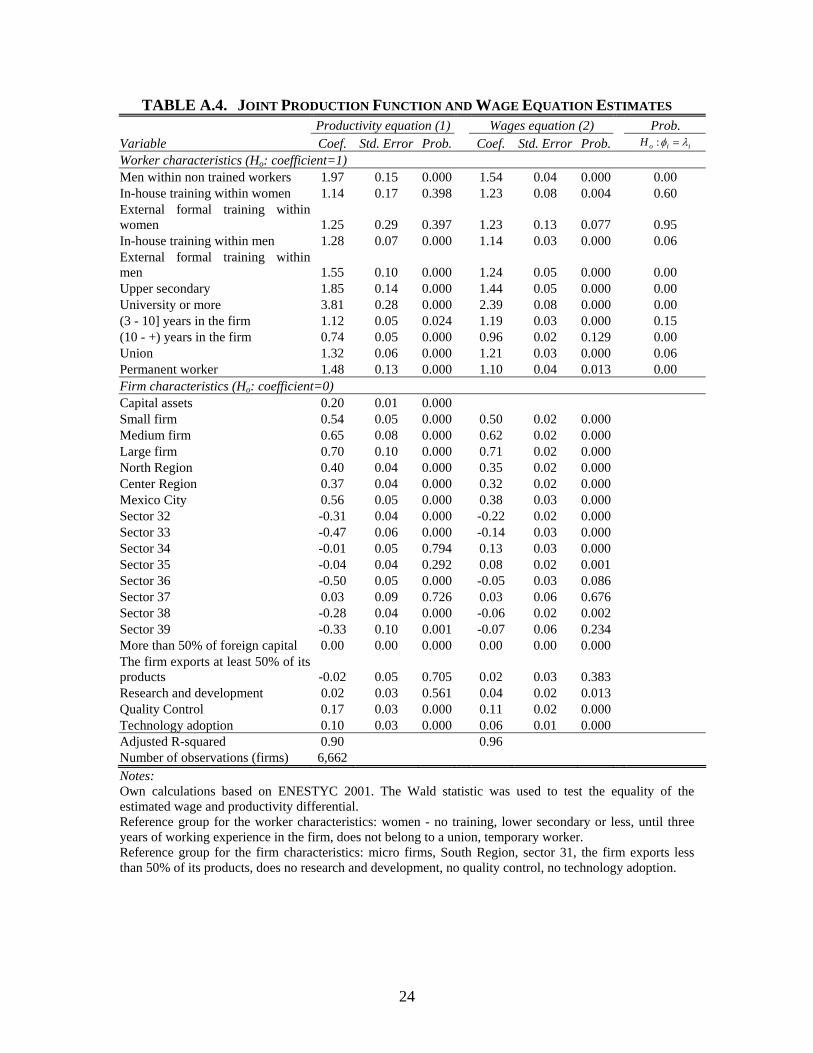
TABLE A.4. JOINT PRODUCTION FUNCTION AND WAGE EQUATION ESTIMATES Productivity equation (1) Wages equation (2) Prob. Variable Coef. Std. Error Prob. Coef. Std. Error Prob. iioH λφ =: Worker characteristics (Ho: coefficient=1) Men within non trained workers 1.97 0.15 0.000 1.54 0.04 0.000 0.00 In-house training within women 1.14 0.17 0.398 1.23 0.08 0.004 0.60 External formal training within women 1.25 0.29 0.397 1.23 0.13 0.077 0.95 In-house training within men 1.28 0.07 0.000 1.14 0.03 0.000 0.06 External formal training within men 1.55 0.10 0.000 1.24 0.05 0.000 0.00 Upper secondary 1.85 0.14 0.000 1.44 0.05 0.000 0.00 University or more 3.81 0.28 0.000 2.39 0.08 0.000 0.00 (3 - 10] years in the firm 1.12 0.05 0.024 1.19 0.03 0.000 0.15 (10 - +) years in the firm 0.74 0.05 0.000 0.96 0.02 0.129 0.00 Union 1.32 0.06 0.000 1.21 0.03 0.000 0.06 Permanent worker 1.48 0.13 0.000 1.10 0.04 0.013 0.00 Firm characteristics (Ho: coefficient=0) Capital assets 0.20 0.01 0.000 Small firm 0.54 0.05 0.000 0.50 0.02 0.000 Medium firm 0.65 0.08 0.000 0.62 0.02 0.000 Large firm 0.70 0.10 0.000 0.71 0.02 0.000 North Region 0.40 0.04 0.000 0.35 0.02 0.000 Center Region 0.37 0.04 0.000 0.32 0.02 0.000 Mexico City 0.56 0.05 0.000 0.38 0.03 0.000 Sector 32 -0.31 0.04 0.000 -0.22 0.02 0.000 Sector 33 -0.47 0.06 0.000 -0.14 0.03 0.000 Sector 34 -0.01 0.05 0.794 0.13 0.03 0.000 Sector 35 -0.04 0.04 0.292 0.08 0.02 0.001 Sector 36 -0.50 0.05 0.000 -0.05 0.03 0.086 Sector 37 0.03 0.09 0.726 0.03 0.06 0.676 Sector 38 -0.28 0.04 0.000 -0.06 0.02 0.002 Sector 39 -0.33 0.10 0.001 -0.07 0.06 0.234 More than 50% of foreign capital 0.00 0.00 0.000 0.00 0.00 0.000 The firm exports at least 50% of its products -0.02 0.05 0.705 0.02 0.03 0.383 Research and development 0.02 0.03 0.561 0.04 0.02 0.013 Quality Control 0.17 0.03 0.000 0.11 0.02 0.000 Technology adoption 0.10 0.03 0.000 0.06 0.01 0.000 Adjusted R-squared 0.90 0.96 Number of observations (firms) 6,662 Notes: Own calculations based on ENESTYC 2001. The Wald statistic was used to test the equality of the estimated wage and productivity differential. Reference group for the worker characteristics: women - no training, lower secondary or less, until three years of working experience in the firm, does not belong to a union, temporary worker. Reference group for the firm characteristics: micro firms, South Region, sector 31, the firm exports less than 50% of its products, does no research and development, no quality control, no technology adoption.
25
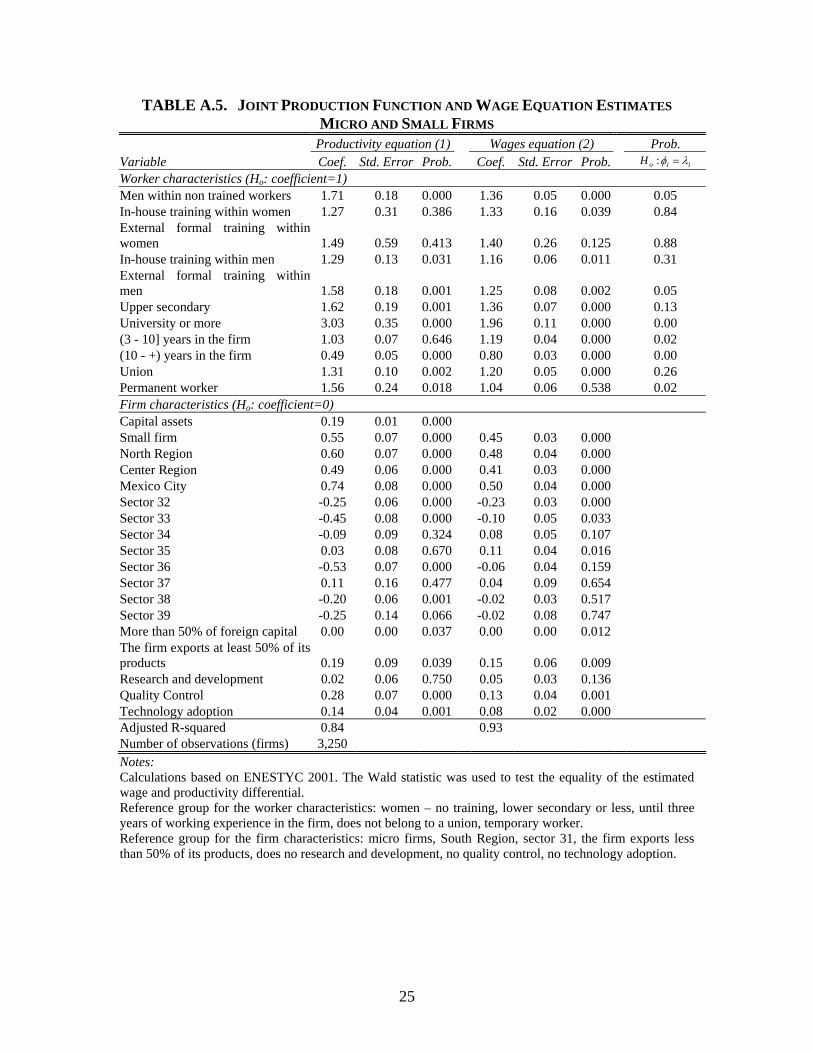
TABLE A.5. JOINT PRODUCTION FUNCTION AND WAGE EQUATION ESTIMATES MICRO AND SMALL FIRMS
Productivity equation (1) Wages equation (2) Prob. Variable Coef. Std. Error Prob. Coef. Std. Error Prob. iioH λφ =: Worker characteristics (Ho: coefficient=1) Men within non trained workers 1.71 0.18 0.000 1.36 0.05 0.000 0.05 In-house training within women 1.27 0.31 0.386 1.33 0.16 0.039 0.84 External formal training within women 1.49 0.59 0.413 1.40 0.26 0.125 0.88 In-house training within men 1.29 0.13 0.031 1.16 0.06 0.011 0.31 External formal training within men 1.58 0.18 0.001 1.25 0.08 0.002 0.05 Upper secondary 1.62 0.19 0.001 1.36 0.07 0.000 0.13 University or more 3.03 0.35 0.000 1.96 0.11 0.000 0.00 (3 - 10] years in the firm 1.03 0.07 0.646 1.19 0.04 0.000 0.02 (10 - +) years in the firm 0.49 0.05 0.000 0.80 0.03 0.000 0.00 Union 1.31 0.10 0.002 1.20 0.05 0.000 0.26 Permanent worker 1.56 0.24 0.018 1.04 0.06 0.538 0.02 Firm characteristics (Ho: coefficient=0) Capital assets 0.19 0.01 0.000 Small firm 0.55 0.07 0.000 0.45 0.03 0.000 North Region 0.60 0.07 0.000 0.48 0.04 0.000 Center Region 0.49 0.06 0.000 0.41 0.03 0.000 Mexico City 0.74 0.08 0.000 0.50 0.04 0.000 Sector 32 -0.25 0.06 0.000 -0.23 0.03 0.000 Sector 33 -0.45 0.08 0.000 -0.10 0.05 0.033 Sector 34 -0.09 0.09 0.324 0.08 0.05 0.107 Sector 35 0.03 0.08 0.670 0.11 0.04 0.016 Sector 36 -0.53 0.07 0.000 -0.06 0.04 0.159 Sector 37 0.11 0.16 0.477 0.04 0.09 0.654 Sector 38 -0.20 0.06 0.001 -0.02 0.03 0.517 Sector 39 -0.25 0.14 0.066 -0.02 0.08 0.747 More than 50% of foreign capital 0.00 0.00 0.037 0.00 0.00 0.012 The firm exports at least 50% of its products 0.19 0.09 0.039 0.15 0.06 0.009 Research and development 0.02 0.06 0.750 0.05 0.03 0.136 Quality Control 0.28 0.07 0.000 0.13 0.04 0.001 Technology adoption 0.14 0.04 0.001 0.08 0.02 0.000 Adjusted R-squared 0.84 0.93 Number of observations (firms) 3,250 Notes: Calculations based on ENESTYC 2001. The Wald statistic was used to test the equality of the estimated wage and productivity differential. Reference group for the worker characteristics: women – no training, lower secondary or less, until three years of working experience in the firm, does not belong to a union, temporary worker. Reference group for the firm characteristics: micro firms, South Region, sector 31, the firm exports less than 50% of its products, does no research and development, no quality control, no technology adoption.

26
TABLE A.6. JOINT PRODUCTION FUNCTION AND WAGE EQUATION ESTIMATES MEDIUM AND LARGE FIRMS
Productivity equation (1) Wages equation (2) Prob. Variable Coef. Std. Error Prob. Coef. Std. Error Prob. iioH λφ =: Worker characteristics (Ho: coefficient=1) Men within non trained workers 2.12 0.35 0.001 1.70 0.12 0.000 0.22 In-house training within women 1.24 0.25 0.346 1.29 0.11 0.007 0.86 External formal training within women 1.39 0.36 0.282 1.27 0.15 0.074 0.76 In-house training within men 1.23 0.09 0.007 1.08 0.03 0.027 0.07 External formal training within men 1.44 0.11 0.000 1.16 0.05 0.001 0.02 Upper secondary 2.25 0.25 0.000 1.46 0.06 0.000 0.00 University or more 5.24 0.59 0.000 2.85 0.12 0.000 0.00 (3 - 10] years in the firm 1.22 0.10 0.026 1.14 0.04 0.000 0.43 (10 - +) years in the firm 1.62 0.14 0.000 1.41 0.05 0.000 0.13 Union 1.34 0.08 0.000 1.20 0.03 0.000 0.07 Permanent worker 1.43 0.15 0.005 1.14 0.05 0.005 0.07 Firm characteristics (Ho: coefficient=0) Capital assets Large firm 0.06 0.05 0.165 0.09 0.02 0.000 North Region 0.14 0.06 0.020 0.16 0.04 0.000 Center Region 0.16 0.06 0.006 0.16 0.04 0.000 Mexico City 0.30 0.07 0.000 0.18 0.04 0.000 Sector 32 -0.25 0.05 0.000 -0.13 0.03 0.000 Sector 33 -0.40 0.09 0.000 -0.14 0.05 0.003 Sector 34 0.03 0.06 0.653 0.16 0.03 0.000 Sector 35 -0.07 0.05 0.119 0.09 0.03 0.001 Sector 36 -0.40 0.06 0.000 0.01 0.04 0.806 Sector 37 -0.01 0.11 0.929 0.04 0.07 0.610 Sector 38 -0.29 0.04 0.000 -0.04 0.02 0.086 Sector 39 -0.32 0.17 0.063 -0.03 0.09 0.712 More than 50% of foreign capital 0.00 0.00 0.000 0.00 0.00 0.000 The firm exports at least 50% of its products -0.07 0.04 0.126 -0.01 0.02 0.614 Research and development 0.02 0.03 0.581 0.04 0.02 0.024 Quality Control 0.12 0.03 0.000 0.10 0.02 0.000 Technology adoption 0.05 0.04 0.159 0.01 0.02 0.587 Adjusted R-squared 0.69 0.83 Number of observations (firms) 3,412 Notes: Own calculations based on ENESTYC 2001. The Wald statistic was used to test the equality of the estimated wage and productivity differential. Reference group for the worker characteristics: women – no training, lower secondary or less, until three years of working experience in the firm, does not belong to a union, temporary worker. Reference group for the firm characteristics: medium firms, South Region, sector 31, the firm exports less than 50% of its products, does no research and development, no quality control, no technology adoption.

27
VIII. REFERENCES
Barrett, A. and P. O’Connell. 1998. “Does training Generally Work? The returns to in-company training” Center for Economic Policy Discussion Paper No. 1879.
Bartel, A. and F. Lichtenberg. 1987. “The Comparative Advantage of Educated Workers in Implementing New Technology” Review of Economics and Statistics, 69:1-11.
Batra, G. and H. Tan. 2000. “Technology and Firm Size-Wage Differentials in Colombia, Mexico, and Taiwan (China).” The World Bank Economic Review 11(1):59–83.
Brown, C. and J. Medoff. 1989. “The Employer Size-Wage Effect.” Journal of Political Economy 97(5):1027-59.
Card, D. 2001. “Estimating the Return to Schooling: Progress on some Persistent Econometric Problems.” Econometrica 69(5): 1127-1160.
Dar, A., F. Fluitman and I. Gill. 2000. Vocational Education and Training Reform: Matching Skills to Markets and Budgets. Oxford: The World Bank and the International Labour Office.
Dearden, L., H. Reed, and J. Van Reenen. 2000. “Who Gains when Workers Train? Training and Corporate Productivity in a Panel of British Industries” Institute for Fiscal Studies Working Paper W00/04.
Doms, M., T. Dunne, and K. R. Troske. 1997. “Workers, Wages, and Technology.” Quarterly Journal of Economics 112(1): 253-90.
Esquivel, G., D. Lederman, M. Messmacher and R. Villoro. 2002. “Why NAFTA did not reach the South”. Washington, DC: The World Bank. Mimeo.
Groshen, Erica L.(1995). “The Structure of the Female/Male Wage Differential: Is it Who You Are, What You Do, or Where You Work?” In: The Journal of Human Resources 226(3): 457-472.
Hellerstein, J. and D. Neumark. 1999. “Sex, Wages and Productivity: An Empirical Analysis of Israeli Firm-Level Data.” In: International Economic Review 40(1): 95-123.
———. 2004. “Production Function and Wage Equation Estimation with Heterogeneous Labor: Evidence from a New Matched Employer-Employee Data Set.” National Bureau of Economic Research WP 10325.
Hellerstein, J., D. Neumark, and K. Troske. 1999. “Wages, Productivity and Worker Characteristics: Evidence from Plant-Level Production Functions and Wage Equations.” In Journal of Labor Economics 17(3): 409-446.
Katz, Elizabeth and Maria C. Correia (Eds.). 2001. The Economics of Gender in Mexico: Work, Family, State, and Market. Washington, DC: The World Bank. Report No. 22242.

28
Koning, J. 1994. “Evaluating Training at the Company Level”, ch7 in McNabb, R. and Whitfield, K. (eds.), The Market for Training, Aldershot: Avebury.
Lederman, D. 2002. “Lessons from NAFTA”, The Work Bank. Mimeo.
López-Acevedo, G. 2004. “Mexico: Evolution of Earnings Inequality and Rates of Return to Education (1988-2002)” In: Estudios Económicos 19(2): 211-284.
Maloney, William F. and Eduardo Pontual Ribeiro. 1999. “Efficiency wage and union effects in labor demand and wage structure in Mexico - An application of quantile analysis.” Policy Research Working Paper 2139. Washington, DC: The World Bank.
Matthews, L. and J. Sargent. 1997. “Skill Development and Integrated Manufacturing in Mexico.” World Development 25(10): 1669-81.
———. 1995. “Enterprise Training in Developing Countries: Incidence, Productivity Effects, and Policy Implications.” Competition and Strategy Unit. Private Sector Development Department. Washington, DC: The World Bank.
Middleton, J., Van Adams and Ziderman. 1993. Skills for Productivity: Vocational Education and Training in Developing Countries. The World Bank.
Mincer, J. 1989. “Human Capital Responses to Technological Change in the Labor Market.” In: National Bureau of Economic Research. Working Paper No. 3207.
Nielsen, H. and M. Rosholm. 2002. “Evaluation of Training in African Enterprises”, Working Paper, University of Aarhus, Sweden for the Africa Region. Washington, DC: The World Bank.
Oosterbeek, H. and M. van Praag. 1995. “Firm Size Wage Differentials in the Netherlands.” Small Business Economics 7(3):173-82.
Pavnick, N. 2000. “What Explains Sill Upgrading in Less Developing Countries” National Bureau of Economic Research. Working Paper No. 7846.
Revenga, A. 1995. “Employment and Wage Effects of Trade Liberalization.” Policy Research Working Paper 1524. Washington, DC: The World Bank.
Santamaría, M. and G. López-Acevedo. 2004. Labor Reform in México: Analysis of a Proposal Drafted by Employers and Employees. Washington, DC: The World Bank. Mimeo.
Tan, H. 2000. “Technological Change and Skills Demand: Panel Evidence from Malaysian Manufacturing.” Working Paper. The World Bank Institute.
——— and G. López-Acevedo. 2002. “In-Firm Training for the Knowledge Economy”. Background paper for the 2002 flagship report. Washington, DC: The World Bank.
Verner, D. 1999. “Are Wages and Productivity in Zimbabwe Affected by Human Capital Investment and International Trade?” Policy Research Working Paper 2101. Washington, DC: The World Bank.

29
———. 2000. “Wage and Productivity Gaps: Evidence from Ghana.” Policy Research Working Paper 2168. Washington, DC: The World Bank.
Welch, F. 1970. “Education in Production.” In: Journal of Political Economy, 78(1):35-59.
World Bank. 1998a. Mexico Country Economic Memorandum: Enhancing Factor Productivity Growth. Report No. 17392-ME. Washington, DC: The World Bank.
———. 1998b. “Mexico: Strengthening Enterprise Finance: Recent Trends in Enterprise Financing. Report No. 17733-ME. Washington, DC: The World Bank.
———. 1999. Mexican Labor Markets: New Views on Integration and Flexibility. Volume Two: Technical Papers. Poverty Reduction and Economic Management Unit, Mexico Department.
———. 2000. Earnings Inequality after Mexico’s Economic and Educational Reforms. Volume Two: Technical Papers. Poverty Reduction and Economic Management Unit, Mexico Department.
———. 2001a. Mexico Technology Wages and Employment. Volume Two: Technical Papers. Poverty Reduction and Economic Management Unit, Mexico Department.
———. 2001b. Trade and Job Quality. Washington, DC: The World Bank.