mexico – beverages m soft drink industry · when job losses were rampant and competition...
TRANSCRIPT
Important disclosures/certifications are in the “Important Disclosures” section of this report. U.S. investors’ inquiries should be directed to Santander Investment at (212) 407-7809.
Latin American Equity Research Sector Report
New York, September 17, 2004 Mexico – Beverages
MEXICAN SOFT DRINK INDUSTRY A Closer Look at the Coke Bottlers: A Perfect Storm? Alexander Robarts Alonso Aramburú (212) 350-0723 (212) [email protected] [email protected]
In this report, we analyze the fundamentals of the Mexican bottling sector into 2005 and remain cautious despite an expected moderate recovery in consumption. We are lowering our earnings estimates on Coca-Cola Femsa (KOF), introducing our 2005 target price, and downgrading the stock to Hold from Buy. We are also initiating coverage on Arca and Contal, both with Underperform ratings.
• Our new sector concern is our expectation for incremental margin pressure in the next six months from rising raw material prices, particularly PET resin, and sugar, which account for approximately 40% of cash cost of sales. During the second half of 2004, we expect PET resin prices to be significantly higher year on year on the back of the surge in oil prices, leading to an estimated 160-170 basis point gross margin reduction on a pro forma basis.
• Prolonged intense competition leads us to estimate real price declines in 2005 for the third consecutive year (we had estimated in line with inflation). PBG Mexico has a new CEO and a new marketing campaign. B-brand producer Kola Real expects its new plant in Monterrey to be operational by February 2005 and to double its installed capacity by 2006.
• The ongoing industry shift toward lower margin one-way packages should further pressure gross margins.
• However, soft drink and water industry volume growth in Mexico should begin to recover during 2H04 after contracting 1.5% during 1H04, ending the year flat. Our Mexico-based economics team forecasts non-durable consumption spending growth to stabilize in 2H04, after a decelerating 1Q04 and a modest acceleration in 2Q04.
• In the current difficult operating environment, we believe revenue management and cost cutting will be even more critical to profit growth. Furthermore, we think industry consolidation could accelerate as economies of scale and financial resources become increasingly important competitive advantages.
• In the context of a weak bottling sector, we expect KOF to outperform Arca and Contal. In our view, KOF’s economies of scale, solid execution and revenue management capabilities give it a superior platform to outperform its peers in a highly competitive environment. We believe KOF has mostly contained the competitive threats, while Arca and Contal should begin to face intensifying competition from Kola Real in 1Q05. Also, KOF’s non-Mexican assets enjoy improving economic conditions and should post EBITDA growth faster than in Mexico. However, in our view, these positives are more than offset by new concerns that lead us to downgrade the stock to Hold from Buy. We now expect a significant increase in raw material costs in 2H04 and slower water volume growth. We also incorporate management’s warning on its 2Q04 results conference call that net cost synergies with Panamco would be US$20 million less than expected and that the expected US$50 million in savings from best practices should not be attainable in 2005.
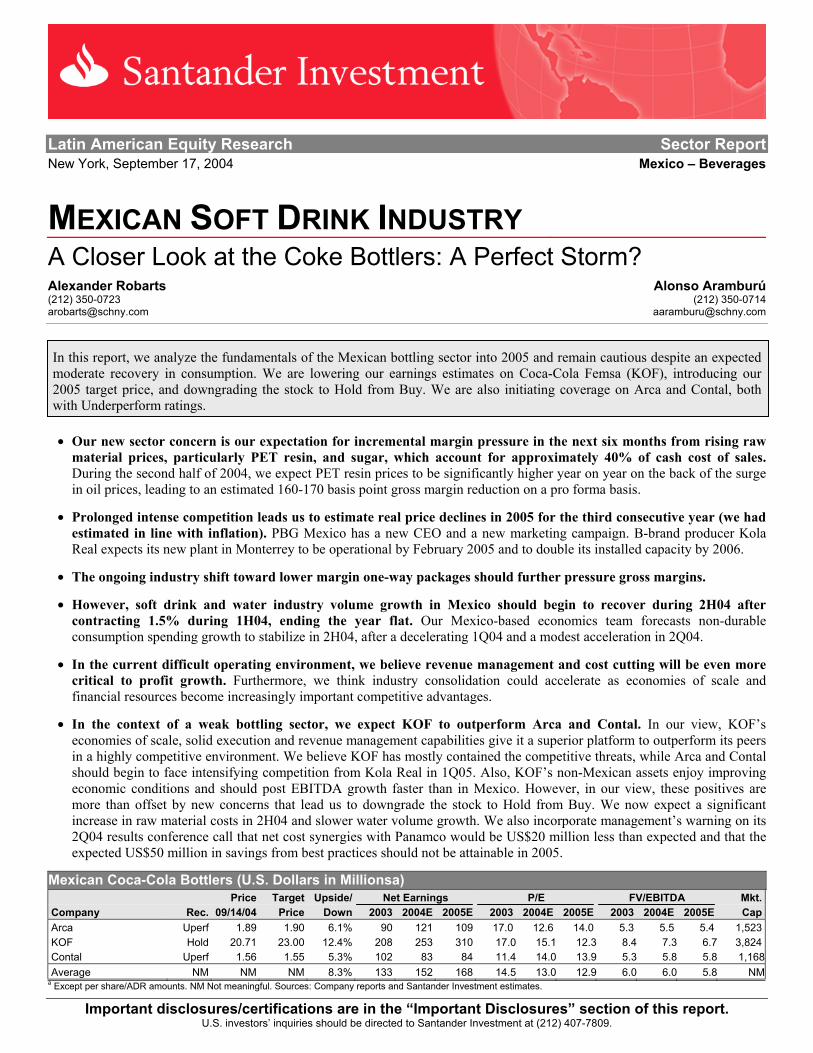
Mexican Coca-Cola Bottlers (U.S. Dollars in Millionsa) Price Target Upside/ Net Earnings P/E FV/EBITDA Mkt. Company Rec. 09/14/04 Price Down 2003 2004E 2005E 2003 2004E 2005E 2003 2004E 2005E Cap Arca Uperf 1.89 1.90 6.1% 90 121 109 17.0 12.6 14.0 5.3 5.5 5.4 1,523 KOF Hold 20.71 23.00 12.4% 208 253 310 17.0 15.1 12.3 8.4 7.3 6.7 3,824 Contal Uperf 1.56 1.55 5.3% 102 83 84 11.4 14.0 13.9 5.3 5.8 5.8 1,168 Average NM NM NM 8.3% 133 152 168 14.5 13.0 12.9 6.0 6.0 5.8 NMa Except per share/ADR amounts. NM Not meaningful. Sources: Company reports and Santander Investment estimates.
A Closer Look at the Coke Bottlers: A Perfect Storm
2 Important disclosures/certifications are in the “Important Disclosures” section of this report. U.S. investors’ inquiries should be directed to Santander Investment at (212) 407-7809.
TABLE OF CONTENTS
Water to Outpace Carbonated Soft Drinks ....................................................................... 4 Pricing Outlook: No Improvement Expected ................................................................... 7 Pepsi Bottling Group (PBG)............................................................................................. 7 Kola Real .......................................................................................................................... 8 Raw Material Prices to Pressure Gross Margins .............................................................. 9 Containing the Non-Returnable Packaging Trend.......................................................... 11 Industry Consolidation to Continue................................................................................ 12
Consumption Outlook............................................................................................................ 15 Arca........................................................................................................................................ 17
Financial Statements ................................................................................................. 22 Contal..................................................................................................................................... 25
Financial Statements ................................................................................................. 29
Coca-Cola Femsa................................................................................................................... 31 Financial Statements ................................................................................................. 36
Appendix A. Beverage Sector Valuations ............................................................................. 43
3Important disclosures/certifications are in the “Important Disclosures” section of this report. U.S. investors’ inquiries should be directed to Santander Investment Securities Inc. at (212) 407-7809.
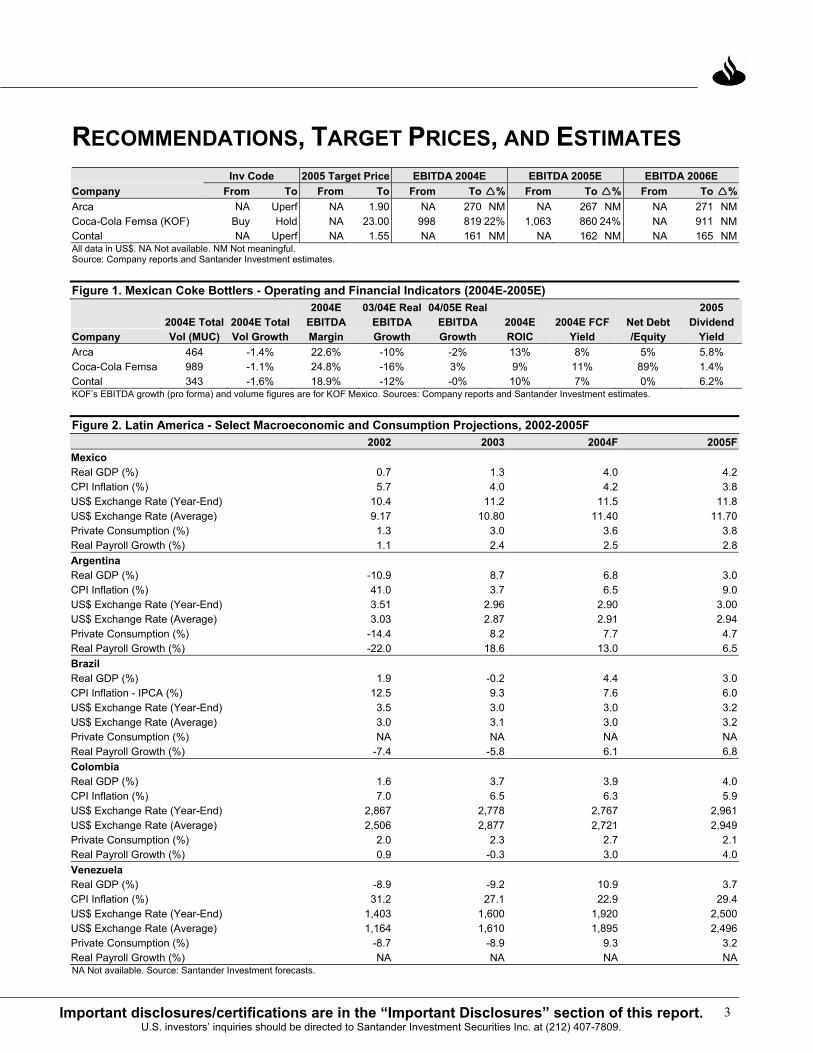
RECOMMENDATIONS, TARGET PRICES, AND ESTIMATES Inv Code 2005 Target Price EBITDA 2004E EBITDA 2005E EBITDA 2006E Company From To From To From To % From To % From To %Arca NA Uperf NA 1.90 NA 270 NM NA 267 NM NA 271 NMCoca-Cola Femsa (KOF) Buy Hold NA 23.00 998 819 22% 1,063 860 24% NA 911 NMContal NA Uperf NA 1.55 NA 161 NM NA 162 NM NA 165 NMAll data in US$. NA Not available. NM Not meaningful. Source: Company reports and Santander Investment estimates.
Figure 1. Mexican Coke Bottlers - Operating and Financial Indicators (2004E-2005E)
Company 2004E Total Vol (MUC)
2004E Total Vol Growth
2004E EBITDA Margin
03/04E Real EBITDA Growth
04/05E Real EBITDA Growth
2004E ROIC
2004E FCF Yield
Net Debt /Equity
2005 Dividend
Yield Arca 464 -1.4% 22.6% -10% -2% 13% 8% 5% 5.8% Coca-Cola Femsa 989 -1.1% 24.8% -16% 3% 9% 11% 89% 1.4% Contal 343 -1.6% 18.9% -12% -0% 10% 7% 0% 6.2% KOF’s EBITDA growth (pro forma) and volume figures are for KOF Mexico. Sources: Company reports and Santander Investment estimates.
Figure 2. Latin America - Select Macroeconomic and Consumption Projections, 2002-2005F 2002 2003 2004F 2005FMexico Real GDP (%) 0.7 1.3 4.0 4.2CPI Inflation (%) 5.7 4.0 4.2 3.8US$ Exchange Rate (Year-End) 10.4 11.2 11.5 11.8US$ Exchange Rate (Average) 9.17 10.80 11.40 11.70Private Consumption (%) 1.3 3.0 3.6 3.8Real Payroll Growth (%) 1.1 2.4 2.5 2.8Argentina Real GDP (%) -10.9 8.7 6.8 3.0CPI Inflation (%) 41.0 3.7 6.5 9.0US$ Exchange Rate (Year-End) 3.51 2.96 2.90 3.00US$ Exchange Rate (Average) 3.03 2.87 2.91 2.94Private Consumption (%) -14.4 8.2 7.7 4.7Real Payroll Growth (%) -22.0 18.6 13.0 6.5Brazil Real GDP (%) 1.9 -0.2 4.4 3.0CPI Inflation - IPCA (%) 12.5 9.3 7.6 6.0US$ Exchange Rate (Year-End) 3.5 3.0 3.0 3.2US$ Exchange Rate (Average) 3.0 3.1 3.0 3.2Private Consumption (%) NA NA NA NAReal Payroll Growth (%) -7.4 -5.8 6.1 6.8Colombia Real GDP (%) 1.6 3.7 3.9 4.0CPI Inflation (%) 7.0 6.5 6.3 5.9US$ Exchange Rate (Year-End) 2,867 2,778 2,767 2,961US$ Exchange Rate (Average) 2,506 2,877 2,721 2,949Private Consumption (%) 2.0 2.3 2.7 2.1Real Payroll Growth (%) 0.9 -0.3 3.0 4.0Venezuela Real GDP (%) -8.9 -9.2 10.9 3.7CPI Inflation (%) 31.2 27.1 22.9 29.4US$ Exchange Rate (Year-End) 1,403 1,600 1,920 2,500US$ Exchange Rate (Average) 1,164 1,610 1,895 2,496Private Consumption (%) -8.7 -8.9 9.3 3.2Real Payroll Growth (%) NA NA NA NANA Not available. Source: Santander Investment forecasts.

A Closer Look at the Coke Bottlers: A Perfect Storm
4 Important disclosures/certifications are in the “Important Disclosures” section of this report. U.S. investors’ inquiries should be directed to Santander Investment at (212) 407-7809.
MEXICAN BOTTLING INDUSTRY OVERVIEW We expect Mexico’s soft drink and water industry volume sales to stabilize in 2H04 after contracting (about 1.5%) during the past two consecutive quarters for the first time in many years. By 2005, industry volumes should begin to accelerate modestly after several years of deceleration. According to our data, total soft drink and water industry volume sales grew at an average annual pace of 4.7% between 1999 and 2003, reaching 3.1 billion unit cases by 2003, 20% more than in 1999. However, this growth has two distinct stages. First, between 1999 and 2001, when macroeconomic indicators were relatively strong and competition was relatively tame, average annual volume growth was 7.8%. The second stage is between 2001 and 2003, when job losses were rampant and competition increased with the entrance of both Kola Real and the Pepsi Bottling Group (PBG). In this period, average annual volume growth decelerated considerably to an average of 1.8%. For 2004, we expect industry growth to be flat and reach 2.0% in 2005, for an average growth of 1% over these two years.
Figure 3. Soft Drink and Water Volume Growth in Millions of Unit Cases (1999-2005E)
-8%-6%-4%-2%0%2%4%6%8%
10%12%14%
1Q01
2Q01
3Q01
4Q01
1Q02
2Q02
3Q02
4Q02
1Q03
2Q03
3Q03
4Q03
1Q04
2Q04
2004
E
2005
E
Industry KOF Mx ARCA Contal PBG
Note: Arca volumes do not include jug water. PBG began operations in Mexico at end of 2002. Sources: Company Reports, INEGI and Santander Investment estimates.
While the largest Coke bottlers in Mexico – Arca, Contal and KOF – mostly outperformed the decelerating period from 2001 to 2003, they underperformed during 1H04. During the 2001-2003 period, their outperformance versus the industry was supported by economies of scale and marketing muscle relative to the smaller Coca-Cola and PepsiCo bottlers in Mexico, in our view. Another factor could be the relative weakness of the competition. However, the underperformance in 1H04 suggests that their average selling prices may still be too high in light of the persistent competition from PBG and B-brands, including Kola Real. We also note that jug water volume growth at Arca and KOF have been particularly negatively impacted as they both seek to increase profitability in that category through price adjustments and outright distribution route closures.
WATER TO OUTPACE CARBONATED SOFT DRINKS We expect water to continue to be the fastest growing category in Mexico’s non-alcoholic beverage industry, while colas (rather than flavor carbonated drinks) should continue to be the laggards. This has been the trend for the past five years. As a result, colas’ share of the beverage industry has declined from 54% in 1999 to 47% in 2003. Meanwhile, purified water’s share of the total market volume has increased from 17% to 24% between 1999 and 2003.
Total industry volume growth contracted in 1H04, but only a modest recovery is expected.
Are selling prices too high?
Industry Ave Volume Growth 2001-2003: 1.8% 2003-2005E: 1.0%
5Important disclosures/certifications are in the “Important Disclosures” section of this report. U.S. investors’ inquiries should be directed to Santander Investment Securities Inc. at (212) 407-7809.
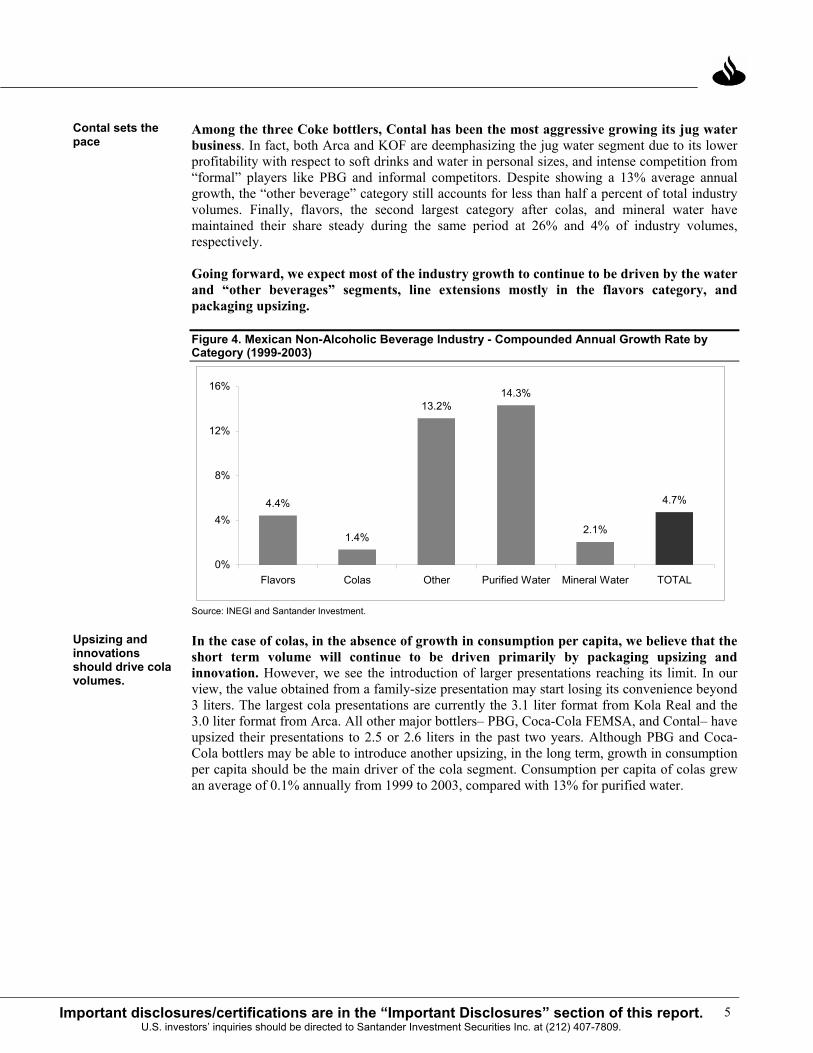
Among the three Coke bottlers, Contal has been the most aggressive growing its jug water business. In fact, both Arca and KOF are deemphasizing the jug water segment due to its lower profitability with respect to soft drinks and water in personal sizes, and intense competition from “formal” players like PBG and informal competitors. Despite showing a 13% average annual growth, the “other beverage” category still accounts for less than half a percent of total industry volumes. Finally, flavors, the second largest category after colas, and mineral water have maintained their share steady during the same period at 26% and 4% of industry volumes, respectively.
Going forward, we expect most of the industry growth to continue to be driven by the water and “other beverages” segments, line extensions mostly in the flavors category, and packaging upsizing.
Figure 4. Mexican Non-Alcoholic Beverage Industry - Compounded Annual Growth Rate by Category (1999-2003)
4.4%
1.4%
13.2%14.3%
2.1%
4.7%
0%
4%
8%
12%
16%
Flavors Colas Other Purified Water Mineral Water TOTAL
Source: INEGI and Santander Investment.
In the case of colas, in the absence of growth in consumption per capita, we believe that the short term volume will continue to be driven primarily by packaging upsizing and innovation. However, we see the introduction of larger presentations reaching its limit. In our view, the value obtained from a family-size presentation may start losing its convenience beyond 3 liters. The largest cola presentations are currently the 3.1 liter format from Kola Real and the 3.0 liter format from Arca. All other major bottlers– PBG, Coca-Cola FEMSA, and Contal– have upsized their presentations to 2.5 or 2.6 liters in the past two years. Although PBG and Coca-Cola bottlers may be able to introduce another upsizing, in the long term, growth in consumption per capita should be the main driver of the cola segment. Consumption per capita of colas grew an average of 0.1% annually from 1999 to 2003, compared with 13% for purified water.
Contal sets the pace
Upsizing and innovations should drive cola volumes.
A Closer Look at the Coke Bottlers: A Perfect Storm
6 Important disclosures/certifications are in the “Important Disclosures” section of this report. U.S. investors’ inquiries should be directed to Santander Investment at (212) 407-7809.
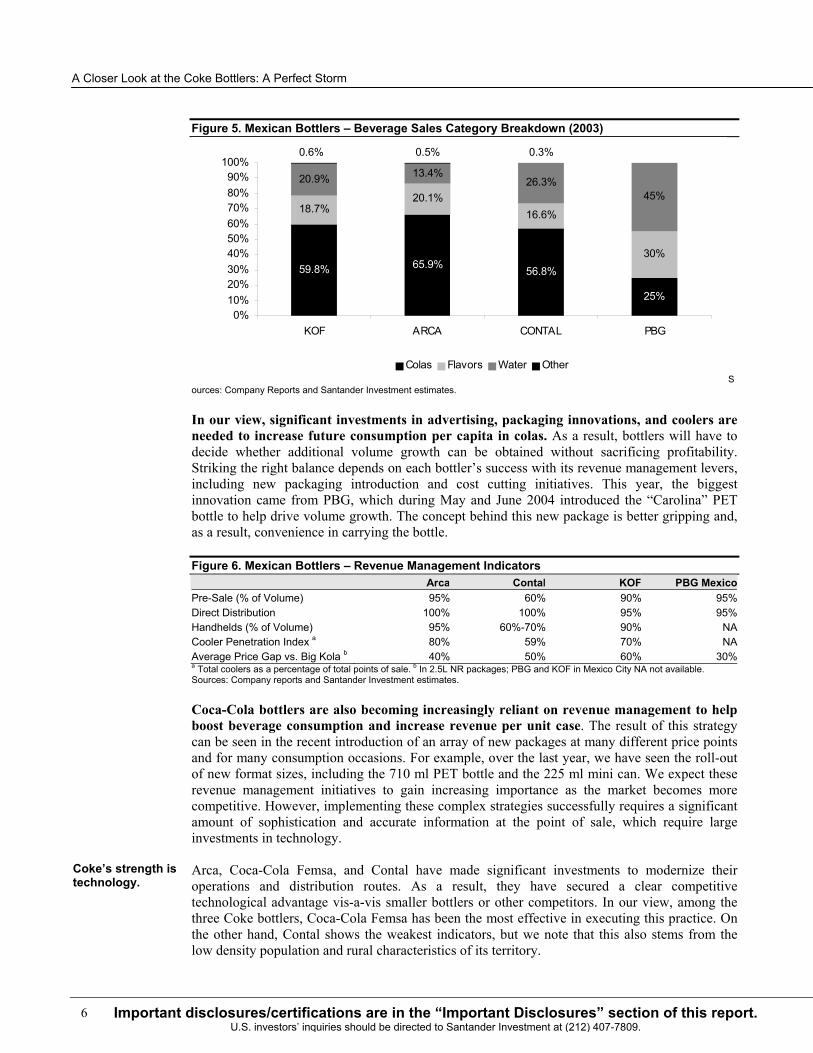
Figure 5. Mexican Bottlers – Beverage Sales Category Breakdown (2003)
59.8% 65.9% 56.8%
25%
18.7%20.1%
16.6%
30%
20.9% 13.4%26.3%
45%
0.6% 0.5% 0.3%
0%10%20%30%40%50%60%70%80%90%
100%
KOF ARCA CONTAL PBG
Colas Flavors Water OtherS
ources: Company Reports and Santander Investment estimates.
In our view, significant investments in advertising, packaging innovations, and coolers are needed to increase future consumption per capita in colas. As a result, bottlers will have to decide whether additional volume growth can be obtained without sacrificing profitability. Striking the right balance depends on each bottler’s success with its revenue management levers, including new packaging introduction and cost cutting initiatives. This year, the biggest innovation came from PBG, which during May and June 2004 introduced the “Carolina” PET bottle to help drive volume growth. The concept behind this new package is better gripping and, as a result, convenience in carrying the bottle.
Figure 6. Mexican Bottlers – Revenue Management Indicators Arca Contal KOF PBG MexicoPre-Sale (% of Volume) 95% 60% 90% 95%Direct Distribution 100% 100% 95% 95%Handhelds (% of Volume) 95% 60%-70% 90% NACooler Penetration Index a 80% 59% 70% NAAverage Price Gap vs. Big Kola b 40% 50% 60% 30%a Total coolers as a percentage of total points of sale. b In 2.5L NR packages; PBG and KOF in Mexico City NA not available. Sources: Company reports and Santander Investment estimates.
Coca-Cola bottlers are also becoming increasingly reliant on revenue management to help boost beverage consumption and increase revenue per unit case. The result of this strategy can be seen in the recent introduction of an array of new packages at many different price points and for many consumption occasions. For example, over the last year, we have seen the roll-out of new format sizes, including the 710 ml PET bottle and the 225 ml mini can. We expect these revenue management initiatives to gain increasing importance as the market becomes more competitive. However, implementing these complex strategies successfully requires a significant amount of sophistication and accurate information at the point of sale, which require large investments in technology.
Arca, Coca-Cola Femsa, and Contal have made significant investments to modernize their operations and distribution routes. As a result, they have secured a clear competitive technological advantage vis-a-vis smaller bottlers or other competitors. In our view, among the three Coke bottlers, Coca-Cola Femsa has been the most effective in executing this practice. On the other hand, Contal shows the weakest indicators, but we note that this also stems from the low density population and rural characteristics of its territory.
Coke’s strength is technology.
7Important disclosures/certifications are in the “Important Disclosures” section of this report. U.S. investors’ inquiries should be directed to Santander Investment Securities Inc. at (212) 407-7809.
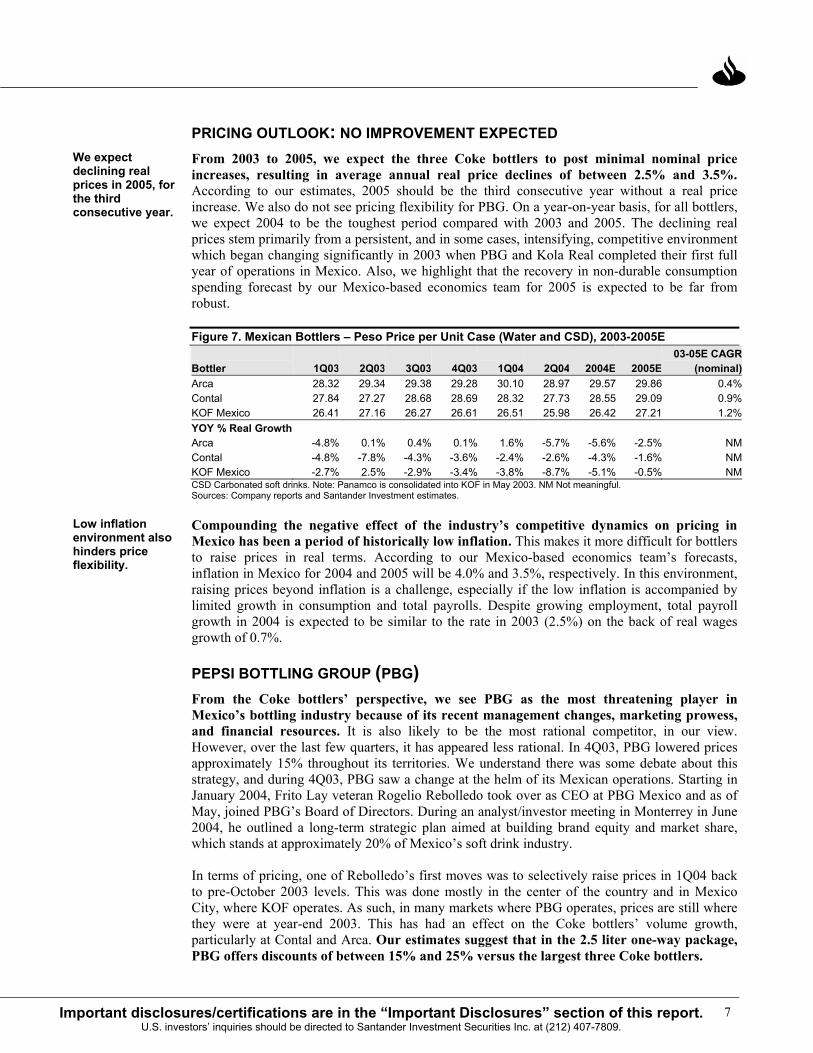
PRICING OUTLOOK: NO IMPROVEMENT EXPECTED From 2003 to 2005, we expect the three Coke bottlers to post minimal nominal price increases, resulting in average annual real price declines of between 2.5% and 3.5%. According to our estimates, 2005 should be the third consecutive year without a real price increase. We also do not see pricing flexibility for PBG. On a year-on-year basis, for all bottlers, we expect 2004 to be the toughest period compared with 2003 and 2005. The declining real prices stem primarily from a persistent, and in some cases, intensifying, competitive environment which began changing significantly in 2003 when PBG and Kola Real completed their first full year of operations in Mexico. Also, we highlight that the recovery in non-durable consumption spending forecast by our Mexico-based economics team for 2005 is expected to be far from robust.
Figure 7. Mexican Bottlers – Peso Price per Unit Case (Water and CSD), 2003-2005E Bottler 1Q03 2Q03 3Q03 4Q03 1Q04 2Q04 2004E 2005E
03-05E CAGR(nominal)
Arca 28.32 29.34 29.38 29.28 30.10 28.97 29.57 29.86 0.4%Contal 27.84 27.27 28.68 28.69 28.32 27.73 28.55 29.09 0.9%KOF Mexico 26.41 27.16 26.27 26.61 26.51 25.98 26.42 27.21 1.2%YOY % Real Growth Arca -4.8% 0.1% 0.4% 0.1% 1.6% -5.7% -5.6% -2.5% NMContal -4.8% -7.8% -4.3% -3.6% -2.4% -2.6% -4.3% -1.6% NMKOF Mexico -2.7% 2.5% -2.9% -3.4% -3.8% -8.7% -5.1% -0.5% NMCSD Carbonated soft drinks. Note: Panamco is consolidated into KOF in May 2003. NM Not meaningful. Sources: Company reports and Santander Investment estimates.
Compounding the negative effect of the industry’s competitive dynamics on pricing in Mexico has been a period of historically low inflation. This makes it more difficult for bottlers to raise prices in real terms. According to our Mexico-based economics team’s forecasts, inflation in Mexico for 2004 and 2005 will be 4.0% and 3.5%, respectively. In this environment, raising prices beyond inflation is a challenge, especially if the low inflation is accompanied by limited growth in consumption and total payrolls. Despite growing employment, total payroll growth in 2004 is expected to be similar to the rate in 2003 (2.5%) on the back of real wages growth of 0.7%.
PEPSI BOTTLING GROUP (PBG) From the Coke bottlers’ perspective, we see PBG as the most threatening player in Mexico’s bottling industry because of its recent management changes, marketing prowess, and financial resources. It is also likely to be the most rational competitor, in our view. However, over the last few quarters, it has appeared less rational. In 4Q03, PBG lowered prices approximately 15% throughout its territories. We understand there was some debate about this strategy, and during 4Q03, PBG saw a change at the helm of its Mexican operations. Starting in January 2004, Frito Lay veteran Rogelio Rebolledo took over as CEO at PBG Mexico and as of May, joined PBG’s Board of Directors. During an analyst/investor meeting in Monterrey in June 2004, he outlined a long-term strategic plan aimed at building brand equity and market share, which stands at approximately 20% of Mexico’s soft drink industry.
In terms of pricing, one of Rebolledo’s first moves was to selectively raise prices in 1Q04 back to pre-October 2003 levels. This was done mostly in the center of the country and in Mexico City, where KOF operates. As such, in many markets where PBG operates, prices are still where they were at year-end 2003. This has had an effect on the Coke bottlers’ volume growth, particularly at Contal and Arca. Our estimates suggest that in the 2.5 liter one-way package, PBG offers discounts of between 15% and 25% versus the largest three Coke bottlers.
We expect declining real prices in 2005, for the third consecutive year.
Low inflation environment also hinders price flexibility.
A Closer Look at the Coke Bottlers: A Perfect Storm
8 Important disclosures/certifications are in the “Important Disclosures” section of this report. U.S. investors’ inquiries should be directed to Santander Investment at (212) 407-7809.
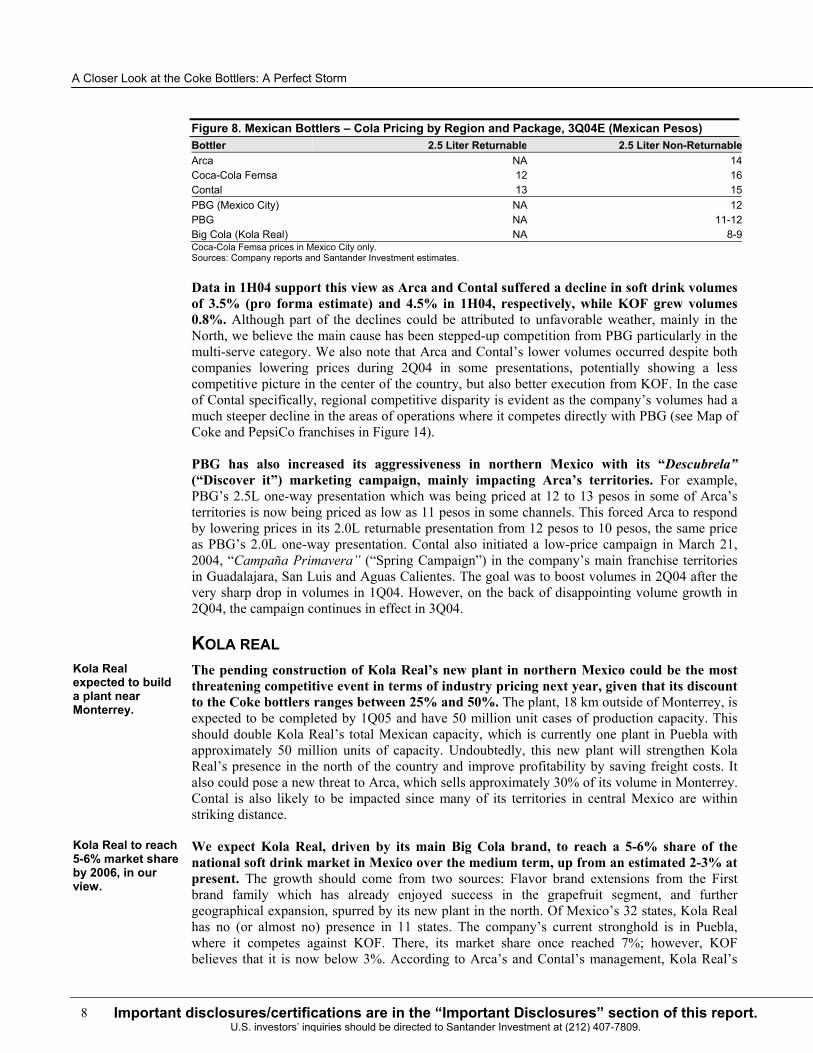
Figure 8. Mexican Bottlers – Cola Pricing by Region and Package, 3Q04E (Mexican Pesos) Bottler 2.5 Liter Returnable 2.5 Liter Non-ReturnableArca NA 14Coca-Cola Femsa 12 16Contal 13 15PBG (Mexico City) NA 12PBG NA 11-12Big Cola (Kola Real) NA 8-9Coca-Cola Femsa prices in Mexico City only. Sources: Company reports and Santander Investment estimates.
Data in 1H04 support this view as Arca and Contal suffered a decline in soft drink volumes of 3.5% (pro forma estimate) and 4.5% in 1H04, respectively, while KOF grew volumes 0.8%. Although part of the declines could be attributed to unfavorable weather, mainly in the North, we believe the main cause has been stepped-up competition from PBG particularly in the multi-serve category. We also note that Arca and Contal’s lower volumes occurred despite both companies lowering prices during 2Q04 in some presentations, potentially showing a less competitive picture in the center of the country, but also better execution from KOF. In the case of Contal specifically, regional competitive disparity is evident as the company’s volumes had a much steeper decline in the areas of operations where it competes directly with PBG (see Map of Coke and PepsiCo franchises in Figure 14).
PBG has also increased its aggressiveness in northern Mexico with its “Descubrela” (“Discover it”) marketing campaign, mainly impacting Arca’s territories. For example, PBG’s 2.5L one-way presentation which was being priced at 12 to 13 pesos in some of Arca’s territories is now being priced as low as 11 pesos in some channels. This forced Arca to respond by lowering prices in its 2.0L returnable presentation from 12 pesos to 10 pesos, the same price as PBG’s 2.0L one-way presentation. Contal also initiated a low-price campaign in March 21, 2004, “Campaña Primavera” (“Spring Campaign”) in the company’s main franchise territories in Guadalajara, San Luis and Aguas Calientes. The goal was to boost volumes in 2Q04 after the very sharp drop in volumes in 1Q04. However, on the back of disappointing volume growth in 2Q04, the campaign continues in effect in 3Q04.
KOLA REAL The pending construction of Kola Real’s new plant in northern Mexico could be the most threatening competitive event in terms of industry pricing next year, given that its discount to the Coke bottlers ranges between 25% and 50%. The plant, 18 km outside of Monterrey, is expected to be completed by 1Q05 and have 50 million unit cases of production capacity. This should double Kola Real’s total Mexican capacity, which is currently one plant in Puebla with approximately 50 million units of capacity. Undoubtedly, this new plant will strengthen Kola Real’s presence in the north of the country and improve profitability by saving freight costs. It also could pose a new threat to Arca, which sells approximately 30% of its volume in Monterrey. Contal is also likely to be impacted since many of its territories in central Mexico are within striking distance.
We expect Kola Real, driven by its main Big Cola brand, to reach a 5-6% share of the national soft drink market in Mexico over the medium term, up from an estimated 2-3% at present. The growth should come from two sources: Flavor brand extensions from the First brand family which has already enjoyed success in the grapefruit segment, and further geographical expansion, spurred by its new plant in the north. Of Mexico’s 32 states, Kola Real has no (or almost no) presence in 11 states. The company’s current stronghold is in Puebla, where it competes against KOF. There, its market share once reached 7%; however, KOF believes that it is now below 3%. According to Arca’s and Contal’s management, Kola Real’s
Kola Real expected to build a plant near Monterrey.
Kola Real to reach 5-6% market share by 2006, in our view.
9Important disclosures/certifications are in the “Important Disclosures” section of this report. U.S. investors’ inquiries should be directed to Santander Investment Securities Inc. at (212) 407-7809.
market share is less than 3% in the territories where they overlap. We estimate that Kola Real is present in approximately 75% of Contal and Arca’s territories and 100% in KOF’s territories.
Over the longer term, we see Kola Real’s growth in Mexico constrained by the industry’s structure and its lack of a direct point of sale distribution network. First, and mainly, without a fleet of trucks and a pre-sale system, building relations with the majority of the points of sales is very difficult. That makes B-brand producers including Kola Real dependent on supermarkets for volume growth. Currently, supermarkets account for approximately 20% of Kola Real’s volume sales. However, Mexico’s industry is characterized by a very low penetration of supermarkets, which should continue to limit the ability of Kola Real to reach the mass market efficiently. In Mexico, supermarkets account for less than 4% of total volume sold. As a result, reaching a larger number of consumers requires large investments in distribution assets, something that to date only the largest Coke and PepsiCo bottlers can afford.
Second, the absence of soft drink excise taxes in Mexico puts every bottler on an equal footing. In markets such as Brazil, where B-brands have market shares above 30%, many B-brand producers gain a cost advantage by paying fewer taxes due to the difficulty in collecting from small producers. Finally, although to a lesser extent, the high proportion of returnable packages puts a ceiling on the market for B-brands, as they rely almost exclusively on non-returnable presentations. As discussed later in this report, we continue to see a significant shift towards one-way packaging in Mexico. However, we think the Mexican market is many years away from reaching the levels of one-way packaging seen in countries like Brazil.
We have recently seen more targeted, higher profile efforts in Kola Real’s advertising to increase brand awareness and gain consumer loyalty. Kola Real recently sponsored Big Brother’s Spanish version in Mexico, a program drawing a big audience of young consumers. It is also planning to advertise in Mexico’s upcoming Teleton, a high profile national charity event. Previously, Kola Real had relied mainly on price as its main marketing tool and advertising had focused on emphasizing this advantage. We view Kola Real’s new advertising strategy as an important step towards obtaining consumer loyalty, a crucial attribute to boost market share.
Over the long term, this advertising strategy may diminish its low operating cost advantage, which helps it to sustain deep discounts to the Coke bottlers. Although we understand that there has not been any increase in Kola Real’s advertising budget, in our view, a campaign designed to increase brand loyalty will require increasing and continued amounts of advertising in the medium to long term to be effective. This added cost could eat into the company’s margins if prices are maintained at low levels.
RAW MATERIAL PRICES TO PRESSURE GROSS MARGINS We estimate that on a year on year basis, 2H04 will likely show higher raw material price increases than in 1H04, particularly for PET and sugar, putting additional pressure on gross margins. We estimate PET and sugar represent approximately 40% of total cash cost of sales for bottlers. Therefore, movements in the prices of these raw materials can significantly impact on gross margins. Our conclusion is that Coke bottlers Arca, Contal and KOF (Mexico) will experience double-digit increases in raw material prices during the second half of 2004 on a year-on-year basis. The annual impact should correspond to almost 4% of cash cost of sales and reduce the bottlers’ gross margins between 160 and 170 basis points on a stand alone basis.
B-brands do have their limits in Mexico.
Kola Real’s new marketing push.
Sugar and PET represent 40% of cost of sales.
A Closer Look at the Coke Bottlers: A Perfect Storm
10 Important disclosures/certifications are in the “Important Disclosures” section of this report. U.S. investors’ inquiries should be directed to Santander Investment at (212) 407-7809.
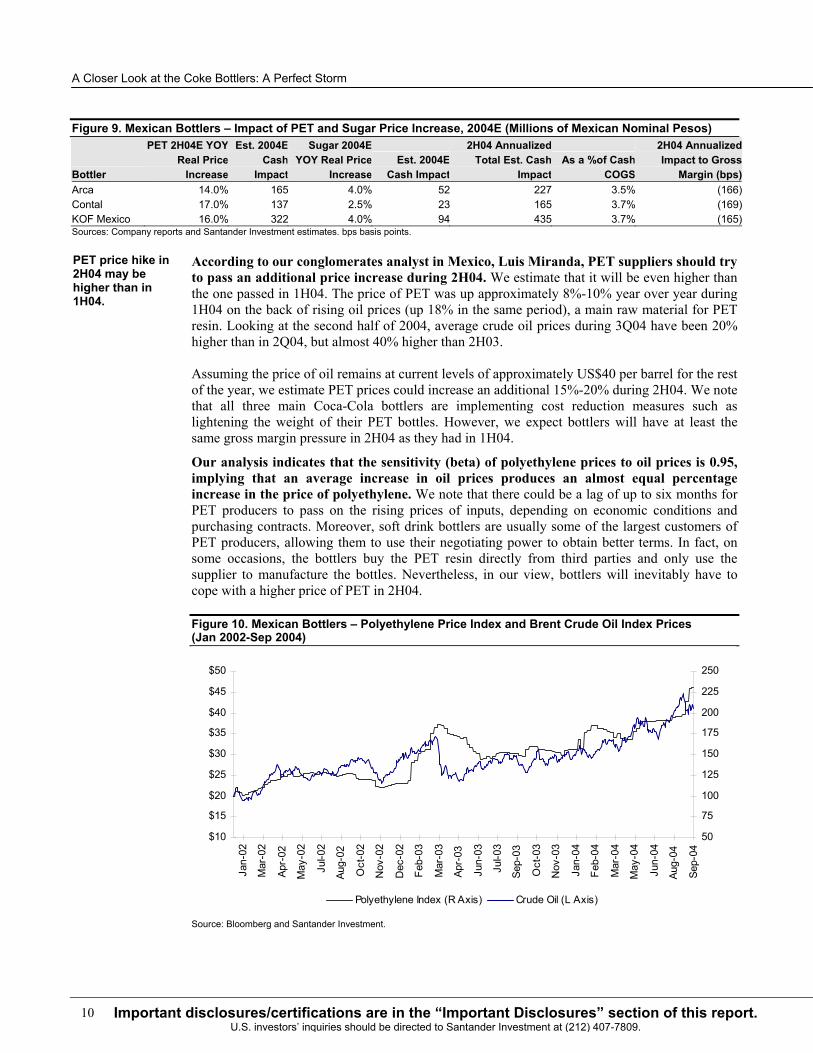
Figure 9. Mexican Bottlers – Impact of PET and Sugar Price Increase, 2004E (Millions of Mexican Nominal Pesos)
Bottler
PET 2H04E YOY Real Price
Increase
Est. 2004E Cash
Impact
Sugar 2004EYOY Real Price
IncreaseEst. 2004E
Cash Impact
2H04 Annualized Total Est. Cash
ImpactAs a %of Cash
COGS
2H04 Annualized Impact to Gross
Margin (bps)Arca 14.0% 165 4.0% 52 227 3.5% (166)Contal 17.0% 137 2.5% 23 165 3.7% (169)KOF Mexico 16.0% 322 4.0% 94 435 3.7% (165)Sources: Company reports and Santander Investment estimates. bps basis points.
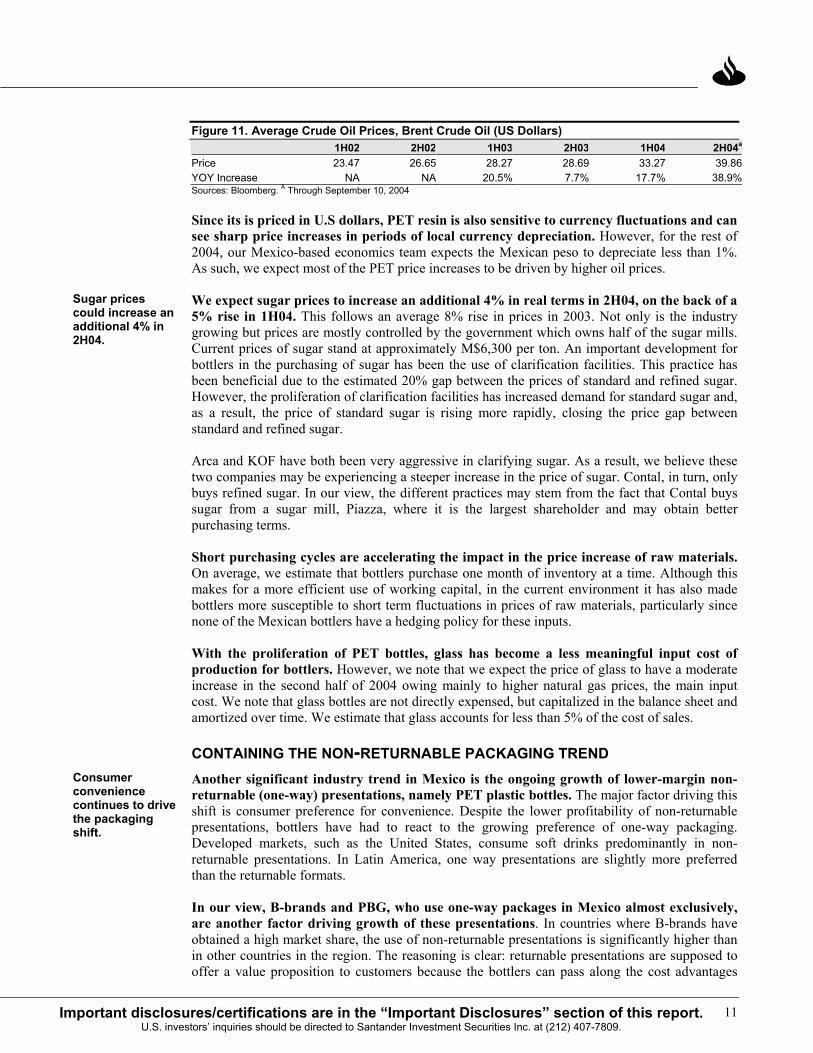
According to our conglomerates analyst in Mexico, Luis Miranda, PET suppliers should try to pass an additional price increase during 2H04. We estimate that it will be even higher than the one passed in 1H04. The price of PET was up approximately 8%-10% year over year during 1H04 on the back of rising oil prices (up 18% in the same period), a main raw material for PET resin. Looking at the second half of 2004, average crude oil prices during 3Q04 have been 20% higher than in 2Q04, but almost 40% higher than 2H03.
Assuming the price of oil remains at current levels of approximately US$40 per barrel for the rest of the year, we estimate PET prices could increase an additional 15%-20% during 2H04. We note that all three main Coca-Cola bottlers are implementing cost reduction measures such as lightening the weight of their PET bottles. However, we expect bottlers will have at least the same gross margin pressure in 2H04 as they had in 1H04.
Our analysis indicates that the sensitivity (beta) of polyethylene prices to oil prices is 0.95, implying that an average increase in oil prices produces an almost equal percentage increase in the price of polyethylene. We note that there could be a lag of up to six months for PET producers to pass on the rising prices of inputs, depending on economic conditions and purchasing contracts. Moreover, soft drink bottlers are usually some of the largest customers of PET producers, allowing them to use their negotiating power to obtain better terms. In fact, on some occasions, the bottlers buy the PET resin directly from third parties and only use the supplier to manufacture the bottles. Nevertheless, in our view, bottlers will inevitably have to cope with a higher price of PET in 2H04.
Figure 10. Mexican Bottlers – Polyethylene Price Index and Brent Crude Oil Index Prices (Jan 2002-Sep 2004)
50
75
100
125
150
175
200
225
250
Sep-
04
Aug-
04
Jun-
04
May
-04
Mar
-04
Feb-
04
Jan-
04
Nov
-03
Oct
-03
Sep-
03
Jul-0
3
Jun-
03
Apr-
03
Mar
-03
Feb-
03
Dec
-02
Nov
-02
Oct
-02
Aug-
02
Jul-0
2
May
-02
Apr-
02
Mar
-02
Jan-
02
$10
$15
$20
$25
$30
$35
$40
$45
$50
Polyethylene Index (R Axis) Crude Oil (L Axis)
Source: Bloomberg and Santander Investment.
PET price hike in 2H04 may be higher than in 1H04.
11Important disclosures/certifications are in the “Important Disclosures” section of this report. U.S. investors’ inquiries should be directed to Santander Investment Securities Inc. at (212) 407-7809.
Figure 11. Average Crude Oil Prices, Brent Crude Oil (US Dollars) 1H02 2H02 1H03 2H03 1H04 2H04a
Price 23.47 26.65 28.27 28.69 33.27 39.86 YOY Increase NA NA 20.5% 7.7% 17.7% 38.9%Sources: Bloomberg. A Through September 10, 2004
Since its is priced in U.S dollars, PET resin is also sensitive to currency fluctuations and can see sharp price increases in periods of local currency depreciation. However, for the rest of 2004, our Mexico-based economics team expects the Mexican peso to depreciate less than 1%. As such, we expect most of the PET price increases to be driven by higher oil prices.
We expect sugar prices to increase an additional 4% in real terms in 2H04, on the back of a 5% rise in 1H04. This follows an average 8% rise in prices in 2003. Not only is the industry growing but prices are mostly controlled by the government which owns half of the sugar mills. Current prices of sugar stand at approximately M$6,300 per ton. An important development for bottlers in the purchasing of sugar has been the use of clarification facilities. This practice has been beneficial due to the estimated 20% gap between the prices of standard and refined sugar. However, the proliferation of clarification facilities has increased demand for standard sugar and, as a result, the price of standard sugar is rising more rapidly, closing the price gap between standard and refined sugar.
Arca and KOF have both been very aggressive in clarifying sugar. As a result, we believe these two companies may be experiencing a steeper increase in the price of sugar. Contal, in turn, only buys refined sugar. In our view, the different practices may stem from the fact that Contal buys sugar from a sugar mill, Piazza, where it is the largest shareholder and may obtain better purchasing terms.
Short purchasing cycles are accelerating the impact in the price increase of raw materials. On average, we estimate that bottlers purchase one month of inventory at a time. Although this makes for a more efficient use of working capital, in the current environment it has also made bottlers more susceptible to short term fluctuations in prices of raw materials, particularly since none of the Mexican bottlers have a hedging policy for these inputs.
With the proliferation of PET bottles, glass has become a less meaningful input cost of production for bottlers. However, we note that we expect the price of glass to have a moderate increase in the second half of 2004 owing mainly to higher natural gas prices, the main input cost. We note that glass bottles are not directly expensed, but capitalized in the balance sheet and amortized over time. We estimate that glass accounts for less than 5% of the cost of sales.
CONTAINING THE NON-RETURNABLE PACKAGING TREND Another significant industry trend in Mexico is the ongoing growth of lower-margin non-returnable (one-way) presentations, namely PET plastic bottles. The major factor driving this shift is consumer preference for convenience. Despite the lower profitability of non-returnable presentations, bottlers have had to react to the growing preference of one-way packaging. Developed markets, such as the United States, consume soft drinks predominantly in non-returnable presentations. In Latin America, one way presentations are slightly more preferred than the returnable formats.
In our view, B-brands and PBG, who use one-way packages in Mexico almost exclusively, are another factor driving growth of these presentations. In countries where B-brands have obtained a high market share, the use of non-returnable presentations is significantly higher than in other countries in the region. The reasoning is clear: returnable presentations are supposed to offer a value proposition to customers because the bottlers can pass along the cost advantages
Sugar prices could increase an additional 4% in 2H04.
Consumer convenience continues to drive the packaging shift.
A Closer Look at the Coke Bottlers: A Perfect Storm
12 Important disclosures/certifications are in the “Important Disclosures” section of this report. U.S. investors’ inquiries should be directed to Santander Investment at (212) 407-7809.
(relative to one-ways) since the packages can be reused a number of times. This makes returnables typically more profitable than one-ways. However, since B-brand producers price their one-way products at a discount to the leaders’ comparable size returnable presentations, the value proposition from returnable packages is lost. This, in turn, forces the Coke bottlers to continue shifting away from their high margin returnable presentations in Mexico, hindering profit growth.
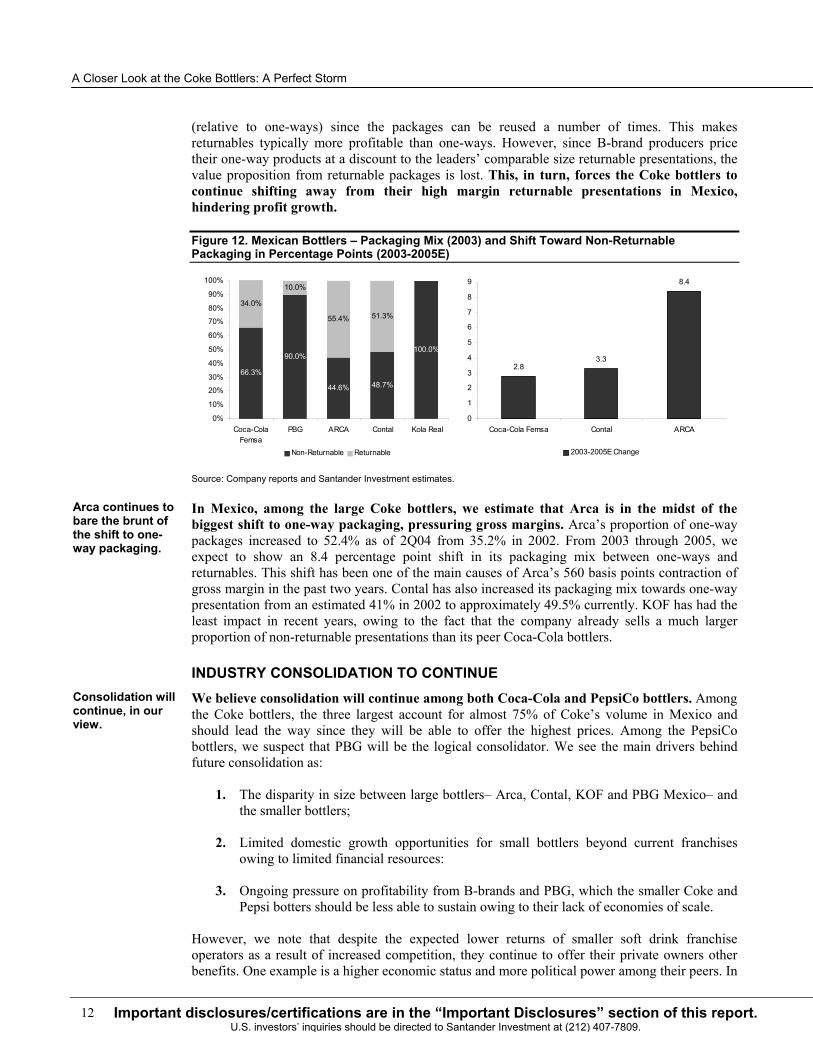
Figure 12. Mexican Bottlers – Packaging Mix (2003) and Shift Toward Non-Returnable Packaging in Percentage Points (2003-2005E)
66.3%
90.0%
44.6% 48.7%
100.0%
34.0%
10.0%
55.4% 51.3%
0%
10%
20%
30%
40%
50%
60%
70%
80%
90%
100%
Coca-ColaFemsa
PBG ARCA Contal Kola Real
Non-Returnable Returnable
2.83.3
8.4
0
1
2
3
4
5
6
7
8
9
Coca-Cola Femsa Contal ARCA
2003-2005E Change
Source: Company reports and Santander Investment estimates.
In Mexico, among the large Coke bottlers, we estimate that Arca is in the midst of the biggest shift to one-way packaging, pressuring gross margins. Arca’s proportion of one-way packages increased to 52.4% as of 2Q04 from 35.2% in 2002. From 2003 through 2005, we expect to show an 8.4 percentage point shift in its packaging mix between one-ways and returnables. This shift has been one of the main causes of Arca’s 560 basis points contraction of gross margin in the past two years. Contal has also increased its packaging mix towards one-way presentation from an estimated 41% in 2002 to approximately 49.5% currently. KOF has had the least impact in recent years, owing to the fact that the company already sells a much larger proportion of non-returnable presentations than its peer Coca-Cola bottlers.
INDUSTRY CONSOLIDATION TO CONTINUE We believe consolidation will continue among both Coca-Cola and PepsiCo bottlers. Among the Coke bottlers, the three largest account for almost 75% of Coke’s volume in Mexico and should lead the way since they will be able to offer the highest prices. Among the PepsiCo bottlers, we suspect that PBG will be the logical consolidator. We see the main drivers behind future consolidation as:
1. The disparity in size between large bottlers– Arca, Contal, KOF and PBG Mexico– and the smaller bottlers;
2. Limited domestic growth opportunities for small bottlers beyond current franchises owing to limited financial resources:
3. Ongoing pressure on profitability from B-brands and PBG, which the smaller Coke and Pepsi botters should be less able to sustain owing to their lack of economies of scale.
However, we note that despite the expected lower returns of smaller soft drink franchise operators as a result of increased competition, they continue to offer their private owners other benefits. One example is a higher economic status and more political power among their peers. In
Arca continues to bare the brunt of the shift to one-way packaging.
Consolidation will continue, in our view.
13Important disclosures/certifications are in the “Important Disclosures” section of this report. U.S. investors’ inquiries should be directed to Santander Investment Securities Inc. at (212) 407-7809.
our view, this may make negotiations more difficult and may slow the consolidation process, but not stop it. Recent consolidation activity such as Arca’s acquisition of the Meoqui Coca-Cola franchise in 1Q04 and the merger of Geusa and Bret (PepsiCo bottlers), also in 2Q04, support this view. An Arca/Contal business combination has also been subject to market rumors in the recent past.
The Geusa and Bret combination: These two PepsiCo bottlers recently merged. The combined annual sales of both companies represent an estimated 28% of the sales of PepsiCo products in Mexico (or 160 million unit cases), compared with PBG’s estimated 63% of sales. Bret covers the territories of Puebla, Oaxaca, Veracruz and Tabasco, while Geusa operates in Nayarit, Jalisco, Colima, Michoacan and Guanajuato. We also would not discard the entrance of a third party, such as AmBev, into a potential transaction in the near future. We note that Ambev has used the acquisition of PepsiCo bottlers to enter new markets in the past (Peru, Central America and the Dominican Republic) and is keen to operate in Mexico.
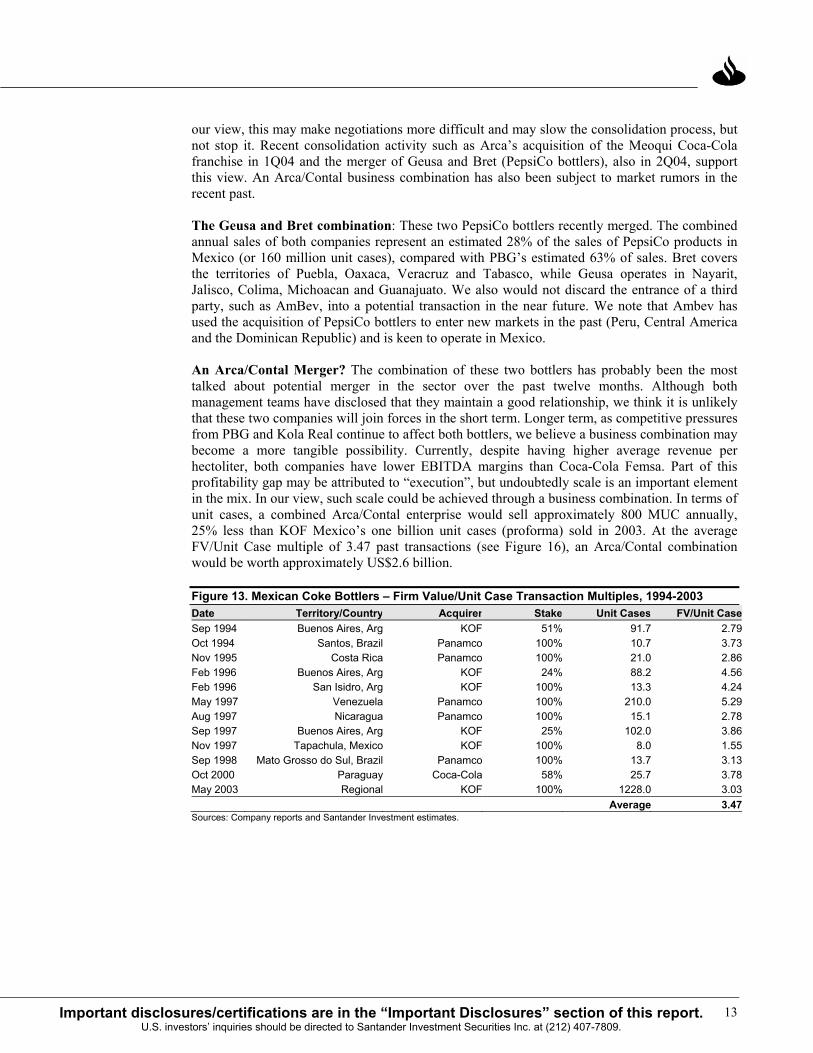
An Arca/Contal Merger? The combination of these two bottlers has probably been the most talked about potential merger in the sector over the past twelve months. Although both management teams have disclosed that they maintain a good relationship, we think it is unlikely that these two companies will join forces in the short term. Longer term, as competitive pressures from PBG and Kola Real continue to affect both bottlers, we believe a business combination may become a more tangible possibility. Currently, despite having higher average revenue per hectoliter, both companies have lower EBITDA margins than Coca-Cola Femsa. Part of this profitability gap may be attributed to “execution”, but undoubtedly scale is an important element in the mix. In our view, such scale could be achieved through a business combination. In terms of unit cases, a combined Arca/Contal enterprise would sell approximately 800 MUC annually, 25% less than KOF Mexico’s one billion unit cases (proforma) sold in 2003. At the average FV/Unit Case multiple of 3.47 past transactions (see Figure 16), an Arca/Contal combination would be worth approximately US$2.6 billion.
Figure 13. Mexican Coke Bottlers – Firm Value/Unit Case Transaction Multiples, 1994-2003 Date Territory/Country Acquirer Stake Unit Cases FV/Unit CaseSep 1994 Buenos Aires, Arg KOF 51% 91.7 2.79Oct 1994 Santos, Brazil Panamco 100% 10.7 3.73Nov 1995 Costa Rica Panamco 100% 21.0 2.86Feb 1996 Buenos Aires, Arg KOF 24% 88.2 4.56Feb 1996 San Isidro, Arg KOF 100% 13.3 4.24May 1997 Venezuela Panamco 100% 210.0 5.29Aug 1997 Nicaragua Panamco 100% 15.1 2.78Sep 1997 Buenos Aires, Arg KOF 25% 102.0 3.86Nov 1997 Tapachula, Mexico KOF 100% 8.0 1.55Sep 1998 Mato Grosso do Sul, Brazil Panamco 100% 13.7 3.13Oct 2000 Paraguay Coca-Cola 58% 25.7 3.78May 2003 Regional KOF 100% 1228.0 3.03
Average 3.47Sources: Company reports and Santander Investment estimates.

A Closer Look at the Coke Bottlers: A Perfect Storm
14 Important disclosures/certifications are in the “Important Disclosures” section of this report. U.S. investors’ inquiries should be directed to Santander Investment at (212) 407-7809.
Figure 14. Mexican Coke Bottlers Franchise Map
CHIHUAHUA
MONTERREY
GUADALAJARA
SAN LUIS POTOS
PUEBLAMEXICO CITY
VERACRUZ
Arca
Contal
Coca Cola Femsa
CANCUN
Embotell. de Guerrero
Independ.
Grupo Tampico
Cimsa
Bepensa
Jordan
Fomento Queretaro
Rica
CHIHUAHUA
MONTERREY
GUADALAJARA
SAN LUIS POTOS
PUEBLAMEXICO CITY
VERACRUZ
Arca
Contal
Coca Cola Femsa
CANCUN
Embotell. de Guerrero
Independ.
Grupo Tampico
Cimsa
Bepensa
Jordan
Fomento Queretaro
Rica
Source: Santander Investment.
Figure 15. Mexican Pepsi Bottlers Franchise Map
GEUSA/BRET
PBGGASEOSAS S.A.
GRUPO EMB. SURESTEBEBIDAS PURIFICADAS
CHIHUAHUA
MONTERREY
GUADALAJARA
SAN LUIS POTOS
PUEBLAMEXICO CITY
VERACRUZ
CANCUN
GEUSA/BRET
PBGGASEOSAS S.A.
GRUPO EMB. SURESTEBEBIDAS PURIFICADAS
CHIHUAHUA
MONTERREY
GUADALAJARA
SAN LUIS POTOS
PUEBLAMEXICO CITY
VERACRUZ
CANCUN
Source: Santander Investment.

15Important disclosures/certifications are in the “Important Disclosures” section of this report. U.S. investors’ inquiries should be directed to Santander Investment Securities Inc. at (212) 407-7809.
CONSUMPTION OUTLOOK Mexican macroeconomic indicators show modest improvement in the second half of 2004. The economy grew 3.9% in 2Q04 supported by growth of the service and industrial sectors. Our Mexico-based economics team sees GDP growth reaching 4%, up from 1.3% in 2003 on back of increased government spending and exports. As has been the case during previous economic upturns, the growth of the U.S. economy has driven the recovery in the maquilas sector, where employment is showing an encouraging positive trend both in northern Mexico as well as nation-wide during 1H04. Despite the encouraging macroeconomic data, we remain cautious as to the magnitude of the forecast recovery in non-durable consumption spending growth for the remainder of 2004 and into 2005.
Figure16. Mexico, Maquiladora Industry Employment (Year-on-Year Growth), Oct 2000-Jun 2004
-25%
-20%
-15%
-10%
-5%
0%
5%
10%
15%
Oct
-00
Dec
-00
Feb-
01
Apr-
01
Jun-
01
Aug-
01
Oct
-01
Dec
-01
Feb-
02
Apr-
02
Jun-
02
Aug-
02
Oct
-02
Dec
-02
Feb-
03
Apr-
03
Jun-
03
Aug-
03
Oct
-03
Dec
-03
Feb-
04
Apr-
04
Jun-
04
-25%
-20%
-15%
-10%
-5%
0%
5%
10%
15%
National Border States
Source: INEGI and Santander Invesmtent.
As a result of the recent upturn in exports, employment at the national level in the maquilas sector reversed a 10-month negative year-on-year growth trend in 2Q04. We note that the most important U.S. industries for the maquilas sector, such as the auto industry, have underperformed the growth of the U.S. economy. In addition, some exports in textiles and electronics have been lost to China’s more competitive industries. As a result, the boost from the U.S. economic recovery may not be as strong for the Mexican economy as it has been in previous economic upturns. Furthermore, Mexican exports may have limited upside if the U.S. starts to show softer data on the back of a tightening monetary cycle. Finally, structural reforms that could increase the country’s competitiveness seem unlikely under the current political environment.
Economic Indicators point to a modest improvement in 2H04.
A Closer Look at the Coke Bottlers: A Perfect Storm
16 Important disclosures/certifications are in the “Important Disclosures” section of this report. U.S. investors’ inquiries should be directed to Santander Investment at (212) 407-7809.
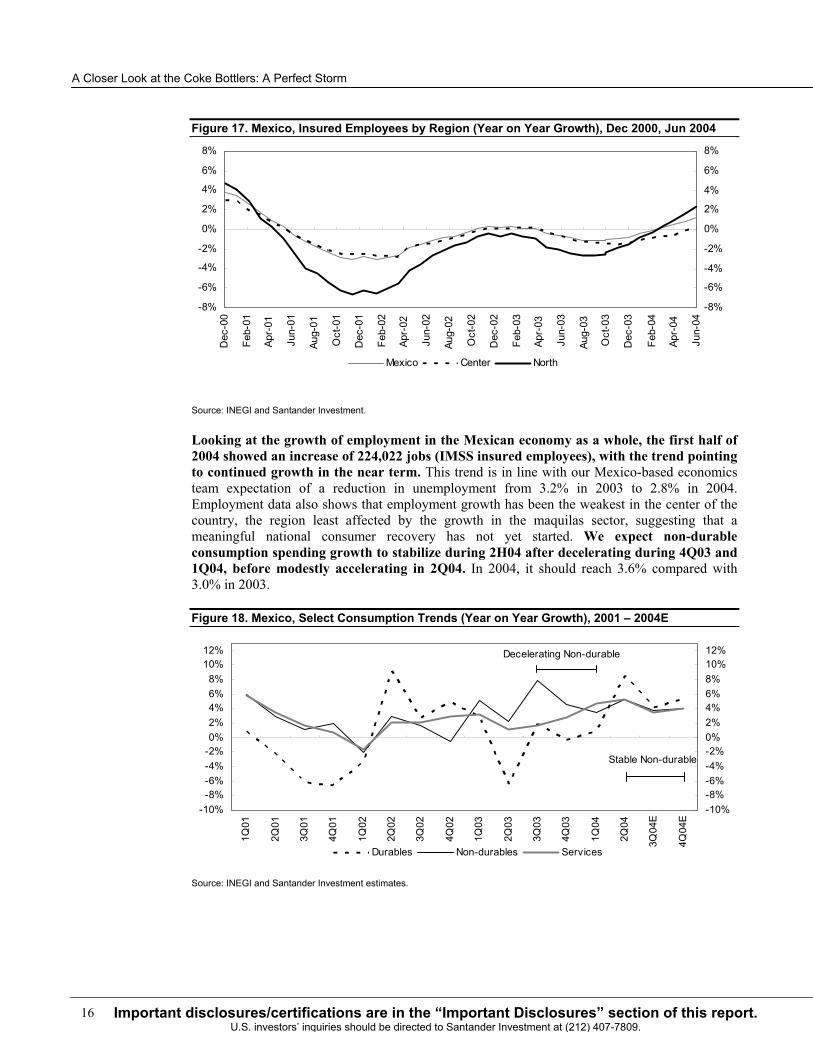
Figure 17. Mexico, Insured Employees by Region (Year on Year Growth), Dec 2000, Jun 2004
-8%
-6%
-4%
-2%
0%
2%
4%
6%
8%
Dec
-00
Feb-
01
Apr-
01
Jun-
01
Aug-
01
Oct
-01
Dec
-01
Feb-
02
Apr-
02
Jun-
02
Aug-
02
Oct
-02
Dec
-02
Feb-
03
Apr-
03
Jun-
03
Aug-
03
Oct
-03
Dec
-03
Feb-
04
Apr-
04
Jun-
04
-8%
-6%
-4%
-2%
0%
2%
4%
6%
8%
Mexico Center North
Source: INEGI and Santander Investment.
Looking at the growth of employment in the Mexican economy as a whole, the first half of 2004 showed an increase of 224,022 jobs (IMSS insured employees), with the trend pointing to continued growth in the near term. This trend is in line with our Mexico-based economics team expectation of a reduction in unemployment from 3.2% in 2003 to 2.8% in 2004. Employment data also shows that employment growth has been the weakest in the center of the country, the region least affected by the growth in the maquilas sector, suggesting that a meaningful national consumer recovery has not yet started. We expect non-durable consumption spending growth to stabilize during 2H04 after decelerating during 4Q03 and 1Q04, before modestly accelerating in 2Q04. In 2004, it should reach 3.6% compared with 3.0% in 2003.
Figure 18. Mexico, Select Consumption Trends (Year on Year Growth), 2001 – 2004E
-10%-8%-6%-4%-2%0%2%4%6%8%
10%12%
1Q01
2Q01
3Q01
4Q01
1Q02
2Q02
3Q02
4Q02
1Q03
2Q03
3Q03
4Q03
1Q04
2Q04
3Q04
E
4Q04
E
-10%-8%-6%-4%-2%0%2%4%6%8%10%12%
Durables Non-durables Services
Decelerating Non-durable
Stable Non-durable
Source: INEGI and Santander Investment estimates.
17Important disclosures/certifications are in the “Important Disclosures” section of this report. U.S. investors’ inquiries should be directed to Santander Investment Securities Inc. at (212) 407-7809.
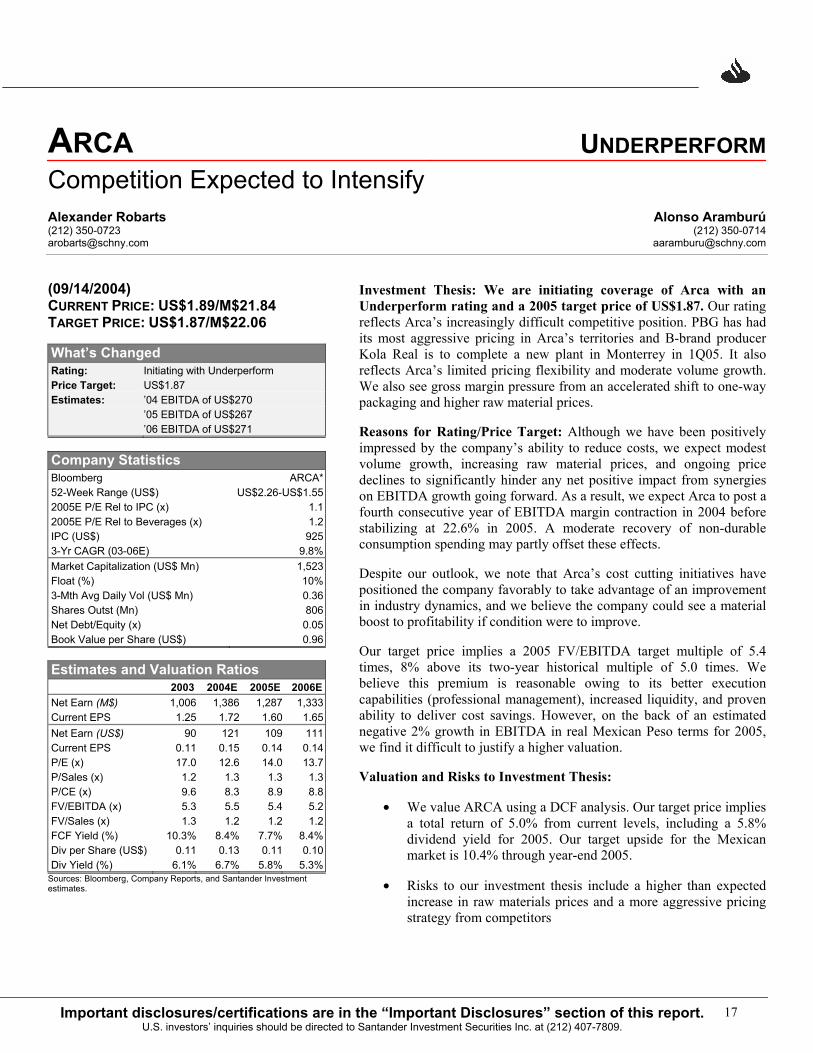
ARCA UNDERPERFORMCompetition Expected to Intensify Alexander Robarts Alonso Aramburú (212) 350-0723 (212) [email protected] [email protected]
(09/14/2004) CURRENT PRICE: US$1.89/M$21.84 TARGET PRICE: US$1.87/M$22.06
What’s Changed Rating: Initiating with Underperform Price Target: US$1.87 Estimates: ’04 EBITDA of US$270 ’05 EBITDA of US$267 ’06 EBITDA of US$271
Company Statistics Bloomberg ARCA* 52-Week Range (US$) US$2.26-US$1.55 2005E P/E Rel to IPC (x) 1.1 2005E P/E Rel to Beverages (x) 1.2 IPC (US$) 925 3-Yr CAGR (03-06E) 9.8% Market Capitalization (US$ Mn) 1,523 Float (%) 10% 3-Mth Avg Daily Vol (US$ Mn) 0.36 Shares Outst (Mn) 806 Net Debt/Equity (x) 0.05 Book Value per Share (US$) 0.96
Estimates and Valuation Ratios 2003 2004E 2005E 2006E Net Earn (M$) 1,006 1,386 1,287 1,333 Current EPS 1.25 1.72 1.60 1.65 Net Earn (US$) 90 121 109 111 Current EPS 0.11 0.15 0.14 0.14 P/E (x) 17.0 12.6 14.0 13.7 P/Sales (x) 1.2 1.3 1.3 1.3 P/CE (x) 9.6 8.3 8.9 8.8 FV/EBITDA (x) 5.3 5.5 5.4 5.2 FV/Sales (x) 1.3 1.2 1.2 1.2 FCF Yield (%) 10.3% 8.4% 7.7% 8.4% Div per Share (US$) 0.11 0.13 0.11 0.10 Div Yield (%) 6.1% 6.7% 5.8% 5.3%
Sources: Bloomberg, Company Reports, and Santander Investment estimates.
Investment Thesis: We are initiating coverage of Arca with an Underperform rating and a 2005 target price of US$1.87. Our rating reflects Arca’s increasingly difficult competitive position. PBG has had its most aggressive pricing in Arca’s territories and B-brand producer Kola Real is to complete a new plant in Monterrey in 1Q05. It also reflects Arca’s limited pricing flexibility and moderate volume growth. We also see gross margin pressure from an accelerated shift to one-way packaging and higher raw material prices.
Reasons for Rating/Price Target: Although we have been positively impressed by the company’s ability to reduce costs, we expect modest volume growth, increasing raw material prices, and ongoing price declines to significantly hinder any net positive impact from synergies on EBITDA growth going forward. As a result, we expect Arca to post a fourth consecutive year of EBITDA margin contraction in 2004 before stabilizing at 22.6% in 2005. A moderate recovery of non-durable consumption spending may partly offset these effects.
Despite our outlook, we note that Arca’s cost cutting initiatives have positioned the company favorably to take advantage of an improvement in industry dynamics, and we believe the company could see a material boost to profitability if condition were to improve.
Our target price implies a 2005 FV/EBITDA target multiple of 5.4 times, 8% above its two-year historical multiple of 5.0 times. We believe this premium is reasonable owing to its better execution capabilities (professional management), increased liquidity, and proven ability to deliver cost savings. However, on the back of an estimated negative 2% growth in EBITDA in real Mexican Peso terms for 2005, we find it difficult to justify a higher valuation.
Valuation and Risks to Investment Thesis:
• We value ARCA using a DCF analysis. Our target price implies a total return of 5.0% from current levels, including a 5.8% dividend yield for 2005. Our target upside for the Mexican market is 10.4% through year-end 2005.
• Risks to our investment thesis include a higher than expected increase in raw materials prices and a more aggressive pricing strategy from competitors
A Closer Look at the Coke Bottlers: A Perfect Storm
18 Important disclosures/certifications are in the “Important Disclosures” section of this report. U.S. investors’ inquiries should be directed to Santander Investment at (212) 407-7809.
Arca is the second- largest Coca-Cola bottler in Mexico. The company produces, distributes and sells beverages under The Coca-Cola Company brand name, as well as proprietary and third party brands. The company was formed in 2001 through the merger of three bottlers in Mexico. Arca distributes its products in Northern Mexico, primarily in the states of Nuevo Leon, Chihuahua, Tamaulipa, Coahuila, Sonora, Sinaloa, Baja California and Baja California Sur.
KEY ISSUES AND OUTLOOK We expect modest volume growth, increasing raw material prices (see Raw Material Prices to Pressure Gross Margins section), and ongoing price declines to significantly erode any net positive impact from synergies on EBITDA growth going forward. According to management, Arca’s gross cost savings from the synergies program may reach M$700 million. The M$700 million is more than twice the initial management estimate announced in March 2003, which called for M$320 million of synergies. According to management, M$500 million of synergies were attained by March 2004, with an additional M$100 million expected to be achieved by 4Q04 and another M$100 projected for 2005. On a net synergy basis, however, we expect the total amount since 2003 could be as low as M$100 million.
The bulk of the synergies have come from the closing of 8 plants and 11 distribution centers. Other sources of savings have come from changes in the corporate structure. The number of legal entities has been reduced from 40 to 21, the workforce has been trimmed by 15% to 16,400 employees, operations has been simplified with the designation of one COO (versus two before), and the human resources and administrative functions have been centralized. Moreover, the operation has become more efficient through a 19% reduction in the number of routes from 2,026 to 1,701 and a 7% increase in the number points of sale. Finally, management has been able to reduce costs through outsourcing of PET bottles (through a partnership with Amcor) and other packaging materials, the installation of sugar clarification facilities, and a reduction in the cost of freight.
We view ARCA’s push to modernize its information infrastructure as a necessary long term project to remain competitive. We believe that under the current competitive environment, which is increasingly relying on price competition from both B-brands and PBG, combined with a low inflation environment, companies with superior revenue management capabilities will gain a competitive advantage. Access to accurate and updated market information will be a key tool to execute such market-driven strategies. We view ARCA’s investment in technology as an important step in gaining ground against the competition in this area. Arca recently completed the installation of four basic SAP modules, finance, production, procurement and warehousing and launched the installation of the human resources and supply chain modules in 1Q04. Management expects to complete the installation of these modules by March 2005.
Our main new concern is that Kola Real’s new plant will increase and prolong the pricing and volume pressure felt in Arca’s territories. Kola Real is expected to sell product from its new plant by February 2005. It is located 18 km outside of Monterrey, with an estimated installed capacity of 50 million unit cases by 2006. Kola Real’s low prices have disrupted Arca’s profit growth, albeit to a lesser degree than PBG’s aggressive pricing strategy, in our view. In fact, Kola Real recently raised its prices in Monterrey in its 3.1 liter presentation from 11 pesos to 12 pesos and in its 2.6 liter presentation from 9 pesos to 10 pesos. Nevertheless, the building of a plant in Arca’s backyard, Monterrey, which accounts for approximately 30% of Arca’s sales, and despite Kola Real already having a wide coverage of that territory, can only intensify the competitive threat, in our view. We estimate that Kola Real has approximately a 4% share of the Monterrey market, but we also believe that market share gains from Kola Real have stopped and we expect them to remain at current levels for the rest of 2004 and 2005.
Net impact from synergies on EBITDA may be only marginal.
ARCA is upgrading its technology.
Kola Real is building a plant in Monterrey.

19Important disclosures/certifications are in the “Important Disclosures” section of this report. U.S. investors’ inquiries should be directed to Santander Investment Securities Inc. at (212) 407-7809.
The new Kola Real plant comes at a time when the competitive environment is already intense. The tough competitive environment in the first half of 2004 forced Arca to lower prices of its cola multi-serve presentations an average of 12%. As a result, EBITDA margin contracted 170 basis points year over year in 2Q04 after two consecutive quarters of EBITDA margin expansion. Unfavorable weather conditions also mitigated volume growth, particularly in 2Q04, but we anticipate a moderate improvement in the second half of 2004 and 2005 on the back of lower prices and a pick-up in consumption.
We expect Arca’s average price per unit case (excluding jug water volumes) to have a real decline of 5.6% in 2Q04 and 2.5% in 2005. In 2Q04, Arca realigned its prices in its 2.0 liter one-way, 2.0 liter returnable, and 2.5 liter one-way presentations from 14 pesos to 12 pesos, 12 pesos to 10 pesos and 15 pesos to 14 pesos, respectively. Together, these three presentations account for approximately 40%-45% of Arca’s total volumes. Arca also reduced prices in its 2.5 liter one-way flavors presentation from 15 pesos to 13 pesos at the beginning of 2004. Arca’s prices compare with PBG’s 2.5 liter one-way cola price of between 11 to 12 pesos, depending on the sales channel. In 3Q04, PBG reduced the pricing of its 2.0 liter one-way presentation from 11 pesos to 10 pesos, signaling the continuance of an aggressive pricing policy.
We do not expect any easing of the competitive environment in the short term. In fact, we would expect any potential price movements upward to be a reflection of higher raw material prices, not to be strategically driven. Finally, we expect Arca’s total soft drink volumes to be flat in 2004, including approximately 1% incremental volume from the new Meoqui territories, below management’s guidance of 1%-2% at the beginning of the year. In 2005, we expect soft drink volumes to increase 1.5% (1.1% pro forma), but total volumes to be flat on the back of a 9% decline in jug water volumes.
Figure 19. Arca– Pricing Architecture and Volume Mix, 3Q04
$3.0$4.0
$10.0
$4.5 $4.5$5.5
$12.0
$14.0
$0.0
$2.0
$4.0
$6.0
$8.0
$10.0
$12.0
$14.0
$16.0
12 ozGlass
0.5L Glass 2.0L RefPET
Can 500 ml NR 600 ml NR 2.0L NR 2.5L NR
2.0L NR, 9.0%
2.5L NR, 9.0%
2.0L Ref PET, 22.0%
12 oz & 0.5L Glass, 27.0%
600 ml NR, 15.0%
Other, 18.0%
Volume Mix does not include jug water. Sources: Company reports and Santander Investment estimates.
Part of Arca’s response to the competitive environment, in addition to realigning prices, has been the placement of coolers, increasing the penetration in the supermarket channel and pushing the sale of returnable and single serve presentations. The placement of coolers at the point of sale provides a competitive advantage, especially in a warm climate environment such as that found in Arca’s territories. The company plans to place 15,000 new coolers in 2004, the same amount as in 2003 and 8% higher than the 179,510 coolers at year-end 2003. Arca has also been pushing its presence in supermarkets to strengthen its position against B-brands and remains well-positioned for the potentially faster growth of this channel. Supermarkets currently account for approximately 4.2% of Arca’s sales. Finally, Arca is stimulating the consumption of single-serve and returnable presentations through promotions to push these more profitable packages and highlight the value-proposition from returnable packaging. In the water segment, Arca is emphasizing individual presentations while reducing its presence in the less profitable jug water business. In 2003, jug water volumes declined to approximately 20%, and we expect them to decline an additional 13% in 2004 and 9% in 2005.
We expect real decline in prices for 2004 and 2005.

A Closer Look at the Coke Bottlers: A Perfect Storm
20 Important disclosures/certifications are in the “Important Disclosures” section of this report. U.S. investors’ inquiries should be directed to Santander Investment at (212) 407-7809.
The agreement to sell the Joya brand to The Coca-Cola Company for M$650 million will expand Arca’s portfolio of flavor drinks. The flavor market has become more competitive with the introduction of new flavor drinks from PBG and B-brand producers. Arca’s current flavor portfolio includes its proprietary brand Joya, which was sold primarily in the Northeast as well as The Coca-Cola Company brands Sprite and Fanta. Under the terms of the agreement Arca will continue to sell Joya, but will introduce List (Apple flavors) and Fresca (Grapefruit flavor) throughout its territories. The transaction is expected to close in 3Q04.
Shareholders should continue to benefit from a very attractive 2005 dividend yield, which we estimate to be 5.8% at current stock price levels. At the beginning of 2Q04, ARCA paid a dividend of M$0.70. We expect the company to complement this dividend payment with an extraordinary dividend of M$0.75 in 4Q04, on the back of the recent sale of the Joya brand to The Coca-Cola Company for approximately M$650 million and an estimated M$60 million payment from Amcor as part of their outsourcing of PET bottles agreement. In our view, in the absence of a large acquisition, we believe Arca can sustain a dividend payment close to our estimate of M$1.0 billion for 2005. We believe it is more likely that the company will close transactions similar to the one from Meoqui in the short term than a larger transaction, potentially with Contal. We estimate that adjacent territories such as Nogales sell approximately six million unit cases. Acquiring a territory of that size could require a disbursement of up to US$20 million according to our estimates, easily financed through the company’s own resources or through additional debt.
The Meoqui territories provide an estimated annualized 6.5 MUC of incremental volume. Arca acquired these territories in 1Q04, which required an initial investment of US$10 million in coolers, trucks, a distribution center and returnable bottles. We estimate that volumes on a pro-forma basis for 2004 and 2005 will decline 1% and increase 1.1%, respectively. Going forward, we believe it is more likely that the company will close transactions similar to the one from Meoqui in the short term than a larger transaction, potentially with Contal. We estimate that adjacent territories such as Nogales sell approximately six million unit cases. Acquiring a territory of that size could require a disbursement of up to US$20 million according to our estimates, easily financed through the company’s own resources or through additional debt.
VALUATION We used a DCF analysis to calculate our 2005 year-end target price of US$1.87, which implies a FV/EBITDA target multiple of 5.4 times. We project the free cash flows of the firm for 10 years and discount them by the company’s WACC. We use a WACC of 10.0%, based on a target equity to total capital ratio of 85%, a cost of debt of 9%, a risk free rate of 4.3%, a Beta of 0.86 and a country risk of 1.85%. Our cost of equity is 10.9%. Our terminal value uses a perpetuity growth rate of 1%.
Our target price of US$1.87 implies a total return of 5.0% from current levels, including a 5.8% dividend yield for 2005. Our target upside for the Mexican market is 10.4% through year-end 2005. At the target multiple of 5.4 times, ARCA’s valuation will be 8% above the company’s two-year trailing FV/EBITDA of 5.0 times. We believe this premium to its historical multiple is reasonable owing to its better execution capabilities (professional management), increased liquidity, and proven ability to deliver cost savings. On a relative valuation basis, Arca’s target multiple is 33% below our KOF 2005 target multiple of 7.2 times. This differential is slightly below Arca’s two-year historical discount to KOF of 35%, which we consider appropriate given Arca’s improved liquidity and management capabilities.
Arca offers an attractive dividend yield.
Newly acquired incremental volume.
21Important disclosures/certifications are in the “Important Disclosures” section of this report. U.S. investors’ inquiries should be directed to Santander Investment Securities Inc. at (212) 407-7809.
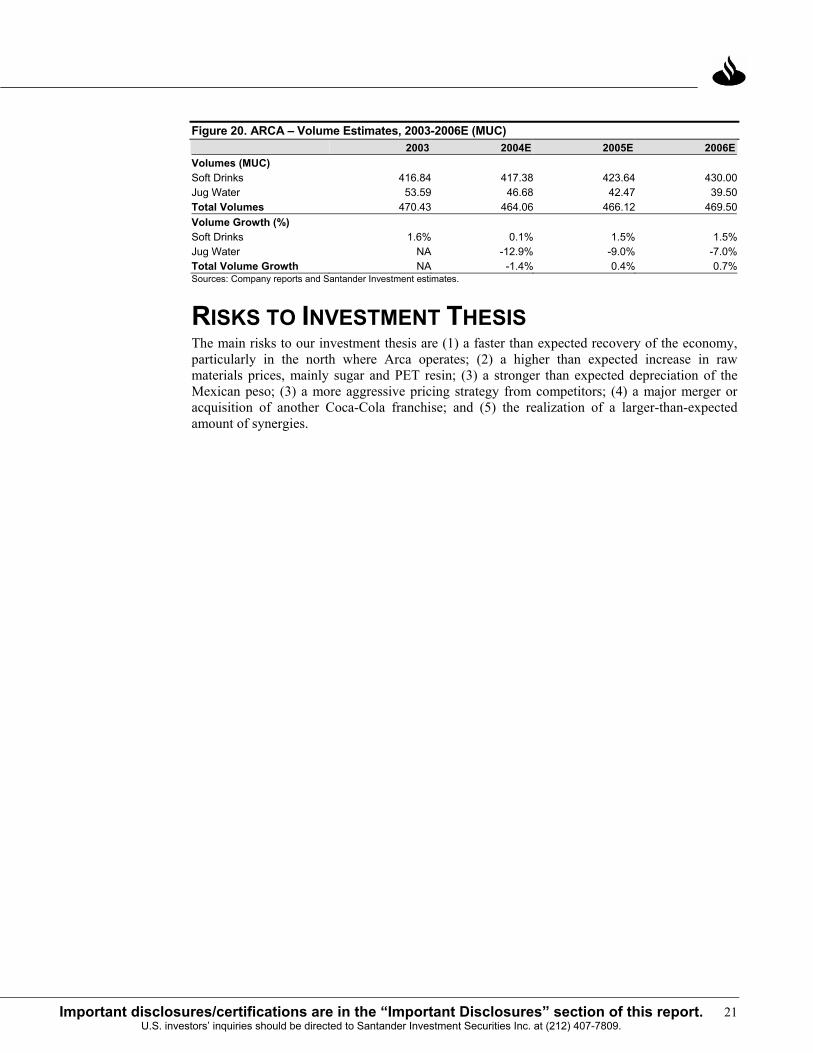
Figure 20. ARCA – Volume Estimates, 2003-2006E (MUC) 2003 2004E 2005E 2006EVolumes (MUC) Soft Drinks 416.84 417.38 423.64 430.00 Jug Water 53.59 46.68 42.47 39.50 Total Volumes 470.43 464.06 466.12 469.50 Volume Growth (%) Soft Drinks 1.6% 0.1% 1.5% 1.5%Jug Water NA -12.9% -9.0% -7.0%Total Volume Growth NA -1.4% 0.4% 0.7%Sources: Company reports and Santander Investment estimates.
RISKS TO INVESTMENT THESIS The main risks to our investment thesis are (1) a faster than expected recovery of the economy, particularly in the north where Arca operates; (2) a higher than expected increase in raw materials prices, mainly sugar and PET resin; (3) a stronger than expected depreciation of the Mexican peso; (3) a more aggressive pricing strategy from competitors; (4) a major merger or acquisition of another Coca-Cola franchise; and (5) the realization of a larger-than-expected amount of synergies.
A Closer Look at the Coke Bottlers: A Perfect Storm
22 Important disclosures/certifications are in the “Important Disclosures” section of this report. U.S. investors’ inquiries should be directed to Santander Investment at (212) 407-7809.
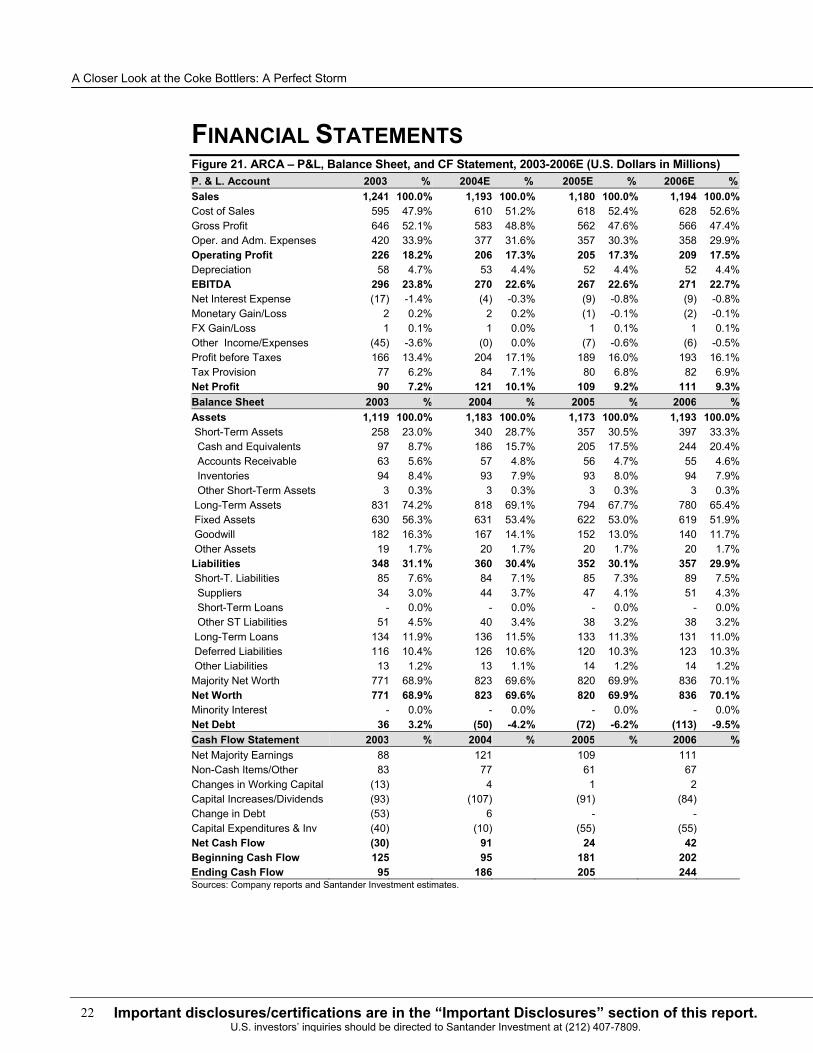
FINANCIAL STATEMENTS Figure 21. ARCA – P&L, Balance Sheet, and CF Statement, 2003-2006E (U.S. Dollars in Millions) P. & L. Account 2003 % 2004E % 2005E % 2006E %Sales 1,241 100.0% 1,193 100.0% 1,180 100.0% 1,194 100.0%Cost of Sales 595 47.9% 610 51.2% 618 52.4% 628 52.6%Gross Profit 646 52.1% 583 48.8% 562 47.6% 566 47.4%Oper. and Adm. Expenses 420 33.9% 377 31.6% 357 30.3% 358 29.9%Operating Profit 226 18.2% 206 17.3% 205 17.3% 209 17.5%Depreciation 58 4.7% 53 4.4% 52 4.4% 52 4.4%EBITDA 296 23.8% 270 22.6% 267 22.6% 271 22.7%Net Interest Expense (17) -1.4% (4) -0.3% (9) -0.8% (9) -0.8%Monetary Gain/Loss 2 0.2% 2 0.2% (1) -0.1% (2) -0.1%FX Gain/Loss 1 0.1% 1 0.0% 1 0.1% 1 0.1%Other Income/Expenses (45) -3.6% (0) 0.0% (7) -0.6% (6) -0.5%Profit before Taxes 166 13.4% 204 17.1% 189 16.0% 193 16.1%Tax Provision 77 6.2% 84 7.1% 80 6.8% 82 6.9%Net Profit 90 7.2% 121 10.1% 109 9.2% 111 9.3%Balance Sheet 2003 % 2004 % 2005 % 2006 %Assets 1,119 100.0% 1,183 100.0% 1,173 100.0% 1,193 100.0% Short-Term Assets 258 23.0% 340 28.7% 357 30.5% 397 33.3% Cash and Equivalents 97 8.7% 186 15.7% 205 17.5% 244 20.4% Accounts Receivable 63 5.6% 57 4.8% 56 4.7% 55 4.6% Inventories 94 8.4% 93 7.9% 93 8.0% 94 7.9% Other Short-Term Assets 3 0.3% 3 0.3% 3 0.3% 3 0.3% Long-Term Assets 831 74.2% 818 69.1% 794 67.7% 780 65.4% Fixed Assets 630 56.3% 631 53.4% 622 53.0% 619 51.9% Goodwill 182 16.3% 167 14.1% 152 13.0% 140 11.7% Other Assets 19 1.7% 20 1.7% 20 1.7% 20 1.7%Liabilities 348 31.1% 360 30.4% 352 30.1% 357 29.9% Short-T. Liabilities 85 7.6% 84 7.1% 85 7.3% 89 7.5% Suppliers 34 3.0% 44 3.7% 47 4.1% 51 4.3% Short-Term Loans - 0.0% - 0.0% - 0.0% - 0.0% Other ST Liabilities 51 4.5% 40 3.4% 38 3.2% 38 3.2% Long-Term Loans 134 11.9% 136 11.5% 133 11.3% 131 11.0% Deferred Liabilities 116 10.4% 126 10.6% 120 10.3% 123 10.3% Other Liabilities 13 1.2% 13 1.1% 14 1.2% 14 1.2%Majority Net Worth 771 68.9% 823 69.6% 820 69.9% 836 70.1%Net Worth 771 68.9% 823 69.6% 820 69.9% 836 70.1%Minority Interest - 0.0% - 0.0% - 0.0% - 0.0%Net Debt 36 3.2% (50) -4.2% (72) -6.2% (113) -9.5%Cash Flow Statement 2003 % 2004 % 2005 % 2006 %Net Majority Earnings 88 121 109 111 Non-Cash Items/Other 83 77 61 67 Changes in Working Capital (13) 4 1 2 Capital Increases/Dividends (93) (107) (91) (84)Change in Debt (53) 6 - -Capital Expenditures & Inv (40) (10) (55) (55)Net Cash Flow (30) 91 24 42 Beginning Cash Flow 125 95 181 202 Ending Cash Flow 95 186 205 244 Sources: Company reports and Santander Investment estimates.

23Important disclosures/certifications are in the “Important Disclosures” section of this report. U.S. investors’ inquiries should be directed to Santander Investment Securities Inc. at (212) 407-7809.
Figure 22. Arca – P&L, Balance Sheet, and CF Statement 2003-2006E (Millions of Mexican Nominal Pesos) P. & L. Account 2003 % 2004E % 2005E % 2006E %Sales 13,936 100.0% 13,720 100.0% 13,919 100.0% 14,300 100.0%Cost of Sales 6,681 47.9% 7,018 51.2% 7,287 52.4% 7,520 52.6%Gross Profit 7,256 52.1% 6,702 48.8% 6,632 47.6% 6,780 47.4%Oper. and Adm. Expenses 4,721 33.9% 4,333 31.6% 4,218 30.3% 4,282 29.9%Operating Profit 2,535 18.2% 2,369 17.3% 2,413 17.3% 2,497 17.5%Depreciation 664 4.8% 608 4.4% 617 4.4% 624 4.4%EBITDA 3,323 23.8% 3,105 22.6% 3,149 22.6% 3,242 22.7%Net Interest Expense (192) -1.4% (45) -0.3% (110) -0.8% (110) -0.8%Monetary Gain/Loss 25 0.2% 25 0.2% (11) -0.1% (19) -0.1%FX Gain/Loss 9 0.1% 7 0.0% 14 0.1% 9 0.1%Other Income/Expenses (507) -3.6% (6) 0.0% (80) -0.6% (70) -0.5%Profit before Taxes 1,869 13.4% 2,349 17.1% 2,227 16.0% 2,308 16.1%Tax Provision 868 6.2% 970 7.1% 947 6.8% 981 6.9%Net Profit 1,006 7.2% 1,386 10.1% 1,287 9.2% 1,333 9.3%Balance Sheet 2003 % 2004 % 2005 % 2006 %Assets 12,571 100.0% 13,607 100.0% 13,836 100.0% 14,286 100.0% Short-Term Assets 2,894 23.0% 3,906 28.7% 4,217 30.5% 4,752 33.3% Cash and Equivalents 1,093 8.7% 2,142 15.7% 2,420 17.5% 2,919 20.4% Accounts Receivable 706 5.6% 658 4.8% 657 4.7% 664 4.6% Inventories 1,057 8.4% 1,068 7.9% 1,101 8.0% 1,129 7.9% Other Short-Term Assets 38 0.3% 38 0.3% 39 0.3% 40 0.3% Long-Term Assets 9,330 74.2% 9,404 69.1% 9,372 67.7% 9,336 65.4% Fixed Assets 7,072 56.3% 7,261 53.4% 7,340 53.0% 7,416 51.9% Goodwill 2,045 16.3% 1,917 14.1% 1,798 13.0% 1,678 11.7% Other Assets 214 1.7% 225 1.7% 234 1.7% 242 1.7%Liabilities 3,908 31.1% 4,140 30.4% 4,158 30.1% 4,275 29.9% Short-T. Liabilities 955 7.6% 969 7.1% 1,008 7.3% 1,065 7.5% Suppliers 383 3.0% 509 3.7% 560 4.1% 611 4.3% Short-Term Loans - 0.0% - 0.0% - 0.0% - 0.0% Other ST Liabilities 572 4.5% 460 3.4% 447 3.2% 454 3.2% Long-Term Loans 1,500 11.9% 1,568 11.5% 1,568 11.3% 1,568 11.0% Deferred Liabilities 1,305 10.4% 1,449 10.6% 1,420 10.3% 1,471 10.3% Other Liabilities 148 1.2% 155 1.1% 163 1.2% 171 1.2%Majority Net Worth 8,663 68.9% 9,466 69.6% 9,678 69.9% 10,011 70.1%Net Worth 8,663 68.9% 9,466 69.6% 9,678 69.9% 10,011 70.1%Minority Interest - 0.0% - 0.0% - 0.0% - 0.0%Net Debt 407 3.2% (574) -4.2% (852) -6.2% (1,352) -9.5%Cash Flow Statement 2003 % 2004 % 2005 % 2006 %Net Majority Earnings 1,007 1,386 1,287 1,333 Non-Cash Items/Other 950 887 715 804 Changes in Working Capital (147) 50 6 22 Capital Increases/Dividends (1,073) (1,233) (1,075) (1,000)Change in Debt (615) 68 - -Capital Expenditures & Inv (465) (109) (655) (660)Net Cash Flow (343) 1,048 278 499 Beginning Cash Flow 1,437 1,093 2,142 2,420 Ending Cash Flow 1,093 2,142 2,420 2,919 Sources: Company reports and Santander Investment estimates.
A Closer Look at the Coke Bottlers: A Perfect Storm
24 Important disclosures/certifications are in the “Important Disclosures” section of this report. U.S. investors’ inquiries should be directed to Santander Investment at (212) 407-7809.
This page intentionally left blank.
25Important disclosures/certifications are in the “Important Disclosures” section of this report.
U.S. investors’ inquiries should be directed to Santander Investment Securities Inc. at (212) 407-7809.
CONTAL UNDERPERFORMIn Search of Synergies Alexander Robarts Alonso Aramburú (212) 350-0723 (212) [email protected] [email protected] (09/14/2004) CURRENT PRICE: US$1.56/M$18.04 TARGET PRICE: US$1.55/M$18.29
What’s Changed Rating: Initiating with Underperform Price Target: US$1.55 Estimates: ’04 EBITDA of US$161 ’05 EBITDA of US$162 ’06 EBITDA of US$165
Company Statistics Bloomberg CONTAL* 52-Week Range (US$) US$1.38-US$2.02 2005E P/E Rel to IPC (x) 1.23 2005E P/E Rel to Beverages (x) 1.37 IPC (US$) 925 3-Yr CAGR (03-06E) -6.0% Market Capitalization (US$ Mn) 1,168 Float (%) 20% 3-Mth Avg Daily Vol (US$Mn) 0.15 Shares Outst (Mn) 749 Net Debt/Equity (x) -0.34 Book Value per Share (US$) 0.92
Estimates and Valuation Ratios 2003 2004E 2005E 2006E Net Earn (M$) 1,143 958 993 1,015 Current EPS 1.53 1.28 1.33 1.36 Net Earn (US$) 102 83 84 85 Current EPS 0.14 0.11 0.11 0.11 P/E (x) 11.4 14.0 13.9 13.8 P/Sales (x) 1.3 1.4 1.4 1.3 P/CE (x) 8.9 11.0 11.1 11.3 FV/EBITDA (x) 5.3 5.8 5.8 5.7 FV/Sales (x) 1.1 1.1 1.1 1.1 FCF Yield (%) 3.8% 6.6% 6.1% 6.2% Div per Share (US$) 0.07 0.11 0.10 0.10 Div Yield (%) 4.3% 7.0% 6.2% 6.4%
Sources: Bloomberg, Company Reports, and Santander Investment estimates.
Investment Thesis: Like Arca and KOF, Contal has also implemented cost reduction initiatives, but its efforts have been less aggressive than its peer bottlers, in our view. Also like Arca, but to a lesser degree, we suspect Contal will see competition from B-brand producer Kola Real increase upon completion of its plant near Monterrey. We believe absent any large additional cost cutting initiatives, an improvement in the competitive environment in its region, or a significant pick-up in non-durable consumption, Contal’s operating performance is unlikely to show any marked improvement in the coming quarters. Despite its attractive 6.2% 2005 dividend yield, we see more downside than upside risk on the stock at this time.
Reasons for Rating/Price Target: Our earnings estimates call for an 11.5% real decline in EBITDA growth in 2004 and EBITDA margin contraction for the second consecutive year. For 2005, we are looking for flat real EBITDA growth.
We are initiating coverage of Contal with an Underperform rating and a 2005 target price of US$1.55. Our target price implies a 2005 FV/EBITDA target multiple of 5.7 times, in line with Contal’s 2-year historical multiple. Our rating reflects Contal’s limited expected additional savings from cost reduction measures and an overall intense competitive industry environment with limited pricing flexibility, moderate volume growth, and rising raw material prices. The thin trading liquidity of Contal shares is an additional concern.
We view Contal as a potential consolidator of smaller Coca-Cola bottlers in the short to medium term. The company has a debt-free balance sheet and close relationships with other Coke bottlers through a cooperative partnership in a sugar mill (Contal’s stake is 49%). However, we believe a larger transaction, such as a business combination with Arca, is unlikely in the short term.
Valuation and Risks to Investment Thesis:
• We value Contal using a DCF analysis. Our target price implies a total return of 5.3% from current levels, including a 6.2% dividend yield for 2005. Our target upside for the Mexican market is 10.4% through year-end 2005.
• Risks to our investment thesis include an higher than expected increase in raw materials prices and a more aggressive pricing strategy from competitors.

A Closer Look at the Coke Bottlers: A Perfect Storm
26 Important disclosures/certifications are in the “Important Disclosures” section of this report. U.S. investors’ inquiries should be directed to Santander Investment at (212) 407-7809.
Grupo Continental, S.A. (Contal) is the third largest Coca-Cola bottler in Mexico and one of the 10 largest Coca-Cola bottling groups in the world. The company is dedicated to the production, sales and distribution of non-alcoholic, ready-to-drink beverages in the states of Durango, Coahuila, Zacatecas, Aguascalientes, San Luis Potosí, Jalisco, and Colima, covering 14.5% of Mexico's territory.
KEY ISSUES AND OUTLOOK We expect Contal’s average price per unit case to fall 4.3% in real terms in 2004 and 1.6% in 2005 on the back of an ongoing intense competitive environment with PBG and Kola Real. Contal responded to the intense competitive environment with a “Campaña Primavera” or Spring promotional campaign, which started in March 2004 in the largest cities of its territory– Guadalajara, San Luis and Aguas Calientes. The three cities account for the majority of Contal’s volumes, with the Guadalajara region being the most important (45% of volumes). The campaign has focused on multi-serve packages and reduced prices on the 2 liter returnable, 2.5 liter returnable, and 2.5 liter non-returnable presentations from 12 pesos to 10 pesos, 14 pesos to 13 pesos and 16 pesos to 15 pesos, respectively. These three presentations account for approximately 28% of Contal’s volume. Despite the lower prices throughout 2Q04, unfavorable weather conditions and ongoing tough competition drove a decline of 5% in total soft drink volumes. We note that volumes were least affected in the Guadalajara region, where Contal competes with Geusa as opposed to PBG in the rest of its territories. Geusa has not been as aggressive in lowering prices as PBG. Nevertheless, volume declines in 2Q04 in all beverage categories in the Guadalajara region and the ongoing “Spring” campaign through the summer months underscore the challenging competitive environment, in our view.
Figure 1. Contal– Pricing Architecture and Volume Mix, 3Q04E
$4.0 $4.0
$10.0
$13.0
$3.5 $3.5$4.5
$5.5$6.0
$8.0
$10.0
$14.0$15.0
$0.0
$2.0
$4.0
$6.0
$8.0
$10.0
$12.0
$14.0
$16.0
355 ml.Ret
500 ml.Ret
2.0 lt.REF-PET
2.5 lt.REF-PET
237 ml.Glass(8oz)
PET NR250 ml.
Can 12oz.
NORET.
500 ml.
PET NR600 ml.
PET NR1.0 lt.
PET NR1.5 lt.
PET NR2 lt.
PET NR2.5 lt.
PET NR 600 ml., 17.7%
500 ml. Ret, 14.8%
2.0 lt. REF-PET , 14.0%
2.5 lt. REF-PET , 12.0%
355 ml. Ret, 9.1%
PET NR 2 lt., 7.7%PET NR 1.0 lt., 6.9%
Other, 17.9%
Volume Mix does not include jug water. Sources: Company reports and Santander Investment estimates.
In an effort to boost profitability, Contal is focusing on the development of single-serve presentations and returnable packages. As part of this strategy, Contal “relaunched” its 350 ml and 500 ml glass returnable presentations in 2Q04 (both presentations account for approximately 24% of volumes) and launched a new 450 ml PET and a new 710 ml PET presentation during 3Q04. In addition, the 2.5 liter returnable presentation was launched in 4Q03 in the Guadalajara region and in early 2004 in the Northern territories.
Contal’s packaging strategy comes at a time when, like Arca, it has seen a dramatic change in its packaging mix in favor of lower margin non-returnable presentations. Contal’s non-returnable packages have increased from approximately 45% in 2002 to 48.7% by year-end 2003
We expect real price declines in 2004 and 2005.
27Important disclosures/certifications are in the “Important Disclosures” section of this report. U.S. investors’ inquiries should be directed to Santander Investment Securities Inc. at (212) 407-7809.
and we expect them to reach 50% in 2004. The shift has placed additional pressure on gross margins, which have also been affected by the high cost of sugar and PET resin in 2004 as well as overall weak pricing. The packaging mix has also shifted to less profitable multi-serve presentations, increasing from 42.3% in 2002 to 44.5% in 2003. With the renewed focus on single serves, we expect the volume mix to remain virtually unchanged in 2004.
Contal’s cost-cutting initiatives have lagged the efforts of KOF and Arca, in our view. The latter two have found more room for synergies because, unlike Contal, they have involved integrating new franchises and centralizing many aspects of their operations. Contal’s cost reduction program has centered on production facilities. Two plants, one in Rioverde and one in Fresnillo, were converted into distribution centers in 2003 and a third plant in Durango closed in 1Q04. Some of the savings from these initiatives were evident in the 2Q04 results as year-on-year gross margin contraction outperformed both Arca and KOF. We believe that part of this outperformance is also related to the better purchasing terms that Contal may obtain for sugar since it owns part of a sugar mill. Also, we note that Contal buys only refined sugar, as opposed to KOF and Arca. These companies buy mostly standard sugar, which had higher price increases than refined sugar in 1H04.
However, cost savings have not been sufficient to fully mitigate weak volumes and pricing and higher raw material costs (see Raw Material Prices to Pressure Gross Margins). More importantly, the company has not disclosed any additional cost reduction measures for 2004 or 2005, but it continues to search for areas of savings, according to management. However, it is our sense that additional significant cost reductions measures are limited at this point in time. In our view, in the absence of any additional considerable cost reduction initiatives, we do not expect Contal’s operating performance to have a marked improvement in 2004 or 2005, given the competitive environment.
In contrast to Arca and KOF, Contal continues to grow its jug water business. We expect jug water to account for 23% of total volumes in 2004, up from 15% in 2000. In 2003, jug water volumes grew 12.9%, accounting for the majority of the total volume growth. Most of the jug water growth in 2003 came from incremental volumes from introductions in new territories, an effect we do not expect in 2004. We expect jug water volumes to decline 2% in 2004, higher than the 1.2% decline we expect for soft drinks. We note that the jug water business is less profitable than soft drinks, and it faces extensive competition from informal, low cost producers in Mexico, making it difficult to achieve high rates of return. For example, Contal sells its jugs at M$20 pesos in Guadalajara versus informal producers with prices as low as M$12 pesos. Moreover, distribution is mostly directed to houses and offices, which requires different routes than for soft drink packages, thereby limiting the operating leverage from its high soft drink point of sale penetration.
We believe Contal can be a consolidator of smaller bottlers in the medium term. The company has stated its interest in exploring potential acquisitions of smaller Coca-Cola franchises. Many of these companies are minority partners with Contal in Piazza, the sugar mill 49%-owned by Contal. However, according to management, so far none of these companies have been willing to initiate serious conversations so far. We estimate that most of these Coca-Cola franchises sell between 60 and 90 MUC per year. As such, using the average FV/Unit Case multiple of recent transactions in the sector of 3.47 (see transaction multiples table), the price of these franchises would range between US$200 million and US$315 million, amounts easily financed by the company, in our view. The company’s current cash position is approximately US$200 million and it has a debt-free balance sheet. In addition, Contal has credit lines already approved with banks for up to M$1.5 billion (approximately US$130 million), and it could easily raise additional financing. In our view, if the current competitive environment persists in the medium term, Contal may be more aggressive in seeking acquisition opportunities that could provide additional scale and cost cutting opportunities.
Cost-cutting efforts have lagged Arca and KOF.
Water remains a core segment for Contal.
Contal can be a consolidator of small bottlers.
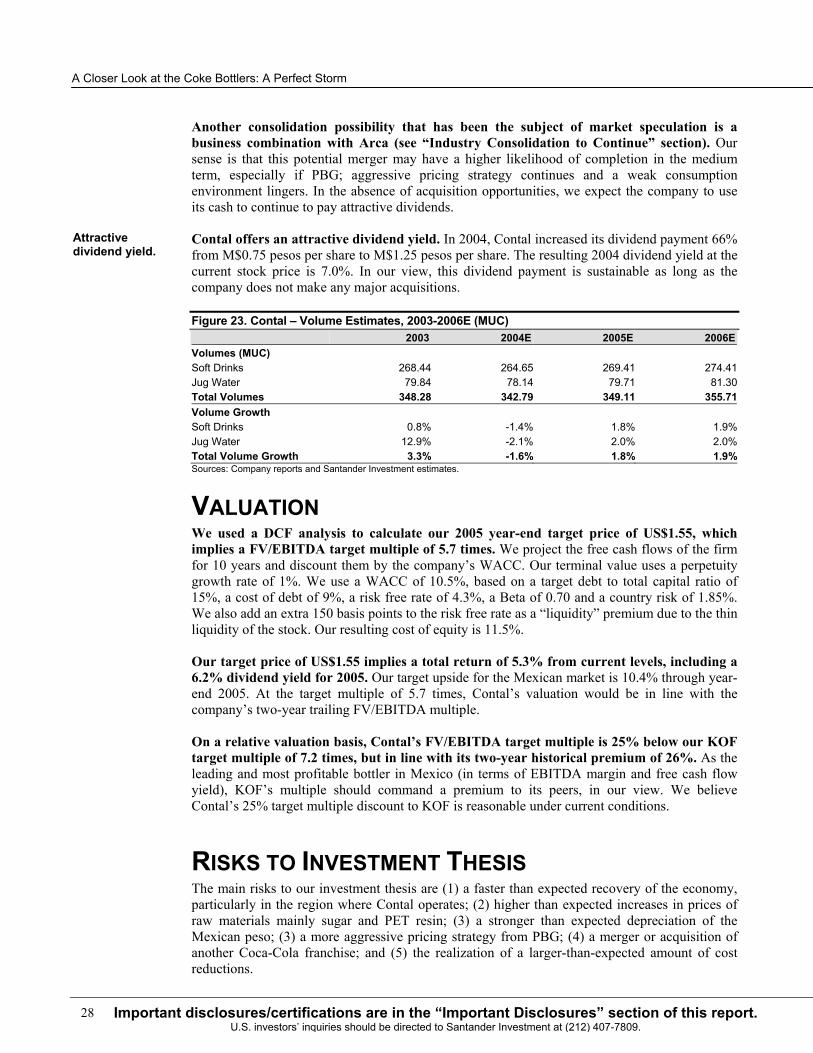
A Closer Look at the Coke Bottlers: A Perfect Storm
28 Important disclosures/certifications are in the “Important Disclosures” section of this report. U.S. investors’ inquiries should be directed to Santander Investment at (212) 407-7809.
Another consolidation possibility that has been the subject of market speculation is a business combination with Arca (see “Industry Consolidation to Continue” section). Our sense is that this potential merger may have a higher likelihood of completion in the medium term, especially if PBG; aggressive pricing strategy continues and a weak consumption environment lingers. In the absence of acquisition opportunities, we expect the company to use its cash to continue to pay attractive dividends.
Contal offers an attractive dividend yield. In 2004, Contal increased its dividend payment 66% from M$0.75 pesos per share to M$1.25 pesos per share. The resulting 2004 dividend yield at the current stock price is 7.0%. In our view, this dividend payment is sustainable as long as the company does not make any major acquisitions.
Figure 23. Contal – Volume Estimates, 2003-2006E (MUC) 2003 2004E 2005E 2006EVolumes (MUC) Soft Drinks 268.44 264.65 269.41 274.41 Jug Water 79.84 78.14 79.71 81.30Total Volumes 348.28 342.79 349.11 355.71Volume Growth Soft Drinks 0.8% -1.4% 1.8% 1.9%Jug Water 12.9% -2.1% 2.0% 2.0%Total Volume Growth 3.3% -1.6% 1.8% 1.9%Sources: Company reports and Santander Investment estimates.
VALUATION We used a DCF analysis to calculate our 2005 year-end target price of US$1.55, which implies a FV/EBITDA target multiple of 5.7 times. We project the free cash flows of the firm for 10 years and discount them by the company’s WACC. Our terminal value uses a perpetuity growth rate of 1%. We use a WACC of 10.5%, based on a target debt to total capital ratio of 15%, a cost of debt of 9%, a risk free rate of 4.3%, a Beta of 0.70 and a country risk of 1.85%. We also add an extra 150 basis points to the risk free rate as a “liquidity” premium due to the thin liquidity of the stock. Our resulting cost of equity is 11.5%.
Our target price of US$1.55 implies a total return of 5.3% from current levels, including a 6.2% dividend yield for 2005. Our target upside for the Mexican market is 10.4% through year-end 2005. At the target multiple of 5.7 times, Contal’s valuation would be in line with the company’s two-year trailing FV/EBITDA multiple.
On a relative valuation basis, Contal’s FV/EBITDA target multiple is 25% below our KOF target multiple of 7.2 times, but in line with its two-year historical premium of 26%. As the leading and most profitable bottler in Mexico (in terms of EBITDA margin and free cash flow yield), KOF’s multiple should command a premium to its peers, in our view. We believe Contal’s 25% target multiple discount to KOF is reasonable under current conditions.
RISKS TO INVESTMENT THESIS The main risks to our investment thesis are (1) a faster than expected recovery of the economy, particularly in the region where Contal operates; (2) higher than expected increases in prices of raw materials mainly sugar and PET resin; (3) a stronger than expected depreciation of the Mexican peso; (3) a more aggressive pricing strategy from PBG; (4) a merger or acquisition of another Coca-Cola franchise; and (5) the realization of a larger-than-expected amount of cost reductions.
Attractive dividend yield.
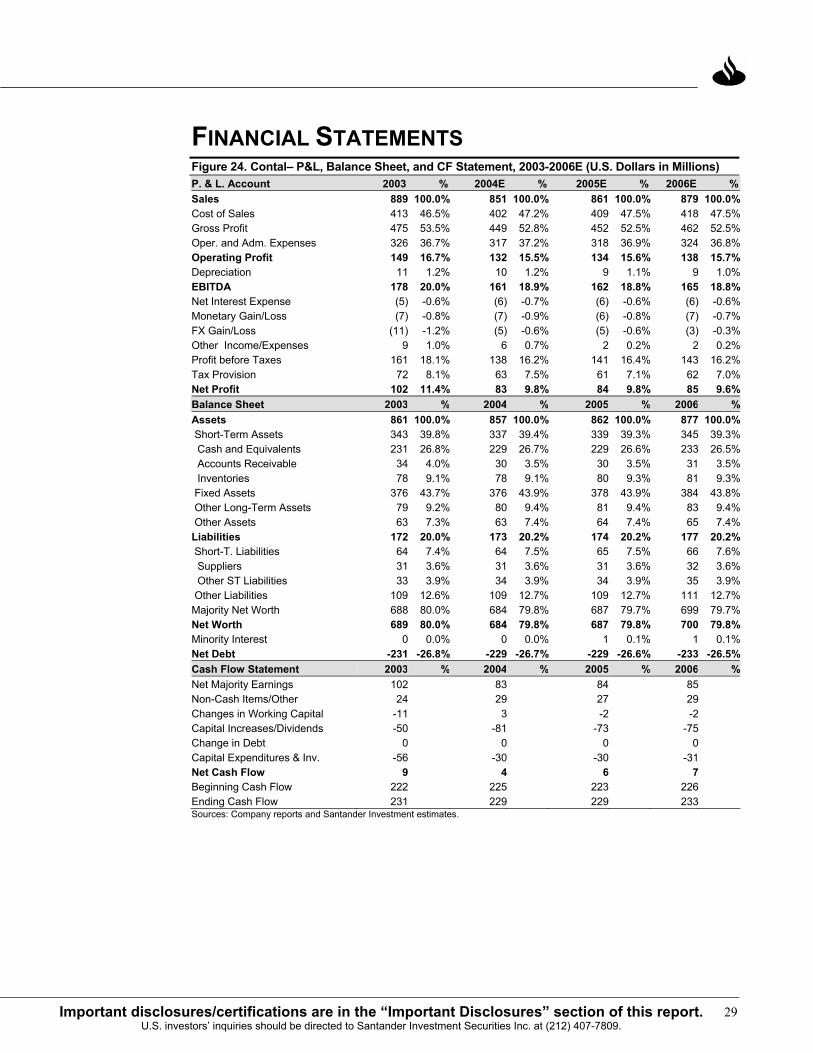
29Important disclosures/certifications are in the “Important Disclosures” section of this report. U.S. investors’ inquiries should be directed to Santander Investment Securities Inc. at (212) 407-7809.
FINANCIAL STATEMENTS Figure 24. Contal– P&L, Balance Sheet, and CF Statement, 2003-2006E (U.S. Dollars in Millions) P. & L. Account 2003 % 2004E % 2005E % 2006E %Sales 889 100.0% 851 100.0% 861 100.0% 879 100.0%Cost of Sales 413 46.5% 402 47.2% 409 47.5% 418 47.5%Gross Profit 475 53.5% 449 52.8% 452 52.5% 462 52.5%Oper. and Adm. Expenses 326 36.7% 317 37.2% 318 36.9% 324 36.8%Operating Profit 149 16.7% 132 15.5% 134 15.6% 138 15.7%Depreciation 11 1.2% 10 1.2% 9 1.1% 9 1.0%EBITDA 178 20.0% 161 18.9% 162 18.8% 165 18.8%Net Interest Expense (5) -0.6% (6) -0.7% (6) -0.6% (6) -0.6%Monetary Gain/Loss (7) -0.8% (7) -0.9% (6) -0.8% (7) -0.7%FX Gain/Loss (11) -1.2% (5) -0.6% (5) -0.6% (3) -0.3%Other Income/Expenses 9 1.0% 6 0.7% 2 0.2% 2 0.2%Profit before Taxes 161 18.1% 138 16.2% 141 16.4% 143 16.2%Tax Provision 72 8.1% 63 7.5% 61 7.1% 62 7.0%Net Profit 102 11.4% 83 9.8% 84 9.8% 85 9.6%Balance Sheet 2003 % 2004 % 2005 % 2006 %Assets 861 100.0% 857 100.0% 862 100.0% 877 100.0% Short-Term Assets 343 39.8% 337 39.4% 339 39.3% 345 39.3% Cash and Equivalents 231 26.8% 229 26.7% 229 26.6% 233 26.5% Accounts Receivable 34 4.0% 30 3.5% 30 3.5% 31 3.5% Inventories 78 9.1% 78 9.1% 80 9.3% 81 9.3% Fixed Assets 376 43.7% 376 43.9% 378 43.9% 384 43.8% Other Long-Term Assets 79 9.2% 80 9.4% 81 9.4% 83 9.4% Other Assets 63 7.3% 63 7.4% 64 7.4% 65 7.4%Liabilities 172 20.0% 173 20.2% 174 20.2% 177 20.2% Short-T. Liabilities 64 7.4% 64 7.5% 65 7.5% 66 7.6% Suppliers 31 3.6% 31 3.6% 31 3.6% 32 3.6% Other ST Liabilities 33 3.9% 34 3.9% 34 3.9% 35 3.9% Other Liabilities 109 12.6% 109 12.7% 109 12.7% 111 12.7%Majority Net Worth 688 80.0% 684 79.8% 687 79.7% 699 79.7%Net Worth 689 80.0% 684 79.8% 687 79.8% 700 79.8%Minority Interest 0 0.0% 0 0.0% 1 0.1% 1 0.1%Net Debt -231 -26.8% -229 -26.7% -229 -26.6% -233 -26.5%Cash Flow Statement 2003 % 2004 % 2005 % 2006 %Net Majority Earnings 102 83 84 85 Non-Cash Items/Other 24 29 27 29 Changes in Working Capital -11 3 -2 -2 Capital Increases/Dividends -50 -81 -73 -75 Change in Debt 0 0 0 0Capital Expenditures & Inv. -56 -30 -30 -31 Net Cash Flow 9 4 6 7 Beginning Cash Flow 222 225 223 226 Ending Cash Flow 231 229 229 233 Sources: Company reports and Santander Investment estimates.
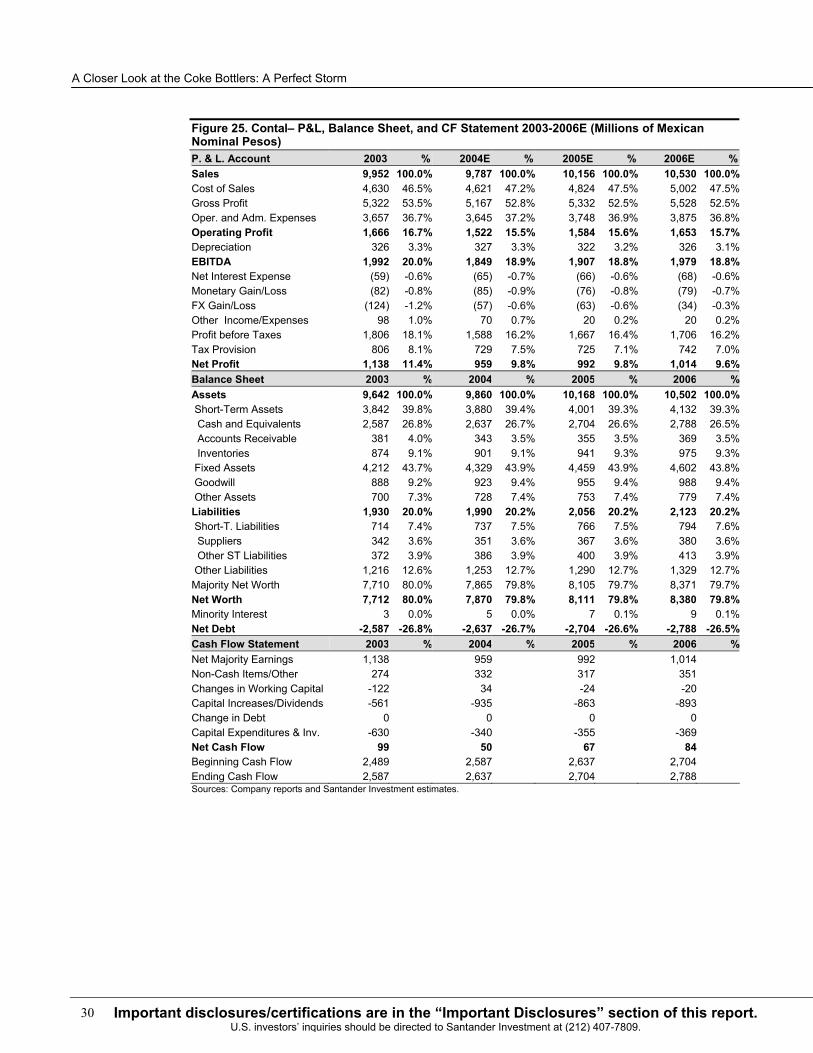
A Closer Look at the Coke Bottlers: A Perfect Storm
30 Important disclosures/certifications are in the “Important Disclosures” section of this report. U.S. investors’ inquiries should be directed to Santander Investment at (212) 407-7809.
Figure 25. Contal– P&L, Balance Sheet, and CF Statement 2003-2006E (Millions of Mexican Nominal Pesos) P. & L. Account 2003 % 2004E % 2005E % 2006E %Sales 9,952 100.0% 9,787 100.0% 10,156 100.0% 10,530 100.0%Cost of Sales 4,630 46.5% 4,621 47.2% 4,824 47.5% 5,002 47.5%Gross Profit 5,322 53.5% 5,167 52.8% 5,332 52.5% 5,528 52.5%Oper. and Adm. Expenses 3,657 36.7% 3,645 37.2% 3,748 36.9% 3,875 36.8%Operating Profit 1,666 16.7% 1,522 15.5% 1,584 15.6% 1,653 15.7%Depreciation 326 3.3% 327 3.3% 322 3.2% 326 3.1%EBITDA 1,992 20.0% 1,849 18.9% 1,907 18.8% 1,979 18.8%Net Interest Expense (59) -0.6% (65) -0.7% (66) -0.6% (68) -0.6%Monetary Gain/Loss (82) -0.8% (85) -0.9% (76) -0.8% (79) -0.7%FX Gain/Loss (124) -1.2% (57) -0.6% (63) -0.6% (34) -0.3%Other Income/Expenses 98 1.0% 70 0.7% 20 0.2% 20 0.2%Profit before Taxes 1,806 18.1% 1,588 16.2% 1,667 16.4% 1,706 16.2%Tax Provision 806 8.1% 729 7.5% 725 7.1% 742 7.0%Net Profit 1,138 11.4% 959 9.8% 992 9.8% 1,014 9.6%Balance Sheet 2003 % 2004 % 2005 % 2006 %Assets 9,642 100.0% 9,860 100.0% 10,168 100.0% 10,502 100.0% Short-Term Assets 3,842 39.8% 3,880 39.4% 4,001 39.3% 4,132 39.3% Cash and Equivalents 2,587 26.8% 2,637 26.7% 2,704 26.6% 2,788 26.5% Accounts Receivable 381 4.0% 343 3.5% 355 3.5% 369 3.5% Inventories 874 9.1% 901 9.1% 941 9.3% 975 9.3% Fixed Assets 4,212 43.7% 4,329 43.9% 4,459 43.9% 4,602 43.8% Goodwill 888 9.2% 923 9.4% 955 9.4% 988 9.4% Other Assets 700 7.3% 728 7.4% 753 7.4% 779 7.4%Liabilities 1,930 20.0% 1,990 20.2% 2,056 20.2% 2,123 20.2% Short-T. Liabilities 714 7.4% 737 7.5% 766 7.5% 794 7.6% Suppliers 342 3.6% 351 3.6% 367 3.6% 380 3.6% Other ST Liabilities 372 3.9% 386 3.9% 400 3.9% 413 3.9% Other Liabilities 1,216 12.6% 1,253 12.7% 1,290 12.7% 1,329 12.7%Majority Net Worth 7,710 80.0% 7,865 79.8% 8,105 79.7% 8,371 79.7%Net Worth 7,712 80.0% 7,870 79.8% 8,111 79.8% 8,380 79.8%Minority Interest 3 0.0% 5 0.0% 7 0.1% 9 0.1%Net Debt -2,587 -26.8% -2,637 -26.7% -2,704 -26.6% -2,788 -26.5%Cash Flow Statement 2003 % 2004 % 2005 % 2006 %Net Majority Earnings 1,138 959 992 1,014 Non-Cash Items/Other 274 332 317 351 Changes in Working Capital -122 34 -24 -20 Capital Increases/Dividends -561 -935 -863 -893 Change in Debt 0 0 0 0Capital Expenditures & Inv. -630 -340 -355 -369 Net Cash Flow 99 50 67 84 Beginning Cash Flow 2,489 2,587 2,637 2,704 Ending Cash Flow 2,587 2,637 2,704 2,788 Sources: Company reports and Santander Investment estimates.
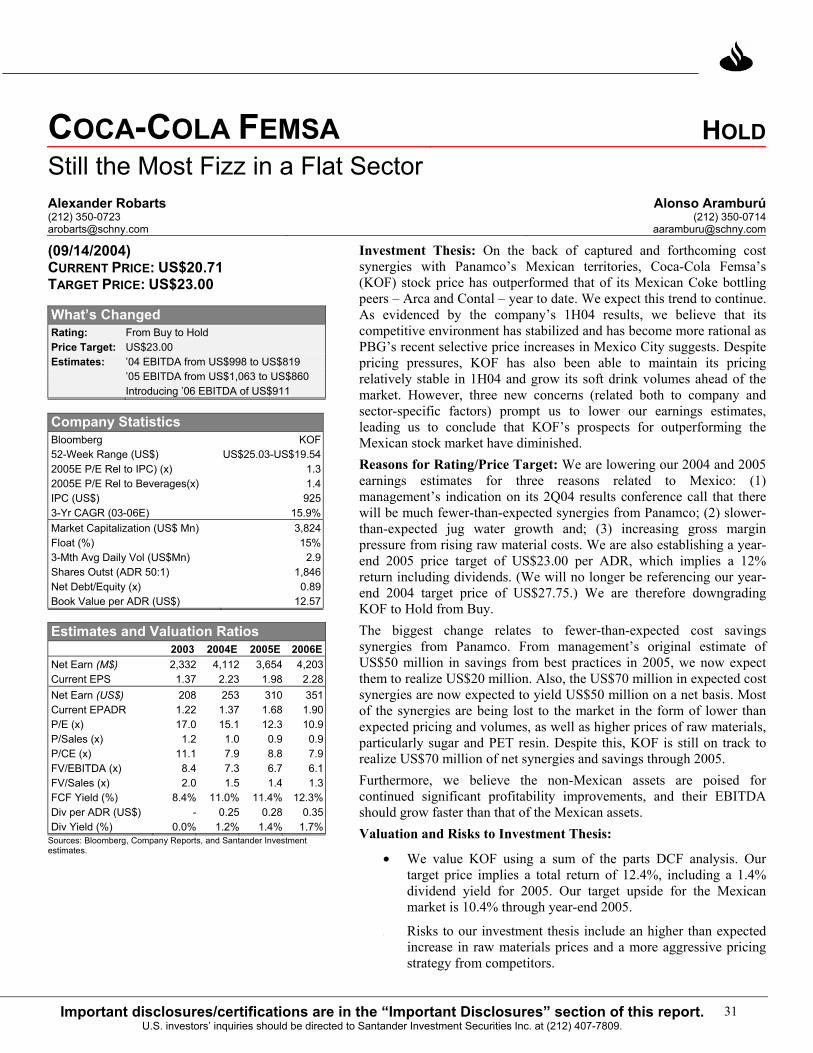
31Important disclosures/certifications are in the “Important Disclosures” section of this report.
U.S. investors’ inquiries should be directed to Santander Investment Securities Inc. at (212) 407-7809.
COCA-COLA FEMSA HOLDStill the Most Fizz in a Flat Sector Alexander Robarts Alonso Aramburú (212) 350-0723 (212) [email protected] [email protected]
(09/14/2004) CURRENT PRICE: US$20.71 TARGET PRICE: US$23.00
What’s Changed Rating: From Buy to Hold Price Target: US$23.00 Estimates: ’04 EBITDA from US$998 to US$819 ’05 EBITDA from US$1,063 to US$860 Introducing ’06 EBITDA of US$911
Company Statistics Bloomberg KOF 52-Week Range (US$) US$25.03-US$19.54 2005E P/E Rel to IPC) (x) 1.3 2005E P/E Rel to Beverages(x) 1.4 IPC (US$) 925 3-Yr CAGR (03-06E) 15.9% Market Capitalization (US$ Mn) 3,824 Float (%) 15% 3-Mth Avg Daily Vol (US$Mn) 2.9 Shares Outst (ADR 50:1) 1,846 Net Debt/Equity (x) 0.89 Book Value per ADR (US$) 12.57
Estimates and Valuation Ratios 2003 2004E 2005E 2006E Net Earn (M$) 2,332 4,112 3,654 4,203 Current EPS 1.37 2.23 1.98 2.28 Net Earn (US$) 208 253 310 351 Current EPADR 1.22 1.37 1.68 1.90 P/E (x) 17.0 15.1 12.3 10.9 P/Sales (x) 1.2 1.0 0.9 0.9 P/CE (x) 11.1 7.9 8.8 7.9 FV/EBITDA (x) 8.4 7.3 6.7 6.1 FV/Sales (x) 2.0 1.5 1.4 1.3 FCF Yield (%) 8.4% 11.0% 11.4% 12.3% Div per ADR (US$) - 0.25 0.28 0.35 Div Yield (%) 0.0% 1.2% 1.4% 1.7%
Sources: Bloomberg, Company Reports, and Santander Investment estimates.
Investment Thesis: On the back of captured and forthcoming cost synergies with Panamco’s Mexican territories, Coca-Cola Femsa’s (KOF) stock price has outperformed that of its Mexican Coke bottling peers – Arca and Contal – year to date. We expect this trend to continue. As evidenced by the company’s 1H04 results, we believe that its competitive environment has stabilized and has become more rational as PBG’s recent selective price increases in Mexico City suggests. Despite pricing pressures, KOF has also been able to maintain its pricing relatively stable in 1H04 and grow its soft drink volumes ahead of the market. However, three new concerns (related both to company and sector-specific factors) prompt us to lower our earnings estimates, leading us to conclude that KOF’s prospects for outperforming the Mexican stock market have diminished. Reasons for Rating/Price Target: We are lowering our 2004 and 2005 earnings estimates for three reasons related to Mexico: (1) management’s indication on its 2Q04 results conference call that there will be much fewer-than-expected synergies from Panamco; (2) slower-than-expected jug water growth and; (3) increasing gross margin pressure from rising raw material costs. We are also establishing a year-end 2005 price target of US$23.00 per ADR, which implies a 12% return including dividends. (We will no longer be referencing our year-end 2004 target price of US$27.75.) We are therefore downgrading KOF to Hold from Buy. The biggest change relates to fewer-than-expected cost savings synergies from Panamco. From management’s original estimate of US$50 million in savings from best practices in 2005, we now expect them to realize US$20 million. Also, the US$70 million in expected cost synergies are now expected to yield US$50 million on a net basis. Most of the synergies are being lost to the market in the form of lower than expected pricing and volumes, as well as higher prices of raw materials, particularly sugar and PET resin. Despite this, KOF is still on track to realize US$70 million of net synergies and savings through 2005. Furthermore, we believe the non-Mexican assets are poised for continued significant profitability improvements, and their EBITDA should grow faster than that of the Mexican assets. Valuation and Risks to Investment Thesis:
• We value KOF using a sum of the parts DCF analysis. Our target price implies a total return of 12.4%, including a 1.4% dividend yield for 2005. Our target upside for the Mexican market is 10.4% through year-end 2005.
• Risks to our investment thesis include an higher than expected increase in raw materials prices and a more aggressive pricing strategy from competitors.
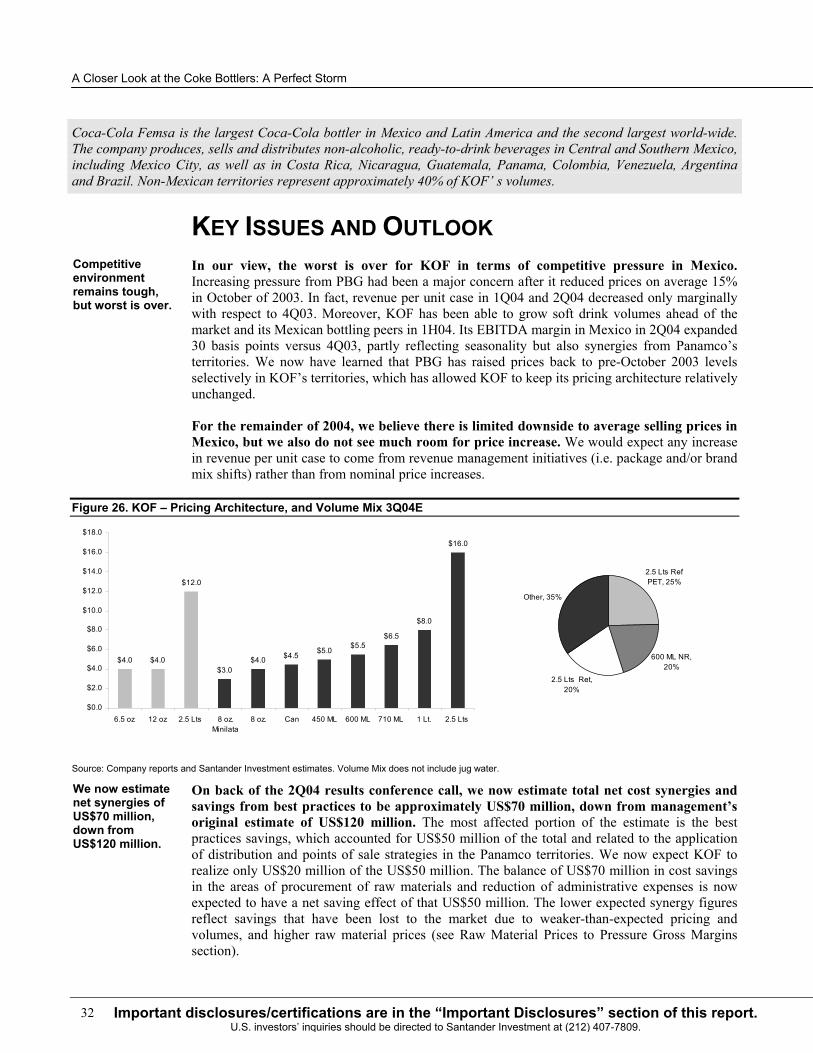
A Closer Look at the Coke Bottlers: A Perfect Storm
32 Important disclosures/certifications are in the “Important Disclosures” section of this report. U.S. investors’ inquiries should be directed to Santander Investment at (212) 407-7809.
Coca-Cola Femsa is the largest Coca-Cola bottler in Mexico and Latin America and the second largest world-wide. The company produces, sells and distributes non-alcoholic, ready-to-drink beverages in Central and Southern Mexico, including Mexico City, as well as in Costa Rica, Nicaragua, Guatemala, Panama, Colombia, Venezuela, Argentina and Brazil. Non-Mexican territories represent approximately 40% of KOF’ s volumes.
KEY ISSUES AND OUTLOOK In our view, the worst is over for KOF in terms of competitive pressure in Mexico. Increasing pressure from PBG had been a major concern after it reduced prices on average 15% in October of 2003. In fact, revenue per unit case in 1Q04 and 2Q04 decreased only marginally with respect to 4Q03. Moreover, KOF has been able to grow soft drink volumes ahead of the market and its Mexican bottling peers in 1H04. Its EBITDA margin in Mexico in 2Q04 expanded 30 basis points versus 4Q03, partly reflecting seasonality but also synergies from Panamco’s territories. We now have learned that PBG has raised prices back to pre-October 2003 levels selectively in KOF’s territories, which has allowed KOF to keep its pricing architecture relatively unchanged.
For the remainder of 2004, we believe there is limited downside to average selling prices in Mexico, but we also do not see much room for price increase. We would expect any increase in revenue per unit case to come from revenue management initiatives (i.e. package and/or brand mix shifts) rather than from nominal price increases.
Figure 26. KOF – Pricing Architecture, and Volume Mix 3Q04E
$4.0 $4.0
$12.0
$3.0$4.0 $4.5 $5.0
$5.5$6.5
$8.0
$16.0
$0.0
$2.0
$4.0
$6.0
$8.0
$10.0
$12.0
$14.0
$16.0
$18.0
6.5 oz 12 oz 2.5 Lts 8 oz.Minilata
8 oz. Can 450 ML 600 ML 710 ML 1 Lt. 2.5 Lts
2.5 Lts Ref PET, 25%
600 ML NR, 20%
2.5 Lts Ret, 20%
Other, 35%
Source: Company reports and Santander Investment estimates. Volume Mix does not include jug water.
On back of the 2Q04 results conference call, we now estimate total net cost synergies and savings from best practices to be approximately US$70 million, down from management’s original estimate of US$120 million. The most affected portion of the estimate is the best practices savings, which accounted for US$50 million of the total and related to the application of distribution and points of sale strategies in the Panamco territories. We now expect KOF to realize only US$20 million of the US$50 million. The balance of US$70 million in cost savings in the areas of procurement of raw materials and reduction of administrative expenses is now expected to have a net saving effect of that US$50 million. The lower expected synergy figures reflect savings that have been lost to the market due to weaker-than-expected pricing and volumes, and higher raw material prices (see Raw Material Prices to Pressure Gross Margins section).
Competitive environment remains tough, but worst is over.
We now estimate net synergies of US$70 million, down from US$120 million.
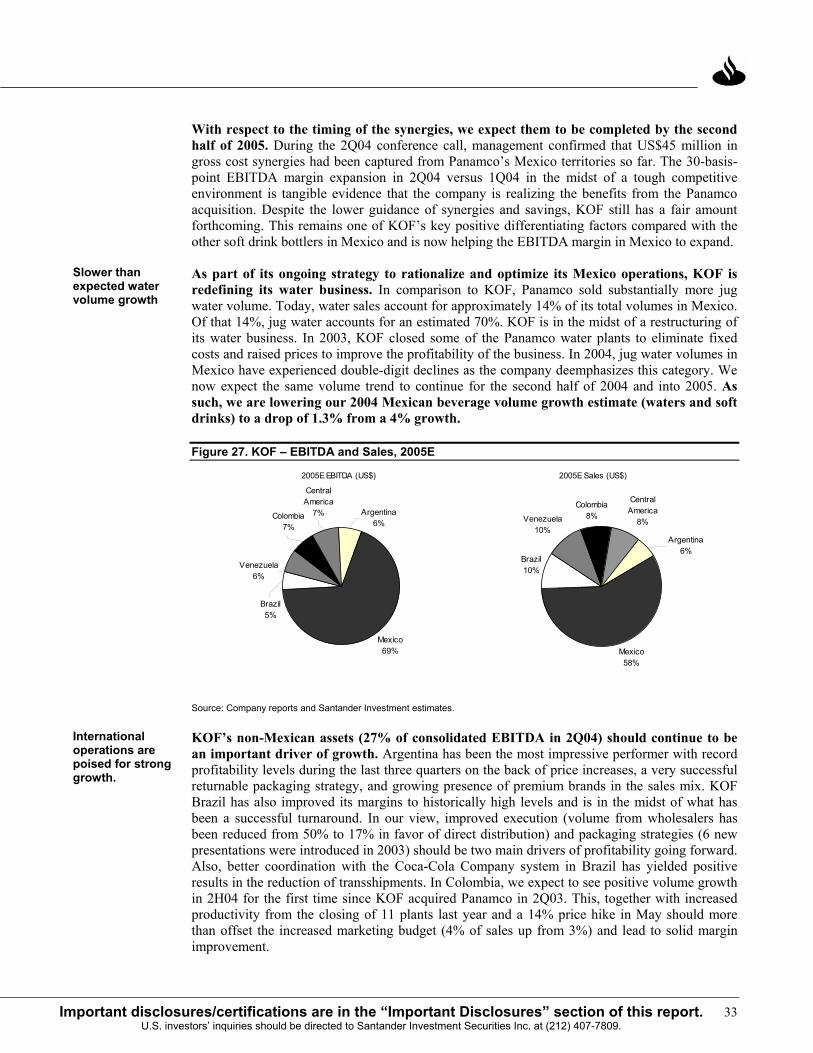
33Important disclosures/certifications are in the “Important Disclosures” section of this report. U.S. investors’ inquiries should be directed to Santander Investment Securities Inc. at (212) 407-7809.
With respect to the timing of the synergies, we expect them to be completed by the second half of 2005. During the 2Q04 conference call, management confirmed that US$45 million in gross cost synergies had been captured from Panamco’s Mexico territories so far. The 30-basis-point EBITDA margin expansion in 2Q04 versus 1Q04 in the midst of a tough competitive environment is tangible evidence that the company is realizing the benefits from the Panamco acquisition. Despite the lower guidance of synergies and savings, KOF still has a fair amount forthcoming. This remains one of KOF’s key positive differentiating factors compared with the other soft drink bottlers in Mexico and is now helping the EBITDA margin in Mexico to expand.
As part of its ongoing strategy to rationalize and optimize its Mexico operations, KOF is redefining its water business. In comparison to KOF, Panamco sold substantially more jug water volume. Today, water sales account for approximately 14% of its total volumes in Mexico. Of that 14%, jug water accounts for an estimated 70%. KOF is in the midst of a restructuring of its water business. In 2003, KOF closed some of the Panamco water plants to eliminate fixed costs and raised prices to improve the profitability of the business. In 2004, jug water volumes in Mexico have experienced double-digit declines as the company deemphasizes this category. We now expect the same volume trend to continue for the second half of 2004 and into 2005. As such, we are lowering our 2004 Mexican beverage volume growth estimate (waters and soft drinks) to a drop of 1.3% from a 4% growth.
Figure 27. KOF – EBITDA and Sales, 2005E
2005E EBITDA (US$)
Mexico 69%
Argentina6%
Brazil5%
Colombia7%
Central America
7%
Venezuela6%
2005E Sales (US$)
Mexico 58%
Brazil10%
Venezuela10%
Colombia8%
Central America
8%
Argentina6%
Source: Company reports and Santander Investment estimates.
KOF’s non-Mexican assets (27% of consolidated EBITDA in 2Q04) should continue to be an important driver of growth. Argentina has been the most impressive performer with record profitability levels during the last three quarters on the back of price increases, a very successful returnable packaging strategy, and growing presence of premium brands in the sales mix. KOF Brazil has also improved its margins to historically high levels and is in the midst of what has been a successful turnaround. In our view, improved execution (volume from wholesalers has been reduced from 50% to 17% in favor of direct distribution) and packaging strategies (6 new presentations were introduced in 2003) should be two main drivers of profitability going forward. Also, better coordination with the Coca-Cola Company system in Brazil has yielded positive results in the reduction of transshipments. In Colombia, we expect to see positive volume growth in 2H04 for the first time since KOF acquired Panamco in 2Q03. This, together with increased productivity from the closing of 11 plants last year and a 14% price hike in May should more than offset the increased marketing budget (4% of sales up from 3%) and lead to solid margin improvement.
Slower than expected water volume growth
International operations are poised for strong growth.
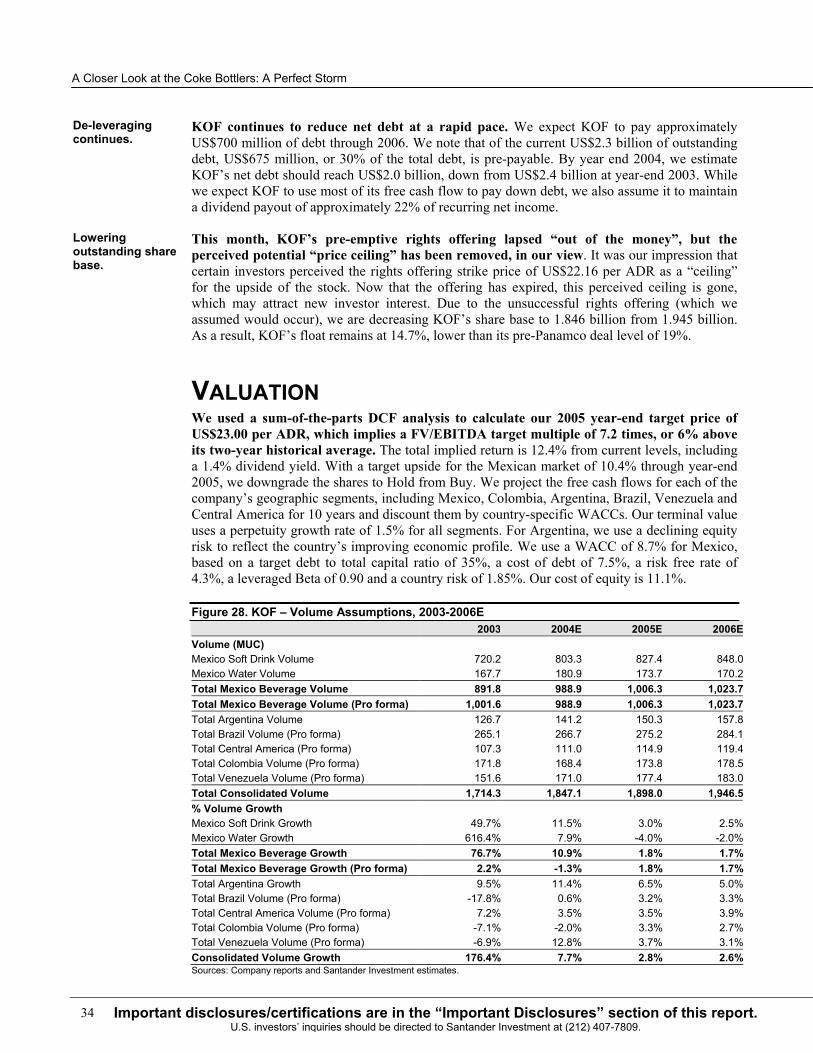
A Closer Look at the Coke Bottlers: A Perfect Storm
34 Important disclosures/certifications are in the “Important Disclosures” section of this report. U.S. investors’ inquiries should be directed to Santander Investment at (212) 407-7809.
KOF continues to reduce net debt at a rapid pace. We expect KOF to pay approximately US$700 million of debt through 2006. We note that of the current US$2.3 billion of outstanding debt, US$675 million, or 30% of the total debt, is pre-payable. By year end 2004, we estimate KOF’s net debt should reach US$2.0 billion, down from US$2.4 billion at year-end 2003. While we expect KOF to use most of its free cash flow to pay down debt, we also assume it to maintain a dividend payout of approximately 22% of recurring net income.
This month, KOF’s pre-emptive rights offering lapsed “out of the money”, but the perceived potential “price ceiling” has been removed, in our view. It was our impression that certain investors perceived the rights offering strike price of US$22.16 per ADR as a “ceiling” for the upside of the stock. Now that the offering has expired, this perceived ceiling is gone, which may attract new investor interest. Due to the unsuccessful rights offering (which we assumed would occur), we are decreasing KOF’s share base to 1.846 billion from 1.945 billion. As a result, KOF’s float remains at 14.7%, lower than its pre-Panamco deal level of 19%.
VALUATION We used a sum-of-the-parts DCF analysis to calculate our 2005 year-end target price of US$23.00 per ADR, which implies a FV/EBITDA target multiple of 7.2 times, or 6% above its two-year historical average. The total implied return is 12.4% from current levels, including a 1.4% dividend yield. With a target upside for the Mexican market of 10.4% through year-end 2005, we downgrade the shares to Hold from Buy. We project the free cash flows for each of the company’s geographic segments, including Mexico, Colombia, Argentina, Brazil, Venezuela and Central America for 10 years and discount them by country-specific WACCs. Our terminal value uses a perpetuity growth rate of 1.5% for all segments. For Argentina, we use a declining equity risk to reflect the country’s improving economic profile. We use a WACC of 8.7% for Mexico, based on a target debt to total capital ratio of 35%, a cost of debt of 7.5%, a risk free rate of 4.3%, a leveraged Beta of 0.90 and a country risk of 1.85%. Our cost of equity is 11.1%.
Figure 28. KOF – Volume Assumptions, 2003-2006E 2003 2004E 2005E 2006EVolume (MUC) Mexico Soft Drink Volume 720.2 803.3 827.4 848.0Mexico Water Volume 167.7 180.9 173.7 170.2Total Mexico Beverage Volume 891.8 988.9 1,006.3 1,023.7Total Mexico Beverage Volume (Pro forma) 1,001.6 988.9 1,006.3 1,023.7Total Argentina Volume 126.7 141.2 150.3 157.8Total Brazil Volume (Pro forma) 265.1 266.7 275.2 284.1Total Central America (Pro forma) 107.3 111.0 114.9 119.4Total Colombia Volume (Pro forma) 171.8 168.4 173.8 178.5Total Venezuela Volume (Pro forma) 151.6 171.0 177.4 183.0Total Consolidated Volume 1,714.3 1,847.1 1,898.0 1,946.5% Volume Growth Mexico Soft Drink Growth 49.7% 11.5% 3.0% 2.5%Mexico Water Growth 616.4% 7.9% -4.0% -2.0%Total Mexico Beverage Growth 76.7% 10.9% 1.8% 1.7%Total Mexico Beverage Growth (Pro forma) 2.2% -1.3% 1.8% 1.7%Total Argentina Growth 9.5% 11.4% 6.5% 5.0%Total Brazil Volume (Pro forma) -17.8% 0.6% 3.2% 3.3%Total Central America Volume (Pro forma) 7.2% 3.5% 3.5% 3.9%Total Colombia Volume (Pro forma) -7.1% -2.0% 3.3% 2.7%Total Venezuela Volume (Pro forma) -6.9% 12.8% 3.7% 3.1%Consolidated Volume Growth 176.4% 7.7% 2.8% 2.6%Sources: Company reports and Santander Investment estimates.
De-leveraging continues.
Lowering outstanding share base.

35Important disclosures/certifications are in the “Important Disclosures” section of this report. U.S. investors’ inquiries should be directed to Santander Investment Securities Inc. at (212) 407-7809.
RISKS TO INVESTMENT THESIS The main risks to our investment thesis are (1) a faster than expected recovery of the economy, particularly in the region where KOF operates; (2) higher-than-expected prices of raw materials mainly sugar and PET resin; (3) a stronger than expected depreciation of the peso; (3) a more aggressive pricing strategy from PBG; (4) political and economic stability in the company’s international markets; and (5) a material change in the expected amount of cost synergies.
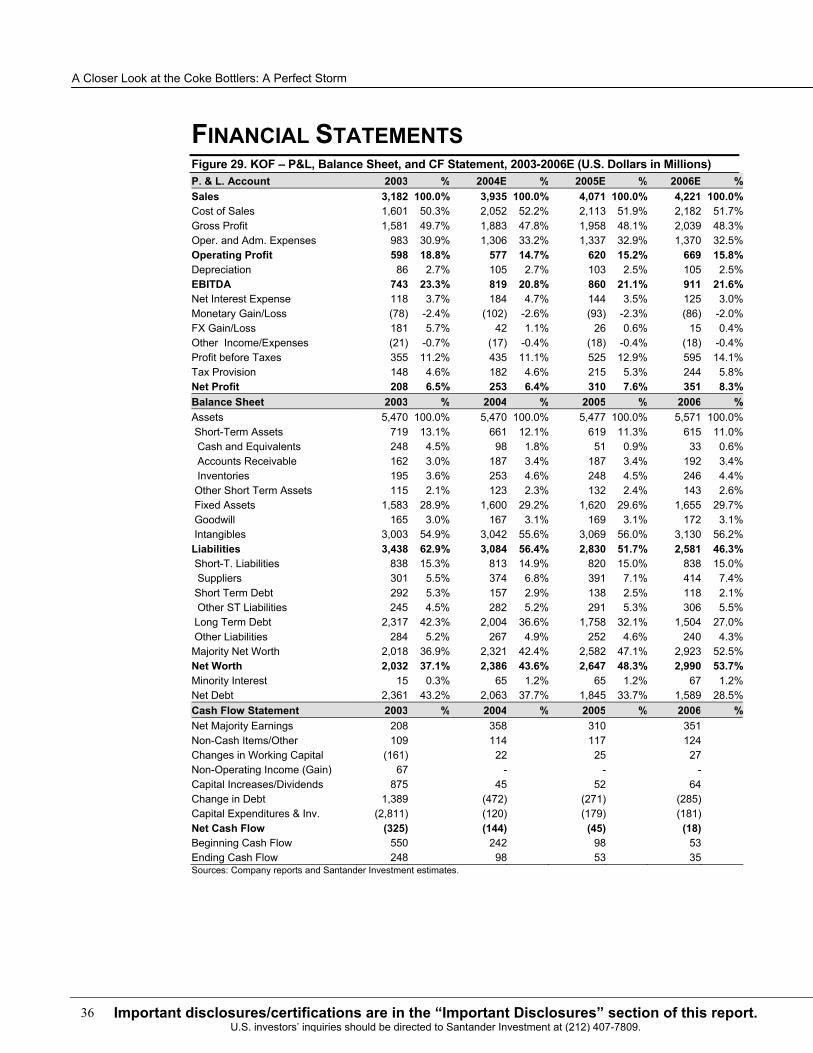
A Closer Look at the Coke Bottlers: A Perfect Storm
36 Important disclosures/certifications are in the “Important Disclosures” section of this report. U.S. investors’ inquiries should be directed to Santander Investment at (212) 407-7809.
FINANCIAL STATEMENTS Figure 29. KOF – P&L, Balance Sheet, and CF Statement, 2003-2006E (U.S. Dollars in Millions) P. & L. Account 2003 % 2004E % 2005E % 2006E %Sales 3,182 100.0% 3,935 100.0% 4,071 100.0% 4,221 100.0%Cost of Sales 1,601 50.3% 2,052 52.2% 2,113 51.9% 2,182 51.7%Gross Profit 1,581 49.7% 1,883 47.8% 1,958 48.1% 2,039 48.3%Oper. and Adm. Expenses 983 30.9% 1,306 33.2% 1,337 32.9% 1,370 32.5%Operating Profit 598 18.8% 577 14.7% 620 15.2% 669 15.8%Depreciation 86 2.7% 105 2.7% 103 2.5% 105 2.5%EBITDA 743 23.3% 819 20.8% 860 21.1% 911 21.6%Net Interest Expense 118 3.7% 184 4.7% 144 3.5% 125 3.0%Monetary Gain/Loss (78) -2.4% (102) -2.6% (93) -2.3% (86) -2.0%FX Gain/Loss 181 5.7% 42 1.1% 26 0.6% 15 0.4%Other Income/Expenses (21) -0.7% (17) -0.4% (18) -0.4% (18) -0.4%Profit before Taxes 355 11.2% 435 11.1% 525 12.9% 595 14.1%Tax Provision 148 4.6% 182 4.6% 215 5.3% 244 5.8%Net Profit 208 6.5% 253 6.4% 310 7.6% 351 8.3%Balance Sheet 2003 % 2004 % 2005 % 2006 %Assets 5,470 100.0% 5,470 100.0% 5,477 100.0% 5,571 100.0% Short-Term Assets 719 13.1% 661 12.1% 619 11.3% 615 11.0% Cash and Equivalents 248 4.5% 98 1.8% 51 0.9% 33 0.6% Accounts Receivable 162 3.0% 187 3.4% 187 3.4% 192 3.4% Inventories 195 3.6% 253 4.6% 248 4.5% 246 4.4% Other Short Term Assets 115 2.1% 123 2.3% 132 2.4% 143 2.6% Fixed Assets 1,583 28.9% 1,600 29.2% 1,620 29.6% 1,655 29.7% Goodwill 165 3.0% 167 3.1% 169 3.1% 172 3.1% Intangibles 3,003 54.9% 3,042 55.6% 3,069 56.0% 3,130 56.2%Liabilities 3,438 62.9% 3,084 56.4% 2,830 51.7% 2,581 46.3% Short-T. Liabilities 838 15.3% 813 14.9% 820 15.0% 838 15.0% Suppliers 301 5.5% 374 6.8% 391 7.1% 414 7.4% Short Term Debt 292 5.3% 157 2.9% 138 2.5% 118 2.1% Other ST Liabilities 245 4.5% 282 5.2% 291 5.3% 306 5.5% Long Term Debt 2,317 42.3% 2,004 36.6% 1,758 32.1% 1,504 27.0% Other Liabilities 284 5.2% 267 4.9% 252 4.6% 240 4.3%Majority Net Worth 2,018 36.9% 2,321 42.4% 2,582 47.1% 2,923 52.5%Net Worth 2,032 37.1% 2,386 43.6% 2,647 48.3% 2,990 53.7%Minority Interest 15 0.3% 65 1.2% 65 1.2% 67 1.2%Net Debt 2,361 43.2% 2,063 37.7% 1,845 33.7% 1,589 28.5%Cash Flow Statement 2003 % 2004 % 2005 % 2006 %Net Majority Earnings 208 358 310 351 Non-Cash Items/Other 109 114 117 124 Changes in Working Capital (161) 22 25 27 Non-Operating Income (Gain) 67 - - -Capital Increases/Dividends 875 45 52 64 Change in Debt 1,389 (472) (271) (285)Capital Expenditures & Inv. (2,811) (120) (179) (181)Net Cash Flow (325) (144) (45) (18)Beginning Cash Flow 550 242 98 53 Ending Cash Flow 248 98 53 35 Sources: Company reports and Santander Investment estimates.
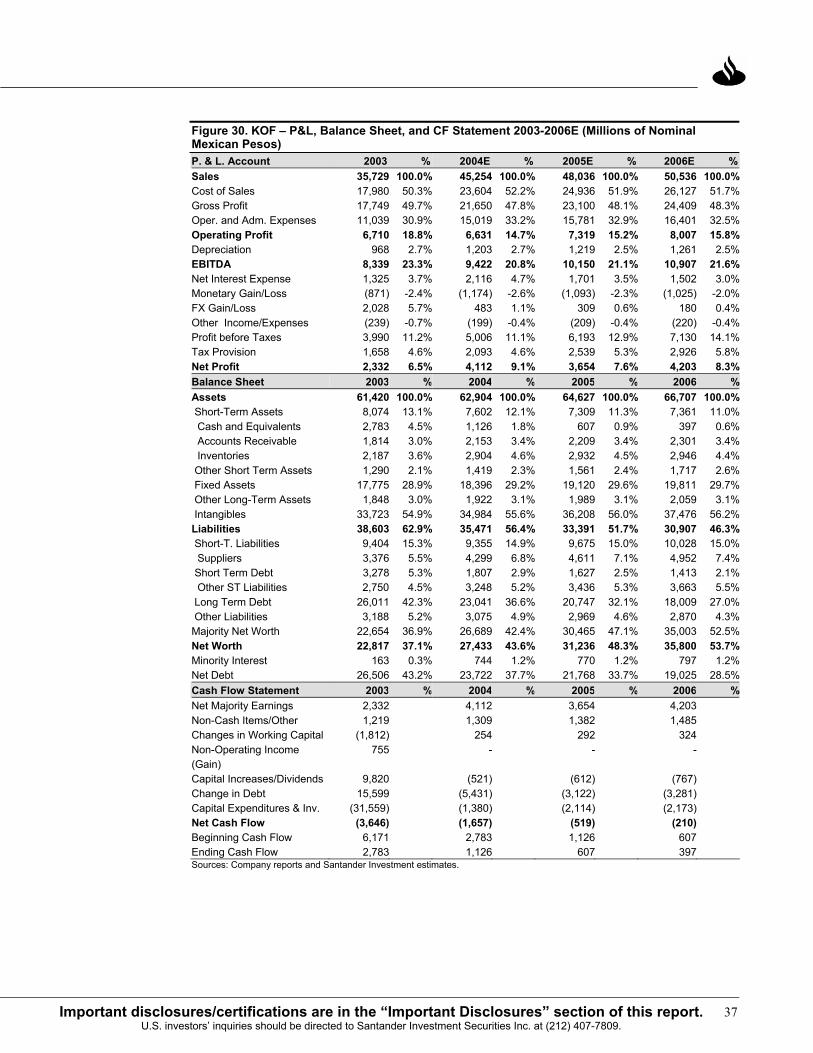
37Important disclosures/certifications are in the “Important Disclosures” section of this report. U.S. investors’ inquiries should be directed to Santander Investment Securities Inc. at (212) 407-7809.
Figure 30. KOF – P&L, Balance Sheet, and CF Statement 2003-2006E (Millions of Nominal Mexican Pesos) P. & L. Account 2003 % 2004E % 2005E % 2006E %Sales 35,729 100.0% 45,254 100.0% 48,036 100.0% 50,536 100.0%Cost of Sales 17,980 50.3% 23,604 52.2% 24,936 51.9% 26,127 51.7%Gross Profit 17,749 49.7% 21,650 47.8% 23,100 48.1% 24,409 48.3%Oper. and Adm. Expenses 11,039 30.9% 15,019 33.2% 15,781 32.9% 16,401 32.5%Operating Profit 6,710 18.8% 6,631 14.7% 7,319 15.2% 8,007 15.8%Depreciation 968 2.7% 1,203 2.7% 1,219 2.5% 1,261 2.5%EBITDA 8,339 23.3% 9,422 20.8% 10,150 21.1% 10,907 21.6%Net Interest Expense 1,325 3.7% 2,116 4.7% 1,701 3.5% 1,502 3.0%Monetary Gain/Loss (871) -2.4% (1,174) -2.6% (1,093) -2.3% (1,025) -2.0%FX Gain/Loss 2,028 5.7% 483 1.1% 309 0.6% 180 0.4%Other Income/Expenses (239) -0.7% (199) -0.4% (209) -0.4% (220) -0.4%Profit before Taxes 3,990 11.2% 5,006 11.1% 6,193 12.9% 7,130 14.1%Tax Provision 1,658 4.6% 2,093 4.6% 2,539 5.3% 2,926 5.8%Net Profit 2,332 6.5% 4,112 9.1% 3,654 7.6% 4,203 8.3%Balance Sheet 2003 % 2004 % 2005 % 2006 %Assets 61,420 100.0% 62,904 100.0% 64,627 100.0% 66,707 100.0% Short-Term Assets 8,074 13.1% 7,602 12.1% 7,309 11.3% 7,361 11.0% Cash and Equivalents 2,783 4.5% 1,126 1.8% 607 0.9% 397 0.6% Accounts Receivable 1,814 3.0% 2,153 3.4% 2,209 3.4% 2,301 3.4% Inventories 2,187 3.6% 2,904 4.6% 2,932 4.5% 2,946 4.4% Other Short Term Assets 1,290 2.1% 1,419 2.3% 1,561 2.4% 1,717 2.6% Fixed Assets 17,775 28.9% 18,396 29.2% 19,120 29.6% 19,811 29.7% Other Long-Term Assets 1,848 3.0% 1,922 3.1% 1,989 3.1% 2,059 3.1% Intangibles 33,723 54.9% 34,984 55.6% 36,208 56.0% 37,476 56.2%Liabilities 38,603 62.9% 35,471 56.4% 33,391 51.7% 30,907 46.3% Short-T. Liabilities 9,404 15.3% 9,355 14.9% 9,675 15.0% 10,028 15.0% Suppliers 3,376 5.5% 4,299 6.8% 4,611 7.1% 4,952 7.4% Short Term Debt 3,278 5.3% 1,807 2.9% 1,627 2.5% 1,413 2.1% Other ST Liabilities 2,750 4.5% 3,248 5.2% 3,436 5.3% 3,663 5.5% Long Term Debt 26,011 42.3% 23,041 36.6% 20,747 32.1% 18,009 27.0% Other Liabilities 3,188 5.2% 3,075 4.9% 2,969 4.6% 2,870 4.3%Majority Net Worth 22,654 36.9% 26,689 42.4% 30,465 47.1% 35,003 52.5%Net Worth 22,817 37.1% 27,433 43.6% 31,236 48.3% 35,800 53.7%Minority Interest 163 0.3% 744 1.2% 770 1.2% 797 1.2%Net Debt 26,506 43.2% 23,722 37.7% 21,768 33.7% 19,025 28.5%Cash Flow Statement 2003 % 2004 % 2005 % 2006 %Net Majority Earnings 2,332 4,112 3,654 4,203 Non-Cash Items/Other 1,219 1,309 1,382 1,485 Changes in Working Capital (1,812) 254 292 324 Non-Operating Income (Gain)
755 - - -
Capital Increases/Dividends 9,820 (521) (612) (767)Change in Debt 15,599 (5,431) (3,122) (3,281)Capital Expenditures & Inv. (31,559) (1,380) (2,114) (2,173)Net Cash Flow (3,646) (1,657) (519) (210)Beginning Cash Flow 6,171 2,783 1,126 607 Ending Cash Flow 2,783 1,126 607 397 Sources: Company reports and Santander Investment estimates.

A Closer Look at the Coke Bottlers: A Perfect Storm
38 Important disclosures/certifications are in the “Important Disclosures” section of this report. U.S. investors’ inquiries should be directed to Santander Investment at (212) 407-7809.
Figure 31. KOF Mexico – P&L, Balance Sheet, and CF Statement 2003-2006E (U.S. Dollars in Millions) P. & L. Account 2003 2004E 2005E 2006EBeverage Sales 2,109 2,272 2,321 2,408Other Sales 22 16 16 16Total Sales 2,132 2,287 2,336 2,424Depreciation 52 59 59 60Cost of Sales 935 1,016 1,032 1,067Gross Profit 1,144 1,212 1,245 1,297Gross Margin 53.7% 53.0% 53.3% 53.5%Administrative 145 138 138 141As a Pct of Sales 6.8% 6.0% 5.9% 5.8%Selling 497 622 633 650As a Pct of Sales 23.3% 27.2% 27.1% 26.8%Operating Expense 642 760 771 790 As a Pct of Sales 30.1% 33.2% 33.0% 32.6%Goodwill Amortization - - - -Operating Income 502 453 474 507 Operating Margin 23.5% 19.8% 20.3% 20.9%Non-Cash Items 35.7 55.7 55.0 55.7 EBITDA 590 568 588 622 EBITDA margin 27.7% 24.8% 25.2% 25.7%Sources: Company reports and Santander Investment estimates. Note: 2003 includes only 8 months of Panamco
Figure 32. KOF Mexico – P&L, Balance Sheet, and CF Statement 2003-2006E (Millions of Nominal Mexican Pesos) P. & L. Account 2003 2004E 2005E 2006EBeverage Sales 23,683 26,124 27,383 28,829Other Sales 252 181 187 193Total Sales 23,935 26,306 27,569 29,021Depreciation 587 683 692 716Cost of Sales 10,504 11,679 12,183 12,779Gross Profit 12,845 13,943 14,695 15,526Gross Margin 53.7% 53.0% 53.3% 53.5%Administrative 1,632 1,585 1,627 1,683As a Pct of Sales 6.8% 6.0% 5.9% 5.8%Selling 5,580 7,151 7,471 7,778As a Pct of Sales 23.3% 27.2% 27.1% 26.8%Operating Expense 7,211 8,736 9,098 9,461 As a Pct of Sales 30.1% 33.2% 33.0% 32.6%Goodwill Amortization - - - -Operating Income 5,633 5,207 5,597 6,065 Operating Margin 23.5% 19.8% 20.3% 20.9%Non-Cash Items 401 641 649 667 EBITDA 6,621 6,532 6,938 7,449 EBITDA margin 27.7% 24.8% 25.2% 25.7%Sources: Company reports and Santander Investment estimates. Note: 2003 includes only 8 months of Panamco.
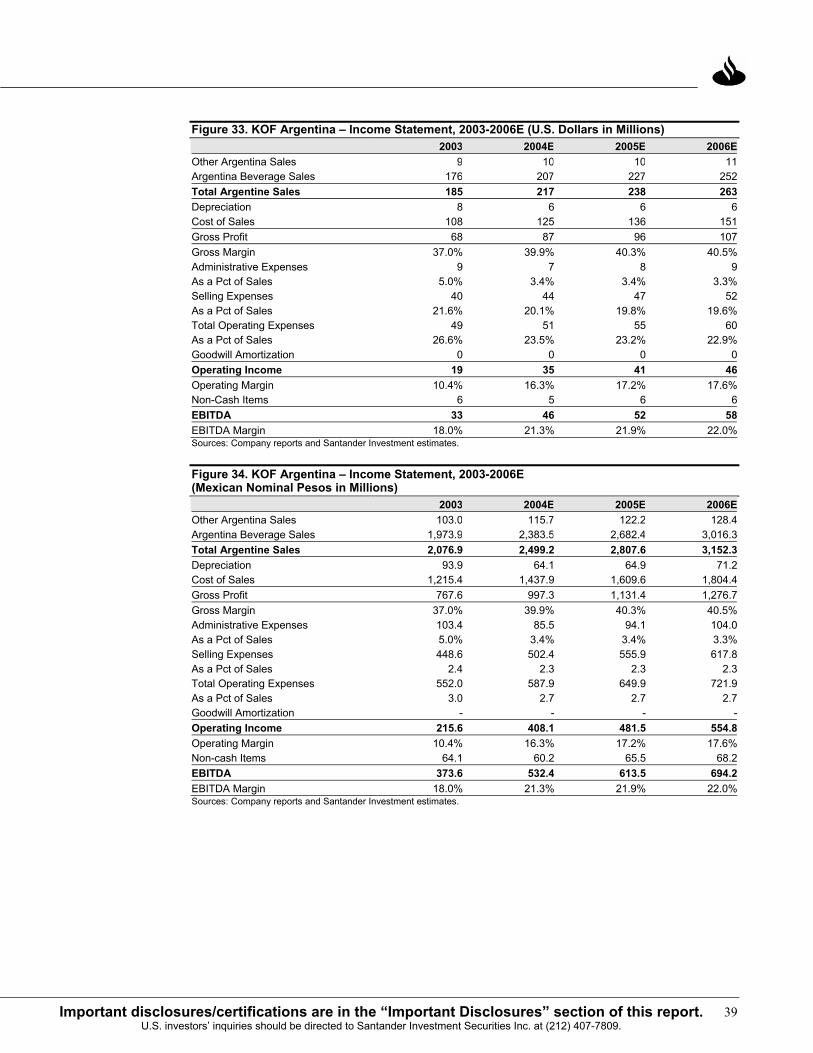
39Important disclosures/certifications are in the “Important Disclosures” section of this report. U.S. investors’ inquiries should be directed to Santander Investment Securities Inc. at (212) 407-7809.
Figure 33. KOF Argentina – Income Statement, 2003-2006E (U.S. Dollars in Millions) 2003 2004E 2005E 2006EOther Argentina Sales 9 10 10 11Argentina Beverage Sales 176 207 227 252Total Argentine Sales 185 217 238 263Depreciation 8 6 6 6Cost of Sales 108 125 136 151Gross Profit 68 87 96 107Gross Margin 37.0% 39.9% 40.3% 40.5%Administrative Expenses 9 7 8 9As a Pct of Sales 5.0% 3.4% 3.4% 3.3%Selling Expenses 40 44 47 52As a Pct of Sales 21.6% 20.1% 19.8% 19.6%Total Operating Expenses 49 51 55 60As a Pct of Sales 26.6% 23.5% 23.2% 22.9%Goodwill Amortization 0 0 0 0Operating Income 19 35 41 46Operating Margin 10.4% 16.3% 17.2% 17.6%Non-Cash Items 6 5 6 6EBITDA 33 46 52 58EBITDA Margin 18.0% 21.3% 21.9% 22.0%Sources: Company reports and Santander Investment estimates.
Figure 34. KOF Argentina – Income Statement, 2003-2006E (Mexican Nominal Pesos in Millions) 2003 2004E 2005E 2006EOther Argentina Sales 103.0 115.7 122.2 128.4 Argentina Beverage Sales 1,973.9 2,383.5 2,682.4 3,016.3 Total Argentine Sales 2,076.9 2,499.2 2,807.6 3,152.3 Depreciation 93.9 64.1 64.9 71.2 Cost of Sales 1,215.4 1,437.9 1,609.6 1,804.4 Gross Profit 767.6 997.3 1,131.4 1,276.7 Gross Margin 37.0% 39.9% 40.3% 40.5%Administrative Expenses 103.4 85.5 94.1 104.0 As a Pct of Sales 5.0% 3.4% 3.4% 3.3%Selling Expenses 448.6 502.4 555.9 617.8As a Pct of Sales 2.4 2.3 2.3 2.3 Total Operating Expenses 552.0 587.9 649.9 721.9 As a Pct of Sales 3.0 2.7 2.7 2.7 Goodwill Amortization - - - -Operating Income 215.6 408.1 481.5 554.8 Operating Margin 10.4% 16.3% 17.2% 17.6%Non-cash Items 64.1 60.2 65.5 68.2 EBITDA 373.6 532.4 613.5 694.2 EBITDA Margin 18.0% 21.3% 21.9% 22.0%Sources: Company reports and Santander Investment estimates.
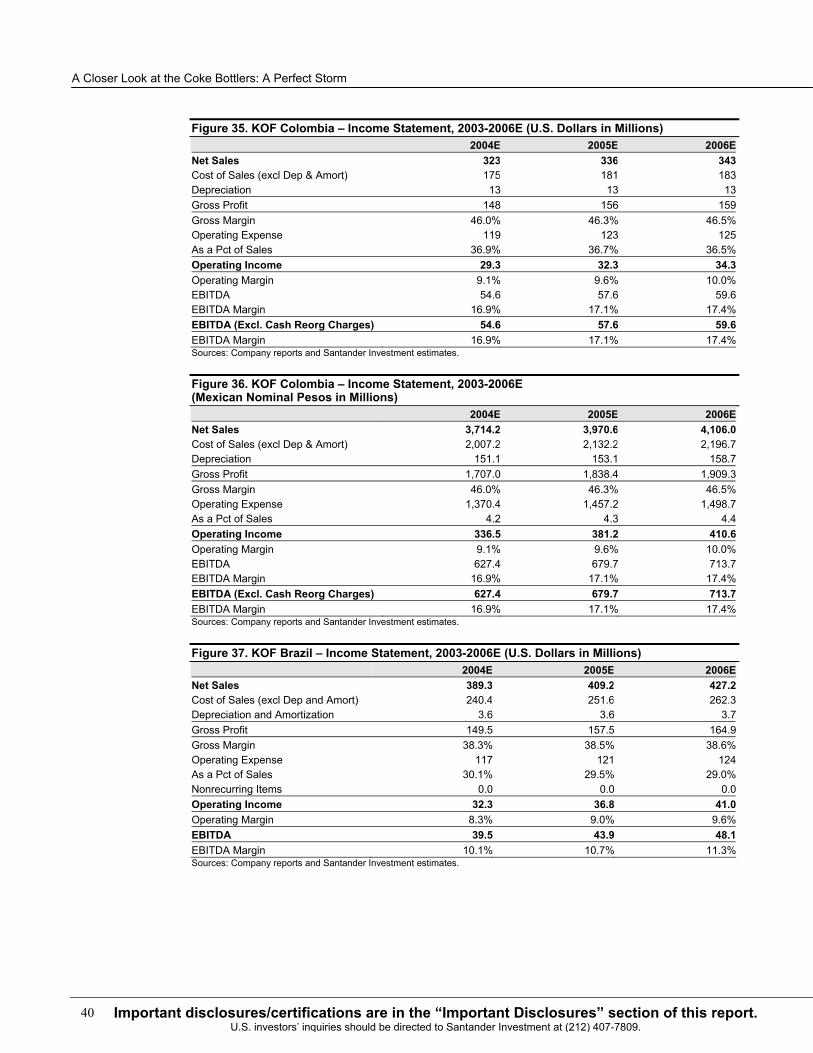
A Closer Look at the Coke Bottlers: A Perfect Storm
40 Important disclosures/certifications are in the “Important Disclosures” section of this report. U.S. investors’ inquiries should be directed to Santander Investment at (212) 407-7809.
Figure 35. KOF Colombia – Income Statement, 2003-2006E (U.S. Dollars in Millions) 2004E 2005E 2006ENet Sales 323 336 343Cost of Sales (excl Dep & Amort) 175 181 183Depreciation 13 13 13Gross Profit 148 156 159Gross Margin 46.0% 46.3% 46.5%Operating Expense 119 123 125As a Pct of Sales 36.9% 36.7% 36.5%Operating Income 29.3 32.3 34.3Operating Margin 9.1% 9.6% 10.0%EBITDA 54.6 57.6 59.6EBITDA Margin 16.9% 17.1% 17.4%EBITDA (Excl. Cash Reorg Charges) 54.6 57.6 59.6EBITDA Margin 16.9% 17.1% 17.4%Sources: Company reports and Santander Investment estimates.
Figure 36. KOF Colombia – Income Statement, 2003-2006E (Mexican Nominal Pesos in Millions) 2004E 2005E 2006ENet Sales 3,714.2 3,970.6 4,106.0 Cost of Sales (excl Dep & Amort) 2,007.2 2,132.2 2,196.7 Depreciation 151.1 153.1 158.7 Gross Profit 1,707.0 1,838.4 1,909.3 Gross Margin 46.0% 46.3% 46.5%Operating Expense 1,370.4 1,457.2 1,498.7 As a Pct of Sales 4.2 4.3 4.4 Operating Income 336.5 381.2 410.6 Operating Margin 9.1% 9.6% 10.0%EBITDA 627.4 679.7 713.7 EBITDA Margin 16.9% 17.1% 17.4%EBITDA (Excl. Cash Reorg Charges) 627.4 679.7 713.7 EBITDA Margin 16.9% 17.1% 17.4%Sources: Company reports and Santander Investment estimates.
Figure 37. KOF Brazil – Income Statement, 2003-2006E (U.S. Dollars in Millions) 2004E 2005E 2006ENet Sales 389.3 409.2 427.2Cost of Sales (excl Dep and Amort) 240.4 251.6 262.3Depreciation and Amortization 3.6 3.6 3.7Gross Profit 149.5 157.5 164.9Gross Margin 38.3% 38.5% 38.6%Operating Expense 117 121 124As a Pct of Sales 30.1% 29.5% 29.0%Nonrecurring Items 0.0 0.0 0.0Operating Income 32.3 36.8 41.0Operating Margin 8.3% 9.0% 9.6%EBITDA 39.5 43.9 48.1EBITDA Margin 10.1% 10.7% 11.3%Sources: Company reports and Santander Investment estimates.
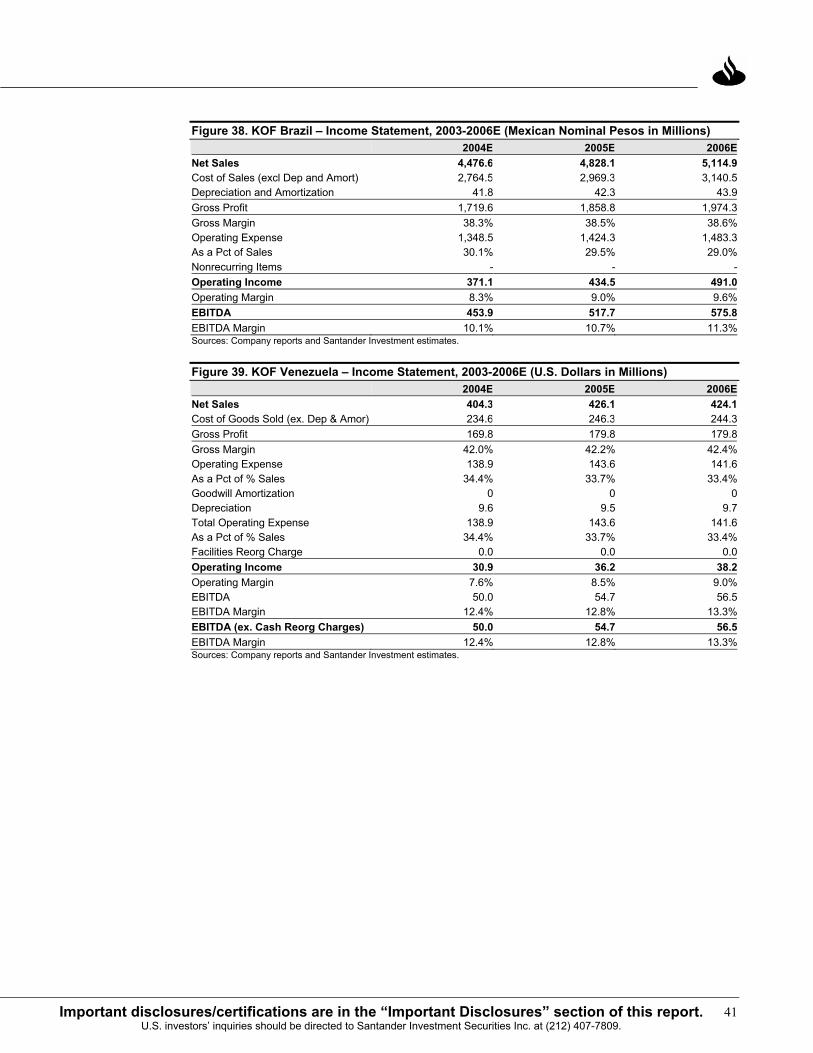
41Important disclosures/certifications are in the “Important Disclosures” section of this report. U.S. investors’ inquiries should be directed to Santander Investment Securities Inc. at (212) 407-7809.
Figure 38. KOF Brazil – Income Statement, 2003-2006E (Mexican Nominal Pesos in Millions) 2004E 2005E 2006ENet Sales 4,476.6 4,828.1 5,114.9 Cost of Sales (excl Dep and Amort) 2,764.5 2,969.3 3,140.5 Depreciation and Amortization 41.8 42.3 43.9 Gross Profit 1,719.6 1,858.8 1,974.3 Gross Margin 38.3% 38.5% 38.6%Operating Expense 1,348.5 1,424.3 1,483.3 As a Pct of Sales 30.1% 29.5% 29.0%Nonrecurring Items - - -Operating Income 371.1 434.5 491.0 Operating Margin 8.3% 9.0% 9.6%EBITDA 453.9 517.7 575.8 EBITDA Margin 10.1% 10.7% 11.3%Sources: Company reports and Santander Investment estimates.
Figure 39. KOF Venezuela – Income Statement, 2003-2006E (U.S. Dollars in Millions) 2004E 2005E 2006ENet Sales 404.3 426.1 424.1Cost of Goods Sold (ex. Dep & Amor) 234.6 246.3 244.3Gross Profit 169.8 179.8 179.8Gross Margin 42.0% 42.2% 42.4%Operating Expense 138.9 143.6 141.6As a Pct of % Sales 34.4% 33.7% 33.4%Goodwill Amortization 0 0 0Depreciation 9.6 9.5 9.7Total Operating Expense 138.9 143.6 141.6As a Pct of % Sales 34.4% 33.7% 33.4%Facilities Reorg Charge 0.0 0.0 0.0Operating Income 30.9 36.2 38.2Operating Margin 7.6% 8.5% 9.0%EBITDA 50.0 54.7 56.5EBITDA Margin 12.4% 12.8% 13.3%EBITDA (ex. Cash Reorg Charges) 50.0 54.7 56.5EBITDA Margin 12.4% 12.8% 13.3%Sources: Company reports and Santander Investment estimates.

A Closer Look at the Coke Bottlers: A Perfect Storm
42 Important disclosures/certifications are in the “Important Disclosures” section of this report. U.S. investors’ inquiries should be directed to Santander Investment at (212) 407-7809.
Figure 40. KOF Venezuela – Income Statement, 2003-2006E (Mexican Nominal Pesos in Millions) 2004E 2005E 2006ENet Sales 4,649.8 5,027.7 5,077.9 Cost of Goods Sold (ex Dep & Amor) 2,697.4 2,906.0 2,924.9 Gross Profit 1,952.4 2,121.7 2,153.0 Gross Margin 42.0% 42.2% 42.4%Operating Expense 1,597.3 1,694.3 1,696.0 As a Pct of % sales 34.4% 33.7% 33.4%Goodwill Amortization - - -Depreciation 110.4 111.8 115.9 Total Operating Expense 1,597.3 1,694.3 1,696.0 As a Pct of % Sales 34.4% 33.7% 33.4%Facilities Reorg Charge - - -Operating Income 355.1 427.4 457.0 Operating Margin 7.6% 8.5% 9.0%EBITDA 574.6 645.3 676.4 EBITDA Margin 12.4% 12.8% 13.3%EBITDA (ex. Cash Reorg Charges) 574.6 645.3 676.4 EBITDA Margin 12.4% 12.8% 13.3%Sources: Company reports and Santander Investment estimates.
Figure 41. KOF Central America – Income Statement, 2003-2006E (U.S. Dollars in Millions) 2004E 2005E 2006ENet Sales 313.1 325.1 343.0Cost of Goods Sold (excl Dep & Amt) 157.8 162.5 170.5Depreciation 13.2 13.1 13.4Gross Profit 155.8 162.5 172.5Gross Margin 49.7% 50.0% 50.3%Operating Expense 119.9 123.5 129.7As a Pct of % Sales 38.3% 38.0% 37.8%Operating Income 35.8 39.0 42.9Operating Margin 11.4% 12.0% 12.5%EBITDA 61.0 64.2 68.1EBITDA Margin 19.5% 19.8% 19.9%Sources: Company reports and Santander Investment estimates.
Figure 42. KOF Central America – Income Statement, 2003-2006E (Mexican Nominal Pesos in Millions) 2004E 2005E 2006ENet Sales 3,600.5 3,835.7 4,107.1 Cost of Goods Sold (excl Dep & Amt) 1,814.6 1,917.9 2,041.2 Depreciation 152.3 154.3 159.9 Gross Profit 1,791.1 1,917.9 2,065.9 Gross Margin 49.7% 50.0% 50.3%Operating Expense 1,379.0 1,457.6 1,552.5 As a Pct of % Sales 38.3% 38.0% 37.8%Operating Income 412.1 460.3 513.4 Operating Margin 11.4% 12.0% 12.5%EBITDA 702.0 757.6 815.5 EBITDA Margin 19.5% 19.8% 19.9%Sources: Company reports and Santander Investment estimates.
43Important disclosures/certifications are in the “Important Disclosures” section of this report. U.S. investors’ inquiries should be directed to Santander Investment Securities Inc. at (212) 407-7809.
APPENDIX
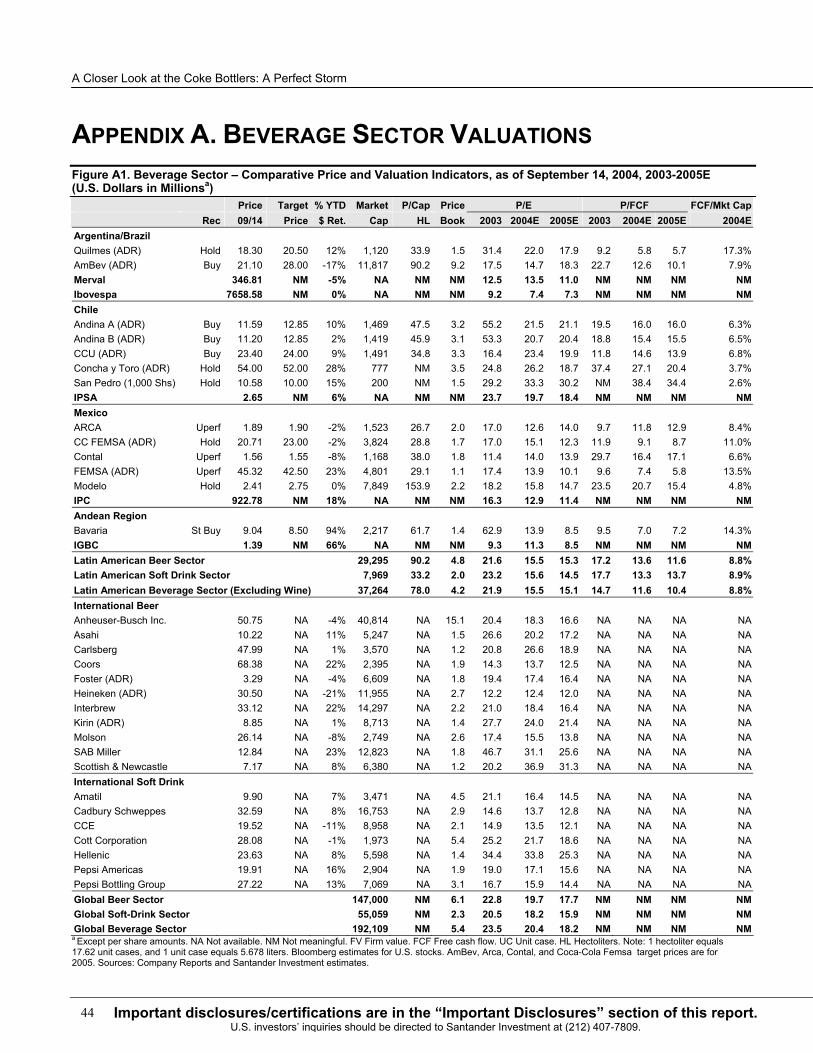
A Closer Look at the Coke Bottlers: A Perfect Storm
44 Important disclosures/certifications are in the “Important Disclosures” section of this report. U.S. investors’ inquiries should be directed to Santander Investment at (212) 407-7809.
APPENDIX A. BEVERAGE SECTOR VALUATIONS Figure A1. Beverage Sector – Comparative Price and Valuation Indicators, as of September 14, 2004, 2003-2005E (U.S. Dollars in Millionsa) Price Target % YTD Market P/Cap Price P/E P/FCF FCF/Mkt Cap Rec 09/14 Price $ Ret. Cap HL Book 2003 2004E 2005E 2003 2004E 2005E 2004EArgentina/Brazil Quilmes (ADR) Hold 18.30 20.50 12% 1,120 33.9 1.5 31.4 22.0 17.9 9.2 5.8 5.7 17.3%AmBev (ADR) Buy 21.10 28.00 -17% 11,817 90.2 9.2 17.5 14.7 18.3 22.7 12.6 10.1 7.9%Merval 346.81 NM -5% NA NM NM 12.5 13.5 11.0 NM NM NM NMIbovespa 7658.58 NM 0% NA NM NM 9.2 7.4 7.3 NM NM NM NMChile Andina A (ADR) Buy 11.59 12.85 10% 1,469 47.5 3.2 55.2 21.5 21.1 19.5 16.0 16.0 6.3%Andina B (ADR) Buy 11.20 12.85 2% 1,419 45.9 3.1 53.3 20.7 20.4 18.8 15.4 15.5 6.5%CCU (ADR) Buy 23.40 24.00 9% 1,491 34.8 3.3 16.4 23.4 19.9 11.8 14.6 13.9 6.8%Concha y Toro (ADR) Hold 54.00 52.00 28% 777 NM 3.5 24.8 26.2 18.7 37.4 27.1 20.4 3.7%San Pedro (1,000 Shs) Hold 10.58 10.00 15% 200 NM 1.5 29.2 33.3 30.2 NM 38.4 34.4 2.6%IPSA 2.65 NM 6% NA NM NM 23.7 19.7 18.4 NM NM NM NMMexico ARCA Uperf 1.89 1.90 -2% 1,523 26.7 2.0 17.0 12.6 14.0 9.7 11.8 12.9 8.4%CC FEMSA (ADR) Hold 20.71 23.00 -2% 3,824 28.8 1.7 17.0 15.1 12.3 11.9 9.1 8.7 11.0%Contal Uperf 1.56 1.55 -8% 1,168 38.0 1.8 11.4 14.0 13.9 29.7 16.4 17.1 6.6%FEMSA (ADR) Uperf 45.32 42.50 23% 4,801 29.1 1.1 17.4 13.9 10.1 9.6 7.4 5.8 13.5%Modelo Hold 2.41 2.75 0% 7,849 153.9 2.2 18.2 15.8 14.7 23.5 20.7 15.4 4.8%IPC 922.78 NM 18% NA NM NM 16.3 12.9 11.4 NM NM NM NMAndean Region Bavaria St Buy 9.04 8.50 94% 2,217 61.7 1.4 62.9 13.9 8.5 9.5 7.0 7.2 14.3%IGBC 1.39 NM 66% NA NM NM 9.3 11.3 8.5 NM NM NM NMLatin American Beer Sector 29,295 90.2 4.8 21.6 15.5 15.3 17.2 13.6 11.6 8.8%Latin American Soft Drink Sector 7,969 33.2 2.0 23.2 15.6 14.5 17.7 13.3 13.7 8.9%Latin American Beverage Sector (Excluding Wine) 37,264 78.0 4.2 21.9 15.5 15.1 14.7 11.6 10.4 8.8%International Beer Anheuser-Busch Inc. 50.75 NA -4% 40,814 NA 15.1 20.4 18.3 16.6 NA NA NA NAAsahi 10.22 NA 11% 5,247 NA 1.5 26.6 20.2 17.2 NA NA NA NACarlsberg 47.99 NA 1% 3,570 NA 1.2 20.8 26.6 18.9 NA NA NA NACoors 68.38 NA 22% 2,395 NA 1.9 14.3 13.7 12.5 NA NA NA NAFoster (ADR) 3.29 NA -4% 6,609 NA 1.8 19.4 17.4 16.4 NA NA NA NAHeineken (ADR) 30.50 NA -21% 11,955 NA 2.7 12.2 12.4 12.0 NA NA NA NAInterbrew 33.12 NA 22% 14,297 NA 2.2 21.0 18.4 16.4 NA NA NA NAKirin (ADR) 8.85 NA 1% 8,713 NA 1.4 27.7 24.0 21.4 NA NA NA NAMolson 26.14 NA -8% 2,749 NA 2.6 17.4 15.5 13.8 NA NA NA NASAB Miller 12.84 NA 23% 12,823 NA 1.8 46.7 31.1 25.6 NA NA NA NAScottish & Newcastle 7.17 NA 8% 6,380 NA 1.2 20.2 36.9 31.3 NA NA NA NAInternational Soft Drink Amatil 9.90 NA 7% 3,471 NA 4.5 21.1 16.4 14.5 NA NA NA NACadbury Schweppes 32.59 NA 8% 16,753 NA 2.9 14.6 13.7 12.8 NA NA NA NACCE 19.52 NA -11% 8,958 NA 2.1 14.9 13.5 12.1 NA NA NA NACott Corporation 28.08 NA -1% 1,973 NA 5.4 25.2 21.7 18.6 NA NA NA NAHellenic 23.63 NA 8% 5,598 NA 1.4 34.4 33.8 25.3 NA NA NA NAPepsi Americas 19.91 NA 16% 2,904 NA 1.9 19.0 17.1 15.6 NA NA NA NAPepsi Bottling Group 27.22 NA 13% 7,069 NA 3.1 16.7 15.9 14.4 NA NA NA NAGlobal Beer Sector 147,000 NM 6.1 22.8 19.7 17.7 NM NM NM NMGlobal Soft-Drink Sector 55,059 NM 2.3 20.5 18.2 15.9 NM NM NM NMGlobal Beverage Sector 192,109 NM 5.4 23.5 20.4 18.2 NM NM NM NM
a Except per share amounts. NA Not available. NM Not meaningful. FV Firm value. FCF Free cash flow. UC Unit case. HL Hectoliters. Note: 1 hectoliter equals 17.62 unit cases, and 1 unit case equals 5.678 liters. Bloomberg estimates for U.S. stocks. AmBev, Arca, Contal, and Coca-Cola Femsa target prices are for 2005. Sources: Company Reports and Santander Investment estimates.
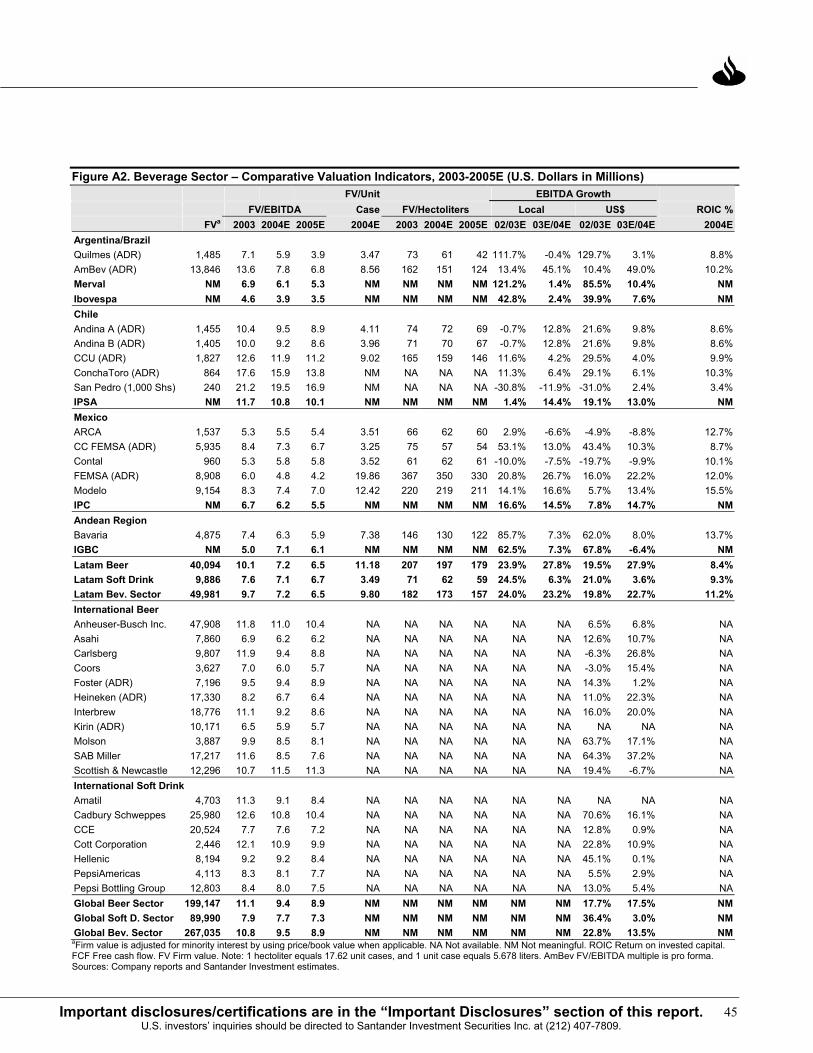
45Important disclosures/certifications are in the “Important Disclosures” section of this report. U.S. investors’ inquiries should be directed to Santander Investment Securities Inc. at (212) 407-7809.
Figure A2. Beverage Sector – Comparative Valuation Indicators, 2003-2005E (U.S. Dollars in Millions) FV/Unit EBITDA Growth FV/EBITDA Case FV/Hectoliters Local US$ ROIC % FVa 2003 2004E 2005E 2004E 2003 2004E 2005E 02/03E 03E/04E 02/03E 03E/04E 2004EArgentina/Brazil Quilmes (ADR) 1,485 7.1 5.9 3.9 3.47 73 61 42 111.7% -0.4% 129.7% 3.1% 8.8%AmBev (ADR) 13,846 13.6 7.8 6.8 8.56 162 151 124 13.4% 45.1% 10.4% 49.0% 10.2%Merval NM 6.9 6.1 5.3 NM NM NM NM 121.2% 1.4% 85.5% 10.4% NMIbovespa NM 4.6 3.9 3.5 NM NM NM NM 42.8% 2.4% 39.9% 7.6% NMChile Andina A (ADR) 1,455 10.4 9.5 8.9 4.11 74 72 69 -0.7% 12.8% 21.6% 9.8% 8.6%Andina B (ADR) 1,405 10.0 9.2 8.6 3.96 71 70 67 -0.7% 12.8% 21.6% 9.8% 8.6%CCU (ADR) 1,827 12.6 11.9 11.2 9.02 165 159 146 11.6% 4.2% 29.5% 4.0% 9.9%ConchaToro (ADR) 864 17.6 15.9 13.8 NM NA NA NA 11.3% 6.4% 29.1% 6.1% 10.3%San Pedro (1,000 Shs) 240 21.2 19.5 16.9 NM NA NA NA -30.8% -11.9% -31.0% 2.4% 3.4%IPSA NM 11.7 10.8 10.1 NM NM NM NM 1.4% 14.4% 19.1% 13.0% NMMexico ARCA 1,537 5.3 5.5 5.4 3.51 66 62 60 2.9% -6.6% -4.9% -8.8% 12.7%CC FEMSA (ADR) 5,935 8.4 7.3 6.7 3.25 75 57 54 53.1% 13.0% 43.4% 10.3% 8.7%Contal 960 5.3 5.8 5.8 3.52 61 62 61 -10.0% -7.5% -19.7% -9.9% 10.1%FEMSA (ADR) 8,908 6.0 4.8 4.2 19.86 367 350 330 20.8% 26.7% 16.0% 22.2% 12.0%Modelo 9,154 8.3 7.4 7.0 12.42 220 219 211 14.1% 16.6% 5.7% 13.4% 15.5%IPC NM 6.7 6.2 5.5 NM NM NM NM 16.6% 14.5% 7.8% 14.7% NMAndean Region Bavaria 4,875 7.4 6.3 5.9 7.38 146 130 122 85.7% 7.3% 62.0% 8.0% 13.7%IGBC NM 5.0 7.1 6.1 NM NM NM NM 62.5% 7.3% 67.8% -6.4% NMLatam Beer 40,094 10.1 7.2 6.5 11.18 207 197 179 23.9% 27.8% 19.5% 27.9% 8.4%Latam Soft Drink 9,886 7.6 7.1 6.7 3.49 71 62 59 24.5% 6.3% 21.0% 3.6% 9.3%Latam Bev. Sector 49,981 9.7 7.2 6.5 9.80 182 173 157 24.0% 23.2% 19.8% 22.7% 11.2%International Beer Anheuser-Busch Inc. 47,908 11.8 11.0 10.4 NA NA NA NA NA NA 6.5% 6.8% NAAsahi 7,860 6.9 6.2 6.2 NA NA NA NA NA NA 12.6% 10.7% NACarlsberg 9,807 11.9 9.4 8.8 NA NA NA NA NA NA -6.3% 26.8% NACoors 3,627 7.0 6.0 5.7 NA NA NA NA NA NA -3.0% 15.4% NAFoster (ADR) 7,196 9.5 9.4 8.9 NA NA NA NA NA NA 14.3% 1.2% NAHeineken (ADR) 17,330 8.2 6.7 6.4 NA NA NA NA NA NA 11.0% 22.3% NAInterbrew 18,776 11.1 9.2 8.6 NA NA NA NA NA NA 16.0% 20.0% NAKirin (ADR) 10,171 6.5 5.9 5.7 NA NA NA NA NA NA NA NA NAMolson 3,887 9.9 8.5 8.1 NA NA NA NA NA NA 63.7% 17.1% NASAB Miller 17,217 11.6 8.5 7.6 NA NA NA NA NA NA 64.3% 37.2% NAScottish & Newcastle 12,296 10.7 11.5 11.3 NA NA NA NA NA NA 19.4% -6.7% NAInternational Soft Drink Amatil 4,703 11.3 9.1 8.4 NA NA NA NA NA NA NA NA NACadbury Schweppes 25,980 12.6 10.8 10.4 NA NA NA NA NA NA 70.6% 16.1% NACCE 20,524 7.7 7.6 7.2 NA NA NA NA NA NA 12.8% 0.9% NACott Corporation 2,446 12.1 10.9 9.9 NA NA NA NA NA NA 22.8% 10.9% NAHellenic 8,194 9.2 9.2 8.4 NA NA NA NA NA NA 45.1% 0.1% NAPepsiAmericas 4,113 8.3 8.1 7.7 NA NA NA NA NA NA 5.5% 2.9% NAPepsi Bottling Group 12,803 8.4 8.0 7.5 NA NA NA NA NA NA 13.0% 5.4% NAGlobal Beer Sector 199,147 11.1 9.4 8.9 NM NM NM NM NM NM 17.7% 17.5% NMGlobal Soft D. Sector 89,990 7.9 7.7 7.3 NM NM NM NM NM NM 36.4% 3.0% NMGlobal Bev. Sector 267,035 10.8 9.5 8.9 NM NM NM NM NM NM 22.8% 13.5% NM
aFirm value is adjusted for minority interest by using price/book value when applicable. NA Not available. NM Not meaningful. ROIC Return on invested capital. FCF Free cash flow. FV Firm value. Note: 1 hectoliter equals 17.62 unit cases, and 1 unit case equals 5.678 liters. AmBev FV/EBITDA multiple is pro forma. Sources: Company reports and Santander Investment estimates.

A Closer Look at the Coke Bottlers: A Perfect Storm
46 Important disclosures/certifications are in the “Important Disclosures” section of this report. U.S. investors’ inquiries should be directed to Santander Investment at (212) 407-7809.
IMPORTANT DISCLOSURES
Arca – 12-Month Relative Performance (U.S. Dollars)
80
90
100
110
120
130
140
150
S-03 O-03 D-03 J-04 M-04 A-04 J-04 J-04 S-0480
90
100
110
120
130
140
150
ARCA
IPC
Sources: Bloomberg and Santander Investment.
Contal – 12-Month Relative Performance (U.S. Dollars)
80
90
100
110
120
130
140
150
S-03 O-03 D-03 J-04 M-04 A-04 J-04 J-04 S-0480
90
100
110
120
130
140
150
Contal
IPC
Sources: Bloomberg and Santander Investment.
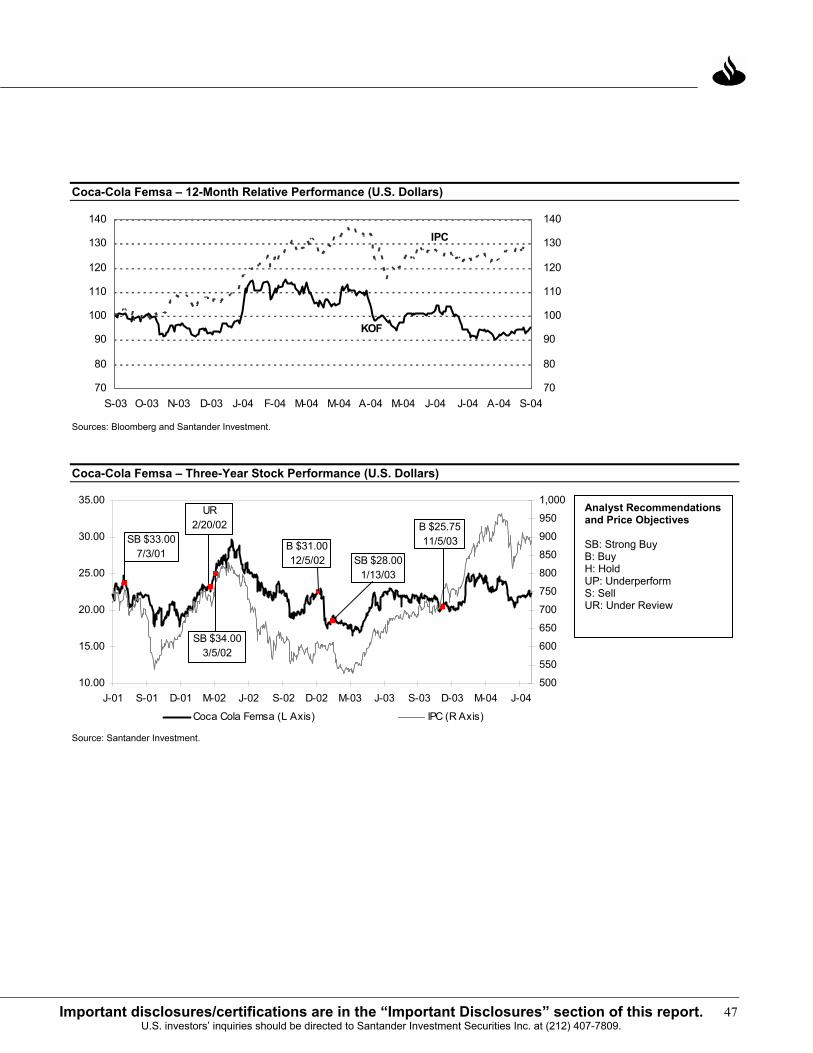
47Important disclosures/certifications are in the “Important Disclosures” section of this report. U.S. investors’ inquiries should be directed to Santander Investment Securities Inc. at (212) 407-7809.
Coca-Cola Femsa – 12-Month Relative Performance (U.S. Dollars)
70
80
90
100
110
120
130
140
S-03 O-03 N-03 D-03 J-04 F-04 M-04 M-04 A-04 M-04 J-04 J-04 A-04 S-0470
80
90
100
110
120
130
140
KOF
IPC
Sources: Bloomberg and Santander Investment.
Coca-Cola Femsa – Three-Year Stock Performance (U.S. Dollars)
10.00
15.00
20.00
25.00
30.00
35.00
J-01 S-01 D-01 M-02 J-02 S-02 D-02 M-03 J-03 S-03 D-03 M-04 J-04500
550
600
650
700
750
800
850
900
950
1,000
Coca Cola Femsa (L Axis) IPC (R Axis)
B $31.0012/5/02
B $25.7511/5/03SB $33.00
7/3/01
UR2/20/02
SB $34.003/5/02
SB $28.001/13/03
Source: Santander Investment.
Analyst Recommendations and Price Objectives SB: Strong Buy B: Buy H: Hold UP: Underperform S: Sell UR: Under Review

2004-0101
IMPORTANT DISCLOSURES (CONTINUED) Key to Investment Codes Rating
Definition
% of Companies
Covered with This Rating
% of Companies Provided Investment Banking
Services in the Past 12 Months
Strong Buy Expected to outperform the local market more than 15%. Buy Expected to outperform the local market 5%-15%.
48.65% 64.29%
Hold Expected to perform within a range of 5% above or below the local market. 36.04% 21.43%Underperform Expected to underperform the local market 5%-15%. Sell Expected to underperform the local market more than 15%.
15.32% 14.29%
The numbers above reflect our Latin American universe. For a discussion, if applicable, of the valuation methods used to determine the price targets included in this report and the risks to achieving these targets, please refer to the latest published research on these stocks. Research is available through your sales representative and other electronic systems. Target prices are 2004 year-end unless otherwise specified. Recommendations are based on a total return basis (expected share price appreciation + prospective dividend yield) unless otherwise specified. Stock price charts and rating histories for companies discussed in this report are also available by written request to Santander Investment Securities Inc., 45 East 53rd Street, 17th Floor (Attn: Research Disclosures), New York, NY 10022 USA. Ratings are established when the firm sets a target price and/or when maintaining or reiterating the rating. Ratings may not coincide with the above methodology due to price volatility. Management reserves the right to maintain or to modify ratings on any specific stock and will disclose this in the report when it occurs. Valuation methodologies vary from stock to stock, analyst to analyst, and country to country. Any investment in Latin American equities is, by its nature, risky. A full discussion of valuation methodology and risks related to achieving the target price of the subject security is included in the body of this report. The benchmark used for establishing Argentina recommendations is our forecast of the year-end Argentina IFCI index. For the Andean countries, our benchmark is the simple average of the country risk of each country plus the 10 year U.S. T-Bond yield plus 5.5% of equity risk premium. For additional information about our rating methodology, please call (212) 350-3974. This report has been prepared by Santander Investment Securities Inc. (“SIS”) (a subsidiary of Santander Investment S.A., which is wholly owned by Banco Santander Central Hispano, S.A. ("Santander"), on behalf of itself and its affiliates (collectively, Grupo Santander) and is provided for information purposes only. This document must not be considered as an offer to sell or a solicitation of an offer to buy any relevant securities (i.e., securities mentioned herein or of the same issuer and/or options, warrants, or rights with respect to or interests in any such securities). Any decision by the recipient to buy or to sell should be based on publicly available information on the related security and, where appropriate, should take into account the content of the related prospectus filed with and available from the entity governing the related market and the company issuing the security. This report is issued in Spain by Santander Central Hispano Bolsa, Sociedad de Valores, S.A. (SCH Bolsa), and in the United Kingdom by Santander Central Hispano S.A., London Branch (Santander London), which is regulated by the Financial Services Authority in the conduct of investment business in the UK. This report is not being issued to private customers. SCHI, Santander London, and SCH Bolsa are members of Grupo Santander. The following analysts hereby certify that their views about the companies and their securities discussed in this report are accurately expressed and that they have not received and will not receive direct or indirect compensation in exchange for expressing specific recommendations or views in this report: Alexander Robarts and Alonso Aramburu. Grupo Santander receives non-investment banking revenue from the subject company. The information contained herein has been compiled from sources believed to be reliable, but, although all reasonable care has been taken to ensure that the information contained herein is not untrue or misleading, we make no representation that it is accurate or complete and it should not be relied upon as such. All opinions and estimates included herein constitute our judgment as at the date of this report and are subject to change without notice. Any U.S. recipient of this report (other than a registered broker-dealer or a bank acting in a broker-dealer capacity) that would like to effect any transaction in any security discussed herein should contact and place orders in the United States with SIS, which, without in any way limiting the foregoing, accepts responsibility (solely for purposes of and within the meaning of Rule 15a-6 under the U.S. Securities Exchange Act of 1934) for this report and its dissemination in the United States.
© 2004 by Santander Investment Securities Inc. All Rights Reserved.