mexican apparel industry update - maquila solidarity network
TRANSCRIPT
1
828384858687888990919293
20
10
/04
20
10
/05
20
10
/06
20
10
/07
20
10
/08
20
10
/09
20
10
/10
20
10
/11
20
10
/12
20
11
/01
20
11
/02
20
11
/03
20
11
/04
Mexico: Indice de fabricación de prendas de vestir
Indice (base 2003=100)
$0
$50,000,000
$100,000,000
$150,000,000
$200,000,000
$250,000,000
$300,000,000
$350,000,000
$400,000,000
$450,000,000
$500,000,000
Jan
-07
May
-07
Sep
-07
Jan
-08
May
-08
Sep
-08
Jan
-09
May
-09
Sep
-09
Jan
-10
May
-10
Sep
-10
Jan
-11
US Apparel Imports from Mexico ($US Customs Value)
Apparel Imports ($US)
Mexican apparel industry update A brief digest of trends and statistics affecting
the Mexican apparel industry
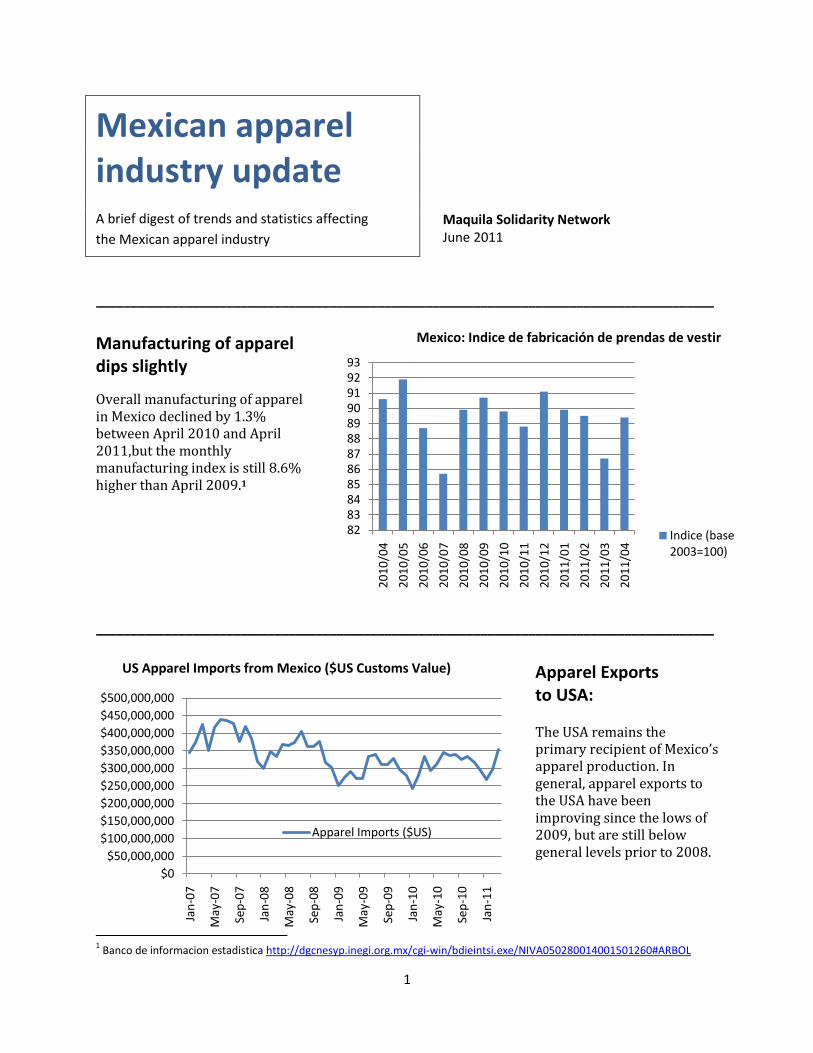
__________________________________________________________________________________________ Manufacturing of apparel dips slightly
Overall manufacturing of apparel in Mexico declined by 1.3% between April 2010 and April 2011,but the monthly manufacturing index is still 8.6% higher than April 2009.1
__________________________________________________________________________________________
Apparel Exports to USA: The USA remains the primary recipient of Mexico’s apparel production. In general, apparel exports to the USA have been improving since the lows of 2009, but are still below general levels prior to 2008.
1 Banco de informacion estadistica http://dgcnesyp.inegi.org.mx/cgi-win/bdieintsi.exe/NIVA050280014001501260#ARBOL
Maquila Solidarity Network June 2011

2
Price: US custom value/volume
Country 2008 2009 2010
WORLD $74 $70 $68
BNGLDSH $54 $54 $54
CHINA $89 $71 $66
MEXICO $90 $87 $85
US imports of OTEXA category 347 (by volume, dozen pairs):
0
2,000,000
4,000,000
6,000,000
8,000,000
10,000,000
12,000,000
14,000,000
16,000,000
18,000,000
20,000,000
2008 2009 2010
Bangladesh
China
Mexico
0
1,000,000
2,000,000
3,000,000
4,000,000
5,000,000
6,000,000
7,000,000
8,000,000
9,000,000
YTD(April) 2009 YTD (April) 2010 YTD (April) 2011
Bangladesh
China
Mexico
Specific product categories
One of the top categories of products Mexico exports to the USA is “Men’s & Boys Cotton Trousers/Breeches/ shorts”, for which Mexico represents approximately 15.8% of total US imports of these products (by volume). But Mexico’s share is changing:
And the situation seems to be changing even more rapidly in 2011, when looking at the year-to-date sales for April 2011 as compared to the same period in 2010 (above). Notably China’s share is decreasing. But despite that, Mexico does not appear to be gaining back a significant portion. Rather, it is going to lower-wage Bangladesh.
Mexico’s market share for these products (by volume) has gone down from 17.6% in 2008, to 16.5% at the end of 2010, to 15.8% in April 2011. Some of this might be explicable by looking at the customs price/dozen (left). As you can see, Chinese and Mexican import prices decreased over that period, but still not to the level of the Bangladesh price.

3
One of the other major product categories for Mexico is “Men’s and Boys Man-Made-Fabric Knit Shirts”. US imports of these products overall have increased by 27% in the last year, and Mexico’s exports to the USA have increased as well. However, Mexico’s market share for these products (by volume) has decreased from 10.1% in 2008 to 8.8% 2010 and 8.6% in the year ending April 2011. Nicaragua, on the other hand, has increased its market share (by volume) from 8.1% in 2008 to 12.28% in the year ending April 2011. Using the rough calculation of customs value divided by volume, Nicaragua’s price for knit shirts is less than half that of Mexico.
US Imports of M/B MMF Knit Shirts (by dozens), annual:
US Imports of M/B MMF Knit Shirts (by dozens), year-to-date:
0
2000000
4000000
6000000
8000000
10000000
12000000
14000000
2008 2009 2010
Honduras
El Salvador
Nicaragua
China
Mexico
0
500000
1000000
1500000
2000000
2500000
3000000
3500000
YTD(April) 2009 YTD (April) 2010 YTD (April) 2011
Honduras
El Salvador
Nicaragua
China
Mexico

4
-20 -10 0 10 20 30 40 50
China
Pakistan
India
Bangladesh
Vietnam
Honduras
Indonesia
Mexico
Salvador
Cambodia
Thailand
Nicaragua
Haiti
% US cotton apparel import volume change April 2010 to April 2011
Mexico’s main competitors in the US market Mexico’s competitors for the US market differ depending on the product categories, but as a general rule some of its biggest competitors are China, Vietnam, Pakistan and Bangladesh. For example, Mexico’s share of the US cotton apparel import market (by volume) was 4.02% in April 2011. China’s was 32.59%, followed by Bangladesh (at 8.78%) and Vietnam (at 7.95%).
While China’s share of the market is still huge, it has been decreasing in many product categories. Comparing US year-to-date imports of cotton apparel from China in April 2010 and April 2011, China’s volume declined by 12%, whereas Bangladesh’s volume increased by 12.5% and Vietnam by 10.6%. It appears that rising prices in China are pushing companies to source elsewhere, but largely those increases are going to other lower wage countries like Bangladesh and Vietnam. The volume of US cotton apparel imports from Mexico decreased by 3.6%. In the lowest wage countries in the Americas, Nicaragua has shown a 7.8% volume increase in the same period, and Haiti has seen a phenomenal 41.2% increase (although this is not really surprising nor significant since the same period last year coincided with the earthquake, which halted most production).2
2 Source: OTEXA. Similar results can be shown for other categories of apparel.
Share of US import market: cotton apparel (by volume)
ChinaPakistanIndiaBangladeshVietnamHondurasIndonesiaMexicoSalvadorCambodiaThailandNicaraguaHaiti

5
US retail sales Mexico’s apparel exports are almost entirely directed to the US market. While retail sales indices for clothing and accessories have been stronger this year (to date) than last year (a 5.1% increase YTD in May) 3, there are concerns that it is weakening. Other markets, however, are showing stronger growth. For example, Hong Kong’s retail clothing and footwear sales last year rose by +15.8% (by volume) and +17.3% (by value).4 China’s domestic apparel sales increased by over 22% year-on-year in the first two months of 2011 according to the Chinese National Bureau of Statistics.5
However Mexico has little, if any, access to those markets.
The Mexican domestic market
While the US export market is uncertain, domestic retail sales of textiles, apparel and shoes in Mexico rose 3.2% between March 2010 and March 2011. They rose 12.2% between March 2009 and March 2011.
Clothing sales by registered Mexican retailers are estimated at between US$10 and 12 billion dollars annually. The leading retailers are Liverpool, El Palacio de Hierro, Suburbia, Sears, Zara, Wal Mart and Comercial Mexicana. The black market for clothing in Mexico is estimated at US$13 billion annually, with 55% supplied by Mexican producers and 45% foreign. 6
3 www.census.gov/retail/marts/www/marts_current.pdf
4 http://www.just-style.com/management-briefing/clothing-retail-facts-and-figures_id111240.aspx
5 http://www.just-style.com/management-briefing/global-clothing-retail-trends_id111246.aspx
6 http://revistafortuna.com.mx/contenido/2011/03/14/mexico-%C2%BFfashionista-que-tan-lejos-estamos-de-la-
gran-manzana/

6
Size Number of factories
% Number of workers
%
Large: 277 3 177,849 59.3
Medium: 739 8 66,881 22.3
Small: 1754 19 35,390 11.8
Micro: 6463 70 19,794 6.6
Imports to Mexico: 2010, by volume
Exporting country 2010 change 2009-10
USA $423,822,458 +1.16%
China $250,860,720 +44.68%
Bangladesh $122,400,211 +6.73%
Honduras $70,463,295 +8.47%
Guatemala $28,577,766 -2.33%
El Salvador $28,552,929 +6.70%
Nicaragua $13,717,894 +73.12%
Dominican Rep. $2,181,045 -24.86%
(NOTE: the reliability of these data is uncertain – they come from the UN Comtrade database and are dependent on the reliability of the country reporting, which is often uneven).
Competition in the domestic market Mexico imports a significant amount of apparel from the USA, China, Bangladesh, and Honduras, in that order. While apparel imports from the USA have generally been on the decline (down more than 50% since 2006), imports from China rose by almost 45% between 2009 and 2010. Apparel imports from Honduras and Nicaragua, albeit smaller, have also been on the rise.7
Contraband and piracy
According to the Programa para la Competitividad de la Cadena Fibras-Textil-Vestido, 58% of the apparel market in Mexico is supplied illegally – pirated goods, stolen goods, or material produced in Mexico without paying taxes) and (legal) Mexican suppliers only supply 20% of the market.8
Composition of the industry and workforce
There were 9,223 registered apparel factories operating in Mexico in May 2010, down from 9,602 the previous May, a 4% drop in the number of factories.9 (May 2011 figures are not yet available). We have not been able to gather general statistics on changes in the distribution of size of factories – that is, whether there are more or less small workshops vs. large factories.
Although Mexico has not recovered to its earlier pre-crisis employment levels, jobs in the apparel manufacturing sector have increased significantly in the past two years.
7 Source: UN COMTRADE database
8 http://www.quintanarooaldia.com/noticia/mercado-informal-e-ilegal-de-mercancias-y-productos-crece-en-aduanas-
mexicanas/2880 9 Source: CNIV: situacionactual_2trim10 slide 15.

7
10 However, it should be noted that Mexico’s national employment statistics come from the IMSS (Mexican Institute of Social Security) and record only those workers registered for social security.11 This could significantly skew the results. In a recent study prepared for MSN by Rodrigo Santiago Hernandez, for example, Santiago estimated that in May of 2010 there were approximately 38,000 workers employed in the garment sector in Tehuacan, 20,000 in formal registered facilities and an additional 18,000 employed in clandestine workshops that do not register their workers with IMSS or other government programs. Further, the data do not differentiate between full- and part-time workers, so any changes in the relative precariousness of work arrangements are not captured here.
Labour outsourcing Reliance on labour outsourcing has become epidemic in the electronics and other manufacturing sectors, with 50-60% of workers being outsourced by 2006.12 We do not have statistics on the use of outsourcing in the apparel manufacturing sector specifically, but note that labour outsourcing agencies employed 2.73 million Mexican workers at the end of 2008, an increase of 95.2% in only five years.13 In 2008 the Center for Labor Research and Union Advisement (CILAS) reported that 10 percent of the nation’s workforce was employed by temp agencies.14
10
Source: IMSS, as quoted in 2010-11-04 MexicoFits press release. 11
http://stats.oecd.org/mei/default.asp?lang=e&subject=18&country=MEX 12
CEREAL. New Technology Workers.2006, p10. 13
http://www.boletin-infomail.com/2010/10/page/3/ 14
http://www.corpwatch.org/article.php?id=15496
Total number of workers
March ‘08 March ‘09 Oct ‘10
343,533 287,940 295,648

8
Some further questions:
Can we track the use of labour outsourcing and short-term contracting in Mexican apparel factories? Are brands tracking this in their own supplier factories?
How much is trade with Central America increasing/decreasing and what does this mean for Mexican producers? To what extent will recent increases in the DR-CAFTA cumulation limits build increased trade with Central America?
How is the composition of the industry changing? Is there a significant growth of smaller, sometimes clandestine workshops and subcontractors?
Are wages and benefits increasing or decreasing in Mexican factories in response to competitive pressures? Are brands tracking this in their own supplier factories?
Can we learn more about the size and structure of the domestic market, and what the implications are for social responsibility programs?