metso 2017 h1 half-year review
TRANSCRIPT

2017 Half-Year Review
H1
January 1 – June 30

Metso’s Half-Year Financial Review January 1 – June 30, 2017
Second-quarter 2017 in brief (compared to the second quarter of 2016)
Half-Year 2017 in brief (compared to the half-year of 2016)
Outlook for 2017 (changes in brackets)
Metso’s overall trading conditions are expected to be better than in 2016. Demand for our products and services in 2017 is expected to develop as follows:
At the end of June 2017, our backlog for 2017 totaled approximately EUR 1 billion. In the current market conditions, we continue to expect some postponements to planned delivery timetables. Capital expenditure excluding acquisitions is expected to increase compared to 2016, but to remain below depreciation and amortization.
• Market activity remained healthy overall and improved in mining equipment.• Sales have not yet reflected the order growth, which in addition to mix had the most significant
impact on profitability.• Orders received decreased 2 percent and totaled EUR 749 million (EUR 761 million), but were 12
percent higher when adjusting for a large mining equipment order in the comparison period. Services orders increased 8 percent to EUR 480 million (EUR 444 million)
• Sales increased 1 percent to EUR 675 million (EUR 671 million). Services sales increased 1 percent and totaled EUR 445 million (EUR 439 million)
• Adjusted EBITA decreased to EUR 70.0 million, or 10.4 percent of sales (EUR 77.3 million, or 11.5%)• Earnings per share totaled EUR 0.24 (EUR 0.28)
• Orders received increased 4 percent and totaled EUR 1,482 million (EUR 1,424 million). Servicesorders increased 11 percent to EUR 976 million (EUR 877 million)
• Sales increased 4 percent to EUR 1,323 million (EUR 1,272 million). Services sales increased2 percent and totaled EUR 868 million (EUR 848 million)
• Adjusted EBITA increased to EUR 136.5 million, or 10.3 percent of sales (EUR 133.0 million, or10.5%)
• Earnings per share totaled EUR 0.47 (EUR 0.46)• Free cash flow was EUR 43 million (EUR 136 million) and was negatively affected mainly by an
increase in net working capital
• Improve to satisfactory for mining equipment (previously: weak) and remain good for mining services• Remain good for aggregates equipment and services• Remain good for flow control products related to customers’ new investments and services
1
Metso's Half-Year Financial Review January 1 - June 30, 2017

President and CEO Matti Kähkönen: Market sentiment has turned slightly better in our customer industries during the first half of the year and we saw good activity during the second quarter. Orders grew in both segments, when adjusting for a large mining equipment order from the comparison period. Our aggregates business has continued to improve, thanks to favorable market development in several regions. In mining, we have seen a positive change in the equipment business, and services orders have continued to grow year-on-year across our offering. Activity in Flow Control has been in line with expectations, and the second quarter saw orders remaining at a healthy level in valves and increasing in pumps.
Metso’s sales and thus profitability were slightly disappointing but we think this is largely related to timing. The improved order book is expected to provide a good starting point for the second half of the year. Minerals suffered from low sales in mining equipment as well as high raw material costs and weak sales mix in the services business. Flow Control’s margin was affected by low volumes and related under-absorption as well as sales mix.
Beyond the financial performance, we made good progress in our strategic initiatives across our businesses. We took our digital strategy forward by forming a strong partnership to deliver a global industrial Internet of Things (IoT) platform to better serve our mining and aggregates customers. We also decided on investments to increase production of both wear part castings for mining crushers and Lokotrack mobile crushing plants. In Flow Control, we expanded our distribution network in the UK, Benelux, and Spain.
Finally, I have the pleasure to welcome Nico Delvaux to Metso as the new President and CEO as of August 1. I am confident that Metso will further develop under his leadership.
Key figures
EUR million Q2/2017 Q2/2016 Change % Q1-Q2/
2017 Q1-Q2/
2016 Change % 2016 Orders received 749 761 -2 1,482 1,424 4 2,724 Orders received by the services business 480 444 8 976 877 11 1,741 % of orders received 64 58 66 62 64 Order backlog at the end of the period 1,411 1,399 1 1,320 Sales 675 671 1 1,323 1,272 4 2,586 Sales of the services business 445 439 1 868 848 2 1,703 % of sales 66 65 66 67 66 Earnings before interest, tax and amortization (EBITA), adjusted 70.0 77.3 -9 136.5 133.0 3 274.0 % of sales 10.4 11.5 10.3 10.5 10.6 Operating profit 59.8 69.3 -14 119.2 119.7 0 227.1 % of sales 8.9 10.3 9.0 9.4 8.8 Earnings per share, EUR 0.24 0.28 -14 0.47 0.46 2 0.87 Free cash flow 4 74 -95 43 136 -68 339 Return on capital employed (ROCE) before tax, annualized, % 11.1 11.0 10.4 Equity-to-asset ratio at the end of the period, % 45.9 47.4 48.0 Net gearing at the end of the period, % 7.5 12.8 -1.8 Personnel at the end of the period 11,788 12,099 -3 11,542
2
Metso's Half-Year Financial Review January 1 - June 30, 2017

Operating environment
Healthy activity in our customer industries continued in the second quarter of 2017. Aggregates equipment market continued to be strong and orders grew in several regions. Mining customers’ high production output and increased attention to productivity have had a positive effect on the demand for our services business across the board. The activity in the mining equipment markets started to pick up, although no large orders were booked in the quarter. Flow Control saw good activity in its main industries, and project orders from oil & gas customers improved from the first quarter. Flow Control services orders remained on the healthy level seen in the first quarter.
Orders and sales
Metso’s orders declined 2 percent in the second quarter but were 12 percent higher when a large mining equipment order in the comparison period is adjusted for. The Group’s orders totaled EUR 749 million in the quarter (EUR 761 million). Orders were 4 percent higher in Flow Control and 3 percent lower in Minerals. The Group’s services orders were EUR 480 million, which is 8 percent higher than in the comparison quarter. Services orders grew 10 percent in Minerals and 3 percent in Flow Control.
Second-quarter sales were EUR 675 million (EUR 671 million). Minerals’ sales grew 4 percent and totaled EUR 523 million. Sales were higher in both the equipment and services businesses. Flow Control sales were affected by lower project orders in the previous quarters and were 9 percent lower than in the comparison period.
Orders in January-June 2017 totaled EUR 1,482 million, which is 4 percent higher than in the corresponding period of 2016. Orders grew 4 percent in Minerals and totaled EUR 1,135 million, while Flow Control’s orders were 3 percent higher and totaled EUR 347 million. The order backlog on June 30 totaled EUR 1.4 billion, of which we expect around EUR 1.0 billion to be delivered during 2017.
Metso's sales in the first half of the year totaled EUR 1,323 million, which is 4 percent higher than in the comparison period. Minerals’ sales increased 6 percent followed by stronger mining services and aggregates equipment orders. Flow Control’s sales were 1 percent lower than in January-June 2016.
Currency impact on orders received (compared to the same period in 2016)
Q2/2017 Change %
Q2/2017 Change % using constant rates
Q1-Q2/2017 Change %
Q1-Q2/2017 Change % using constant rates
Minerals -3 -4 4 2 Services business 10 8 13 9
Flow Control 4 4 3 1 Services business 4 3 8 6
Metso total -2 -3 4 1 Services business 8 7 11 8
Currency impact on sales (compared to the same period in 2016)
Q2/2017 Change %
Q2/2017 Change % using constant rates
Q1-Q2/2017 Change %
Q1-Q2/2017 Change % using constant rates
Minerals 4 3 6 3 Services business 2 1 1 -2
Flow Control -9 -9 -1 -3Services business -1 -2 6 3
Metso total 1 0 4 2 Services business 1 0 2 -1
3
Metso's Half-Year Financial Review January 1 - June 30, 2017
Financial performance
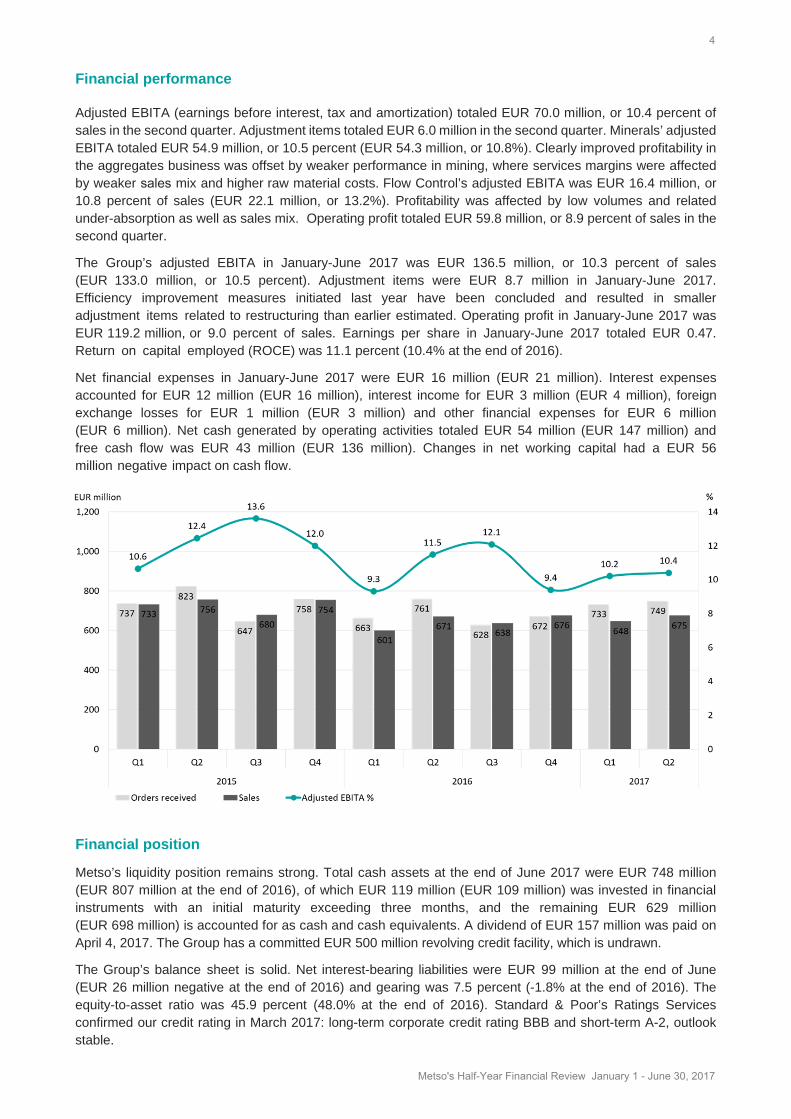
Adjusted EBITA (earnings before interest, tax and amortization) totaled EUR 70.0 million, or 10.4 percent of sales in the second quarter. Adjustment items totaled EUR 6.0 million in the second quarter. Minerals’ adjusted EBITA totaled EUR 54.9 million, or 10.5 percent (EUR 54.3 million, or 10.8%). Clearly improved profitability in the aggregates business was offset by weaker performance in mining, where services margins were affected by weaker sales mix and higher raw material costs. Flow Control’s adjusted EBITA was EUR 16.4 million, or 10.8 percent of sales (EUR 22.1 million, or 13.2%). Profitability was affected by low volumes and related under-absorption as well as sales mix. Operating profit totaled EUR 59.8 million, or 8.9 percent of sales in the second quarter.
The Group’s adjusted EBITA in January-June 2017 was EUR 136.5 million, or 10.3 percent of sales (EUR 133.0 million, or 10.5 percent). Adjustment items were EUR 8.7 million in January-June 2017. Efficiency improvement measures initiated last year have been concluded and resulted in smaller adjustment items related to restructuring than earlier estimated. Operating profit in January-June 2017 was EUR 119.2 million, or 9.0 percent of sales. Earnings per share in January-June 2017 totaled EUR 0.47. Return on capital employed (ROCE) was 11.1 percent (10.4% at the end of 2016).
Net financial expenses in January-June 2017 were EUR 16 million (EUR 21 million). Interest expenses accounted for EUR 12 million (EUR 16 million), interest income for EUR 3 million (EUR 4 million), foreign exchange losses for EUR 1 million (EUR 3 million) and other financial expenses for EUR 6 million (EUR 6 million). Net cash generated by operating activities totaled EUR 54 million (EUR 147 million) and free cash flow was EUR 43 million (EUR 136 million). Changes in net working capital had a EUR 56 million negative impact on cash flow.
Financial position
Metso’s liquidity position remains strong. Total cash assets at the end of June 2017 were EUR 748 million (EUR 807 million at the end of 2016), of which EUR 119 million (EUR 109 million) was invested in financial instruments with an initial maturity exceeding three months, and the remaining EUR 629 million (EUR 698 million) is accounted for as cash and cash equivalents. A dividend of EUR 157 million was paid on April 4, 2017. The Group has a committed EUR 500 million revolving credit facility, which is undrawn.
The Group’s balance sheet is solid. Net interest-bearing liabilities were EUR 99 million at the end of June (EUR 26 million negative at the end of 2016) and gearing was 7.5 percent (-1.8% at the end of 2016). The equity-to-asset ratio was 45.9 percent (48.0% at the end of 2016). Standard & Poor’s Ratings Services confirmed our credit rating in March 2017: long-term corporate credit rating BBB and short-term A-2, outlook stable.
4
Metso's Half-Year Financial Review January 1 - June 30, 2017

On May 30, 2017, Metso announced the intention to exchange its outstanding EUR 400 million bonds maturing in 2019 to new bonds maturing in 2024. The new euro-denominated bond was issued under the EUR 1.5 billion Euro Medium Term Note (EMTN) Program on May 31, 2017. The amount of the new 7-year bond is EUR 300 million, the interest coupon is 1.125 percent and issue price was 99.586 percent. The effective interest rate of the bond is 1.96 per cent. Metso purchased b a c k EUR 205 million of its 2019 bonds. The transaction extended the company’s debt maturity profile.
Capital expenditure and RTD
Gross capital expenditure in January-June 2017, excluding business acquisitions, was EUR 15 million (EUR 15 million). Maintenance accounted for 88 percent, i.e. EUR 13 million (91% and EUR 13 million). In 2017, capital expenditure excluding acquisitions is expected to increase compared to 2016, but to remain below depreciation and amortization. During the second quarter, Metso announced investments in crusher wear parts manufacturing in Isithebe, South Africa, as well as in assembly capacity in its aggregates business in Tampere, Finland. Research and development expenses in January-June totaled EUR 13 million, i.e. 1.0 percent of sales (EUR 17 million and 1.4 percent of sales).
5
Metso's Half-Year Financial Review January 1 - June 30, 2017

Reporting Segments
Minerals
EUR million Q2/2017 Q2/2016 Change % Q1-Q2/
2017 Q1-Q2/
2016 Change % 2016 Orders received 575 593 -3 1,135 1,087 4 2,115 Orders received by the services business 370 337 10 756 672 13 1,348
% of orders received 64 57 67 62 64 Order backlog at the end of the period 1,140 1,113 2 1,078 Sales 523 504 4 1,012 957 6 1,956 Sales of the services business 347 340 2 673 663 2 1,325 % of sales 66 67 67 69 68 Earnings before interest, tax and amortization (EBITA), adjusted 54.9 54.3 1 98.3 91.2 8 190.3 % of sales 10.5 10.8 9.7 9.5 9.7 Operating profit 47.4 49.9 -5 86.7 84.6 2 148.0 % of sales 9.1 9.9 8.6 8.8 7.6 Return on operative capital employed (ROCE), annualized, % 16.3 14.7 13.4 Personnel at the end of the period 8,567 8,701 -2 8,370
Minerals orders in the second quarter were 3 percent lower than in the comparison period and totaled EUR 575 million. However, orders grew 16 percent when a large mining equipment order in the comparison period is adjusted for. Mining equipment orders were EUR 69 million, and some pick-up in market activity was seen during the quarter. Mining services orders grew 12 percent and growth was visible across the board, thanks to high production output and customer focus on productivity. Good activity continued in aggregates, with equipment orders growing 36 percent and services orders remaining flat.
Sales in the second quarter grew 4 percent and totaled EUR 523 million. Aggregates equipment sales grew 18 percent while mining equipment sales were on the same level as in the comparison quarter. Mining services sales showed 3 percent growth, while aggregates services sales were roughly flat.
• A good quarter for the aggregates business• Mining equipment sales remained low and profitability weak
6
Metso's Half-Year Financial Review January 1 - June 30, 2017

Adjusted EBITA in the second quarter totaled EUR 54.9 million, or 10.5 percent of sales (EUR 54.3 million, or 10.8%). Improved profitability of the aggregates equipment business was offset by the continued weak margin in mining equipment. Higher raw material prices and s a l e s mix had a negative impact on the services business. Implemented price increases have not yet mitigated the margin pressure.
Orders in January-June 2017 totaled EUR 1,135 million, a 4 percent increase from the comparison period. Orders in both mining and aggregates were on a healthy level. January-June sales grew 6 percent from the comparison period, mainly due to growth in the equipment business. Adjusted EBITA for January-June 2017 was EUR 98.3 million, or 9.7 percent.
Minerals, sales and adjusted EBITA margin, rolling 12 months
7
Metso's Half-Year Financial Review January 1 - June 30, 2017

Flow Control
EUR million Q2/2017 Q2/2016 Change % Q1-Q2/
2017 Q1-Q2/
2016 Change % 2016 Orders received 174 168 4 347 337 3 609 Orders received by the services business 110 107 3 220 205 7 393 % of orders received 63 64 63 61 65 Order backlog at the end of the period 271 286 -5 242 Sales 152 167 -9 311 315 -1 631 Sales of the services business 98 99 -1 195 185 5 378 % of sales 64 59 63 59 60 Earnings before interest, taxes and amortization (EBITA), adjusted 16.4 22.1 -26 41.2 41.1 0 95.0 % of sales 10.8 13.2 13.2 13.0 15.1 Operating profit 15.8 21.4 -26 40.0 39.8 1 90.4 % of sales 10.4 12.8 12.9 12.6 14.3 Return on operative capital employed (ROCE), annualized, % 25.1 24.9 28.5 Personnel at the end of the period 2,685 2,878 -7 2,663
Flow Control’s second-quarter orders were EUR 174 million (EUR 168 million), increasing year-on-year in both the equipment and services business. Valve orders were at a good level, while pump orders grew significantly from the comparison period. Second-quarter sales totaled EUR 152 million, which is 9 percent lower than in the comparison period. The decline resulted from the lower project order intake in the second half of 2016, while services sales remained stable compared to the last year’s corresponding quarter. Adjusted EBITA in the second quarter was EUR 16.4 million, or 10.8 percent of sales (EUR 22.1 million, or 13.2%). Profitability was affected by low volumes and related under-absorption as well as sales mix.
• Both equipment and services orders grew from the comparison period• Weak profitability in the second quarter, first half was flat year-on-year
8
Metso's Half-Year Financial Review January 1 - June 30, 2017

January-June orders totaled EUR 347 million (EUR 337 million). Equipment orders were 11 percent lower, while services orders increased 7 percent. Valve orders decreased mainly in Asia-Pacific and China, while orders in Europe and the US grew from the comparison period. The valve services business showed stable growth in several market areas. January-June 2017 sales were EUR 311 million, which is roughly on the same level as in January-June 2016. Sales from new projects declined, while services sales increased. January-June 2017 adjusted EBITA was EUR 41.2 million, which is on the same level as in the comparison period.
Flow Control, sales and adjusted EBITA margin, rolling 12 months
9
Metso's Half-Year Financial Review January 1 - June 30, 2017

Personnel
Metso had 11,788 employees at the end of June 2017, 246 more than at the end of December 2016. Personnel increased by 197 to 8,567 in Minerals, and by 22 to 2,685 in Flow Control. Personnel in Group Head Office and other functions totaled 536 (509 at the end of December 2016). The employing of seasonal workforce increased the total number of employees.
Personnel by area Jun 30, 2017 % of personnel Jun 30, 2016 % of personnel Change % Dec 31, 2016
Europe 4,206 36 4,334 36 -3 4,097 North America 1,566 13 1,780 15 -12 1,609
South and Central America 2,630 22 2,455 20 7 2,420
China 1,002 9 1,116 9 -10 1,032
Other Asia-Pacific 1,507 13 1,488 12 1 1,498
Africa and Middle East 877 7 926 8 -5 886
Metso total 11,788 100 12,099 100 -3 11,542
Decisions of the Annual General Meeting
Metso’s Annual General Meeting (AGM) was held on March 23, 2017. The AGM approved the Financial Statements for 2016 and discharged the members of the Board of Directors and the President and CEO from liability for the 2016 financial year. The dividend of EUR 1.05 per share was paid on April 4, 2017, in accordance with the AGM’s decision. The Annual General Meeting approved the Nomination Board’s propos-als concerning Board members, and their remuneration was also approved by the meeting. Authorized Public Accountant firm Ernst & Young was elected as the company’s Auditor until the end of the next Annual General Meeting. Ernst & Young Oy has designated Mikko Järventausta, APA, as responsible auditor.
Visit metso.com/agm to read more about the decisions of the Annual General Meeting.
New President and CEO and changes in Executive Team
On May 3, 2017, the Board of Directors appointed Nico Delvaux as President and CEO of Metso. He joined Metso on July 1 and will assume his duties as President and CEO on August 1. Mr. Delvaux was previously Senior Executive Vice President for Atlas Copco AB and Business Area President for Compressor Technique. The nomination was a part of Metso’s succession planning. Current President and CEO, Matti Kähkönen, will act as Senior Advisor to the Board until his retirement.
Victor Tapia assumed his position as President of Minerals Capital business area and member of the Executive Team on June 1, 2017. His appointment was announced on December 14, 2016, and he joined Metso in February 2017. The former head of Minerals Capital, João Colagrossi, moved to the Minerals Services business area to develop the screening business.
After the reporting period, on July 14, 2017, it was announced that Perttu Louhiluoto, President of Minerals Services business area, has decided to pursue other career opportunities outside the company and will leave Metso by the end of 2017, at the latest. He has been employed by Metso since 2008 and has held several management positions in various businesses.
Visit metso.com/management to read more about Nico Delvaux and Victor Tapia.
Other events during the quarter
On June 28, 2017, it was announced that Metso has signed a distribution agreement for its valve products with Process Control Equipment, PCE, to cover UK, Benelux and Spain. PCE will add Metso’s Neles and Jamesbury product families to its current portfolio. The expansion of distribution will bring more local support, local inventories and faster deliveries in these countries.
10
Metso's Half-Year Financial Review January 1 - June 30, 2017

On June 27, 2017, Metso announced that it will increase its manufacturing capacity for large crusher wear part castings by investing in a second melting furnace in Isithebe foundry, South Africa. The investment was made to meet the growing demand for large crusher wear parts in the mining industry. The investment of EUR 3.5 million will ensure the availability of Metso’s heavy crusher wear parts globally.
On June 21, 2017, Metso announced that it will increase capacity in its Tampere factory by more than 30 percent by investing in a new production line for Lokotrack mobile crushing plants. The investment of approximately EUR 1 million will shorten delivery times of equipment and improve occupational safety.
On June 8, 2017, Metso announced it will donate EUR 1 million euros to three Finnish universities. The donation is a part of the program for centenary of Finland’s independence. Through the donation, Metso wishes to support Finnish scientific research and its application in practice. The donations are based on the decision of Metso’s Annual General Meeting on March 23, 2017.
On May 31, 2017, Metso announced that it has selected Rockwell Automation as its partner for delivering a global industrial Internet of Things (IoT) platform. The platform will help connect, monitor and perform analytics for Metso’s new and existing equipment as well as services. The solution will result in improved efficiency and profitability for our mining and aggregates customers.
Shares and share trading
As of June 30, 2017, Metso’s share capital was EUR 140,982,843.80 and the number of shares was 150,348,256. This included 351,128 treasury shares held by the Parent Company, which represented 0.2 percent of all shares and votes. A total of 12,590 treasury shares were conveyed as rewards for participants in the Long-term Incentive Plan 2012-2014 in February 2017.
A total of 64,576,983 Metso shares were traded on NASDAQ OMX Helsinki in January-June 2017, equivalent to a turnover of EUR 1,911 million. The volume-weighted average trading price for the period was EUR 29.60. The highest quotation was EUR 33.73 and the lowest EUR 29.46. The closing price on June 30, 2017, was EUR 30.36, giving Metso a market capitalization, excluding shares held by the Parent Company, of EUR 4,554 million (EUR 4,065 million at the end of 2016).
Metso’s ADRs (American Depositary Receipts) are traded on the International OTCQX market in the United States under the ticker symbol ‘MXCYY’, with four ADRs representing one Metso share. The closing price of the Metso ADR on June 30, 2017, was USD 8.71.
Flagging notifications
In January-June 2017, Metso received the following flagging notifications of changes in direct shareholding, shareholding through financial instruments or their total amount. Metso is not aware of any shareholders’ agreements regarding the ownership of Metso shares and voting rights. Metso has 150,348,256 issued shares.
Date Shareholder Threshold Direct, % Indirect, % Total, % Total shares May 15, 2017 Blackrock, Inc. above 5% 5.02 0.67 5.70 8,579,587 April 18, 2017 Blackrock, Inc. below 5% 4.76 0.82 5.59 8,406,466
March 24, 2017 Blackrock, Inc. above 5% 5.07 0.22 5.30 7,972,471 March 9, 2017 Blackrock, Inc. below 5% 4.35 1.53 5.89 8,856,163 February 28, 2017 Blackrock, Inc. above 5% 5.06 0.78 5.84 8,793,183
February 8, 2017 Blackrock, Inc. below 5% 4.94 0.84 5.79 8,705,734 February 7, 2017 Blackrock, Inc. above 5% 5.02 0.74 5.76 8,666,338 February 6, 2017 Blackrock, Inc. below 5% 4.97 0.75 5.72 8,611,261
February 3, 2017 Blackrock, Inc. at 5% 5.00 0.79 5.79 8,718,113 February 1, 2017 Blackrock, Inc. below 5% 4.98 0.72 5.71 8,856,003 January 11, 2017 Blackrock, Inc. above 5% 5.10 0.51 5.62 8,451,908
11
Metso's Half-Year Financial Review January 1 - June 30, 2017

Short-term business risks and market uncertainties
Uncertainties in economic growth and political developments globally might affect our customer industries, reduce the investment appetite and cut spending among our customers, and thereby weaken the demand for Metso’s products and services as well as affect business operations and projects under negotiation. There are also other market- or customer-related factors that may cause on-going projects to be postponed, delayed or discontinued.
Exchange rate fluctuations and changes in commodity prices might affect our order intake, sales and financial performance, although the wide scope of our operations limits the exposure to single currencies or commodities. Metso hedges currency exposure linked to firm delivery and purchase agreements. Higher raw material prices and labor costs might also be hard to promptly integrate into the prices of Metso’s equipment, products and services.
Uncertain market conditions might adversely affect our customers’ payment behavior and increase the risk of lawsuits, claims and disputes taken against Metso in various countries related to, among other things, Metso’s products, projects and other operations.
An additional risk area continues to be information security and cyber threats, which can potentially disturb or disrupt Metso’s businesses and operations.
Outlook for 2017 (changes in brackets)
Metso’s overall trading conditions are expected to be better than in 2016. Demand for our products and services in 2017 is expected to develop as follows:
At the end of June 2017, our backlog for 2017 totaled approximately EUR 1 billion. In the current market conditions, we continue to expect some postponements to planned delivery timetables. Capital expenditure excluding acquisitions is expected to increase compared to 2016, but to remain below depreciation and amortization.
Helsinki, July 20, 2017 Metso Corporation’s Board of Directors
It should be noted that certain statements herein which are not historical facts, including, without limitation, those regarding expectations for general economic development and the market situation, expectations for customer industry profitability and investment willingness, expectations for company growth, development and profitability and the realization of synergy benefits and cost savings, and statements preceded by “expects”, “estimates”, “forecasts” or similar expressions, are forward-looking statements. These statements are based on current decisions and plans and currently known factors. They involve risks and uncertainties that may cause the actual results to materially differ from the results currently expected by the company.
Such factors include, but are not limited to: (1) general economic conditions, including fluctuations in exchange rates and interest levels which influence the operatingenvironment and profitability of customers and thereby the orders received by the company and their margins,(2) the competitive situation, especially significant technological solutions developed by competitors,(3) the company’s own operating conditions, such as the success of production, product development and projectmanagement and their continuous development and improvement,(4) the success of pending and future acquisitions and restructuring.
This Half-Year Financial Review has been prepared in accordance with IAS 34 'Interim Financial Reporting'. The same accounting policies have been applied in the Annual Financial Statements. This Half-Year Financial Review is unaudited.
• Improve to satisfactory for mining equipment (previously: weak) and remain good for mining services• Remain good for aggregates equipment and services• Remain good for flow control products related to customers’ new investments and services
12
Metso's Half-Year Financial Review January 1 - June 30, 2017

CONSOLIDATED STATEMENT OF INCOME
EUR million 4-6/2017 4-6/2016 1-6/2017 1-6/2016 1-12/2016Sales 675 671 1,323 1,272 2,586Cost of goods sold -488 -475 -952 -900 -1,849Gross profit 187 196 371 372 737
Selling, general and administrative expenses -127 -130 -253 -256 -516Other operating income and expenses, net 0 4 1 4 6Share in profits of associated companies 0 0 0 0 0Operating profit 60 70 119 120 227
Financial income 2 2 4 5 8Financial expenses -9 -11 -20 -26 -47Financial expenses, net -7 -9 -16 -21 -39
Profit before taxes 53 61 103 99 188
Income taxes -17 -19 -32 -30 -58Profit for the period 36 42 70 69 130
Attributable to:Shareholders of the company 36 42 70 69 130Non-controlling interests 0 0 0 0 0
Profit for the period 36 42 70 69 130
Earnings per share Basic, EUR 0.24 0.28 0.47 0.46 0.87Diluted, EUR 0.24 0.28 0.47 0.46 0.87
CONSOLIDATED STATEMENT OF COMPREHENSIVE INCOME
EUR million 4-6/2017 4-6/2016 1-6/2017 1-6/2016 1-12/2016Profit for the period 36 42 70 69 130
Items that may be reclassified to profit or loss in subsequent periods:Cash flow hedges, net of tax 2 0 3 1 -2Available-for-sale equity investments, net of tax 0 0 0 0 0Currency translation on subsidiary net investments -32 13 -26 8 23
-30 13 -23 9 21Items that will not be reclassified to profit or loss:Defined benefit plan actuarial gains (+) / losses (-), net of tax - - - - 3Other comprehensive income (+) / expense (-) -30 13 -23 9 24
Total comprehensive income (+) / expense (-) 6 55 47 78 154
Attributable to:Shareholders of the company 6 55 47 78 154Non-controlling interests 0 0 0 0 0
Total comprehensive income (+) / expense (-) 6 55 47 78 154
This Half-Year Review has been prepared in accordance with IAS 34 'Interim Financial Reporting'. The same accounting policies have been applied in the Annual Financial Statements. This Half-Year Review is unaudited.
All figures presented have been rounded and consequently the sum of individual figures might differ from the presented total figure.
13
Metso's Half-Year Financial Review January 1 - June 30, 2017

CONSOLIDATED BALANCE SHEET
ASSETS
EUR million June 30, 17 June 30, 16 Dec 31, 16
Non-current assetsIntangible assets
Goodwill 449 451 452
Other intangible assets 76 90 86
525 541 538
Tangible assetsLand and water areas 43 48 45
Buildings and structures 103 119 113
Machinery and equipment 138 157 149
Assets under construction 8 7 8
293 331 315
Financial and other assetsInvestments in associated companies 1 1 1
Available-for-sale equity investments 1 1 1
Loan and other interest bearing receivables 3 3 3
Derivative financial instruments 2 13 8
Deferred tax asset 103 103 112
Other non-current assets 31 37 32
140 158 157
Total non-current assets 958 1,030 1,010
Current assetsInventories 721 727 709
ReceivablesTrade and other receivables 600 624 605
Cost and earnings of projects under construction in excess of advance billings 65 73 66
Loan and other interest bearing receivables 1 10 10
Financial instruments held for trading 119 104 109
Derivative financial instruments 16 4 9
Income tax receivables 29 18 20
Receivables total 829 833 819
Cash and cash equivalents 629 511 698
Total current assets 2,179 2,071 2,226
TOTAL ASSETS 3,138 3,101 3,236
14
Metso's Half-Year Financial Review January 1 - June 30, 2017

SHAREHOLDERS' EQUITY AND LIABILITIES
EUR million June 30, 17 June 30, 16 Dec 31, 16
EquityShare capital 141 141 141Cumulative translation adjustments -74 -63 -48Fair value and other reserves 302 302 299Retained earnings 954 976 1,039
Equity attributable to shareholders 1,323 1,356 1,431
Non-controlling interests 7 8 8
Total equity 1,330 1,364 1,439
LiabilitiesNon-current liabilities
Long-term debt 590 769 767Post employment benefit obligations 85 98 88Provisions 39 30 40Derivative financial instruments 0 7 5Deferred tax liability 6 9 11Other long-term liabilities 2 4 2
Total non-current liabilities 722 917 913
Current liabilitiesCurrent portion of long-term debt 243 0 0Short-term debt 18 32 27Trade and other payables 475 453 470Provisions 66 64 81Advances received 192 186 186
Billings in excess of cost and earnings of projects under construction 47 40 54Derivative financial instruments 4 14 21Income tax liabilities 40 31 45
Total current liabilities 1,085 820 884
Total liabilities 1,807 1,737 1,797
TOTAL SHAREHOLDERS' EQUITY AND LIABILITIES 3,138 3,101 3,236
NET INTEREST BEARING LIABILITIESEUR million June 30, 17 June 30, 16 Dec 31, 16Long-term interest bearing debt 590 769 767Short-term interest bearing debt 261 32 27Cash and cash equivalents -629 -511 -698Other interest bearing assets -123 -117 -122Net interest bearing liabilities 99 173 -26
15
Metso's Half-Year Financial Review January 1 - June 30, 2017

CONDENSED CONSOLIDATED CASH FLOW STATEMENT
EUR million 4-6/2017 4-6/2016 1-6/2017 1-6/2016 1-12/2016
Cash flows from operating activities:
Profit 36 42 70 69 130
Adjustments to reconcile profit to net cash provided by operating activities
Depreciation and amortization 14 15 29 31 61
Financial income and expenses, net 7 9 16 21 39
Income taxes 17 18 32 30 58
Other 7 4 12 7 12
Change in net working capital -35 15 -56 4 92
Cash flows from operations 46 103 104 162 392
Financial income and expenses, net paid -9 -8 -13 -12 -25
Income taxes paid -25 -15 -37 -3 -21
Net cash provided by operating activities 12 80 54 147 346
Cash flows from investing activities:
Capital expenditures on fixed assets -9 -9 -15 -15 -31
Proceeds from sale of fixed assets - 2 2 2 21
Other - 0 - 0 -
Net cash provided by (+) / used in (-) investing activities -8 -7 -13 -13 -10
Cash flows from financing activities:
Dividends paid -157 -157 -157 -157 -157
Proceeds from (+) / Investments in (-) financial assets -8 -12 0 -37 -42
Net funding 76 -26 56 -25 -40
Other items -1 - -1 - -
Net cash provided by (-) / used in (-) financing activities -90 -195 -102 -219 -239
Net increase (+) / decrease (-) in cash and cash equivalents -87 -122 -61 -85 98
Effect from changes in exchange rates -9 7 -7 6 10
Cash and cash equivalents at beginning of period 725 626 698 590 590
Cash and cash equivalents at end of period 629 511 629 511 698
FREE CASH FLOW
EUR million 4-6/2017 4-6/2016 1-6/2017 1-6/2016 1-12/2016
Net cash provided by operating activities 12 80 54 147 346
Capital expenditures on maintenance investments -8 -8 -13 -13 -28
Proceeds from sale of fixed assets - 2 2 2 21
Free cash flow 4 74 43 136 339
16
Metso's Half-Year Financial Review January 1 - June 30, 2017
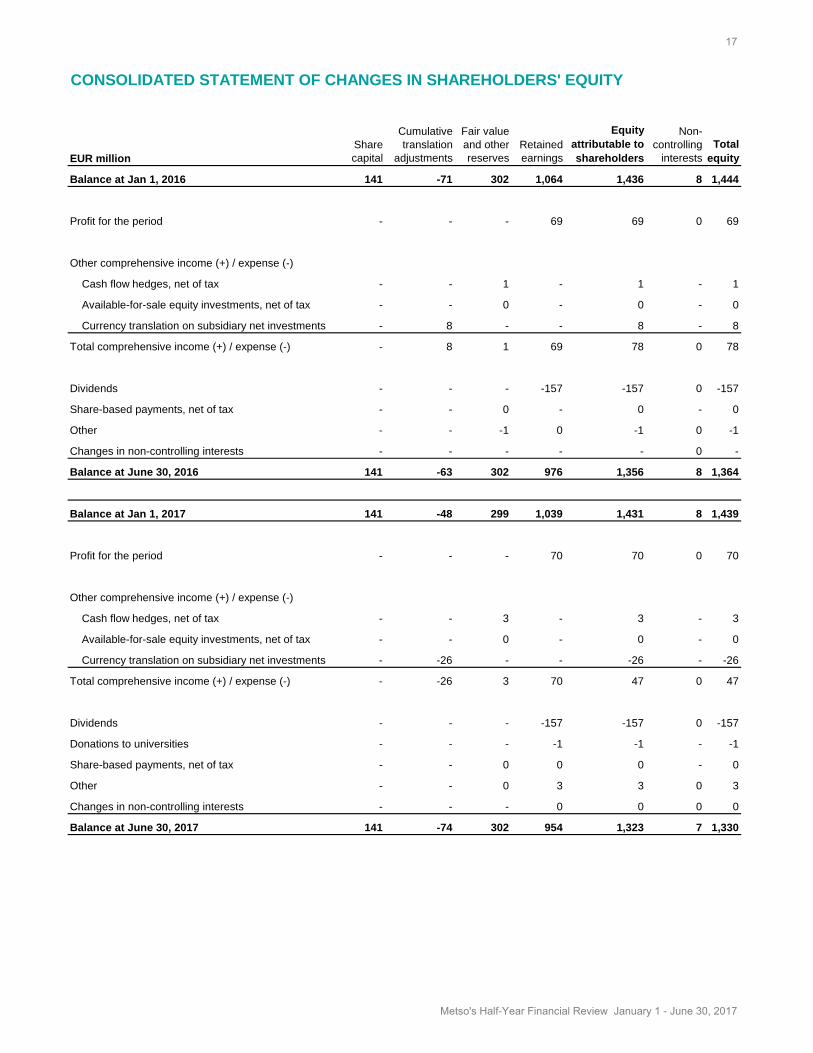
CONSOLIDATED STATEMENT OF CHANGES IN SHAREHOLDERS' EQUITY
EUR millionSharecapital
Cumulativetranslation
adjustments
Fair valueand otherreserves
Retainedearnings
Equityattributable toshareholders
Non-controlling
interestsTotal
equity
Balance at Jan 1, 2016 141 -71 302 1,064 1,436 8 1,444
Profit for the period - - - 69 69 0 69
Other comprehensive income (+) / expense (-)
Cash flow hedges, net of tax - - 1 - 1 - 1
Available-for-sale equity investments, net of tax - - 0 - 0 - 0
Currency translation on subsidiary net investments - 8 - - 8 - 8
Total comprehensive income (+) / expense (-) - 8 1 69 78 0 78
Dividends - - - -157 -157 0 -157
Share-based payments, net of tax - - 0 - 0 - 0
Other - - -1 0 -1 0 -1
Changes in non-controlling interests - - - - - 0 -
Balance at June 30, 2016 141 -63 302 976 1,356 8 1,364
Balance at Jan 1, 2017 141 -48 299 1,039 1,431 8 1,439
Profit for the period - - - 70 70 0 70
Other comprehensive income (+) / expense (-)
Cash flow hedges, net of tax - - 3 - 3 - 3
Available-for-sale equity investments, net of tax - - 0 - 0 - 0
Currency translation on subsidiary net investments - -26 - - -26 - -26
Total comprehensive income (+) / expense (-) - -26 3 70 47 0 47
Dividends - - - -157 -157 0 -157
Donations to universities - - - -1 -1 - -1
Share-based payments, net of tax - - 0 0 0 - 0
Other - - 0 3 3 0 3
Changes in non-controlling interests - - - 0 0 0 0
Balance at June 30, 2017 141 -74 302 954 1,323 7 1,330
17
Metso's Half-Year Financial Review January 1 - June 30, 2017

FAIR VALUE ESTIMATION
Level 1
Level 2
•
•
• Fixed rate debt under fair value hedge accounting.
Level 3
EUR million Level 1 Level 2 Level 3Assets
• Derivatives - 13 -• Securities 2 117 -
- 8 -
• Equity investments - - -• Debt investments - - -Total assets 2 138 -
Liabilities
• Derivatives - 4 -• Long term debt at fair value - 399 -
- 4 -Total liabilities - 407 -
EUR million Level 1 Level 2 Level 3Assets
• Derivatives - 2 -• Securities 21 83 -
- 14 -
• Equity investments 0 - -• Debt investments - - -Total assets 21 99 -
Liabilities
• Derivatives - 16 -• Long term debt at fair value - 418 -
- 5 -Total liabilities - 439 -
For those financial assets and liabilities which have been recognized at fair value in the balance sheet, the following measurement hierarchy and valuation methods have been applied:
Quoted unadjusted prices at the balance sheet date in active markets. The market prices are readily and regularly available from an exchange, dealer, broker, market information service system, pricing service or regulatory agency. The quoted market price used for financial assets is the current bid price. Level 1 financial instruments include debt and equity investments classified as financial instruments available-for-sale or at fair value through profit and loss.
The fair value of financial instruments in Level 2 is determined using valuation techniques. These techniques utilize observable market data readily and regularly available from an exchange, dealer, broker, market information service system, pricing service or regulatory agency. Level 2 financial instruments include:
Over-the-counter derivatives classified as financial assets/liabilities at fair value through profit and loss or qualified for hedge accounting.
Debt securities classified as financial instruments available-for-sale or at fair value through profit and loss.
Financial assets at fair value through profit and loss
June 30, 2017
Available for sale investments
A financial instrument is categorized into Level 3, if the calculation of the fair value cannot be based on observable market data. Metso had no such instruments.
The table below present Metso’s financial assets and liabilities that are measured at fair value. There has been no transfers between fair value levels during 2016 or 2017.
Derivatives qualified for hedge accounting
Available for sale investments
Financial liabilities at fair value through profit and loss
Derivatives qualified for hedge accounting
Carrying value of other financial assets and liabilities than those presented in this fair value level hierarchy table approximates their fair value. Fair values of other debt is calculated as net present values.
Financial liabilities at fair value through profit and loss
Derivatives qualified for hedge accounting
June 30, 2016
Financial assets at fair value through profit and loss
Derivatives qualified for hedge accounting
18
Metso's Half-Year Financial Review January 1 - June 30, 2017
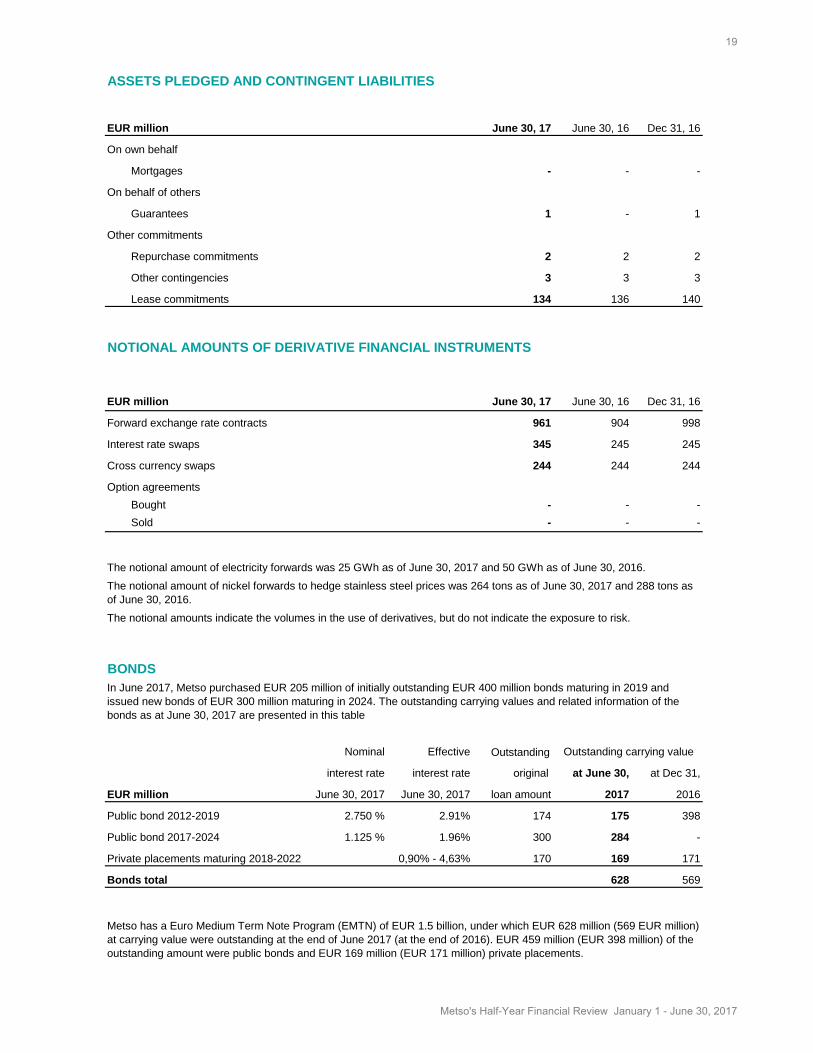
ASSETS PLEDGED AND CONTINGENT LIABILITIES
EUR million June 30, 17 June 30, 16 Dec 31, 16
On own behalf
Mortgages - - -
On behalf of others
Guarantees 1 - 1
Other commitments
Repurchase commitments 2 2 2
Other contingencies 3 3 3
Lease commitments 134 136 140
NOTIONAL AMOUNTS OF DERIVATIVE FINANCIAL INSTRUMENTS
EUR million June 30, 17 June 30, 16 Dec 31, 16
Forward exchange rate contracts 961 904 998
Interest rate swaps 345 245 245
Cross currency swaps 244 244 244
Option agreementsBought - - -Sold - - -
BONDS
Nominal Effective
interest rate interest rate original at June 30, at Dec 31,
EUR million June 30, 2017 June 30, 2017 loan amount 2017 2016
Public bond 2012-2019 2.750 % 2.91% 174 175 398
Public bond 2017-2024 1.125 % 1.96% 300 284 -
Private placements maturing 2018-2022 0,90% - 4,63% 170 169 171
Bonds total 628 569
Outstanding carrying value
The notional amount of nickel forwards to hedge stainless steel prices was 264 tons as of June 30, 2017 and 288 tons as of June 30, 2016.The notional amounts indicate the volumes in the use of derivatives, but do not indicate the exposure to risk.
Metso has a Euro Medium Term Note Program (EMTN) of EUR 1.5 billion, under which EUR 628 million (569 EUR million) at carrying value were outstanding at the end of June 2017 (at the end of 2016). EUR 459 million (EUR 398 million) of the outstanding amount were public bonds and EUR 169 million (EUR 171 million) private placements.
The notional amount of electricity forwards was 25 GWh as of June 30, 2017 and 50 GWh as of June 30, 2016.
In June 2017, Metso purchased EUR 205 million of initially outstanding EUR 400 million bonds maturing in 2019 and issued new bonds of EUR 300 million maturing in 2024. The outstanding carrying values and related information of the bonds as at June 30, 2017 are presented in this table
Outstanding
19
Metso's Half-Year Financial Review January 1 - June 30, 2017

KEY RATIOS
1-6/2017 1-6/2016 1-12/2016
Earnings per share, EUR 0.47 0.46 0.87
Diluted earnings per share, EUR 0.47 0.46 0.87
Equity/share at end of period, EUR 8.82 9.04 9.54
Return on equity (ROE), %, (annualized) 10.2 9.8 9.0
Return on capital employed (ROCE) before taxes, %, (annualized) 11.1 11.0 10.4
Return on capital employed (ROCE) after taxes, %, (annualized) 8.1 8.3 7.8
Equity to assets ratio at end of period, % 45.9 47.4 48.0
Net gearing at end of period, % 7.5 12.8 -1.8
Free cash flow, EUR million 43 136 339
Free cash flow/share, EUR 0.29 0.91 2.26
Cash conversion, % 61 197 261
Gross capital expenditure (excl. business acquisitions), EUR million 15 15 31
Business acquisitions, net of cash acquired, EUR million - - -
Depreciation and amortization, EUR million 29 31 61
Number of outstanding shares at end of period (thousands) 149,997 149,985 149,985
Average number of shares (thousands) 149,993 149,985 149,985
Average number of diluted shares (thousands) 150,190 150,040 150,113
20
Metso's Half-Year Financial Review January 1 - June 30, 2017

FORMULAS FOR CALCULATION OF INDICATORSEarnings before interest, tax and amortization (EBITA), adjusted:Operating profit + adjustment items + amortization + goodwill impairment
Earnings per share, basic:Profit attributable to shareholdersAverage number of outstanding shares during period
Earnings per share, diluted:Profit attributable to shareholdersAverage number of diluted shares during period
Equity/share:Equity attributable to shareholdersNumber of outstanding shares at the end of period
Return on equity (ROE), %:Profit for the periodTotal equity (average for period)
Return on capital employed (ROCE) before taxes, %:Profit before tax + interest and other financial expensesCapital employed (average for period)
Return on capital employed (ROCE) after taxes, %:Profit for the period + interest and other financial expensesCapital employed (average for period)
Net gearing, %:Net interest bearing liabilitiesTotal equity
Equity to assets ratio, %:Total equityBalance sheet total – advances received
Free cash flow:Net cash provided by operating activities- capital expenditures on maintenance investments+ proceeds from sale of fixed assets= Free cash flow
Free cash flow / share:Free cash flowAverage number of outstanding shares during period
Cash conversion, %:Free cash flow
Profit for the period
Net interest bearing liabilities:
Capital employed:
Operative capital employed:
Return on operative capital employed (ROCE) for reporting segments, %:Operating profitOperative capital employed (month-end average)
x 100
x 100
x 100
x 100
x 100
Long term debt + current portion of long term debt + short term debt - loan and other interest bearing receivables (non-current and current) - financial instruments held for trading - cash and cash equivalents
Net working capital + intangible and tangible assets + non-current investments + interest bearing receivables + financial instruments held for trading + cash and cash equivalents + tax receivables, net + interest receivables, net
x 100
x 100
Intangible and tangible assets + investments in associated companies and joint ventures + available-for-sale equity investments + inventories + non-interest bearing operative assets and receivables (external) - non-interest bearing operating liabilities (external)
21
Metso's Half-Year Financial Review January 1 - June 30, 2017
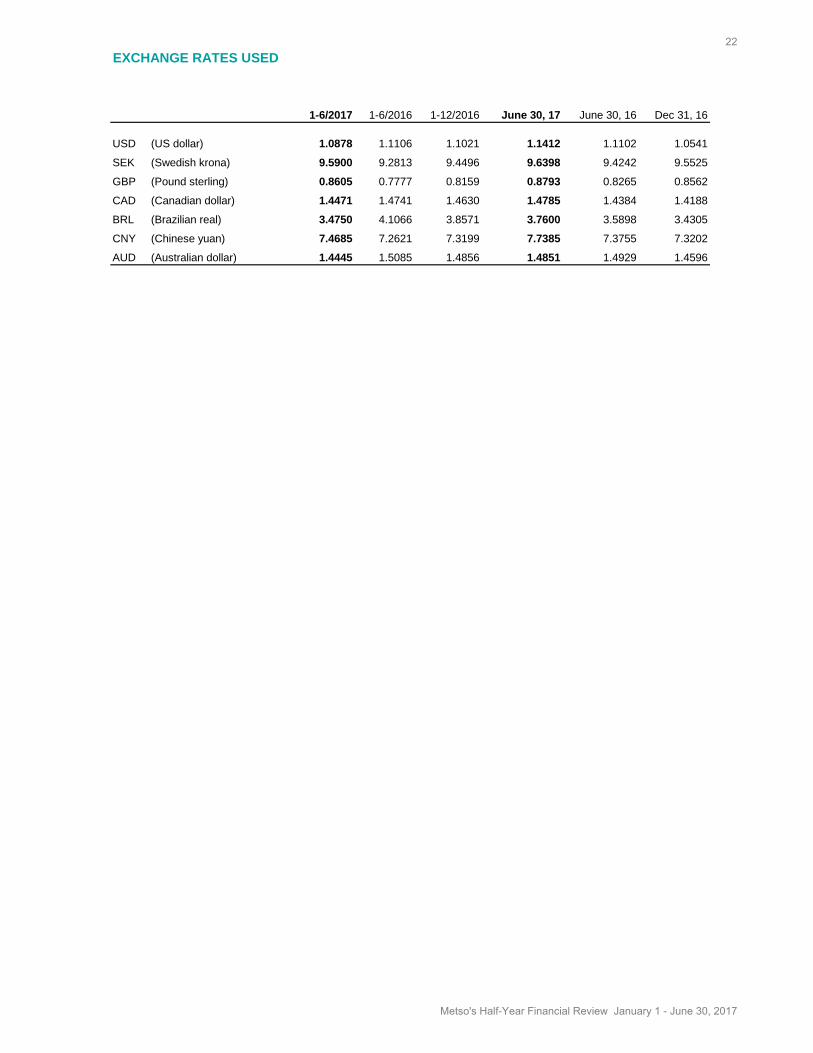
EXCHANGE RATES USED
1-6/2017 1-6/2016 1-12/2016 June 30, 17 June 30, 16 Dec 31, 16
USD (US dollar) 1.0878 1.1106 1.1021 1.1412 1.1102 1.0541
SEK (Swedish krona) 9.5900 9.2813 9.4496 9.6398 9.4242 9.5525
GBP (Pound sterling) 0.8605 0.7777 0.8159 0.8793 0.8265 0.8562
CAD (Canadian dollar) 1.4471 1.4741 1.4630 1.4785 1.4384 1.4188
BRL (Brazilian real) 3.4750 4.1066 3.8571 3.7600 3.5898 3.4305
CNY (Chinese yuan) 7.4685 7.2621 7.3199 7.7385 7.3755 7.3202
AUD (Australian dollar) 1.4445 1.5085 1.4856 1.4851 1.4929 1.4596
22
Metso's Half-Year Financial Review January 1 - June 30, 2017

SEGMENT INFORMATION
ORDERS RECEIVEDEUR million 4-6/2017 4-6/2016 1-6/2017 1-6/2016 7/2016-6/2017 1-12/2016Minerals 575 593 1,135 1,087 2,163 2,115Flow Control 174 167 347 337 619 609Group Head Office and other - - - - - -Intra Metso orders received 0 0 0 0 0 0Metso total 749 761 1,482 1,424 2,782 2,724
SALESEUR million 4-6/2017 4-6/2016 1-6/2017 1-6/2016 7/2016-6/2017 1-12/2016Minerals 523 504 1,012 957 2,011 1,956Flow Control 152 167 311 315 627 631Group Head Office and other - - - - - -Intra Metso net sales 0 0 0 0 -1 -1Metso total 675 671 1,323 1,272 2,637 2,586
ADJUSTED EBITAEUR million 4-6/2017 4-6/2016 1-6/2017 1-6/2016 7/2016-6/2017 1-12/2016Minerals 54.9 54.3 98.3 91.2 197.4 190.3Flow Control 16.4 22.1 41.2 41.1 95.1 95.0Group Head Office and other -1.3 0.9 -3.1 0.7 -15.1 -11.3Metso total 70.0 77.3 136.5 133.0 277.4 274.0
ADJUSTED EBITA, % OF SALES % 4-6/2017 4-6/2016 1-6/2017 1-6/2016 7/2016-6/2017 1-12/2016Minerals 10.5 10.8 9.7 9.5 9.8 9.7Flow Control 10.8 13.2 13.2 13.0 15.2 15.1Group Head Office and other n/a n/a n/a n/a n/a n/aMetso total 10.4 11.5 10.3 10.5 10.5 10.6
ADJUSTMENT ITEMSEUR million 4-6/2017 4-6/2016 1-6/2017 1-6/2016 7/2016-6/2017 1-12/2016Minerals -6.0 -2.9 -8.7 -3.6 -41.4 -36.3Flow Control - - - - -2.0 -2.0Group Head Office and other - -0.8 0.0 -1.0 9.6 8.6Metso total -6.0 -3.7 -8.7 -4.6 -33.8 -29.7
AMORTIZATIONEUR million 4-6/2017 4-6/2016 1-6/2017 1-6/2016 7/2016-6/2017 1-12/2016Minerals -1.4 -1.5 -2.9 -3.1 -5.8 -6.0Flow Control -0.6 -0.7 -1.2 -1.3 -2.5 -2.6Group Head Office and other -2.2 -2.2 -4.4 -4.4 -8.7 -8.7Metso total -4.2 -4.4 -8.5 -8.8 -17.0 -17.3
OPERATING PROFIT (LOSS)EUR million 4-6/2017 4-6/2016 1-6/2017 1-6/2016 7/2016-6/2017 1-12/2016Minerals 47.4 49.9 86.7 84.6 150.1 148.0Flow Control 15.8 21.4 40.0 39.8 90.6 90.4Group Head Office and other -3.4 -2.0 -7.4 -4.7 -14.1 -11.4Metso total 59.8 69.3 119.2 119.7 226.6 227.1
OPERATING PROFIT (LOSS), % OF SALES % 4-6/2017 4-6/2016 1-6/2017 1-6/2016 7/2016-6/2017 1-12/2016Minerals 9.1 9.9 8.6 8.8 7.5 7.6Flow Control 10.4 12.8 12.9 12.6 14.4 14.3Group Head Office and other n/a n/a n/a n/a n/a n/aMetso total 8.9 10.3 9.0 9.4 8.6 8.8
23
Metso's Half-Year Financial Review January 1 - June 30, 2017

QUARTERLY INFORMATION
ORDERS RECEIVEDEUR million 4-6/2016 7-9/2016 10-12/2016 1-3/2017 4-6/2017Minerals 593 492 536 560 575Flow Control 167 136 136 173 174Group Head Office and other - - - - -Intra Metso orders received 0 0 0 0 0Metso total 761 628 672 733 749
SALESEUR million 4-6/2016 7-9/2016 10-12/2016 1-3/2017 4-6/2017Minerals 504 477 522 489 523Flow Control 167 161 155 159 152Group Head Office and other - - - - -Intra Metso net sales 0 0 -1 0 0Metso total 671 638 676 648 675
ADJUSTED EBITAEUR million 4-6/2016 7-9/2016 10-12/2016 1-3/2017 4-6/2017Minerals 54.3 51.7 47.4 43.4 54.9Flow Control 22.1 28.2 25.7 24.8 16.4Group Head Office and other 0.9 -2.7 -9.3 -1.8 -1.3Metso total 77.3 77.2 63.8 66.4 70.0
ADJUSTED EBITA, % OF SALES% 4-6/2016 7-9/2016 10-12/2016 1-3/2017 4-6/2017Minerals 10.8 10.8 9.1 8.9 10.5Flow Control 13.2 17.5 16.6 15.6 10.8Group Head Office and other n/a n/a n/a n/a n/aMetso total 11.5 12.1 9.4 10.2 10.4
ADJUSTMENT ITEMSEUR million 4-6/2016 7-9/2016 10-12/2016 1-3/2017 4-6/2017Minerals -2.9 -19.3 -13.4 -2.7 -6.0Flow Control - -1.6 -0.4 - -Group Head Office and other -0.8 10.9 -1.3 - -Metso total -3.7 -10.0 -15.1 -2.7 -6.0
24
Metso's Half-Year Financial Review January 1 - June 30, 2017

AMORTIZATIONEUR million 4-6/2016 7-9/2016 10-12/2016 1-3/2017 4-6/2017Minerals -1.5 -1.5 -1.4 -1.5 -1.4Flow Control -0.7 -0.6 -0.7 -0.6 -0.6Group Head Office and other -2.2 -2.2 -2.1 -2.2 -2.2Metso total -4.4 -4.3 -4.2 -4.3 -4.2
OPERATING PROFIT (LOSS)EUR million 4-6/2016 7-9/2016 10-12/2016 1-3/2017 4-6/2017Minerals 49.9 30.9 32.5 39.3 47.4Flow Control 21.4 26.0 24.6 24.2 15.8Group Head Office and other -2.0 6.0 -12.7 -4.0 -3.4Metso total 69.3 62.9 44.5 59.4 59.8
OPERATING PROFIT (LOSS), % OF SALES% 4-6/2016 7-9/2016 10-12/2016 1-3/2017 4-6/2017Minerals 9.9 6.5 6.2 8.0 9.1Flow Control 12.8 16.1 15.9 15.2 10.4Group Head Office and other n/a n/a n/a n/a n/aMetso total 10.3 9.9 6.6 9.2 8.9
CAPITAL EMPLOYEDEUR million June 30, 2016 Sep 30, 2016 Dec 31, 2016 Mar 31, 2017 June 30, 2017Minerals * 1,141 1,075 1,046 1,037 1,032Flow Control * 322 322 314 325 311Group Head Office and other 701 800 873 894 838Metso total 2,164 2,197 2,233 2,256 2,181* Operative capital employed includes only external balance sheet items.
ORDER BACKLOGEUR million June 30, 2016 Sep 30, 2016 Dec 31, 2016 Mar 31, 2017 June 30, 2017Minerals 1,113 1,046 1,078 1,138 1,140Flow Control 286 259 242 258 271Group Head Office and other - - - - -Intra Metso order backlog 0 0 0 0 0Metso total 1,399 1,305 1,320 1,396 1,411
PERSONNEL June 30, 2016 Sep 30, 2016 Dec 31, 2016 Mar 31, 2017 June 30, 2017Minerals 8,701 8,447 8,370 8,353 8,567Flow Control 2,878 2,735 2,663 2,632 2,685Group Head Office and other 520 465 509 468 536Metso total 12,099 11,647 11,542 11,453 11,788
25
Metso's Half-Year Financial Review January 1 - June 30, 2017
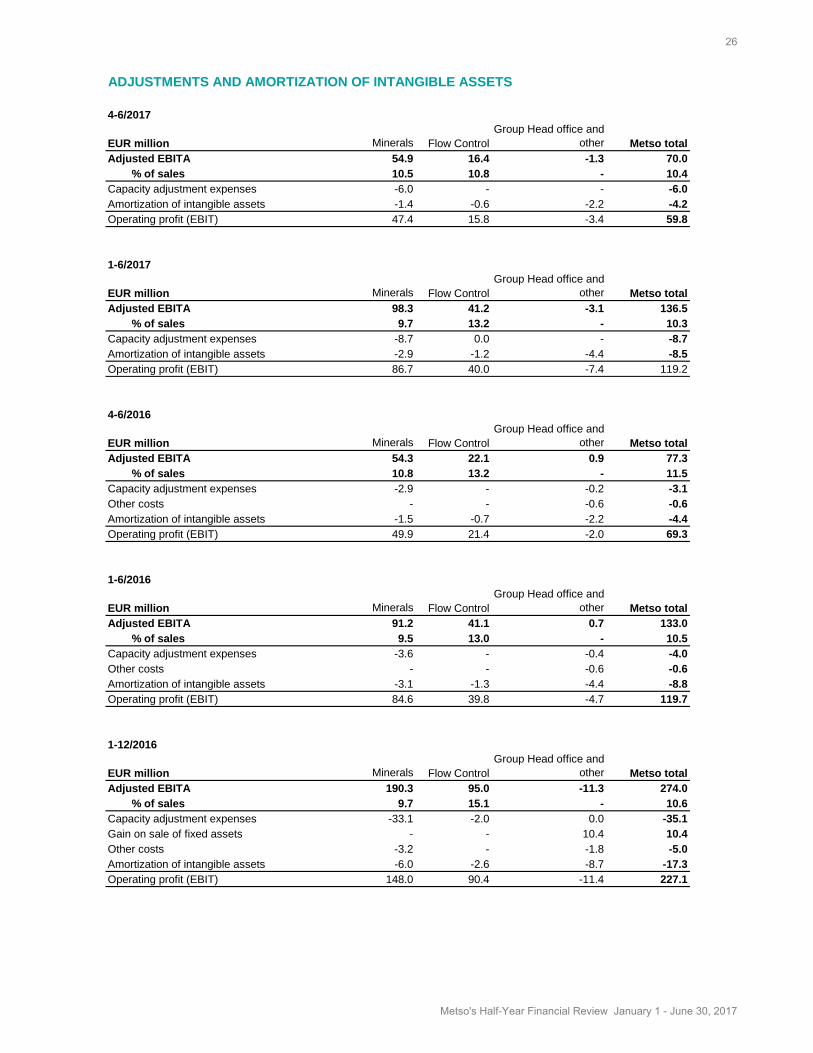
ADJUSTMENTS AND AMORTIZATION OF INTANGIBLE ASSETS
4-6/2017
EUR million Minerals Flow ControlGroup Head office and
other Metso totalAdjusted EBITA 54.9 16.4 -1.3 70.0
% of sales 10.5 10.8 - 10.4Capacity adjustment expenses -6.0 - - -6.0Amortization of intangible assets -1.4 -0.6 -2.2 -4.2Operating profit (EBIT) 47.4 15.8 -3.4 59.8
1-6/2017
EUR million Minerals Flow ControlGroup Head office and
other Metso totalAdjusted EBITA 98.3 41.2 -3.1 136.5
% of sales 9.7 13.2 - 10.3Capacity adjustment expenses -8.7 0.0 - -8.7Amortization of intangible assets -2.9 -1.2 -4.4 -8.5Operating profit (EBIT) 86.7 40.0 -7.4 119.2
4-6/2016
EUR million Minerals Flow ControlGroup Head office and
other Metso totalAdjusted EBITA 54.3 22.1 0.9 77.3
% of sales 10.8 13.2 - 11.5Capacity adjustment expenses -2.9 - -0.2 -3.1Other costs - - -0.6 -0.6Amortization of intangible assets -1.5 -0.7 -2.2 -4.4Operating profit (EBIT) 49.9 21.4 -2.0 69.3
1-6/2016
EUR million Minerals Flow ControlGroup Head office and
other Metso totalAdjusted EBITA 91.2 41.1 0.7 133.0
% of sales 9.5 13.0 - 10.5Capacity adjustment expenses -3.6 - -0.4 -4.0Other costs - - -0.6 -0.6Amortization of intangible assets -3.1 -1.3 -4.4 -8.8Operating profit (EBIT) 84.6 39.8 -4.7 119.7
1-12/2016
EUR million Minerals Flow ControlGroup Head office and
other Metso totalAdjusted EBITA 190.3 95.0 -11.3 274.0
% of sales 9.7 15.1 - 10.6Capacity adjustment expenses -33.1 -2.0 0.0 -35.1Gain on sale of fixed assets - - 10.4 10.4Other costs -3.2 - -1.8 -5.0Amortization of intangible assets -6.0 -2.6 -8.7 -17.3Operating profit (EBIT) 148.0 90.4 -11.4 227.1
26
Metso's Half-Year Financial Review January 1 - June 30, 2017

New standards to be applied: IFRS 15- Revenue from contracts with customers
Metso has continued to assess the impact of the adoption of the IFRS 15 standard. Preparation work to reach readiness to apply the new standard fully retrospectively from the beginning of the financial year 2018 is ongoing. Metso does not expect a significant impact on the timing of revenue recognition nor on the presentation of the balance sheet. The assessment by revenue stream is as follows:
Metso Minerals segment provides standardized equipment deliveries and services to delivered equipment with wear or spare parts as well as customized large scale engineered system and equipment deliveries. Metso Flow Control segment provides process industry flow control solutions with delivery of standardized pumps and valves and services to delivered equipment.
As currently, when Metso provides standardized equipment, valves and pumps, as well as wear or spare parts to customer, revenue will be recognized when control for the goods is transferred, e.g. in general, at the delivery of goods or after commissioning.
With the customized large scale engineered system and equipment deliveries, where the assets produced do not have an alternative use to other clients and Metso has the right to payment for the performance completed, revenue will be recognized over time.
A long-term service agreement might be a separate one or combined with the equipment delivery customer agreement. Metso's service promises will mainly be treated as separate performance obligations, where customer simultaneously receives the benefits provided and thus will be recognized over time when the service are rendered. Short term service agreements will be recognized at the point in time or by invoicing criteria.
Applying over time, Metso will continue to measure the progress using the cost-to cost method, as currently when applying POC method.
As a result of the adoption of the new standard, Metso’s reported sales will be reduced by the amount of late delivery penalties, which will be deducted from sales, instead of being currently expensed. Metso is assessing further its customer contract portfolio and reporting process and will give additional qualitative and quantitative impact estimates in the third quarter 2017 Interim Review and in Financial Statements for 2017.
Reporting Revenue stream Revenue recognition Revenue recognitionsegment IFRS15 IAS18, IAS11MIN Standardized equipment deliveries at a point in time at the delivery or commissioningFLO Valves and pumps deliveries at a point in time at the delivery MIN Engineered system and equipment deliveries over time percentage of completion (POC)MIN Long term service agreements over time percentage of completion (POC)
with wear/spare partsMIN/FLO Short term service agreements at a point in time when service rendered
with wear/spare parts when wear/spare parts delivered
27
Metso's Half-Year Financial Review January 1 - June 30, 2017

Metso’s Financial Reports’ publication dates in 2017
Interim Review for January – September 2017 on October 20
Metso Corporation, Group Head Office, Töölönlahdenkatu 2, PO Box 1220, FIN-00101 Helsinki, Finland Tel. +358 20 484 100 Fax +358 20 484 101 www.metso.com