metsmart flotation methodology - minerality.com.au · ser modificada cambiando los reactivos, o...
TRANSCRIPT
MetSMART Flotation Software & Minerality Services Capability Statement MetSMART y Flotación Qué puede realizar MetSMART con respecto a Flotación? MetSMART, permite al usuario: 1. Dibujar cualquier circuito de flotación en la misma pantalla junto a los circuitos de chancado y molienda. 2. Definir las características exactas de las celdas de flotación en cada uno de los bancos de flotación. 3. Realizar análisis de datos de las tomas de muestras y muestras de laboratorio.
3.1 Calcular los kinetics del mineral basado en los datos de los test de laboratorio. 3.2 Realizar balance de masas en plantas existentes (flujos, densidades, grados de cabeza y análisis size-
by-assay). 4. Realizar calibración de los kinetics y los factores scale-up.
4.1 Calcular kinetics de mineral industrial basado en datos de muestras industriales. 4.2 Calcular los factores scale-up entre laboratorio y condiciones industriales.
5. Definir nuevos grados de alimentación, diferente tamaño de alimentación, y diferentes kinetics y adiciones de agua. La configuración también puede ser cambiada.
6. Simular nuevas condiciones. 7. Ver resultados de una simulación que típicamente incluye el grado y la recuperación de objetos de valor en
cada celda, así como la flotabilidad, la selectividad, las proporciones que flotan rápido y las proporciones que flotan lento. Los resultados incluyen el % de Recuperación Acumulativa y Grado Acumulativo para cada celda del banco.
Utilizando la ecuación Kelsall en la metodología de MetSMART, permite al usuario: • Determinar el área exacta en un banco de flotación donde la flotación no es óptima. Se puede determinar
la razón por la cual, la planta tiene algún problema específico con la recuperación o el grado. • El usuario puede ver si la Ganga se está recuperando a un ritmo más rápido que el material valioso. • Identificar el punto en el que la flotación de material valioso se vuelve más lenta. • El usuario también puede estudiar la relación de la flotación que se produce entre diferentes secciones de
la flotación. ¿Hay alguna sección de la planta de flotación que no esté contribuyendo ventajosamente para el concentrado final?
• Identificar las formas en las cuales el usuario también tiene la capacidad de mejorar la flotabilidad de los objetos de flotación media y lenta.
Por ejemplo, con MetSMART, el usuario puede identificar: 1. Si la ganga y los objetos de valor están flotando a la misma velocidad, la superficie de las partículas debe
ser modificada cambiando los reactivos, o deben pasar nuevamente por re-molienda. 2. Las fracciones rápidas y lentas, y dividirlas. Esto significa que un banco de flotación y sus reactivos son
específicos para la fracción rápida y el siguiente banco es específico para la fracción lenta. Esto resuelve el problema de la flotación simultanea de componentes tanto rápidos como lentos en un solo banco y con un tipo de reactivos.
• Identificar si hay algún componente que se esté acumulando en el circuito de recirculación (por ejemplo, pirita). Si lo hay, entonces el componente debe ser retirado
• Identificar si hay suficiente tiempo de residencia a través del banco de flotación para una recuperación óptima.
2
What can MetSMART do with respect to Flotation? MetSMART enables the user to:
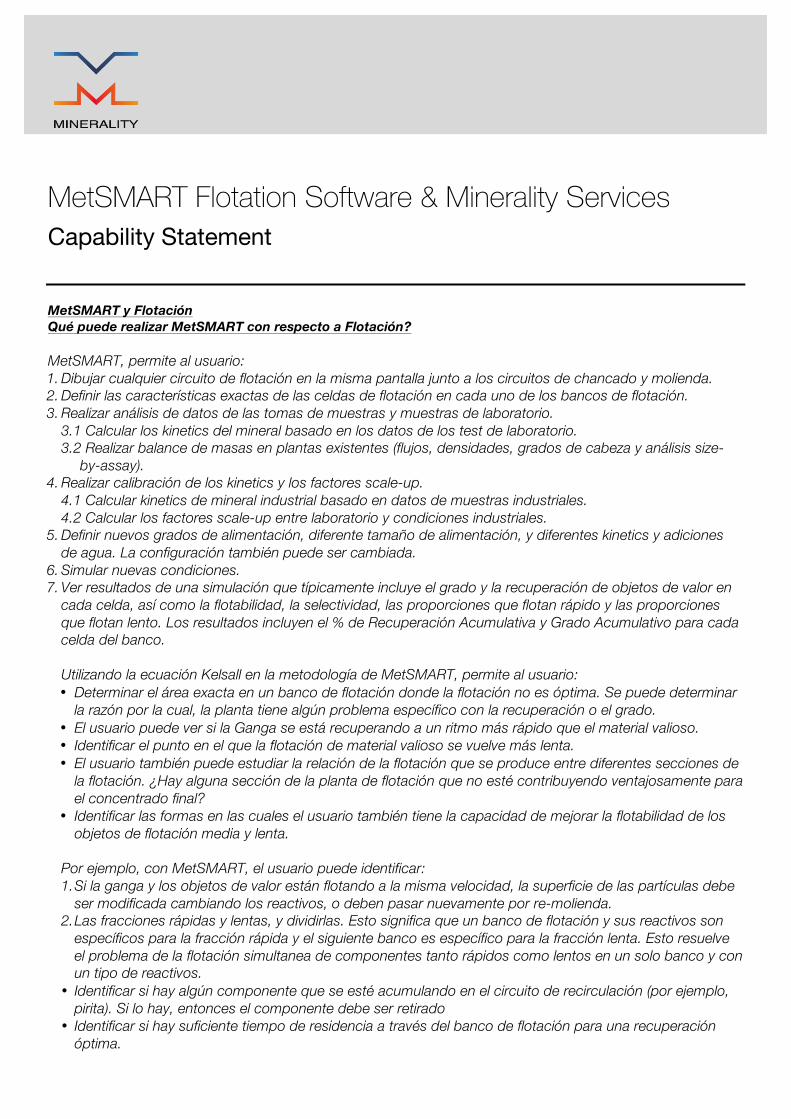
1. Draw any flotation circuit on the same screen as crushing and grinding circuits. 2. Define the exact characteristics of the flotation cells in each flotation bank. 3. Perform data analysis on survey and laboratory samples.
3.1 Calculate ore kinetics based on laboratory test data. 3.2 Perform mass balancing on existing plants (flows, densities, head grades and size-by-assay analysis)
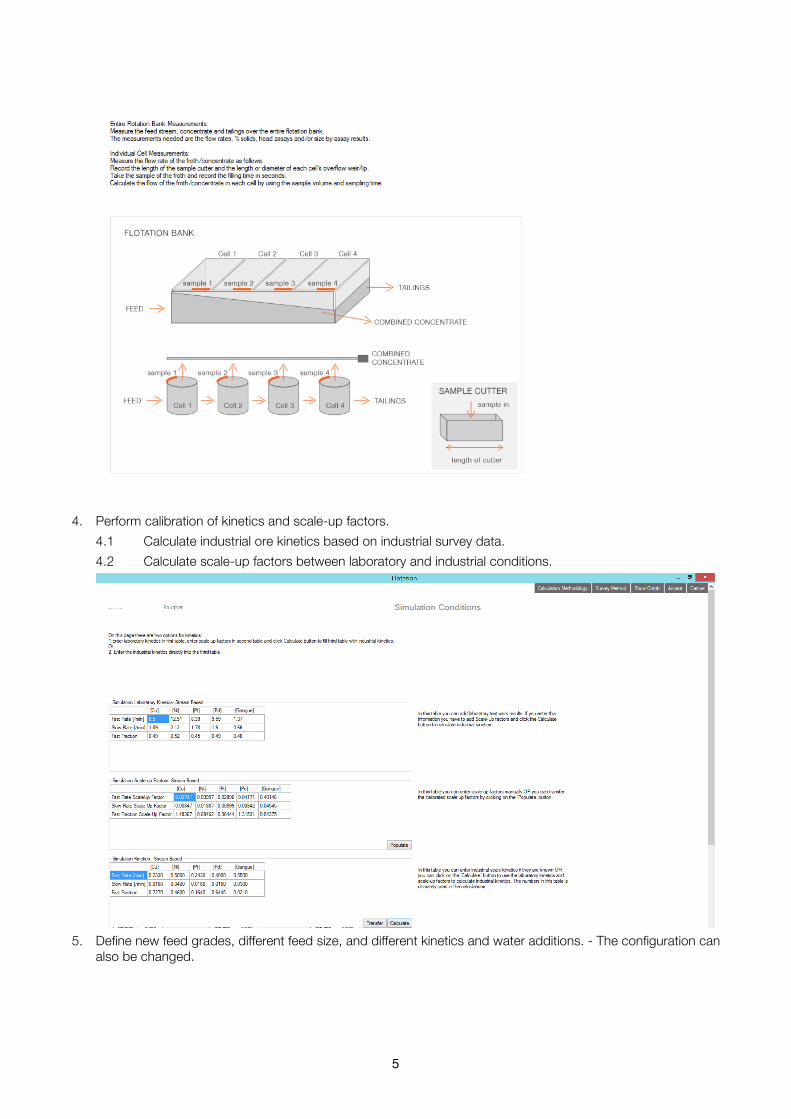
4. Perform calibration of kinetics and scale-up factors. 4.1 Calculate industrial ore kinetics based on industrial survey data. 4.2 Calculate scale-up factors between laboratory and industrial conditions.
5. Define new feed grades, different feed size, and different kinetics and water additions. - The configuration can also be changed.
6. Simulate the new conditions. 7. View simulation results that typically include the grade and recoveries of valuables in each cell, as well as the
floatability, selectivity, fast floating ratios and slow floating ratios. The results include Cumulative % Recovery and Cumulative Grade for each cell in the bank. By interpreting the results the user can: • Pin-point the exact area in a flotation bank where the flotation is underperforming. If the plant has a specific
issue with recovery or grade, then the reason can be identified. • See if Gangue is recovering at a faster rate than the valuable. • Identify the point at which the rate of flotation of valuables slows down too much; • Study the ratio of flotation occurring between different flotation sections. Is there a section of the flotation
plant that is not contributing advantageously to the final concentrate?; • Identify ways to exploit the floatability of medium and slow floating valuables.
For example, with MetSMART, the user can identify:
1. If the Gangue and valuables are floating at the same rate, then the particle surfaces may be modified by changing reagents, or by regrinding;
2. The fast and slow fractions, and split them. This means one flotation bank and its reagents are
specific for the fast fraction and the next bank is specific for the slow fraction. This solves the issue of floating both fast and slow floating components in one bank with one reagent suite;
• Identify if there is a component that is building up in the recirculating circuit (for example, Pyrite). If there is,
then the component must be removed; • Identify if there is insufficient Residence Time across the flotation bank for optimum recovery.
3
What can MetSMART do with respect to Flotation? MetSMART enables the user to:
1. Draw any flotation circuit on the same screen as crushing and grinding circuits.
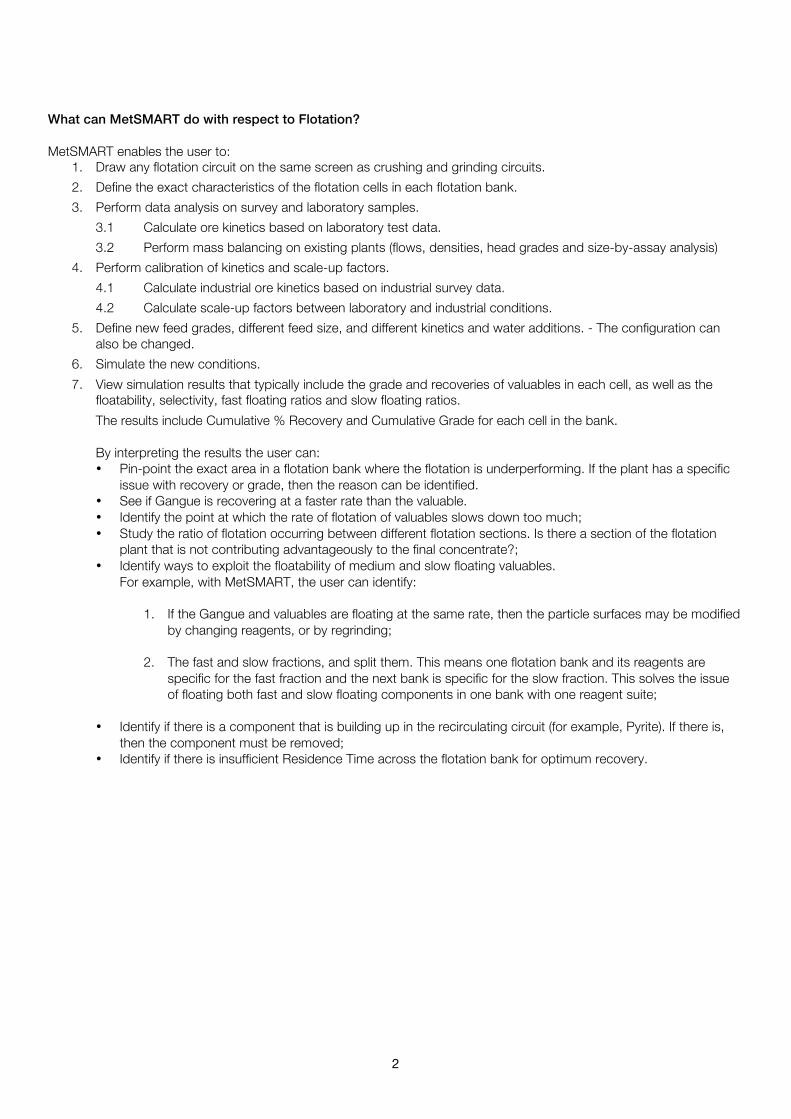
2. Define the exact characteristics of the flotation cells in each flotation bank.
4
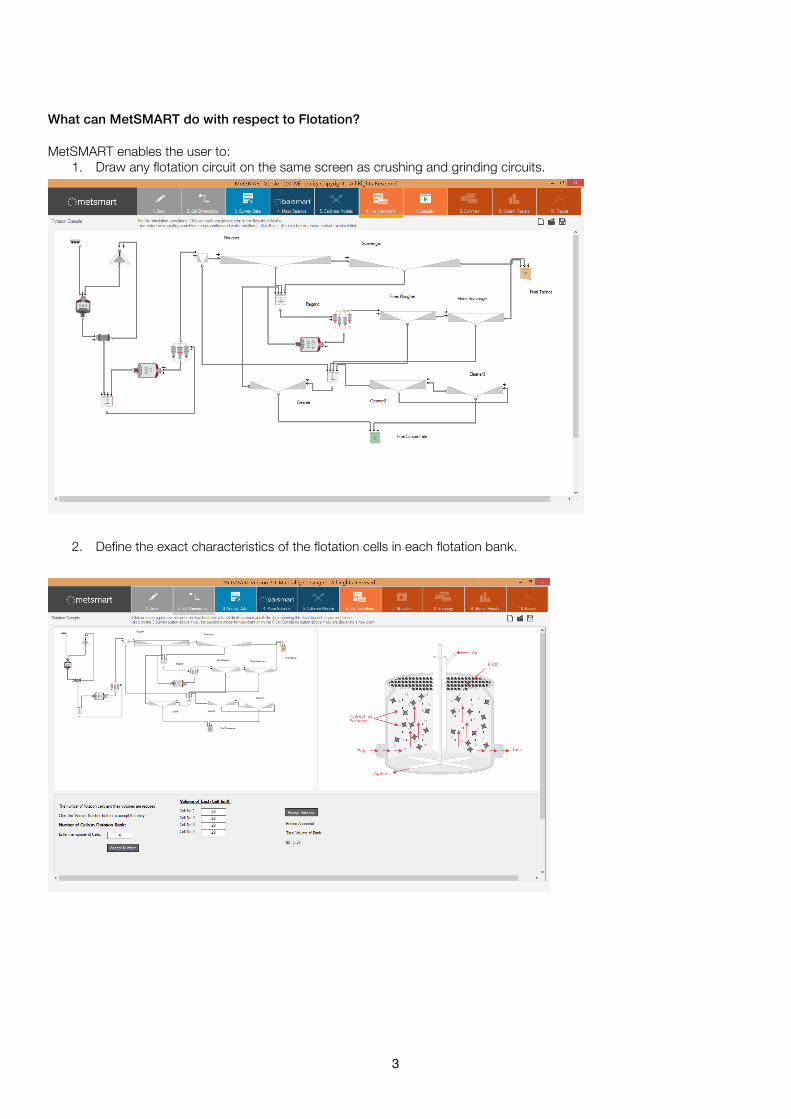
3. Perform data analysis on survey and laboratory samples. 3.1 Calculate ore kinetics based on laboratory test data.
3.2 Perform mass balancing on existing plants (flows, densities, head grades and size-by-assay analysis)
5
4. Perform calibration of kinetics and scale-up factors. 4.1 Calculate industrial ore kinetics based on industrial survey data. 4.2 Calculate scale-up factors between laboratory and industrial conditions.
5. Define new feed grades, different feed size, and different kinetics and water additions. - The configuration can
also be changed.
6
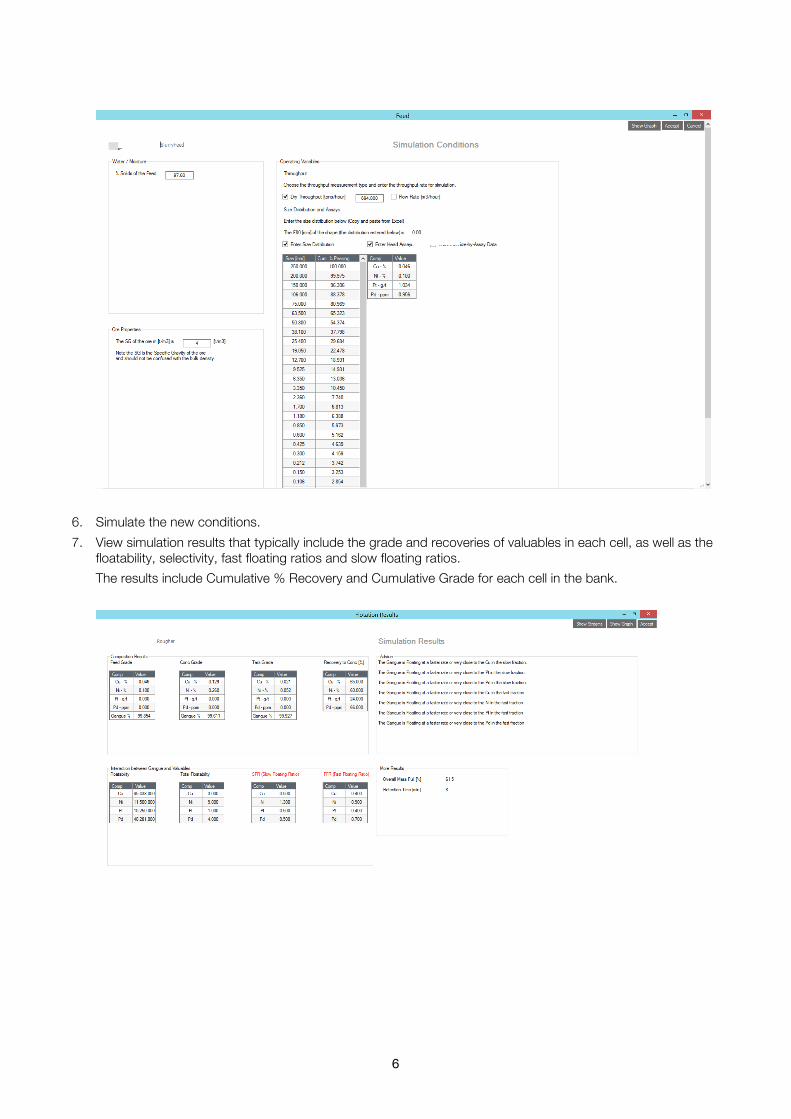
6. Simulate the new conditions. 7. View simulation results that typically include the grade and recoveries of valuables in each cell, as well as the
floatability, selectivity, fast floating ratios and slow floating ratios. The results include Cumulative % Recovery and Cumulative Grade for each cell in the bank.
7
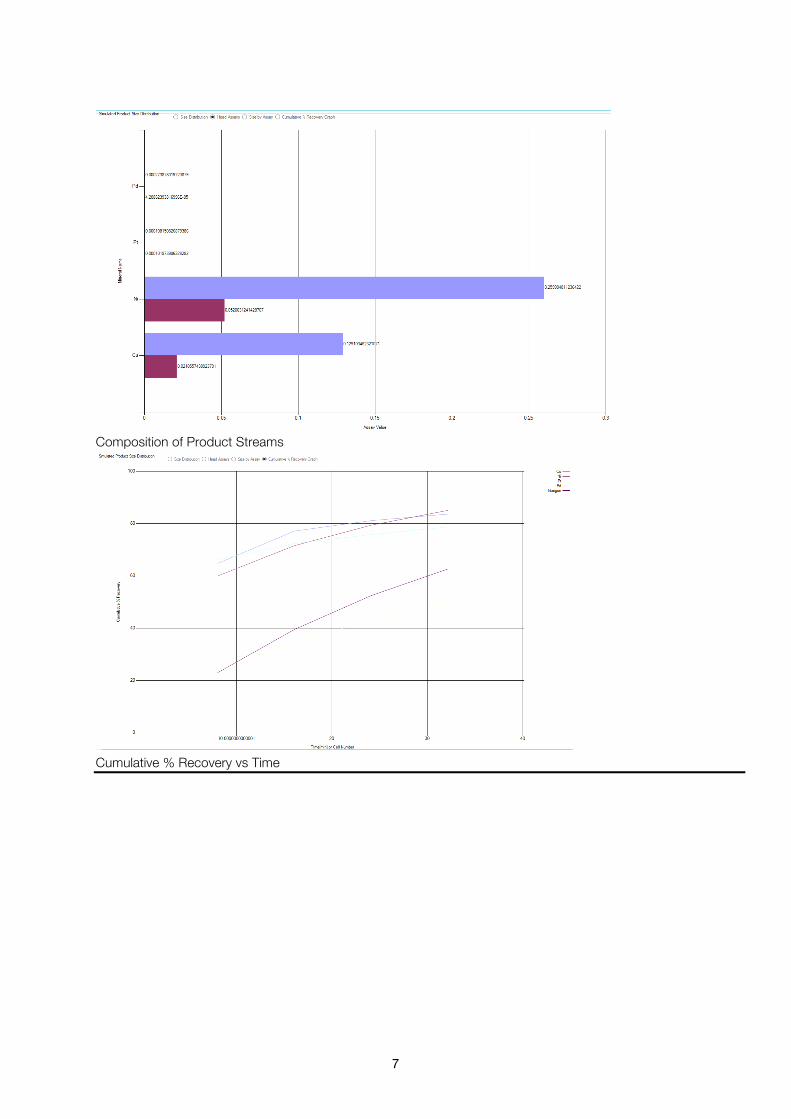
Composition of Product Streams
Cumulative % Recovery vs Time
8
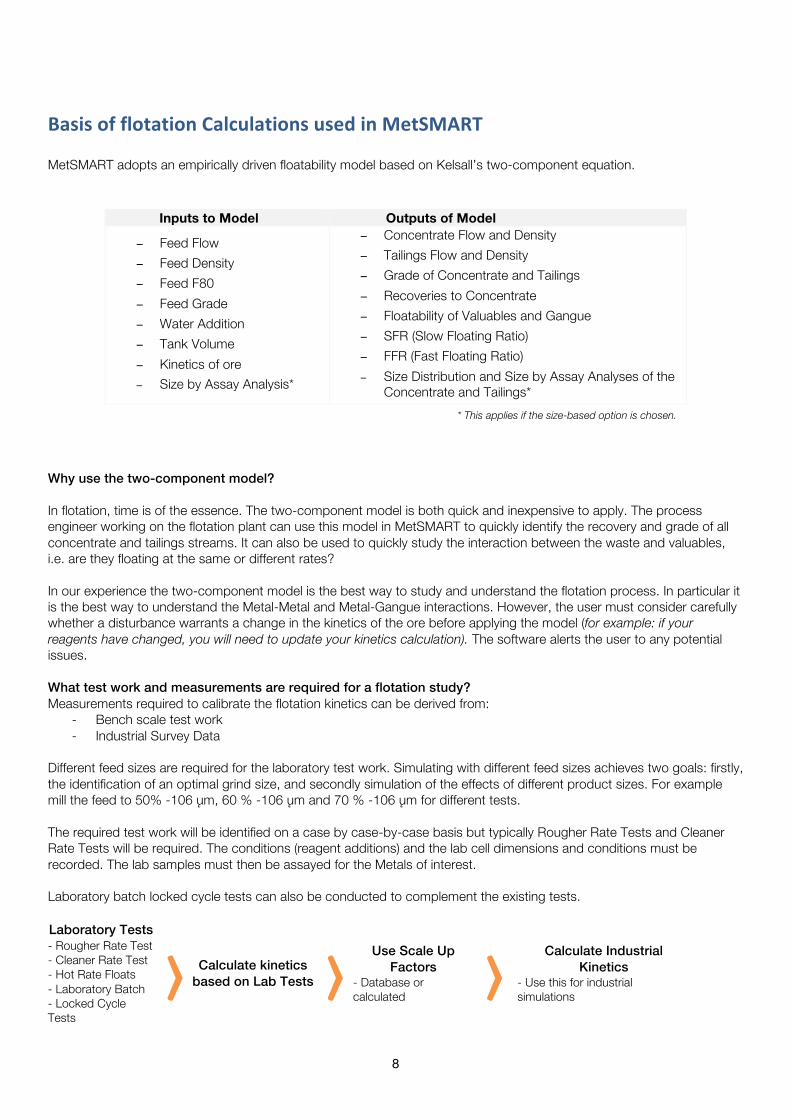
Basis of flotation Calculations used in MetSMART MetSMART adopts an empirically driven floatability model based on Kelsall’s two-component equation.
Inputs to Model Outputs of Model
− Feed Flow − Feed Density − Feed F80 − Feed Grade − Water Addition − Tank Volume − Kinetics of ore − Size by Assay Analysis*
− Concentrate Flow and Density − Tailings Flow and Density − Grade of Concentrate and Tailings − Recoveries to Concentrate − Floatability of Valuables and Gangue − SFR (Slow Floating Ratio) − FFR (Fast Floating Ratio) − Size Distribution and Size by Assay Analyses of the
Concentrate and Tailings* * This applies if the size-based option is chosen.
Why use the two-component model? In flotation, time is of the essence. The two-component model is both quick and inexpensive to apply. The process engineer working on the flotation plant can use this model in MetSMART to quickly identify the recovery and grade of all concentrate and tailings streams. It can also be used to quickly study the interaction between the waste and valuables, i.e. are they floating at the same or different rates? In our experience the two-component model is the best way to study and understand the flotation process. In particular it is the best way to understand the Metal-Metal and Metal-Gangue interactions. However, the user must consider carefully whether a disturbance warrants a change in the kinetics of the ore before applying the model (for example: if your reagents have changed, you will need to update your kinetics calculation). The software alerts the user to any potential issues. What test work and measurements are required for a flotation study? Measurements required to calibrate the flotation kinetics can be derived from:
- Bench scale test work - Industrial Survey Data
Different feed sizes are required for the laboratory test work. Simulating with different feed sizes achieves two goals: firstly, the identification of an optimal grind size, and secondly simulation of the effects of different product sizes. For example mill the feed to 50% -106 ųm, 60 % -106 ųm and 70 % -106 ųm for different tests. The required test work will be identified on a case by case-by-case basis but typically Rougher Rate Tests and Cleaner Rate Tests will be required. The conditions (reagent additions) and the lab cell dimensions and conditions must be recorded. The lab samples must then be assayed for the Metals of interest. Laboratory batch locked cycle tests can also be conducted to complement the existing tests. Laboratory Tests
〉 Calculate kinetics based on Lab Tests 〉
Use Scale Up Factors
- Database or calculated
〉
Calculate Industrial Kinetics
- Use this for industrial simulations
- Rougher Rate Test - Cleaner Rate Test - Hot Rate Floats - Laboratory Batch - Locked Cycle Tests
9
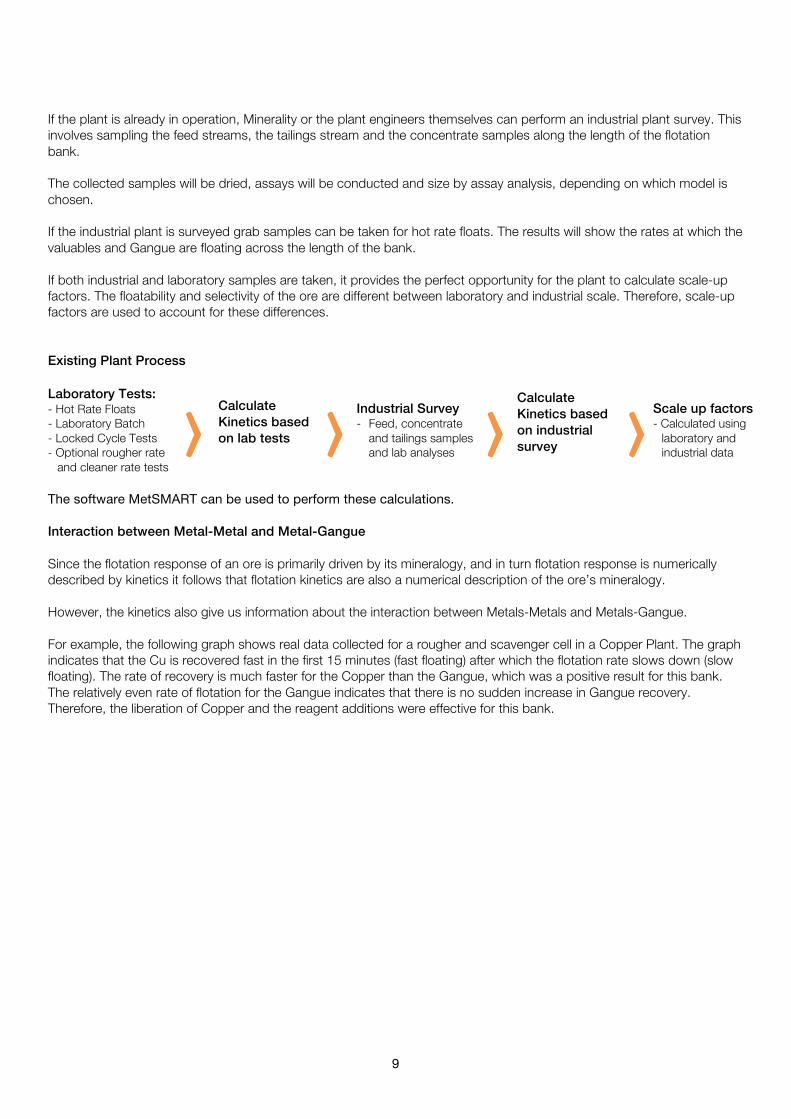
If the plant is already in operation, Minerality or the plant engineers themselves can perform an industrial plant survey. This involves sampling the feed streams, the tailings stream and the concentrate samples along the length of the flotation bank. The collected samples will be dried, assays will be conducted and size by assay analysis, depending on which model is chosen. If the industrial plant is surveyed grab samples can be taken for hot rate floats. The results will show the rates at which the valuables and Gangue are floating across the length of the bank. If both industrial and laboratory samples are taken, it provides the perfect opportunity for the plant to calculate scale-up factors. The floatability and selectivity of the ore are different between laboratory and industrial scale. Therefore, scale-up factors are used to account for these differences. Existing Plant Process Laboratory Tests: - Hot Rate Floats - Laboratory Batch - Locked Cycle Tests - Optional rougher rate and cleaner rate tests
〉
Calculate Kinetics based on lab tests
〉
Industrial Survey - Feed, concentrate and tailings samples and lab analyses
〉
Calculate Kinetics based on industrial survey
〉
Scale up factors - Calculated using laboratory and industrial data
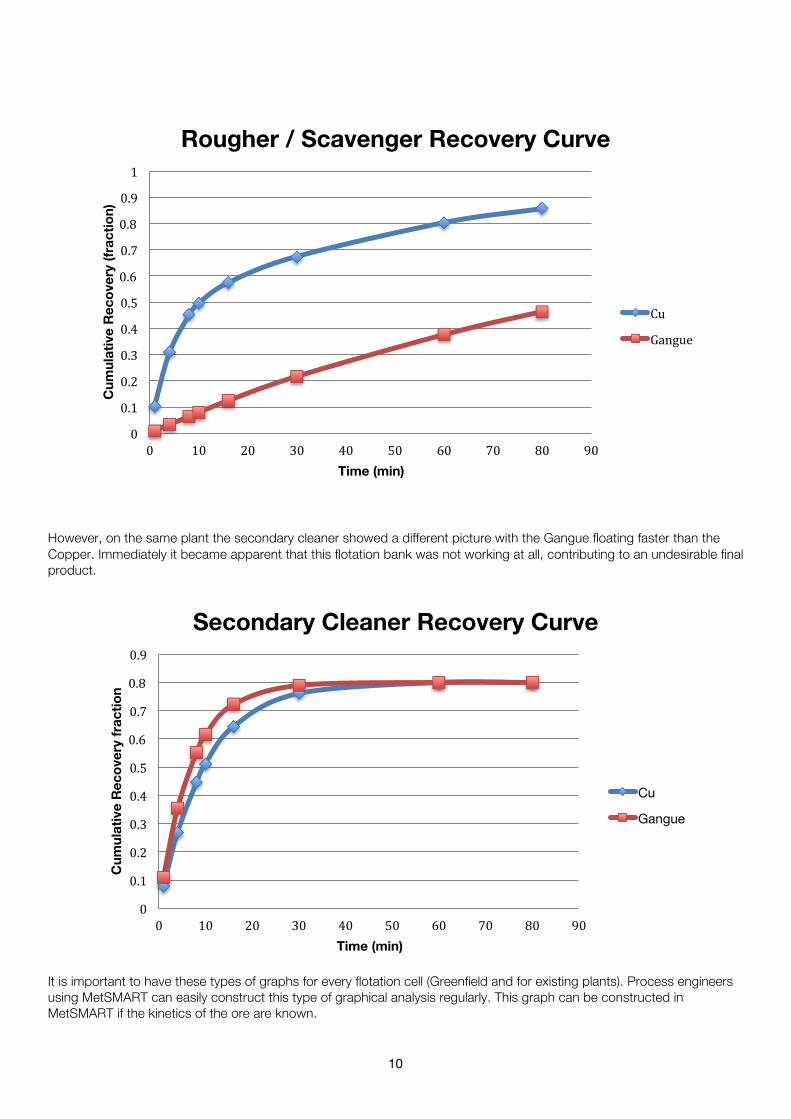
The software MetSMART can be used to perform these calculations. Interaction between Metal-Metal and Metal-Gangue Since the flotation response of an ore is primarily driven by its mineralogy, and in turn flotation response is numerically described by kinetics it follows that flotation kinetics are also a numerical description of the ore’s mineralogy. However, the kinetics also give us information about the interaction between Metals-Metals and Metals-Gangue. For example, the following graph shows real data collected for a rougher and scavenger cell in a Copper Plant. The graph indicates that the Cu is recovered fast in the first 15 minutes (fast floating) after which the flotation rate slows down (slow floating). The rate of recovery is much faster for the Copper than the Gangue, which was a positive result for this bank. The relatively even rate of flotation for the Gangue indicates that there is no sudden increase in Gangue recovery. Therefore, the liberation of Copper and the reagent additions were effective for this bank.
10
However, on the same plant the secondary cleaner showed a different picture with the Gangue floating faster than the Copper. Immediately it became apparent that this flotation bank was not working at all, contributing to an undesirable final product.
It is important to have these types of graphs for every flotation cell (Greenfield and for existing plants). Process engineers using MetSMART can easily construct this type of graphical analysis regularly. This graph can be constructed in MetSMART if the kinetics of the ore are known.
0
0.1
0.2
0.3
0.4
0.5
0.6
0.7
0.8
0.9
1
0 10 20 30 40 50 60 70 80 90
Cum
ulat
ive
Rec
over
y (fr
actio
n)
Time (min)
Rougher / Scavenger Recovery Curve
Cu
Gangue
0
0.1
0.2
0.3
0.4
0.5
0.6
0.7
0.8
0.9
0 10 20 30 40 50 60 70 80 90
Cum
ulat
ive
Rec
over
y fr
actio
n
Time (min)
Secondary Cleaner Recovery Curve
Cu
Gangue
11
The graph is described further in MetSMART by the:
− Selectivity of the valuable (How well does valuable float relative to Gangue?) − Floatability (Product of kinetic variables of major influence) − Slow Floating Ratio (How much faster does the slow floating valuables float relative to the slow floating Gangue) − Fast Floating Ratio (How much faster does the fast floating valuables float relative to the slow fast Gangue)
If in any case the results are out of the ordinary it may indicate a problem. For example, raised values of the fast floating fraction and flotation rate of the Gangue and a decrease in fast floating rate of the valuable may indicate a non-selective froth, in which case it may be as a result of frother overdosing. The only way to pinpoint these issues is by studying the kinetics. Minerality Flotation Studies In addition to MetSMART software, Minerality is also able to conduct flotation studies, or provide assistance with flotation consulting. For a Greenfield study the most efficient plant configuration can be simulated, achieving the required grade and recovery. The volume of the cells will be provided as well as the dimensions of regrind mill or stirred milling, if regrinding is required.
Note that each ore body has different mineralogy and therefore different behaviors in the flotation process. Therefore, each case will have a slightly different approach when it comes to design and optimization and the use of MetSMART software. However, this document shows the standard method Minerality uses. This methodology is adjusted for each case.
Please contact us at [email protected] for a more specific analysis of your project.