metropolitan opportunity series job sprawl stalls · elizabeth kneebone “in the wake of the great...
TRANSCRIPT

BROOKINGS | April 2013 1
METROPOLITAN OPPORTUNITY SERIES
Job Sprawl Stalls: The Great Recession and Metropolitan Employment Location Elizabeth Kneebone
“ In the wake
of the Great
Recession,
policymakers
and regional
leaders have the
opportunity to
make strategic
decisions
about how they
will pursue
metropolitan
growth.”
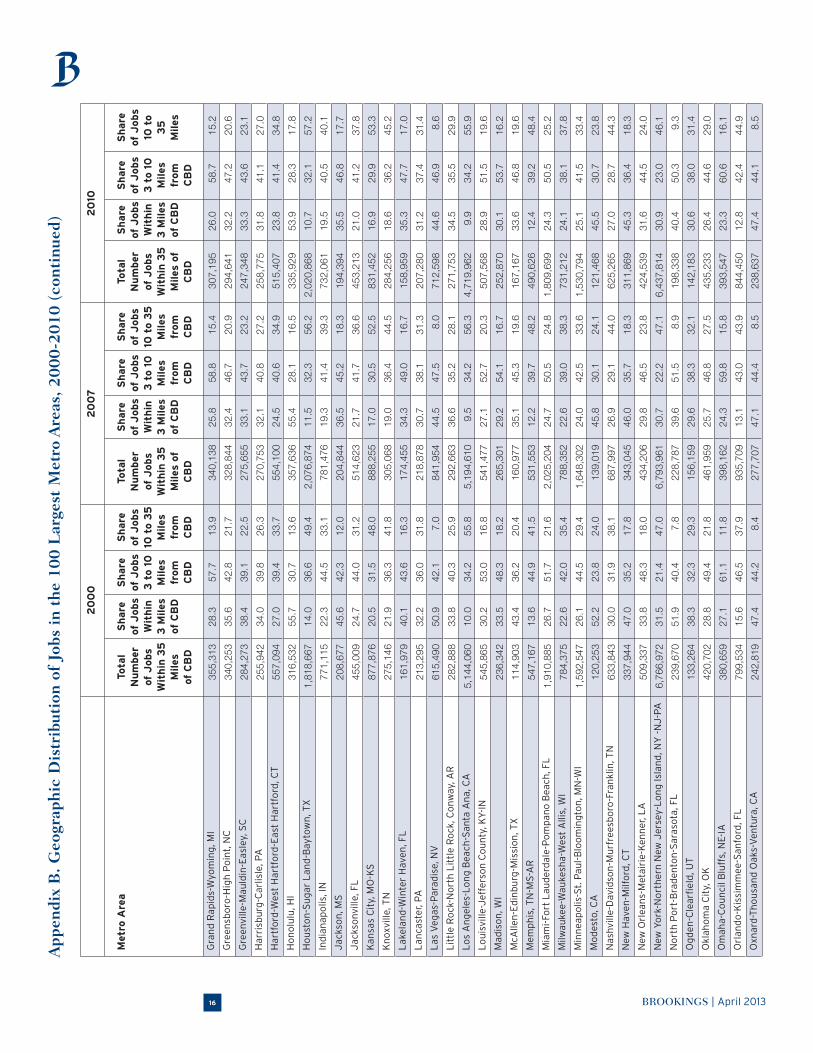
An analysis of the location of private-sector employment within 35 miles of downtown in the nation’s 100 largest metropolitan areas from 2007 to 2010, and across the 2000s, finds:
n �Steep�employment�losses�following�the�Great�Recession�stalled�the�steady�decentraliza-tion�of�jobs�that�characterized�the�early�to�mid-2000s.�After dropping two percentage points from 2000 to 2007, the share of metropolitan jobs within three miles of downtown sta-bilized from 2007 to 2010. However, by 2010 nearly twice the share of jobs was located at least 10 miles away from downtown (43 percent) as within three miles of downtown (23 percent).
n Job�losses�in�industries�hit�hardest�by�the�downturn,�including�construction�and�manu-facturing,�helped�check�employment�decentralization�in�the�late�2000s. Together, construction, manufacturing, and retail—each among the most decentralized of major indus-tries—accounted for almost 60 percent of all job losses between 2007 and 2010, with half of those losses occurring at least 10 miles from downtown.
n �In�all�but�nine�of�the�100�largest�metro�areas,�the�share�of�jobs�located�within�three�miles�of�downtown�declined�during�the�2000s.�Only Washington, D.C. experienced an increase in both the number and share of jobs located in the urban core during the 2000s. At the same time, the share of jobs at least 10 miles from downtown rose in 85 regions between 2000 and 2010.
n A�metro�area’s�total�employment—and�policy�and�planning�decisions�around�land�use,�economic�development,�and�zoning—help�shape�the�location�of�its�jobs. Employment is more decentralized in metro areas with at least 500,000 jobs. But even large metro areas with high degrees of job decentralization like Chicago and Detroit concentrate many of their jobs in dense locations outside the urban core.
In the wake of the Great Recession, policymakers and regional leaders have the opportunity to make strategic decisions about how they will pursue metropolitan growth. If the next period of economic expansion reinforces low-density, diffuse growth in metropolitan America, it will be that much harder for metro areas to achieve sustainable and inclusive growth over the long term.
Introduction
In 2009, “Job Sprawl Revisited: The Changing Geography of Metropolitan Employment” docu-mented the widespread decentralization of jobs in metropolitan America.1 That analysis found that, between 1998 and 2006, employment—whether growing or declining—steadily moved farther away from downtowns across most major metro areas, in almost every major industry,
and especially toward suburban communities at least 10 miles from the downtown. This shift occurred

BROOKINGS | April 20132
continuously—as the economy boomed in the late 1990s, as it turned down in the early 2000s, and then as it moved through a mid-decade recovery.
Yet that analysis left off shortly before the nation entered the worst recession since the Great Depression, which led to the loss of nearly 9 million jobs nationally.2 Though the first economic down-turn of the decade did not stall the outward movement of metropolitan jobs, the second, much more disruptive, recession of the decade may very well have changed prevailing job location patterns.
The changing location of employment within a metro area intersects with a range of policy issues—from transportation to workforce development to regional innovation—that affect a region’s long-term health, prosperity, and social inclusion. A number of factors can drive the decentralization of employ-ment, which is neither an inherently positive nor negative trend. Suburban development can take place in ways that foster dense, mixed-use, and regionally-connected job centers.3 Or it may occur in less dense and less accessible ways, raising challenges like strained infrastructure, increased energy consumption, greater spatial mismatches between the location of jobs and low-income and minority residents. In addition, because low-density job development can be difficult to effectively serve with transit, job sprawl can limit transportation options, increasing commute times and congestion.4
Understanding the geography of metropolitan employment will prove particularly important in the emerging recovery, as policymakers and regional leaders work to grow jobs and connect residents to economic opportunity. This brief assesses recent trends in employment location in 2000, 2007, and 2010, documenting the impact of the Great Recession on the geographic distribution of metropolitan jobs during the 2000s.
Methods
This brief builds on and updates the methods used in 2009’s “Job Sprawl Revisited” to ana-lyze employment location trends. It uses the Census Bureau’s ZIP Business Patterns data on private-sector employment from 2000, 2007, and 2010 (the most recent year of data available).5 It employs GIS software to allocate ZIP code employment data to three distance
bands: within three miles of a central business district (CBD), three to 10 miles away from a CBD, and 10 to 35 miles from a CBD.6
Two methodological differences exist between this assessment and the 2009 analysis that affect comparability. First, the 2009 analysis focused on 98 of the 100 largest metro areas based on 2005 employment totals. The current analysis considers the 100 largest metro areas based on population in 2010. While there is a high degree of overlap in the two lists, differences exist.7
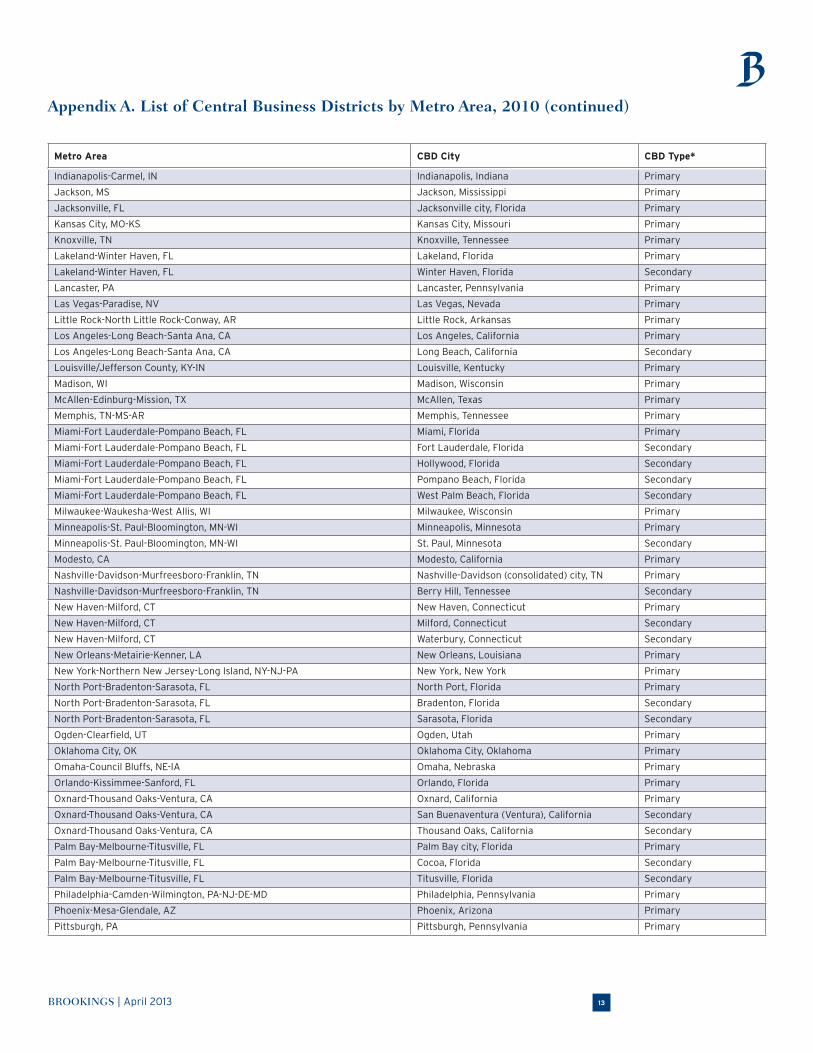
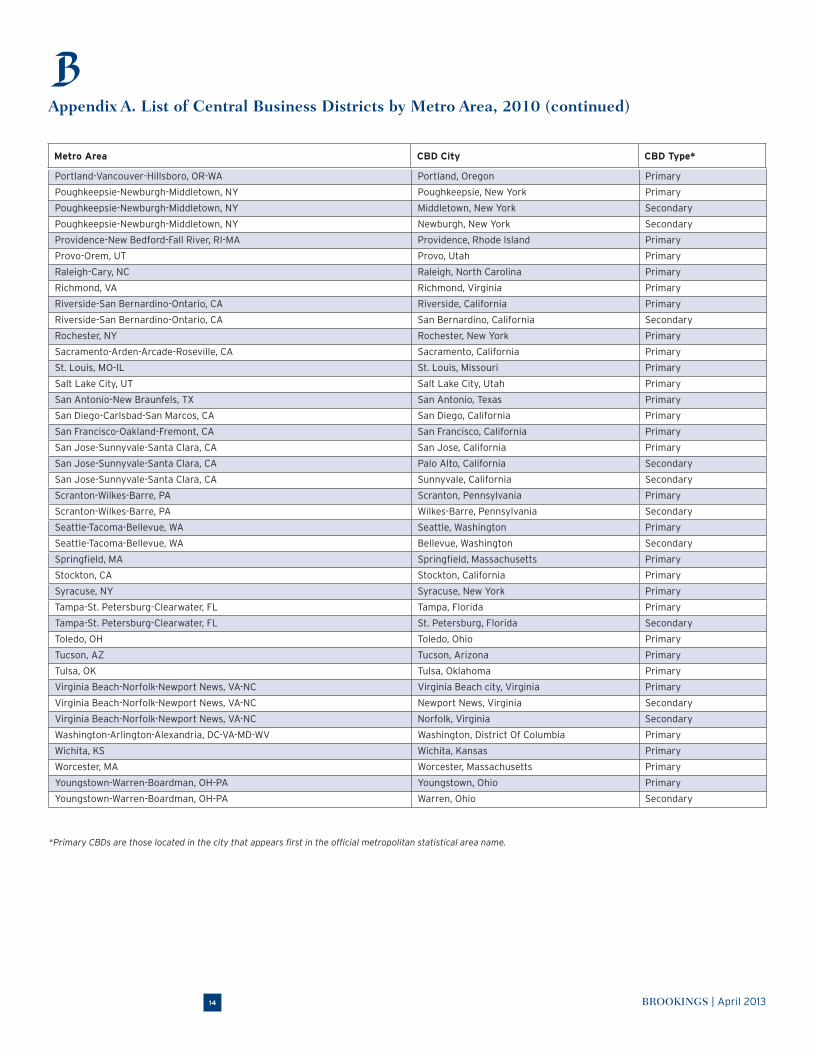
Second, the selection process for CBDs has been expanded in this analysis to more fully reflect metro areas that contain multiple employment centers. As with the previous analysis, 1982 CBDs (des-ignated by the Census of Retail Trade) serve as the basis for the selection (Box 1). To designate CBDs for this analysis, a number of comparisons were made based on census tract-level job density and total employment estimates in 2010.8 For first-named cities in the official metropolitan statistical area name, if the densest employment tract in 2010 overlapped with the 1982 CBD, the equivalent of the 1982 CBD was used.9 If the densest tract in 2010 did not overlap with the 1982 CBD and had higher employ-ment totals than the historical CBD, the densest tract in 2010 was selected as the CBD for this analysis. However, if the 2010 tract contained fewer jobs, the 1982 CBD was maintained.
The same process was used to determine CBDs in any other city within the metro area that had an official CBD in 1982.10 Once secondary CBDs were determined, total employment within those CBDs was compared to the primary CBD. If the number of jobs in the secondary CBD was at least one-third of the amount located in the primary CBD in 2010, the secondary CBD was also included as a “down-town” in the analysis. (See Appendix A for a full list of CBDs included in this assessment.)

BROOKINGS | April 2013 3
A. Steep employment losses following the Great Recession stalled the steady decentral-ization of jobs that characterized the early to mid-2000s. The late 2000s brought a protracted economic downturn and widespread job losses that touched almost every major metro area in the United States. The worst recession since the Great Depression and the weak recovery that followed caused the nation’s 100 largest metro areas to shed more than 5.8 million jobs within 35 miles of their downtowns from 2007 to 2010. Employment declined through-out these metro areas, from the urban core to outlying suburbs, but losses were not spread evenly (Table 1). The outer ring—more than 10 miles away from a CBD—lost jobs at a faster rate than the middle (between three and 10 miles) and inner (within three miles) rings. In fact, owing in part to the suburban-led nature of the housing market collapse and the downturn that followed, 45 percent of employment losses from 2007 to 2010 occurred more than 10 miles away from downtown.
The Great Recession thus stalled the steady decentralization of metropolitan employment that marked much of the 2000s. Between 2000 and 2007, the share of jobs located more than 10 miles from downtown consistently grew, as the outer ring added employment at four times the rate of the middle ring, while the number of jobs located within three miles of a CBD actually fell. However, the job losses of the late 2000s effectively halted this trend, leaving the overall distribution of employment
Box 1. A Note about 1982 Central Business Districts
The U.S. Census Bureau last identified Central Business Districts based on the 1982 Census of Retail Trade, after which the program was discontinued. The Census Bureau defined a CBD as “an area of very high land valuation characterized by a high concentration of retail businesses, service businesses, offices, theaters, and hotels, and by a very high traffic flow,” which could be comprised of one or multiple census tracts.11 Though dated, the 1982 CBDs represent the last systematic identification of business districts at the national scale. Furthermore, the 1982 CBDs continue to exhibit significant overlap with the densest job centers in the nation’s major metro areas. Of the 100 metro areas in this analysis, 91 contained a 1982 CBD that overlapped with the highest job-density census tract in 2010. Nine (9) contained a 1982 CBD that coincided with the second-densest tract, which in each case had higher job totals than the first-ranked tract.
Moreover, the continued relevance of the 1982 CBDs is apparent in the expanded list of downtowns used in this analysis. The 2009 paper limited potential downtowns to only places that appeared in the metropolitan area name, contained a 1982 CBD, and had at least half the number of jobs as the primary CBD. This analysis removes the name restriction and allows a place with a 1982 CBD to be a potential secondary job hub, as long as it contains at least one-third the number of jobs located in the primary CBD. Ultimately, the 2009 analysis identified 105 CBDs in 98 metro areas, while this analysis identifies 136 CBDs in 100 metro areas. To verify that this list of CBDs captures significant secondary job hubs in 2010, the selection process was run again, removing the 1982 CBD requirement. Tracts that were at least as dense as the primary CBD and contained at least one-third the jobs were considered. There were nine tracts in eight metro areas that met these criteria and were not directly adjacent to the 1982-identified CBD. All of these tracts fell within the primary city: seven fell within the three miles of the official CBD, and two within the 10 mile ring. None contained more jobs than the 1982-identified CBD. Thus, the 1982 CBDs continue to provide a robust baseline for selecting significant job centers across the nation’s largest metropolitan areas.
Table�1.�Employment�Distribution�Within�35�Miles�of�a�Central�Business�District,�100�Metro�Areas,�2000�to�2010
Number of Jobs� 2000� 2007� 2010� 2000�to�2007� 2007�to�2010� 2000�to�2010
Total�Jobs 76,252,828 79,071,521 73,247,962 3.7% -7.4% -3.9%Within 3 Miles 18,698,287 17,907,472 16,752,320 -4.2% -6.5% -10.4%3 to 10 Miles 26,369,343 26,985,109 24,948,689 2.3% -7.5% -5.4%10 to 35 Miles 31,185,198 34,178,939 31,546,954 9.6% -7.7% 1.2%
Source: Brookings Institution analysis of ZIP Business Patterns data

BROOKINGS | April 20134
relatively unchanged between 2007 and 2010 (Figure 1). The outsized impact of the recession on the outer ring led to a slight drop in the share of jobs located more than 10 miles away from downtown (-0.2 percentage points). At the same time, the middle ring also experienced a very small decline in job share (-0.1 percentage points), while the urban core exhibited a modest uptick (+0.2 percentage points) because it lost jobs slightly more slowly.
Even with these late-decade trends, by 2010 jobs remained markedly more decentralized than in 2000. In 2010, more than three quarters of jobs within 35 miles of a downtown in the nation’s 100 largest metro areas located outside of the urban core. Roughly 17 million jobs fell within three miles of CBD (22.9 percent), while almost twice that number—31.5 million—located more than 10 miles from downtown (43.1 percent).
B. Job losses in industries hit hardest by the downturn, including construction and manufacturing, helped check employment decentralization in the late 2000s.The early to mid-2000s saw employment decentralize in nearly every major industry as the share of jobs in urban cores declined and the share in the outer ring grew. However, as the housing-led down-turn deepened and spread, job losses in almost every major industry slowed that steady trend.Construction, manufacturing, and retail were among the industries hardest hit by job losses following the Great Recession. Together, those three industries accounted for 60 percent of the decline in total employment within 35 miles of downtown between 2007 and 2010.12 They were also among the most decentralized industries, locating roughly half of their jobs more than 10 miles from downtown in 2007 (Figure 2). As a result, roughly two-thirds of job losses in the outer ring of metropolitan areas came in construction, manufacturing, and retail. The collapse of the housing market also caused the real estate and finance industries—both of which had decentralized at a rapid pace earlier in the decade—to shed jobs at a faster-than-average rate, regardless of location. Amid these employment losses, jobs in these industries stopped their steady march outward in metropolitan areas. The share of construction, real estate, and finance jobs more than 10 miles from downtown dropped slightly between 2007 and 2010 (0.6 percentage points or less), while increasing slightly for manufacturing and retail (0.2 percentage points each).
Figure�1.�Change�in�the�Geographic�Distribution�of�Jobs�Within�35�Miles�of�a�Central�Business�District,�100�Metro�Areas
Source: Brookings Institution analysis of ZIP Business Patterns data
- 5.0 10.0 15.0 20.0 25.0Percent
30.0 35.0 40.0 45.0 50.0
Within 3 Miles
3 to 10 Miles
10 to 35 Miles
201020072000

BROOKINGS | April 2013 5
At the same time, as almost every other major industry shed employment, the health care and social assistance and educational services industries experienced notable job growth between 2007 and 2010, with increases shared across the three rings. The recession-era gains in health care and social assistance employment meant that jobs in that industry grew to account for roughly 17 percent of all jobs in the urban core by 2010—the largest share among major industry categories. However, those jobs continued to grow faster farther away from downtown. From 2007 to 2010, outer-ring health care and social assistance employment grew by 8 percent, versus 4 percent near downtown. In contrast, jobs in educational services grew slightly faster in the urban core than in other metropolitan locations toward the end of the decade. Still, longer-running trends meant that educational services joined 16 other major industries that ended the 2000s more decentralized than when the decade began.
Together these industry dynamics helped contribute to an overall slowdown in job decentralization during the late 2000s. Ultimately, industry-specific losses and gains between 2007 and 2010 served to pause, but not reverse, the longer-running trend.
C. In all but nine of the 100 largest metro areas, the share of jobs located within three miles of downtown declined during the 2000s.Given the depth and length of the Great Recession, nearly every major metro area suffered job losses in the late 2000s. Between 2007 and 2010, 97 of the nation’s 100 largest metro areas lost employ-ment within 35 miles of downtown.13
In many metro areas, these job losses changed the trajectory of employment location. Between 2000 and 2007, the share of jobs near downtowns declined in 95 of the 100 largest metro areas. But between 2007 and 2010, that share increased in more than half (54) of the nation’s largest metro areas (Table 2). However, in only four of those regions did the absolute number of jobs located in
Figure�2.�Job�Location�and�Employment�Change�for�Selected�Industries�within�35�Miles�of�Downtown,�100�Metro�Areas,�2007�to�2010
Source: Brookings Institution analysis of ZIP Business Patterns data
-40 -30 -20 -10 0 10 20 30 40 50 60
Educational Services
Health Care and Social Assistance
Retail Trade
Finance and Insurance
Real Estate, Rental, and Leasing
Manufacturing
Construction
Sel
ect
Indu
stry
Percent
Share of Jobs More Than 10 Miles from Downtown, 2007 Job Loss, 2007 to 2010

BROOKINGS | April 20136
the urban core actually grow: Austin, Charleston, Cincinnati, and New Orleans. Of these four regions, Austin was the only one that did not lose jobs overall during this time period. In the other 50 metro areas, the share of jobs near downtown increased because that ring lost jobs at a slower rate than the middle and outer employment rings.
Even with these recession-related changes, 91 metro areas ended the decade with a lower share of jobs within three miles of downtown than in 2000 and two (Detroit and San Francisco) remained unchanged. Ultimately, the period following the downturn reversed the longer-running downward trend in urban core job share in just three metro areas. Between 2000 and 2007, Chicago, Oxnard, and Washington, D.C. each experienced declines in the share of jobs located within three miles of a CBD, but by 2010 had more than reversed those losses. These regions joined Milwaukee, where urban core job share held steady in the early 2000s, and Boston, Little Rock, and San Jose, where the share of jobs in the urban core had increased even before the Great Recession began. However, almost all of these regions (with the exception of Washington, D.C.) experienced net job losses over the course of the decade, with the increase in urban core job share occurring as the inner ring shed jobs at a slower rate than elsewhere.
Notwithstanding the re-centralization of employment in a few places, job sprawl was the dominant metropolitan trend across the 2000s, especially in the West and South. Between 2007 and 2010, 56 metro areas experienced an uptick in outer-ring job share, led by regions including Cape Coral, Little Rock, and San Antonio, which shed jobs following the downturn, as well as El Paso, which managed to add jobs during this time period (Table 2). On the whole, the share of jobs in the outer ring increased in 85 of the nation’s largest metro areas from 2000 to 2010. Almost one-third of the nation’s largest metro areas (31) saw that share grow at more than twice the average rate (+2.2 percentage points), with Phoenix posting an increase of almost 11 percentage points (Table 3). Nine of the ten largest increases in outer-ring job share occurred in the South and West. With many jobs in fast-growing industries like construction, retail, and administrative support services, Phoenix, Oklahoma City, and Orlando, as well as the Texas metro areas of San Antonio, Houston, and Austin, each added jobs overall during the 2000s, particularly in the outer ring. Even employment losses following the downturn did not dampen decentralization in these metro areas, as each continued to see increases in outer-ring job shares between 2007 and 2010. In contrast, Dallas, Indianapolis, Memphis, and Jacksonville experi-enced a decline in total employment over the course of the decade, but gained jobs in the outer ring while losing them in closer-in places.
Table�2.�Metro�Areas�with�the�Largest�Increases�in�Urban�Core�and�Outer-Ring�Job�Share,�2007�to�2010
� Largest�Increases�in�Share�of�Jobs�within� Largest�Increases�in�Share�of�Jobs�More�Than��
� 3�Miles�of�Downtown�� 10�Miles�from�Downtown�
Chattanooga, TN-GA 2.5 Cape Coral-Fort Myers, FL 3.0New Orleans-Metairie-Kenner, LA 1.8 Little Rock-North Little Rock-Conway, AR 1.8Louisville/Jefferson County, KY-IN 1.8 San Antonio-New Braunfels, TX 1.7Charleston-North Charleston-Summerville, SC 1.7 Provo-Orem, UT 1.7Cincinnati-Middletown, OH-KY-IN 1.6 El Paso, TX 1.6Chicago-Joliet-Naperville, IL-IN-WI 1.6 Phoenix-Mesa-Glendale, AZ 1.5San Jose-Sunnyvale-Santa Clara, CA 1.5 Oklahoma City, OK 1.5Milwaukee-Waukesha-West Allis, WI 1.5 Charlotte-Gastonia-Rock Hill, NC-SC 1.5Seattle-Tacoma-Bellevue, WA 1.3 Honolulu, HI 1.3Austin-Round Rock-San Marcos, TX 1.3 Birmingham-Hoover, AL 1.3
Source: Brookings Institution analysis of ZIP Business Patterns data

BROOKINGS | April 2013 7
D. A metro area’s total employment—and policy and planning decisions around land use, economic development, and zoning—help shape the location of its jobs.A number of factors help determine where jobs locate with a region. As demonstrated by abrupt changes in employment levels following the Great Recession, the number of jobs—and whether that number is growing or declining—helps shape patterns and trends in the geographic distribution of employment. In fact, the number of jobs that a region contains matters more to its degree of employ-ment decentralization than the actual geographic size of a metro area.
Table�3.�Metro�Areas�with�the�Largest�Increases�in�Outer-Ring�Job�Share,�2000�to�2010
� � 2000�to�2010
� �Within�3�Miles�� �3�to�10�Miles�� �10�to�35�Miles�
Phoenix-Mesa-Glendale, AZ -6.8 -4.0 10.8San Antonio-New Braunfels, TX -5.4 -4.0 9.4Austin-Round Rock-San Marcos, TX -2.7 -5.2 7.9Houston-Sugar Land-Baytown, TX -3.3 -4.5 7.8Dallas-Fort Worth-Arlington, TX -2.6 -5.1 7.7Oklahoma City, OK -2.4 -4.8 7.2Orlando-Kissimmee-Sanford, FL -2.8 -4.1 7.0Indianapolis-Carmel, IN -2.9 -4.0 6.9Memphis, TN-MS-AR -1.2 -5.6 6.8Jacksonville, FL -3.8 -2.8 6.6
Source: Brookings Institution analysis of ZIP Business Patterns data
Map�1.�Share�of�Jobs�10�to�35�Miles�from�Downtown,�100�Metro�Areas,�2010
Source: Brookings Institution analysis of ZIP Business Patterns data
Map 1. Share of Jobs 10 to 35 Miles from Downtown, 100 Metro Areas, 2010
Source: Brookings Institution analysis of ZIP Business Patterns data
4.2% - 20.0%
20.1% - 30.0%
30.1% - 45.0%
45.1% - 77.4%
Map 1. Share of Jobs 10 to 35 Miles from Downtown, 100 Metro Areas, 2010
Source: Brookings Institution analysis of ZIP Business Patterns data
4.2% - 20.0%
20.1% - 30.0%
30.1% - 45.0%
45.1% - 77.4%

BROOKINGS | April 20138
In 2010, metro areas in the manufacturing belt that runs through the Midwest and Northeast exhibited some of the highest shares of jobs located more than 10 miles from downtown, though each major census region contains metro areas with above-average outer-ring employment shares (Map 1). In part, the industry mix of these manufacturing hubs may account for this larger regional pattern, but the Midwest and Northeast also contain many of the nation’s largest employment hubs. In gen-eral, the more jobs a metro area has, the more decentralized those jobs tend to be. On average, metro areas that contain fewer than 500,000 jobs have 30 percent of jobs in the urban core, outstripping the outer-ring job share by almost 6 percentage points (Table 4). In contrast, the 42 metro areas with more than 500,000 jobs (which are home to 78 percent of all jobs within 35 miles of a downtown in the 100 largest metro areas) locate an average of just 21 percent of jobs in the urban core, and more than 48 percent of jobs at least 10 miles from downtown. Notably, employment size matters much more than physical size, which is only weakly related to measures of decentralization.14
Among larger employment centers, three of the five most decentralized metro areas are Midwestern regions with a history of manufacturing (Table 5). Detroit leads the list, with over 77 percent of jobs located in the outer ring, with Chicago a distant second at 67 percent. In contrast, the most central-ized large metro areas tend to be in the Sun Belt, with the exception of metropolitan New York, which located 31 percent of jobs within three miles of Manhattan’s central business district. San Jose regis-tered as the most centralized metro area by far in 2010, with 64 percent of jobs located within three miles of CBDs in San Jose, Palo Alto, and Sunnyvale.
Among smaller employment centers, three of the five most decentralized metro areas ranked above the overall metro average for outer-ring job share in 2010—Memphis, Knoxville, and Worcester. However, Worcester also posted an above-average inner-ring job share, as did Stockton. At the other end of the spectrum, the most centralized smaller metro areas each located at least 46 percent of jobs within three miles of a central business district. Bridgeport exhibited the highest inner-ring job share among smaller employment centers, with 58 percent of jobs located in the urban core.
Beyond employment size, political fragmentation—or the number of jurisdictions within a region—can also influence job location. Edward Glaeser and his colleagues found a significant relationship between the extent of a metro area’s fragmentation and its level of job sprawl. Jobs tend to locate farther from the city center in regions with more political units, as employers look for business-friendly tax rates and local governments beyond the central city.15 In keeping with these findings, many of the metro areas that rank among the most decentralized in Table 5 also exhibit higher levels of fragmentation (e.g., Chicago, Detroit, Philadelphia, and St. Louis), while many of the most centralized metro areas are less politically fragmented (e.g., Las Vegas, Salt Lake City, Virginia Beach, and San Jose).
These patterns also underscore the importance of topography (e.g., the presence or absence of natural growth boundaries) and development decisions within metro areas in shaping employment location. Many of the most centralized metro areas in 2010 have more than one major employment hub. By contrast, the most decentralized metro areas are each anchored by one traditional CBD. But the most centralized list also includes a number of metro areas that have pursued growth manage-ment policies to encourage density and more centralized development. For instance, Honolulu and Salt Lake City each rank among the most centralized and each has only one CBD. Honolulu is hemmed in
Table�4.�Geographic�Distribution�of�Jobs�by�Metro�Area�Employment�Size,�100�Metro�Areas,�2010
� � � � Share�of�Jobs� �
� Number�of� Total�Number�of� Within� � �
� Size� Metro�Areas� Jobs�Within�35�Miles� 3�Miles� 3�to�10�Miles� 10�to�35�Miles
Under 500,000 Jobs 58 15,764,185 30.3 45.2 24.4Over 500,000 Jobs 42 57,483,777 20.8 31.0 48.2 All Metro Areas 100 73,247,962 22.9 34.1 43.1
Source: Brookings Institution analysis of ZIP Business Patterns data

BROOKINGS | April 2013 9
by mountains and water, but it has also adopted urban growth boundaries to manage development. Salt Lake City, another region constrained by geography, has actively pursued denser forms of devel-opment in recent years and become a leader in transit-oriented development.
Table�6.�Share�of�Employment�in�High-Density�ZIP�Codes�Outside�the�Urban�Core,�Selected�Metro�Areas,�2010
Metro�Area� %
Los Angeles-Long Beach-Santa Ana, CA 76.7San Diego-Carlsbad-San Marcos, CA 55.2Chicago-Joliet-Naperville, IL-IN-WI 54.1New York-Northern New Jersey-Long Island, NY 54.1Tucson, AZ 53.3Houston-Sugar Land-Baytown, TX 52.8San Francisco-Oakland-Fremont, CA 52.4Washington-Arlington-Alexandria, DC-VA-MD-WV 49.3Detroit-Warren-Livonia, MI 49.0Omaha-Council Bluffs, NE-IA 48.1Phoenix-Mesa-Glendale, AZ 48.0Dallas-Fort Worth-Arlington, TX 47.5Miami-Fort Lauderdale-Pompano Beach, FL 45.3Seattle-Tacoma-Bellevue, WA 45.3Albuquerque, NM 44.8
Source: Brookings Institution analysis of ZIP Business Patterns data
Table�5.�Most�Centralized�and�Decentralized�Metro�Areas�by�Employment�Size,�100�Metro�Areas,�2010
� Most�Centralized� Most�Decentralized�
� Share�of�Jobs� Share�of�Jobs
� #�� Within� 3�to� 10�to� �� #� Within� 3�to� 10�to�
� of� 3� 10� 35� �Highest�Share� of� 3� 10� 35�
��Highest�Share�Within�3�Miles� CBDs� Miles� Miles� Miles� �Beyond�10�Miles� CBDs� Miles� Miles� Miles
Larger Employment Regions Larger Employment Regions
San Jose-Sunnyvale-Santa Clara, CA 3 64.0 31.9 4.2 Detroit-Warren-Livonia, MI 1 7.3 15.3 77.4Las Vegas-Paradise, NV 1 44.6 46.9 8.6 Chicago-Joliet-Naperville, IL-IN-WI 1 19.5 13.1 67.4Virginia Beach-Norfolk-Newport News, VA-NC 3 32.4 53.2 14.4 Atlanta-Sandy Springs-Marietta, GA 1 9.9 25.6 64.6Salt Lake City, UT 1 31.8 37.6 30.6 Philadelphia-Camden-Wilmington,
PA-NJ-DE-MD 1 15.2 20.8 64.0 New York-Northern New Jersey-Long
Island, NY-NJ-PA 1 30.9 23.0 46.1 St. Louis, MO-IL 1 13.2 25.6 61.2 Smaller Employment Regions Smaller Employment Regions
Bridgeport-Stamford-Norwalk, CT 4 58.3 37.5 4.2 Memphis, TN-MS-AR 1 12.4 39.2 48.4Honolulu, HI 1 53.9 28.3 17.8 Knoxville, TN 1 18.6 36.2 45.2Allentown-Bethlehem-Easton, PA-NJ 3 50.3 35.2 14.4 Worcester, MA 1 31.0 24.9 44.1Oxnard-Thousand Oaks-Ventura, CA 3 47.4 44.1 8.5 Stockton, CA 1 30.5 31.3 38.2Scranton-Wilkes-Barre, PA 2 46.5 33.7 19.8 Charleston-North Charleston-
Summerville, SC 1 21.7 40.2 38.1
Source: Brookings Institution analysis of ZIP Business Patterns data

BROOKINGS | April 201310
To be sure, not all job decentralization is created equal. Traditional depictions of “sprawl” focus on patterns of diffuse, low-density greenfield development at the fringes of metropolitan regions, whether they are actually growing overall or just growing outward as populations decline. But many regions are seeing suburban development occurring in denser ways—whether in new places or through retrofitting older communities—that can, for instance, facilitate transit connections. Among the 100 largest metro areas, 42 have at least half of their jobs in high-density ZIP codes.16 And for many of these regions, a sizeable share of metro area jobs locate in high-density ZIP codes outside the urban core (Table 6). In the Los Angeles metro area, three-quarters of regional jobs fell in high-density ZIP codes more than three miles from downtown, while regions including San Diego, Chicago, and New York had more than half of their jobs in such ZIP codes. Moreover, Detroit, which topped the list for the most decentralized metro area, also ranks among the top 10 for the density of employment outside the urban core. At the other end of the spectrum, regions such as Augusta, GA; Chattanooga, TN; Greensboro, NC; Lakeland, FL; Poughkeepsie, NY; and Worcester, MA have no high job-density ZIP codes more than three miles from their downtowns. In those places, connecting people to jobs and transit may pose greater challenges than in more densely developed metro areas. (For detailed results, see Appendix D.)
Conclusion
The Great Recession led to net job losses in almost every major metro area and almost every major industry between 2007 and 2010. On the whole, these losses were felt throughout metropolitan regions—from the urban core to the metropolitan fringe. However, the housing-led downturn took the greatest toll on jobs outside the urban core, particularly those located
more than 10 miles away from downtown and those in the construction, manufacturing, and retail industries.
The severity of the recession, and especially steep outer-ring job losses, helped drive a slight uptick in urban core job share in more than half of the nation’s largest metro areas between 2007 and 2010. Most of these increases reflect a rebalancing of the distribution as regions shed jobs, rather than actual job gains in the urban core. On the whole the magnitude of these recession-era changes was modest enough that they served to stall decentralization, not reverse longer-running trends: By 2010, 91 metro areas located a smaller share of employment within three miles of downtown compared to 2000, as job share shifted outward toward the middle ring and metropolitan fringe.
These trends suggest that, as the economy recovers, the outward shift of employment will also likely resume within most major metro areas. However, efforts to encourage denser forms of subur-ban development and to attract jobs to the urban core have accelerated in recent years in regions like Boston, Chicago, Dallas, Denver, Minneapolis, San Francisco, and Washington, D.C. Such actions could succeed in eventually stemming longer-running trends toward decentralization in these regions, though it may be some time before the ultimate impact of these measures can be determined.
In the wake of the Great Recession, policymakers and regional leaders have the opportunity to make strategic decisions about how they will pursue metropolitan growth. If the next period of economic expansion ushers in low-density, diffuse growth in metropolitan America, the negative consequences of decentralization will make it that much harder for metro areas to achieve sustainable and inclu-sive growth over the long term. On the other hand, denser forms of development, whether inside or outside of traditional downtowns, allow for more effective connections between people and jobs, as do comprehensive development plans that explicitly link up jobs, housing, and transportation. Because the location of employment relates to so many aspects of a metro area’s growth and performance, land use, zoning, and economic development strategies should be balanced with housing and trans-portation planning to ensure that regions are not just growing more jobs or better jobs, but they are locating jobs in ways that promote accessibility and connection.

BROOKINGS | April 2013 11
Endnotes
1. Elizabeth Kneebone, “Job Sprawl Revisited: The Changing
Geography of Metropolitan Employment” (Washington:
Brookings Institution, 2009).
2. Analysis of U.S. Bureau of Labor Statistics data, December
2007 to December 2010.
3. Robert Cervero, Yoshifumi Komada, and Andrew Krueger,
“Suburban Transformations: From Employment Centers
to Mixed-Use Activity Centers,” University of California
Working Paper (Berkeley, CA: 2010).
4. For a more detailed review of the literature on these
effects, see Kneebone, “Job Sprawl Revisited.”
5. The data exclude information on the self-employed
population, employees of private households, railroad
employees, agricultural production workers, and most
government employees.
6. The 35 mile buffer captures 95 percent of all jobs located
within the 100 largest metro areas. It serves to bound the
analysis and helps standardize measures across metro
areas of differing geographic size. For detailed explana-
tions of the data cleaning and allocation process, see
Kneebone, “Job Sprawl Revisited.”
7. The metro areas included in the 2009 analysis that
do not appear in this analysis include: Durham, NC;
Lansing-East Lansing, MI; Lexington-Fayette, KY; Portland-
South Portland-Biddeford, ME; and Trenton-Ewing, NJ.
The metro areas appearing in this analysis that were
not included in 2009 are: Lakeland-Winter Haven, FL;
McAllen-Edinburg-Mission, TX; Modesto, CA; Ogden-
Clearfield, UT; Palm Bay-Melbourne-Titusville, FL;
Provo-Orem, UT; and Bridgeport-Stamford-Norwalk, CT.
8. Job density and total employment figures in 2010 come
from Nielsen’s Business Facts database, and are provided
at the census tract level, consistent with boundaries
drawn based on Census 2000.
9. Three metro areas had first-named cities that did not
have a defined CBD in 1982: Palm Bay, Virginia Beach,
and North Port. For these cities, the densest tract based
on 2010 job counts was selected as the primary CBD.
The 1982 Census of Retail Trade used 1980 census tracts
to designate CBDs. In cases where the 1982 CBDs were
maintained, 1980 and 2000 census tracts were mapped
together to identify the corresponding tracts in 2000,
so that all CBDs used in the analysis are drawn from the
same base year.
10. Based on density and job totals, the CBDs for six places—
four primary CBDs (Las Vegas, Little Rock, Honolulu, and
Nashville) and two secondary CBDs (Newport News and
Sunnyvale)—were changed away from the 1982 CBD.
11. See www.census.gov/geo/www/cbd.html.
12. ZIP business patterns “classifies an establishment
by its physical location”, thus employees may be
allocated to the address of the main office, though
they work at project sites away from headquarters.
See www.census.gov/econ/cbp/methodology.htm.
13. The three exceptions were the Texas metro areas of
Austin, El Paso, and McAllen, each of which managed to
weather this period with modest job gains within 35 miles
of a CBD.
14. As noted in the methods section, bounding the analysis at
35 miles helps to standardize measures across places of
different physical size. In 2009, the correlation between
share of jobs in the 10 to 35 mile ring and metropolitan
land area was fairly weak (0.34), and the correlation
between land area and change in outer-ring job share
over the decade even weaker (0.26).
15. Edward Glaeser, Matthew Khan, and Chenghuan Chu, “Job
Sprawl: Employment Location in U.S. Metropolitan Areas”
(Washington: Brookings Institution, 2001).
16. “High-density” ZIP codes rank within the top quartile of
all metropolitan ZIP codes and have at least 1,330 jobs per
square mile.

BROOKINGS | April 201312
Appendix A. List of Central Business Districts by Metro Area, 2010
Akron, OH Akron, Ohio Primary
Albany-Schenectady-Troy, NY Albany, New York Primary
Albany-Schenectady-Troy, NY Schenectady, New York Secondary
Albuquerque, NM Albuquerque, New Mexico Primary
Allentown-Bethlehem-Easton, PA-NJ Allentown, Pennsylvania Primary
Allentown-Bethlehem-Easton, PA-NJ Easton, Pennsylvania Secondary
Allentown-Bethlehem-Easton, PA-NJ Bethlehem, Pennsylvania Secondary
Atlanta-Sandy Springs-Marietta, GA Atlanta, Georgia Primary
Augusta-Richmond County, GA-SC Augusta, Georgia Primary
Austin-Round Rock-San Marcos, TX Austin, Texas Primary
Bakersfield-Delano, CA Bakersfield, California Primary
Baltimore-Towson, MD Baltimore, Maryland Primary
Baton Rouge, LA Baton Rouge, Louisiana Primary
Birmingham-Hoover, AL Birmingham, Alabama Primary
Boise City-Nampa, ID Boise City, Idaho Primary
Boston-Cambridge-Quincy, MA-NH Boston, Massachusetts Primary
Bridgeport-Stamford-Norwalk, CT Bridgeport, Connecticut Primary
Bridgeport-Stamford-Norwalk, CT Danbury, Connecticut Secondary
Bridgeport-Stamford-Norwalk, CT Norwalk, Connecticut Secondary
Bridgeport-Stamford-Norwalk, CT Stamford Connecticut Secondary
Buffalo-Niagara Falls, NY Buffalo, New York Primary
Cape Coral-Fort Myers, FL Cape Coral, Florida Primary
Cape Coral-Fort Myers, FL Fort Myers, Florida Secondary
Charleston-North Charleston-Summerville, SC Charleston, South Carolina Primary
Charlotte-Gastonia-Rock Hill, NC-SC Charlotte, North Carolina Primary
Chattanooga, TN-GA Chattanooga, Tennessee Primary
Chicago-Naperville-Joliet, IL-IN-WI Chicago, Illinois Primary
Cincinnati-Middletown, OH-KY-IN Cincinnati, Ohio Primary
Cleveland-Elyria-Mentor, OH Cleveland, Ohio Primary
Colorado Springs, CO Colorado Springs, Colorado Primary
Columbia, SC Columbia, South Carolina Primary
Columbus, OH Columbus, Ohio Primary
Dallas-Fort Worth-Arlington, TX Dallas, Texas Primary
Dallas-Fort Worth-Arlington, TX Forth Worth, Texas Secondary
Dayton, OH Dayton, Ohio Primary
Denver-Aurora-Broomfield, CO Denver, Colorado Primary
Des Moines-West Des Moines, IA Des Moines, Iowa Primary
Detroit-Warren-Livonia, MI Detroit, Michigan Primary
El Paso, TX El Paso, Texas Primary
Fresno, CA Fresno, California Primary
Grand Rapids-Wyoming, MI Grand Rapids, Michigan Primary
Greensboro-High Point, NC Greensboro, North Carolina Primary
Greensboro-High Point, NC High Point, North Carolina Secondary
Greenville-Mauldin-Easley, SC Greenville, South Carolina Primary
Harrisburg-Carlisle, PA Harrisburg, Pennsylvania Primary
Hartford-West Hartford-East Hartford, CT Hartford, Connecticut Primary
Honolulu, HI Honolulu, Hawaii Primary
Houston-Sugar Land-Baytown, TX Houston, Texas Primary
Metro�Area CBD�City CBD�Type*
BROOKINGS | April 2013 13
Indianapolis-Carmel, IN Indianapolis, Indiana Primary
Jackson, MS Jackson, Mississippi Primary
Jacksonville, FL Jacksonville city, Florida Primary
Kansas City, MO-KS Kansas City, Missouri Primary
Knoxville, TN Knoxville, Tennessee Primary
Lakeland-Winter Haven, FL Lakeland, Florida Primary
Lakeland-Winter Haven, FL Winter Haven, Florida Secondary
Lancaster, PA Lancaster, Pennsylvania Primary
Las Vegas-Paradise, NV Las Vegas, Nevada Primary
Little Rock-North Little Rock-Conway, AR Little Rock, Arkansas Primary
Los Angeles-Long Beach-Santa Ana, CA Los Angeles, California Primary
Los Angeles-Long Beach-Santa Ana, CA Long Beach, California Secondary
Louisville/Jefferson County, KY-IN Louisville, Kentucky Primary
Madison, WI Madison, Wisconsin Primary
McAllen-Edinburg-Mission, TX McAllen, Texas Primary
Memphis, TN-MS-AR Memphis, Tennessee Primary
Miami-Fort Lauderdale-Pompano Beach, FL Miami, Florida Primary
Miami-Fort Lauderdale-Pompano Beach, FL Fort Lauderdale, Florida Secondary
Miami-Fort Lauderdale-Pompano Beach, FL Hollywood, Florida Secondary
Miami-Fort Lauderdale-Pompano Beach, FL Pompano Beach, Florida Secondary
Miami-Fort Lauderdale-Pompano Beach, FL West Palm Beach, Florida Secondary
Milwaukee-Waukesha-West Allis, WI Milwaukee, Wisconsin Primary
Minneapolis-St. Paul-Bloomington, MN-WI Minneapolis, Minnesota Primary
Minneapolis-St. Paul-Bloomington, MN-WI St. Paul, Minnesota Secondary
Modesto, CA Modesto, California Primary
Nashville-Davidson-Murfreesboro-Franklin, TN Nashville-Davidson (consolidated) city, TN Primary
Nashville-Davidson-Murfreesboro-Franklin, TN Berry Hill, Tennessee Secondary
New Haven-Milford, CT New Haven, Connecticut Primary
New Haven-Milford, CT Milford, Connecticut Secondary
New Haven-Milford, CT Waterbury, Connecticut Secondary
New Orleans-Metairie-Kenner, LA New Orleans, Louisiana Primary
New York-Northern New Jersey-Long Island, NY-NJ-PA New York, New York Primary
North Port-Bradenton-Sarasota, FL North Port, Florida Primary
North Port-Bradenton-Sarasota, FL Bradenton, Florida Secondary
North Port-Bradenton-Sarasota, FL Sarasota, Florida Secondary
Ogden-Clearfield, UT Ogden, Utah Primary
Oklahoma City, OK Oklahoma City, Oklahoma Primary
Omaha-Council Bluffs, NE-IA Omaha, Nebraska Primary
Orlando-Kissimmee-Sanford, FL Orlando, Florida Primary
Oxnard-Thousand Oaks-Ventura, CA Oxnard, California Primary
Oxnard-Thousand Oaks-Ventura, CA San Buenaventura (Ventura), California Secondary
Oxnard-Thousand Oaks-Ventura, CA Thousand Oaks, California Secondary
Palm Bay-Melbourne-Titusville, FL Palm Bay city, Florida Primary
Palm Bay-Melbourne-Titusville, FL Cocoa, Florida Secondary
Palm Bay-Melbourne-Titusville, FL Titusville, Florida Secondary
Philadelphia-Camden-Wilmington, PA-NJ-DE-MD Philadelphia, Pennsylvania Primary
Phoenix-Mesa-Glendale, AZ Phoenix, Arizona Primary
Pittsburgh, PA Pittsburgh, Pennsylvania Primary
Appendix A. List of Central Business Districts by Metro Area, 2010 (continued)
Metro�Area CBD�City CBD�Type*
BROOKINGS | April 201314
Portland-Vancouver-Hillsboro, OR-WA Portland, Oregon Primary
Poughkeepsie-Newburgh-Middletown, NY Poughkeepsie, New York Primary
Poughkeepsie-Newburgh-Middletown, NY Middletown, New York Secondary
Poughkeepsie-Newburgh-Middletown, NY Newburgh, New York Secondary
Providence-New Bedford-Fall River, RI-MA Providence, Rhode Island Primary
Provo-Orem, UT Provo, Utah Primary
Raleigh-Cary, NC Raleigh, North Carolina Primary
Richmond, VA Richmond, Virginia Primary
Riverside-San Bernardino-Ontario, CA Riverside, California Primary
Riverside-San Bernardino-Ontario, CA San Bernardino, California Secondary
Rochester, NY Rochester, New York Primary
Sacramento-Arden-Arcade-Roseville, CA Sacramento, California Primary
St. Louis, MO-IL St. Louis, Missouri Primary
Salt Lake City, UT Salt Lake City, Utah Primary
San Antonio-New Braunfels, TX San Antonio, Texas Primary
San Diego-Carlsbad-San Marcos, CA San Diego, California Primary
San Francisco-Oakland-Fremont, CA San Francisco, California Primary
San Jose-Sunnyvale-Santa Clara, CA San Jose, California Primary
San Jose-Sunnyvale-Santa Clara, CA Palo Alto, California Secondary
San Jose-Sunnyvale-Santa Clara, CA Sunnyvale, California Secondary
Scranton-Wilkes-Barre, PA Scranton, Pennsylvania Primary
Scranton-Wilkes-Barre, PA Wilkes-Barre, Pennsylvania Secondary
Seattle-Tacoma-Bellevue, WA Seattle, Washington Primary
Seattle-Tacoma-Bellevue, WA Bellevue, Washington Secondary
Springfield, MA Springfield, Massachusetts Primary
Stockton, CA Stockton, California Primary
Syracuse, NY Syracuse, New York Primary
Tampa-St. Petersburg-Clearwater, FL Tampa, Florida Primary
Tampa-St. Petersburg-Clearwater, FL St. Petersburg, Florida Secondary
Toledo, OH Toledo, Ohio Primary
Tucson, AZ Tucson, Arizona Primary
Tulsa, OK Tulsa, Oklahoma Primary
Virginia Beach-Norfolk-Newport News, VA-NC Virginia Beach city, Virginia Primary
Virginia Beach-Norfolk-Newport News, VA-NC Newport News, Virginia Secondary
Virginia Beach-Norfolk-Newport News, VA-NC Norfolk, Virginia Secondary
Washington-Arlington-Alexandria, DC-VA-MD-WV Washington, District Of Columbia Primary
Wichita, KS Wichita, Kansas Primary
Worcester, MA Worcester, Massachusetts Primary
Youngstown-Warren-Boardman, OH-PA Youngstown, Ohio Primary
Youngstown-Warren-Boardman, OH-PA Warren, Ohio Secondary
*Primary CBDs are those located in the city that appears first in the official metropolitan statistical area name.
Appendix A. List of Central Business Districts by Metro Area, 2010 (continued)
Metro�Area CBD�City CBD�Type*

BROOKINGS | April 2013 15
20
00
20
07
20
10
Met
ro�A
rea
Tota
l�N
um
ber
�of
�Jobs�
Wit
hin
�35
�M
iles
�of
�CB
D
Sh
are
�of
�Jobs�
Wit
hin
�3
�Miles
�of
�CB
D
Sh
are
�of
�Jobs�
3�t
o�1
0�
Miles
�fr
om
�C
BD
Sh
are
�of
�Jobs�
10�t
o�3
5�
Miles
�fr
om
�C
BD
Tota
l�N
um
ber
�of
�Jobs�
Wit
hin
�35
�M
iles
�of�
CB
D
Sh
are
�of
�Jobs�
Wit
hin
�3
�Miles
�of
�CB
D
Sh
are
�of
�Jobs�
3�t
o�1
0�
Miles
�fr
om
�C
BD
Sh
are
�of
�Jobs�
10�t
o�3
5�
Miles
�fr
om
�C
BD
Tota
l�N
um
ber
�of
�Jobs�
Wit
hin
�35
�M
iles
�of�
CB
D
Sh
are
�of
�Jobs�
Wit
hin
�3
�Miles
�of
�CB
D
Sh
are
�of
�Jobs
3�t
o�1
0�
Miles
�fr
om
�C
BD
Sh
are
�of
�Jobs�
10�t
o�
35
�M
iles
100
�ME
TR
O�T
OTA
L76
,252
,828
24.5
34.6
40.9
79,0
71,5
2122
.634
.143
.273
,247
,962
22.9
34.1
43.1
Akr
on
, OH
303,70
527
.343
.629
.129
3,37
123
.944
.132.0
266,493
24.9
44.3
30.9
Alb
any-
Sch
enec
tad
y-Tr
oy, N
Y31
9,15
337
.447
.315
.333
6,99
135
.747
.516.8
323,123
36.3
46.7
17.0
Alb
uq
uer
qu
e, N
M27
5,64
027
.860
.811
.430
9,03
325
.460
.314.3
277,353
26.7
59.9
13.4
Alle
nto
wn
-Bet
hle
hem
-Eas
ton
, PA
-NJ
285,56
452
.731
.316
.030
2,86
751
.134
.015.0
283,287
50.3
35.2
14.4
Atl
anta
-San
dy
Sp
rin
gs-
Mar
iett
a, G
A1,98
3,36
810
.329
.360
.42,05
2,75
99.5
25.5
65.0
1,864,067
9.9
25.6
64.6
Au
gu
sta-
Ric
hm
on
d C
ou
nty
, GA
-SC
177,01
326
.238
.635
.217
9,76
624
.740
.335.0
160,538
24.8
43.0
32.2
Au
stin
-Ro
un
d R
ock
-San
Mar
cos,
TX
546,50
727
.044
.029
.063
0,27
223
.040
.436.6
631,816
24.3
38.8
36.9
Bak
ersfi
eld
-Del
ano,
CA
132,02
045
.537
.616
.816
7,38
240
.543
.316.3
156,459
40.2
42.8
16.9
Bal
tim
ore
-Tow
son
, MD
1,01
7,49
719
.335
.345
.51,11
6,61
017
.332
.750.0
1,045,722
17.5
32.3
50.2
Bat
on
Ro
ug
e, L
A28
2,28
118
.653
.028
.431
7,52
516
.353
.630.1
307,698
15.1
53.8
31.1
Bir
min
gh
am-H
oov
er, A
L44
7,30
436
.037
.126
.945
9,68
532
.536
.331.2
414,679
31.3
36.2
32.5
Bo
ise
Cit
y-N
ampa
, ID
193,94
050
.425
.923
.723
6,33
739
.635
.025.3
207,996
39.4
36.2
24.4
Bo
sto
n-C
amb
rid
ge-
Qu
incy
, MA
-NH
2,17
2,97
128
.324
.047
.72,13
7,13
529
.023
.347.7
2,041,857
29.2
23.6
47.2
Bri
dg
epo
rt-S
tam
ford
-No
rwal
k, C
T44
1,80
063
.233
.43.4
427,95
158
.837
.33.9
393,311
58.3
37.5
4.2
Bu
ffal
o-N
iag
ara
Falls
, NY
476,00
421
.650
.128
.346
8,20
918
.051
.930.0
455,929
18.1
51.3
30.6
Cap
e C
ora
l-Fo
rt M
yers
, FL
143,03
745
.240
.014
.819
8,14
738
.743
.218.1
166,266
35.6
43.3
21.1
Ch
arle
sto
n-N
ort
h C
har
lest
on
, Su
mm
ervi
lle, S
C21
4,92
325
.941
.632
.524
4,30
020
.042
.437.6
225,812
21.7
40.2
38.1
Ch
arlo
tte-
Gas
ton
ia-R
ock
Hill
, NC
-SC
714,49
825
.436
.837
.880
3,80
924
.134
.441.5
720,823
23.5
33.5
43.0
Ch
atta
no
og
a, T
N-G
A21
4,87
933
.242
.524
.321
3,92
030
.145
.224.7
193,005
32.6
43.5
24.0
Ch
icag
o-J
olie
t-N
aper
ville
, IL-
IN-W
I3,80
3,45
118
.513
.867
.73,67
4,30
617
.913
.169.0
3,374,483
19.5
13.1
67.4
Cin
cin
nat
i-M
idd
leto
wn
, OH
-KY
-IN
934,48
519
.730
.849
.590
7,87
016
.129
.953.9
857,640
17.7
29.5
52.8
Cle
vela
nd
-Ely
ria-
Men
tor,
OH
1,04
1,38
017
.539
.643
.092
7,71
315
.738
.046.3
831,701
15.4
38.1
46.5
Co
lora
do
Sp
rin
gs,
CO
215,14
237
.852
.79.6
235,54
134
.151
.914.0
215,371
33.0
52.2
14.8
Co
lum
bia
, SC
266,62
833
.641
.425
.028
3,91
129
.942
.227.9
263,269
30.1
41.9
28.0
Co
lum
bu
s, O
H79
0,31
223
.745
.930
.478
2,27
021
.144
.035.0
740,704
21.2
43.4
35.4
Dal
las-
Fort
Wo
rth
-Arl
ing
ton
, TX
2,48
9,33
815
.934
.449
.72,54
4,06
913
.830
.056.2
2,436,904
13.3
29.2
57.5
Day
ton
, OH
379,38
328
.452
.019
.633
9,84
924
.454
.021.7
307,773
24.5
53.4
22.0
Den
ver-
Au
rora
-Bro
om
fiel
d, C
O1,06
7,54
723
.645
.530
.91,10
7,77
421
.442
.236.5
1,034,107
21.5
41.8
36.7
Des
Mo
ines
-Wes
t D
es M
oin
es, I
A25
9,86
646
.143
.710
.128
3,71
238
.750
.410.8
269,251
37.5
51.5
11.0
Det
roit
-War
ren
-Liv
on
ia, M
I1,85
6,48
77.3
16.6
76.1
1,59
4,98
27.2
15.4
77.4
1,380,896
7.3
15.3
77.4
El P
aso,
TX
199,84
721
.560
.717
.820
4,23
419
.957
.822.3
207,143
18.5
57.6
23.9
Fres
no,
CA
206,00
926
.059
.214
.824
7,00
522
.763
.813.6
219,802
23.1
62.5
14.4
App
endi
x B
. Geo
grap
hic
Dis
trib
utio
n of
Job
s in
the
100
Lar
gest
Met
ro A
reas
, 200
0-2
01
0
BROOKINGS | April 201316
20
00
20
07
20
10
Met
ro�A
rea
Tota
l�N
um
ber
�of
�Jobs�
Wit
hin
�35
�M
iles
�of
�CB
D
Sh
are
�of
�Jobs�
Wit
hin
�3
�Miles
�of
�CB
D
Sh
are
�of
�Jobs�
3�t
o�1
0�
Miles
�fr
om
�C
BD
Sh
are
�of
�Jobs�
10�t
o�3
5�
Miles
�fr
om
�C
BD
Tota
l�N
um
ber
�of
�Jobs�
Wit
hin
�35
�M
iles
�of�
CB
D
Sh
are
�of
�Jobs�
Wit
hin
�3
�Miles
�of
�CB
D
Sh
are
�of
�Jobs�
3�t
o�1
0�
Miles
�fr
om
�C
BD
Sh
are
�of
�Jobs�
10�t
o�3
5�
Miles
�fr
om
�C
BD
Tota
l�N
um
ber
�of
�Jobs�
Wit
hin
�35
�M
iles
�of�
CB
D
Sh
are
�of
�Jobs�
Wit
hin
�3
�Miles
�of
�CB
D
Sh
are
�of
�Jobs
3�t
o�1
0�
Miles
�fr
om
�C
BD
Sh
are
�of
�Jobs�
10�t
o�
35
�M
iles
Gra
nd
Rap
ids-
Wyo
min
g, M
I35
5,31
328
.357
.713
.934
0,13
825
.858
.815.4
307,195
26.0
58.7
15.2
Gre
ensb
oro
-Hig
h P
oin
t, N
C34
0,25
335
.642
.821
.732
8,84
432
.446
.720.9
294,641
32.2
47.2
20.6
Gre
envi
lle-M
auld
in-E
asle
y, S
C28
4,27
338
.439
.122
.527
5,65
533
.143
.723.2
247,348
33.3
43.6
23.1
Har
risb
urg
-Car
lisle
, PA
255,94
234
.039
.826
.327
0,75
332
.140
.827.2
258,775
31.8
41.1
27.0
Har
tfo
rd-W
est
Har
tfo
rd-E
ast
Har
tfo
rd, C
T55
7,09
427
.039
.433
.755
4,10
024
.540
.634.9
515,407
23.8
41.4
34.8
Ho
no
lulu
, HI
316,53
255
.730
.713
.635
7,63
655
.428
.116.5
335,929
53.9
28.3
17.8
Ho
ust
on
-Su
gar
Lan
d-B
ayto
wn
, TX
1,81
8,66
714
.036
.649
.42,07
6,87
411
.532
.356.2
2,020,868
10.7
32.1
57.2
Ind
ian
apo
lis, I
N77
1,11
522
.344
.533
.178
1,47
619
.341
.439.3
732,061
19.5
40.5
40.1
Jac
kso
n, M
S20
8,67
745
.642
.312
.020
4,84
436
.545
.218.3
194,394
35.5
46.8
17.7
Jac
kso
nvill
e, F
L45
5,00
924
.744
.031
.251
4,62
321
.741
.736.6
453,213
21.0
41.2
37.8
Kan
sas
Cit
y, M
O-K
S87
7,87
620
.531
.548
.088
8,25
517
.030
.552.5
831,452
16.9
29.9
53.3
Kn
oxvi
lle, T
N27
5,14
621
.936
.341
.830
5,06
819
.036
.444.5
284,256
18.6
36.2
45.2
Lak
elan
d-W
inte
r H
aven
, FL
161,97
940
.143
.616
.317
4,45
534
.349
.016.7
158,959
35.3
47.7
17.0
Lan
cast
er, P
A21
3,29
532
.236
.031
.821
8,87
830
.738
.131.3
207,280
31.2
37.4
31.4
Las
Veg
as-P
arad
ise,
NV
615,49
050
.942
.17.0
841,95
444
.547
.58.0
712,598
44.6
46.9
8.6
Lit
tle
Ro
ck-N
ort
h L
ittl
e R
ock
, Co
nway
, AR
282,88
833
.840
.325
.929
2,66
336
.635
.228.1
271,753
34.5
35.5
29.9
Lo
s A
ng
eles
-Lo
ng
Bea
ch-S
anta
An
a, C
A5,14
4,06
010
.034
.255
.85,19
4,61
09.5
34.2
56.3
4,719,962
9.9
34.2
55.9
Lo
uis
ville
-Jef
fers
on
Co
un
ty, K
Y-I
N54
5,86
530
.253
.016
.854
1,47
727
.152
.720.3
507,568
28.9
51.5
19.6
Mad
iso
n, W
I23
6,34
233
.548
.318
.226
5,30
129
.254
.116.7
252,870
30.1
53.7
16.2
McA
llen
-Ed
inb
urg
-Mis
sio
n, T
X11
4,90
343
.436
.220
.416
0,97
735
.145
.319.6
167,167
33.6
46.8
19.6
Mem
ph
is, T
N-M
S-A
R54
7,16
713
.644
.941
.553
1,55
312
.239
.748.2
490,626
12.4
39.2
48.4
Mia
mi-
Fort
Lau
der
dal
e-P
om
pan
o B
each
, FL
1,91
0,88
526
.751
.721
.62,02
5,20
424
.750
.524.8
1,809,699
24.3
50.5
25.2
Milw
auke
e-W
auke
sha-
Wes
t A
llis,
WI
784,37
522
.642
.035
.478
8,35
222
.639
.038.3
731,212
24.1
38.1
37.8
Min
nea
po
lis-S
t. P
aul-
Blo
om
ing
ton
, MN
-WI
1,59
2,54
726
.144
.529
.41,64
8,30
224
.042
.533.6
1,530,794
25.1
41.5
33.4
Mo
des
to, C
A12
0,25
352
.223
.824
.013
9,01
945
.830
.124.1
121,468
45.5
30.7
23.8
Nas
hvill
e-D
avid
son
-Mu
rfre
esb
oro
-Fra
nkl
in, T
N63
3,84
330
.031
.938
.168
7,99
726
.929
.144.0
625,265
27.0
28.7
44.3
New
Hav
en-M
ilfo
rd, C
T33
7,94
447
.035
.217
.834
3,04
546
.035
.718.3
311,869
45.3
36.4
18.3
New
Orl
ean
s-M
etai
rie-
Ken
ner
, LA
509,33
733
.848
.318
.043
4,20
629
.846
.523.8
424,539
31.6
44.5
24.0
New
Yo
rk-N
ort
her
n N
ew J
erse
y-L
on
g Is
lan
d, N
Y -
NJ
-PA
6,76
6,97
231
.521
.447
.06,79
3,96
130
.722
.247.1
6,437,814
30.9
23.0
46.1
No
rth
Po
rt-B
rad
ento
n-S
aras
ota
, FL
239,67
051
.940
.47.8
228,78
739
.651
.58.9
198,338
40.4
50.3
9.3
Og
den
-Cle
arfi
eld
, UT
133,26
438
.332
.329
.315
6,15
929
.638
.332.1
142,183
30.6
38.0
31.4
Okl
aho
ma
Cit
y, O
K42
0,70
228
.849
.421
.846
1,95
925
.746
.827.5
435,233
26.4
44.6
29.0
Om
aha-
Co
un
cil B
luff
s, N
E-IA
380,65
927
.161
.111
.839
8,16
224
.359
.815.8
393,547
23.3
60.6
16.1
Orl
and
o-K
issi
mm
ee-S
anfo
rd, F
L79
9,53
415
.646
.537
.993
5,70
913
.143
.043.9
844,450
12.8
42.4
44.9
Oxn
ard
-Th
ou
san
d O
aks-
Ven
tura
, CA
242,81
947
.444
.28.4
277,70
747
.144
.48.5
238,637
47.4
44.1
8.5
App
endi
x B
. Geo
grap
hic
Dis
trib
utio
n of
Job
s in
the
100
Lar
gest
Met
ro A
reas
, 200
0-2
01
0 (
con
tinu
ed)

BROOKINGS | April 2013 17
App
endi
x B
. Geo
grap
hic
Dis
trib
utio
n of
Job
s in
the
100
Lar
gest
Met
ro A
reas
, 200
0-2
01
0 (
con
tinu
ed)
20
00
20
07
20
10
Met
ro�A
rea
Tota
l�N
um
ber
�of
�Jobs�
Wit
hin
�35
�M
iles
�of
�CB
D
Sh
are
�of
�Jobs�
Wit
hin
�3
�Miles
�of
�CB
D
Sh
are
�of
�Jobs�
3�t
o�1
0�
Miles
�fr
om
�C
BD
Sh
are
�of
�Jobs�
10�t
o�3
5�
Miles
�fr
om
�C
BD
Tota
l�N
um
ber
�of
�Jobs�
Wit
hin
�35
�M
iles
�of�
CB
D
Sh
are
�of
�Jobs�
Wit
hin
�3
�Miles
�of
�CB
D
Sh
are
�of
�Jobs�
3�t
o�1
0�
Miles
�fr
om
�C
BD
Sh
are
�of
�Jobs�
10�t
o�3
5�
Miles
�fr
om
�C
BD
Tota
l�N
um
ber
�of
�Jobs�
Wit
hin
�35
�M
iles
�of�
CB
D
Sh
are
�of
�Jobs�
Wit
hin
�3
�Miles
�of
�CB
D
Sh
are
�of
�Jobs
3�t
o�1
0�
Miles
�fr
om
�C
BD
Sh
are
�of
�Jobs�
10�t
o�
35
�M
iles
Pal
m B
ay-M
elb
ou
rne-
Tit
usv
ille,
FL
157,41
743
.850
.35.9
183,75
242
.151
.16.8
166,033
42.2
50.5
7.3
Ph
ilad
elp
hia
-Cam
den
-Wilm
ing
ton
, PA
-NJ
-DE-
MD
2,44
0,50
216
.721
.861
.52,45
7,43
715
.320
.963.8
2,309,658
15.2
20.8
64.0
Ph
oen
ix-M
esa-
Gle
nd
ale,
AZ
1,35
1,95
624
.840
.035
.21,66
0,22
918
.836
.744.5
1,412,678
18.1
35.9
46.0
Pit
tsb
urg
h, P
A1,00
5,04
526
.229
.744
.11,01
3,02
525
.928
.745.3
981,789
25.2
29.5
45.2
Po
rtla
nd
-Van
cou
ver-
Hill
sbo
ro, O
R86
0,17
226
.147
.526
.492
6,78
624
.445
.330.3
863,135
23.8
46.8
29.5
Po
ug
hke
epsi
e-N
ewb
urg
h-M
idd
leto
wn
, NY
182,99
439
.737
.223
.120
4,04
136
.938
.724.4
196,855
37.2
38.3
24.5
Pro
vid
ence
-New
Bed
ford
-Fal
l Riv
er, R
I-M
A60
3,48
822
.429
.048
.663
8,50
821
.529
.049.5
582,629
21.7
28.7
49.6
Pro
vo-O
rem
, UT
135,04
939
.240
.520
.315
0,60
934
.540
.624.9
142,681
33.8
39.6
26.6
Ral
eig
h-C
ary,
NC
367,11
118
.256
.125
.742
8,38
115
.652
.931.5
406,506
15.4
53.1
31.5
Ric
hm
on
d, V
A48
0,37
921
.450
.328
.351
2,43
520
.147
.032.9
465,268
19.6
47.0
33.4
Riv
ersi
de-
San
Ber
nar
din
o-O
nta
rio,
CA
705,96
614
.829
.655
.694
0,50
512
.231
.256.6
791,754
12.3
31.6
56.2
Ro
ches
ter,
NY
426,06
734
.845
.519
.741
7,47
130
.648
.121.3
397,181
30.7
47.3
22.0
Sac
ram
ento
-Ard
en-A
rcad
e-R
ose
ville
, CA
579,56
019
.638
.641
.868
0,22
917
.335
.347.4
586,318
18.5
35.2
46.3
St.
Lo
uis
, MO
-IL
1,14
9,39
114
.927
.557
.61,16
8,95
913
.624
.861.6
1,083,419
13.2
25.6
61.2
Sal
t L
ake
Cit
y, U
T49
7,01
736
.039
.924
.156
3,42
631
.137
.431.5
522,087
31.8
37.6
30.6
San
An
ton
io-M
auld
in-E
asle
y, S
C62
3,49
219
.256
.524
.370
7,29
114
.253
.832.0
702,726
13.8
52.4
33.7
San
Die
go
-Car
lsba
d-S
an M
arco
s, C
A1,00
3,94
013
.734
.851
.51,13
0,03
011
.634
.653.8
1,041,789
12.3
34.6
53.1
San
Fra
nci
sco
-Oak
lan
d-F
rem
on
t, C
A1,99
0,33
425
.217
.757
.11,89
3,41
524
.118
.957.0
1,747,221
25.2
19.5
55.4
San
Jo
se-S
un
nyva
le-S
anta
Cla
ra, C
A98
7,47
862
.334
.33.4
906,19
062
.533
.14.4
838,902
64.0
31.9
4.2
Scr
anto
n-W
ilkes
-Bar
re, P
A23
1,85
548
.232
.119
.723
7,85
445
.234
.520.4
227,421
46.5
33.7
19.8
Sea
ttle
-Tac
om
a-B
elle
vue,
WA
1,40
7,40
128
.124
.947
.11,49
8,01
326
.125
.148.8
1,383,910
27.4
27.0
45.6
Sp
rin
gfi
eld
, MA
235,67
534
.640
.225
.223
0,65
932
.739
.427.9
224,714
32.8
38.1
29.1
Sto
ckto
n, C
A15
3,43
336
.127
.536
.417
7,76
231
.430
.238.4
160,037
30.5
31.3
38.2
Syr
acu
se, N
Y26
7,54
838
.440
.221
.425
3,86
337
.440
.921.7
245,149
37.8
40.5
21.7
Tam
pa-S
t. P
eter
sbu
rg-C
lear
wat
er, F
L99
7,55
721
.145
.033
.999
4,52
920
.144
.335.6
905,865
20.2
45.0
34.8
Tole
do,
OH
285,71
926
.254
.818
.927
7,42
224
.653
.921.6
250,628
23.8
54.8
21.4
Tucs
on
, AZ
292,04
822
.867
.010
.233
0,76
520
.365
.014.7
301,467
19.2
64.8
16.0
Tuls
a, O
K36
5,15
824
.855
.120
.137
8,02
319
.056
.324.7
356,112
19.3
55.2
25.5
Vir
gin
ia B
each
-No
rfo
lk-N
ewp
ort
New
s, V
A-N
C57
6,87
134
.852
.512
.763
0,47
033
.352
.514.2
584,420
32.4
53.2
14.4
Was
hin
gto
n-A
rlin
gto
n-A
lexa
nd
ria,
DC
-VA
-MD
-WV
2,00
1,03
721
.732
.745
.52,24
8,17
921
.231
.247.6
2,165,605
21.8
31.0
47.1
Wic
hit
a, K
S25
7,50
238
.049
.112
.925
6,62
536
.050
.113.9
250,118
36.3
49.7
14.0
Wo
rces
ter,
MA
293,77
932
.623
.743
.729
2,39
431
.624
.543.9
270,450
31.0
24.9
44.1
You
ng
stow
n-W
arre
n-B
oar
dm
an, O
H-P
A23
7,22
130
.244
.025
.821
4,23
926
.246
.027.8
198,787
27.3
45.1
27.5

BROOKINGS | April 201318
Ch
an
ge�
20
00
-20
07
Ch
an
ge�
20
07-
20
10C
han
ge�
20
00
-20
10
Met
ro�A
rea
Tota
l�N
um
ber
�of�
Jobs�
Wit
hin
�3
5�M
iles
�of
�CB
D
Sh
are
�of
�Jobs�
Wit
hin
�3�
Miles
�of
�CB
D
Sh
are
�of
�Jobs�
3�t
o�1
0�
Miles
�fr
om
�C
BD
Sh
are
�of
�Jobs�
10�t
o�3
5�
Miles
�fr
om
�C
BD
Tota
l�N
um
ber
�of
�Jobs�
Wit
hin
�35
�M
iles
�of�
CB
D
Sh
are
�of
�Jobs�
Wit
hin
�3
�Miles
�of
�CB
D
Sh
are
�of
�Jobs�
3�t
o�1
0�
Miles
�fr
om
�C
BD
Sh
are
�of
�Jobs�
10�t
o�3
5�
Miles
�fr
om
�C
BD
Tota
l�N
um
ber
�of
�Jobs�
Wit
hin
�35
�M
iles
�of�
CB
D
Sh
are
�of
�Jobs�
Wit
hin
�3
�Miles
�of
�CB
D
Sh
are
�of
�Jobs
3�t
o�1
0�
Miles
�fro
m�
CB
D
Sh
are
�of
�Jobs�
10�t
o�
35
�M
iles
100
�ME
TR
O�T
OTA
L2,
818,
693
-1.9
-0.5
2.3
-5,8
23,5
590.
2-0
.1-0
.2-3
,004
,866
-1.7
-0.5
2.2
Akr
on
, OH
-10,33
4-3.4
0.5
2.9
-26,87
81.0
0.2
-1.2
-37,213
-2.5
0.7
1.7
Alb
any-
Sch
enec
tad
y-Tr
oy, N
Y17
,838
-1.6
0.2
1.4
-13,86
80.6
-0.8
0.2
3,970
-1.1
-0.6
1.6
Alb
uq
uer
qu
e, N
M33
,393
-2.4
-0.4
2.8
-31,67
91.3
-0.4
-0.9
1,714
-1.1
-0.8
1.9
Alle
nto
wn
-Bet
hle
hem
-Eas
ton
, PA
-NJ
17,303
-1.6
2.6
-1.0
-19,58
0-0.7
1.3
-0.5
-2,277
-2.4
3.9
-1.6
Atl
anta
-San
dy
Sp
rin
gs-
Mar
iett
a, G
A69
,390
-0.8
-3.8
4.6
-188
,691
0.4
0.1
-0.5
-119,301
-0.4
-3.8
4.2
Au
gu
sta-
Ric
hm
on
d C
ou
nty
, GA
-SC
2,75
3-1.5
1.7
-0.2
-19,22
80.1
2.7
-2.7
-16,475
-1.4
4.4
-2.9
Au
stin
-Ro
un
d R
ock
-San
Mar
cos,
TX
83,766
-4.0
-3.6
7.6
1,54
41.3
-1.6
0.3
85,309
-2.7
-5.2
7.9
BB
aker
sfiel
d-D
elan
o, C
A35
,362
-5.1
5.7
-0.6
-10,92
4-0.2
-0.4
0.7
24,438
-5.3
5.2
0.1
Bal
tim
ore
-Tow
son
, MD
99,113
-2.0
-2.5
4.5
-70,88
80.2
-0.5
0.2
28,225
-1.8
-3.0
4.8
Bat
on
Ro
ug
e, L
A35
,244
-2.2
0.6
1.7
-9,827
-1.3
0.2
1.1
25,417
-3.5
0.8
2.7
Bir
min
gh
am-H
oov
er, A
L12
,380
-3.5
-0.8
4.3
-45,00
5-1.2
-0.1
1.3
-32,625
-4.7
-0.9
5.6
Bo
ise
Cit
y-N
ampa
, ID
42,397
-10.8
9.1
1.7
-28,34
1-0.2
1.1
-1.0
14,056
-10.9
10.2
0.7
Bo
sto
n-C
amb
rid
ge-
Qu
incy
, MA
-NH
-35,83
60.7
-0.8
0.0
-95,27
80.1
0.3
-0.5
-131,114
0.9
-0.4
-0.4
Bri
dg
epo
rt-S
tam
ford
-No
rwal
k, C
T-13,84
8-4.4
3.9
0.6
-34,64
1-0.5
0.2
0.3
-48,489
-4.9
4.1
0.9
Bu
ffal
o-N
iag
ara
Falls
, NY
-7,795
-3.6
1.8
1.8
-12,28
00.0
-0.6
0.6
-20,075
-3.6
1.2
2.3
Cap
e C
ora
l-Fo
rt M
yers
, FL
55,111
-6.5
3.2
3.2
-31,88
1-3.1
0.1
3.0
23,229
-9.6
3.3
6.3
Ch
arle
sto
n-N
ort
h C
har
lest
on
, Su
mm
ervi
lle, S
C29
,377
-5.8
0.8
5.1
-18,48
81.7
-2.2
0.5
10,889
-4.2
-1.4
5.6
Ch
arlo
tte-
Gas
ton
ia-R
ock
Hill
, NC
-SC
89,311
-1.4
-2.4
3.8
-82,98
6-0.6
-0.8
1.5
6,324
-2.0
-3.2
5.2
Ch
atta
no
og
a, T
N-G
A-959
-3.1
2.7
0.4
-20,91
52.5
-1.8
-0.7
-21,873
-0.6
1.0
-0.3
Ch
icag
o-J
olie
t-N
aper
ville
, IL-
IN-W
I-129
,145
-0.6
-0.7
1.3
-299
,823
1.6
0.0
-1.6
-428,968
1.0
-0.7
-0.3
Cin
cin
nat
i-M
idd
leto
wn
, OH
-KY
-IN
-26,61
6-3.5
-0.9
4.4
-50,22
91.6
-0.5
-1.1
-76,845
-1.9
-1.4
3.3
Cle
vela
nd
-Ely
ria-
Men
tor,
OH
-113
,667
-1.8
-1.5
3.3
-96,01
3-0.3
0.1
0.2
-209,680
-2.1
-1.4
3.5
Co
lora
do
Sp
rin
gs,
CO
20,399
-3.7
-0.7
4.4
-20,17
0-1.1
0.3
0.8
229
-4.8
-0.4
5.2
Co
lum
bia
, SC
17,283
-3.7
0.8
2.9
-20,64
20.2
-0.3
0.1
-3,359
-3.5
0.5
3.0
Co
lum
bu
s, O
H-8,042
-2.7
-1.9
4.5
-41,56
60.2
-0.6
0.4
-49,608
-2.5
-2.4
5.0
Dal
las-
Fort
Wo
rth
-Arl
ing
ton
, TX
54,731
-2.1
-4.4
6.5
-107
,165
-0.5
-0.8
1.3
-52,434
-2.6
-5.1
7.7
Day
ton
, OH
-39,53
4-4.1
2.0
2.1
-32,07
60.1
-0.5
0.4
-71,610
-3.9
1.5
2.5
Den
ver-
Au
rora
-Bro
om
fiel
d, C
O40
,227
-2.3
-3.3
5.5
-73,66
70.1
-0.4
0.2
-33,440
-2.1
-3.6
5.8
Des
Mo
ines
-Wes
t D
es M
oin
es, I
A23
,846
-7.4
6.7
0.7
-14,46
0-1.2
1.0
0.2
9,385
-8.6
7.7
0.9
Det
roit
-War
ren
-Liv
on
ia, M
I-261
,505
0.0
-1.2
1.3
-214
,086
0.1
-0.1
0.1
-475,591
0.0
-1.4
1.3
El P
aso,
TX
4,38
7-1.6
-2.9
4.5
2,90
9-1.4
-0.2
1.6
7,296
-3.0
-3.1
6.1
Fres
no,
CA
40,995
-3.3
4.6
-1.3
-27,20
20.5
-1.3
0.8
13,793
-2.8
3.3
-0.5
Gra
nd
Rap
ids-
Wyo
min
g, M
I-15,17
5-2.5
1.1
1.4
-32,94
40.2
-0.1
-0.1
-48,119
-2.3
1.0
1.3
Gre
ensb
oro
-Hig
h P
oin
t, N
C-11,40
9-3.2
3.9
-0.8
-34,20
3-0.2
0.5
-0.3
-45,612
-3.3
4.4
-1.1
Gre
envi
lle-M
auld
in-E
asle
y, S
C-8,618
-5.3
4.6
0.7
-28,30
70.2
-0.1
-0.1
-36,925
-5.1
4.4
0.6
App
endi
x C
. Cha
nge
in t
he G
eogr
aphi
c D
istr
ibut
ion
of J
obs
in t
he 1
00 L
arge
st M
etro
Are
as

BROOKINGS | April 2013 19
App
endi
x C
. Cha
nge
in t
he G
eogr
aphi
c D
istr
ibut
ion
of J
obs
in t
he 1
00 L
arge
st M
etro
Are
as (
con
tinu
ed)
Ch
an
ge�
20
00
-20
07
Ch
an
ge�
20
07-
20
10C
han
ge�
20
00
-20
10
Met
ro�A
rea
Tota
l�N
um
ber
�of�
Jobs�
Wit
hin
�3
5�M
iles
�of
�CB
D
Sh
are
�of
�Jobs�
Wit
hin
�3�
Miles
�of
�CB
D
Sh
are
�of
�Jobs�
3�t
o�1
0�
Miles
�fr
om
�C
BD
Sh
are
�of
�Jobs�
10�t
o�3
5�
Miles
�fr
om
�C
BD
Tota
l�N
um
ber
�of
�Jobs�
Wit
hin
�35
�M
iles
�of�
CB
D
Sh
are
�of
�Jobs�
Wit
hin
�3
�Miles
�of
�CB
D
Sh
are
�of
�Jobs�
3�t
o�1
0�
Miles
�fr
om
�C
BD
Sh
are
�of
�Jobs�
10�t
o�3
5�
Miles
�fr
om
�C
BD
Tota
l�N
um
ber
�of
�Jobs�
Wit
hin
�35
�M
iles
�of�
CB
D
Sh
are
�of
�Jobs�
Wit
hin
�3
�Miles
�of
�CB
D
Sh
are
�of
�Jobs
3�t
o�1
0�
Miles
�fro
m�
CB
D
Sh
are
�of
�Jobs�
10�t
o�
35
�M
iles
Har
risb
urg
-Car
lisle
, PA
14,811
-1.9
1.0
0.9
-11,97
8-0.2
0.4
-0.2
2,833
-2.1
1.4
0.7
Har
tfo
rd-W
est
Har
tfo
rd-E
ast
Har
tfo
rd, C
T-2,993
-2.5
1.3
1.2
-38,69
3-0.7
0.8
-0.1
-41,687
-3.2
2.1
1.1
Ho
no
lulu
, HI
41,104
-0.4
-2.6
3.0
-21,70
7-1.5
0.2
1.3
19,397
-1.8
-2.4
4.2
Ho
ust
on
-Su
gar
Lan
d-B
ayto
wn
, TX
258,20
7-2.5
-4.3
6.8
-56,00
5-0.8
-0.2
1.0
202,202
-3.3
-4.5
7.8
Ind
ian
apo
lis, I
N10
,361
-3.0
-3.2
6.2
-49,41
40.2
-0.9
0.7
-39,053
-2.9
-4.0
6.9
Jac
kso
n, M
S-3,833
-9.1
2.8
6.2
-10,45
0-1.0
1.6
-0.6
-14,283
-10.1
4.4
5.6
Jac
kso
nvill
e, F
L59
,613
-3.1
-2.3
5.4
-61,40
9-0.7
-0.5
1.2
-1,796
-3.8
-2.8
6.6
Kan
sas
Cit
y, M
O-K
S10
,379
-3.5
-1.0
4.5
-56,80
3-0.2
-0.6
0.8
-46,424
-3.6
-1.6
5.3
Kn
oxvi
lle, T
N29
,922
-2.9
0.1
2.8
-20,81
1-0.4
-0.2
0.6
9,111
-3.3
-0.1
3.4
Lak
elan
d-W
inte
r H
aven
, FL
12,475
-5.8
5.3
0.4
-15,49
61.0
-1.3
0.3
-3,020
-4.8
4.1
0.7
Lan
cast
er, P
A5,58
3-1.5
2.1
-0.5
-11,59
80.6
-0.7
0.1
-6,015
-1.0
1.4
-0.4
Las
Veg
as-P
arad
ise,
NV
226,46
3-6.4
5.4
1.0
-129
,355
0.0
-0.6
0.6
97,108
-6.4
4.8
1.6
Lit
tle
Ro
ck-N
ort
h L
ittl
e R
ock
, Co
nway
, AR
9,77
52.8
-5.1
2.2
-20,90
9-2.1
0.3
1.8
-11,134
0.7
-4.8
4.1
Lo
s A
ng
eles
-Lo
ng
Bea
ch-S
anta
An
a, C
A50
,550
-0.5
0.0
0.5
-474
,647
0.4
0.0
-0.4
-424,098
-0.1
0.0
0.1
Lo
uis
ville
-Jef
fers
on
Co
un
ty, K
Y-I
N-4,388
-3.1
-0.3
3.5
-33,90
91.8
-1.2
-0.6
-38,296
-1.3
-1.5
2.9
Mad
iso
n, W
I28
,959
-4.3
5.8
-1.5
-12,43
10.9
-0.4
-0.6
16,528
-3.4
5.4
-2.1
McA
llen
-Ed
inb
urg
-Mis
sio
n, T
X46
,073
-8.4
9.2
-0.8
6,19
1-1.4
1.4
0.0
52,264
-9.8
10.6
-0.8
Mem
ph
is, T
N-M
S-A
R-15,61
4-1.4
-5.2
6.7
-40,92
70.2
-0.4
0.2
-56,541
-1.2
-5.6
6.8
Mia
mi-
Fort
Lau
der
dal
e-P
om
pan
o B
each
, FL
114,31
9-2.0
-1.2
3.2
-215
,505
-0.4
0.0
0.4
-101,187
-2.4
-1.2
3.6
Milw
auke
e-W
auke
sha-
Wes
t A
llis,
WI
3,97
70.0
-2.9
2.9
-57,14
01.5
-0.9
-0.5
-53,163
1.5
-3.8
2.3
Min
nea
po
lis-S
t. P
aul-
Blo
om
ing
ton
, MN
-WI
55,755
-2.2
-2.0
4.2
-117
,508
1.1
-0.9
-0.2
-61,753
-1.0
-3.0
4.0
Mo
des
to, C
A18
,767
-6.4
6.3
0.1
-17,55
1-0.3
0.6
-0.3
1,215
-6.7
6.9
-0.2
Nas
hvill
e-D
avid
son
-Mu
rfre
esb
oro
-Fra
nkl
in, T
N54
,154
-3.1
-2.8
5.9
-62,73
20.0
-0.4
0.4
-8,578
-3.0
-3.2
6.2
New
Hav
en-M
ilfo
rd, C
T5,10
0-1.0
0.5
0.5
-31,17
5-0.7
0.7
0.1
-26,075
-1.7
1.2
0.5
New
Orl
ean
s-M
etai
rie-
Ken
ner
, LA
-75,13
0-4.0
-1.8
5.8
-9,667
1.8
-2.0
0.2
-84,797
-2.2
-3.8
6.0
New
Yo
rk-N
ort
her
n N
ew J
erse
y-L
on
g Is
lan
d, N
Y
-NJ
-PA
26,989
-0.8
0.8
0.0
-356
,147
0.2
0.8
-0.9
-329,158
-0.7
1.6
-0.9
No
rth
Po
rt-B
rad
ento
n-S
aras
ota
, FL
-10,88
3-12.3
11.1
1.2
-30,44
90.9
-1.2
0.4
-41,333
-11.4
9.9
1.6
Og
den
-Cle
arfi
eld
, UT
22,895
-8.7
6.0
2.7
-13,97
71.0
-0.3
-0.6
8,919
-7.7
5.6
2.1
Okl
aho
ma
Cit
y, O
K41
,257
-3.1
-2.7
5.7
-26,72
60.6
-2.1
1.5
14,531
-2.4
-4.8
7.2
Om
aha-
Co
un
cil B
luff
s, N
E-IA
17,502
-2.8
-1.3
4.1
-4,615
-1.1
0.8
0.3
12,887
-3.9
-0.5
4.4
Orl
and
o-K
issi
mm
ee-S
anfo
rd, F
L13
6,17
5-2.5
-3.5
6.0
-91,25
9-0.4
-0.7
1.0
44,916
-2.8
-4.1
7.0
Oxn
ard
-Th
ou
san
d O
aks-
Ven
tura
, CA
34,888
-0.2
0.2
0.1
-39,07
00.3
-0.3
0.0
-4,182
0.1
-0.1
0.0
Pal
m B
ay-M
elb
ou
rne-
Tit
usv
ille,
FL
26,335
-1.7
0.8
1.0
-17,71
90.1
-0.6
0.5
8,616
-1.6
0.2
1.5
Ph
ilad
elp
hia
-Cam
den
-Wilm
ing
ton
, PA
-NJ
-DE-
MD
16,934
-1.4
-0.9
2.3
-147
,778
-0.1
-0.1
0.2
-130,844
-1.5
-1.0
2.5
Ph
oen
ix-M
esa-
Gle
nd
ale,
AZ
308,27
4-6.0
-3.2
9.3
-247
,551
-0.7
-0.8
1.5
60,723
-6.8
-4.0
10.8
Pit
tsb
urg
h, P
A7,98
1-0.2
-1.0
1.2
-31,23
6-0.7
0.8
-0.1
-23,255
-0.9
-0.1
1.1
Po
rtla
nd
-Van
cou
ver-
Hill
sbo
ro, O
R66
,614
-1.7
-2.2
3.9
-63,65
1-0.6
1.4
-0.8
2,963
-2.3
-0.8
3.1
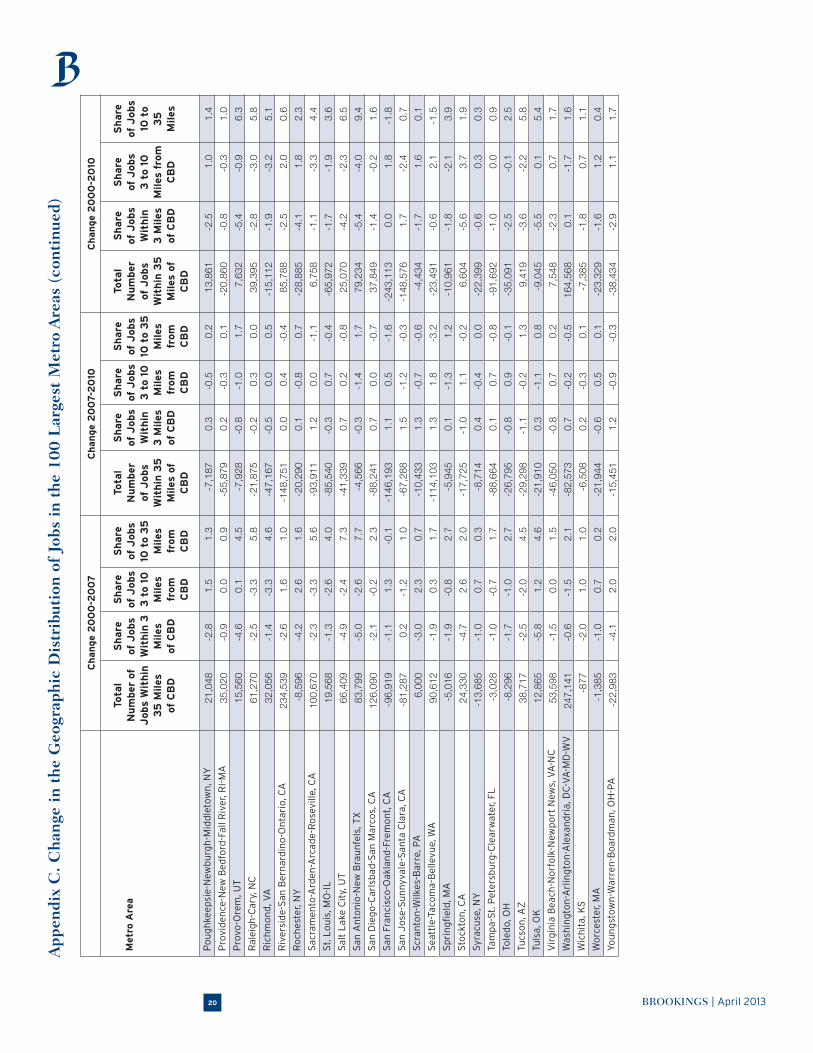
BROOKINGS | April 201320
Ch
an
ge�
20
00
-20
07
Ch
an
ge�
20
07-
20
10C
han
ge�
20
00
-20
10
Met
ro�A
rea
Tota
l�N
um
ber
�of�
Jobs�
Wit
hin
�3
5�M
iles
�of
�CB
D
Sh
are
�of
�Jobs�
Wit
hin
�3�
Miles
�of
�CB
D
Sh
are
�of
�Jobs�
3�t
o�1
0�
Miles
�fr
om
�C
BD
Sh
are
�of
�Jobs�
10�t
o�3
5�
Miles
�fr
om
�C
BD
Tota
l�N
um
ber
�of
�Jobs�
Wit
hin
�35
�M
iles
�of�
CB
D
Sh
are
�of
�Jobs�
Wit
hin
�3
�Miles
�of
�CB
D
Sh
are
�of
�Jobs�
3�t
o�1
0�
Miles
�fr
om
�C
BD
Sh
are
�of
�Jobs�
10�t
o�3
5�
Miles
�fr
om
�C
BD
Tota
l�N
um
ber
�of
�Jobs�
Wit
hin
�35
�M
iles
�of�
CB
D
Sh
are
�of
�Jobs�
Wit
hin
�3
�Miles
�of
�CB
D
Sh
are
�of
�Jobs
3�t
o�1
0�
Miles
�fro
m�
CB
D
Sh
are
�of
�Jobs�
10�t
o�
35
�M
iles
Po
ug
hke
epsi
e-N
ewb
urg
h-M
idd
leto
wn
, NY
21,048
-2.8
1.5
1.3
-7,187
0.3
-0.5
0.2
13,861
-2.5
1.0
1.4
Pro
vid
ence
-New
Bed
ford
-Fal
l Riv
er, R
I-M
A35
,020
-0.9
0.0
0.9
-55,87
90.2
-0.3
0.1
-20,860
-0.8
-0.3
1.0
Pro
vo-O
rem
, UT
15,560
-4.6
0.1
4.5
-7,928
-0.8
-1.0
1.7
7,632
-5.4
-0.9
6.3
Ral
eig
h-C
ary,
NC
61,270
-2.5
-3.3
5.8
-21,87
5-0.2
0.3
0.0
39,395
-2.8
-3.0
5.8
Ric
hm
on
d, V
A32
,056
-1.4
-3.3
4.6
-47,16
7-0.5
0.0
0.5
-15,112
-1.9
-3.2
5.1
Riv
ersi
de-
San
Ber
nar
din
o-O
nta
rio,
CA
234,53
9-2.6
1.6
1.0
-148
,751
0.0
0.4
-0.4
85,788
-2.5
2.0
0.6
Ro
ches
ter,
NY
-8,596
-4.2
2.6
1.6
-20,29
00.1
-0.8
0.7
-28,885
-4.1
1.8
2.3
Sac
ram
ento
-Ard
en-A
rcad
e-R
ose
ville
, CA
100,67
0-2.3
-3.3
5.6
-93,91
11.2
0.0
-1.1
6,758
-1.1
-3.3
4.4
St.
Lo
uis
, MO
-IL
19,568
-1.3
-2.6
4.0
-85,54
0-0.3
0.7
-0.4
-65,972
-1.7
-1.9
3.6
Sal
t L
ake
Cit
y, U
T66
,409
-4.9
-2.4
7.3
-41,33
90.7
0.2
-0.8
25,070
-4.2
-2.3
6.5
San
An
ton
io-N
ew B
rau
nfel
s, T
X83
,799
-5.0
-2.6
7.7
-4,566
-0.3
-1.4
1.7
79,234
-5.4
-4.0
9.4
San
Die
go
-Car
lsba
d-S
an M
arco
s, C
A12
6,09
0-2.1
-0.2
2.3
-88,24
10.7
0.0
-0.7
37,849
-1.4
-0.2
1.6
San
Fra
nci
sco
-Oak
lan
d-F
rem
on
t, C
A-96,91
9-1.1
1.3
-0.1
-146
,193
1.1
0.5
-1.6
-243,113
0.0
1.8
-1.8
San
Jo
se-S
un
nyva
le-S
anta
Cla
ra, C
A-81,28
70.2
-1.2
1.0
-67,28
81.5
-1.2
-0.3
-148,576
1.7
-2.4
0.7
Scr
anto
n-W
ilkes
-Bar
re, P
A6,00
0-3.0
2.3
0.7
-10,43
31.3
-0.7
-0.6
-4,434
-1.7
1.6
0.1
Sea
ttle
-Tac
om
a-B
elle
vue,
WA
90,612
-1.9
0.3
1.7
-114
,103
1.3
1.8
-3.2
-23,491
-0.6
2.1
-1.5
Sp
rin
gfi
eld
, MA
-5,016
-1.9
-0.8
2.7
-5,945
0.1
-1.3
1.2
-10,961
-1.8
-2.1
3.9
Sto
ckto
n, C
A24
,330
-4.7
2.6
2.0
-17,72
5-1.0
1.1
-0.2
6,604
-5.6
3.7
1.9
Syr
acu
se, N
Y-13,68
5-1.0
0.7
0.3
-8,714
0.4
-0.4
0.0
-22,399
-0.6
0.3
0.3
Tam
pa-S
t. P
eter
sbu
rg-C
lear
wat
er, F
L-3,028
-1.0
-0.7
1.7
-88,66
40.1
0.7
-0.8
-91,692
-1.0
0.0
0.9
Tole
do,
OH
-8,296
-1.7
-1.0
2.7
-26,79
5-0.8
0.9
-0.1
-35,091
-2.5
-0.1
2.5
Tucs
on
, AZ
38,717
-2.5
-2.0
4.5
-29,29
8-1.1
-0.2
1.3
9,419
-3.6
-2.2
5.8
Tuls
a, O
K12
,865
-5.8
1.2
4.6
-21,91
00.3
-1.1
0.8
-9,045
-5.5
0.1
5.4
Vir
gin
ia B
each
-No
rfo
lk-N
ewp
ort
New
s, V
A-N
C53
,598
-1.5
0.0
1.5
-46,05
0-0.8
0.7
0.2
7,548
-2.3
0.7
1.7
Was
hin
gto
n-A
rlin
gto
n-A
lexa
nd
ria,
DC
-VA
-MD
-WV
247,14
1-0.6
-1.5
2.1
-82,57
30.7
-0.2
-0.5
164,568
0.1
-1.7
1.6
Wic
hit
a, K
S-877
-2.0
1.0
1.0
-6,508
0.2
-0.3
0.1
-7,385
-1.8
0.7
1.1
Wo
rces
ter,
MA
-1,385
-1.0
0.7
0.2
-21,94
4-0.6
0.5
0.1
-23,329
-1.6
1.2
0.4
You
ng
stow
n-W
arre
n-B
oar
dm
an, O
H-P
A-22,98
3-4.1
2.0
2.0
-15,45
11.2
-0.9
-0.3
-38,434
-2.9
1.1
1.7
App
endi
x C
. Cha
nge
in t
he G
eogr
aphi
c D
istr
ibut
ion
of J
obs
in t
he 1
00 L
arge
st M
etro
Are
as (
con
tinu
ed)
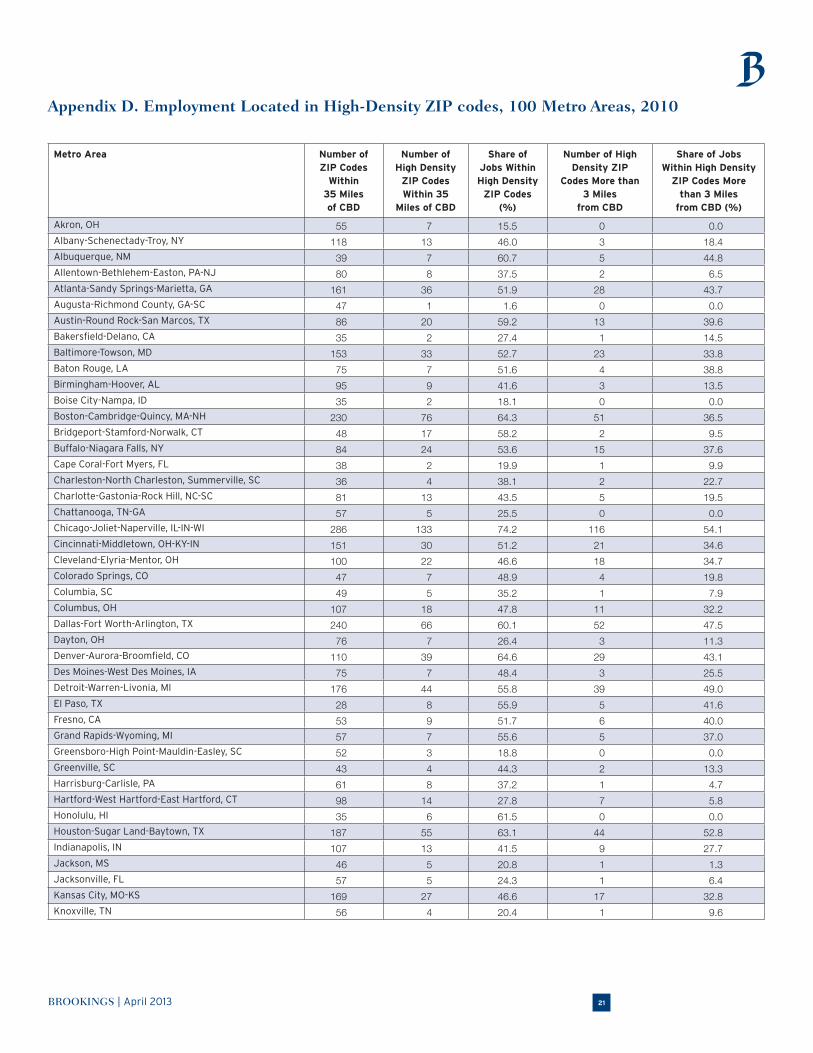
BROOKINGS | April 2013 21
Appendix D. Employment Located in High-Density ZIP codes, 100 Metro Areas, 2010
Metro�Area Number�of�ZIP�Codes�
Within�35�Miles�of�CBD
Number�of�High�Density�
ZIP�Codes�Within�35�
Miles�of�CBD
Share�of�Jobs�Within�High�Density�
ZIP�Codes�(%)
Number�of�High�Density�ZIP�
Codes�More�than�3�Miles�
from�CBD
Share�of�Jobs�Within�High�Density�
ZIP�Codes�More�than�3�Miles�
from�CBD�(%)
Akron, OH 55 7 15.5 0 0.0Albany-Schenectady-Troy, NY 118 13 46.0 3 18.4Albuquerque, NM 39 7 60.7 5 44.8Allentown-Bethlehem-Easton, PA-NJ 80 8 37.5 2 6.5Atlanta-Sandy Springs-Marietta, GA 161 36 51.9 28 43.7Augusta-Richmond County, GA-SC 47 1 1.6 0 0.0Austin-Round Rock-San Marcos, TX 86 20 59.2 13 39.6Bakersfield-Delano, CA 35 2 27.4 1 14.5Baltimore-Towson, MD 153 33 52.7 23 33.8Baton Rouge, LA 75 7 51.6 4 38.8Birmingham-Hoover, AL 95 9 41.6 3 13.5Boise City-Nampa, ID 35 2 18.1 0 0.0Boston-Cambridge-Quincy, MA-NH 230 76 64.3 51 36.5Bridgeport-Stamford-Norwalk, CT 48 17 58.2 2 9.5Buffalo-Niagara Falls, NY 84 24 53.6 15 37.6Cape Coral-Fort Myers, FL 38 2 19.9 1 9.9Charleston-North Charleston, Summerville, SC 36 4 38.1 2 22.7Charlotte-Gastonia-Rock Hill, NC-SC 81 13 43.5 5 19.5Chattanooga, TN-GA 57 5 25.5 0 0.0Chicago-Joliet-Naperville, IL-IN-WI 286 133 74.2 116 54.1Cincinnati-Middletown, OH-KY-IN 151 30 51.2 21 34.6Cleveland-Elyria-Mentor, OH 100 22 46.6 18 34.7Colorado Springs, CO 47 7 48.9 4 19.8Columbia, SC 49 5 35.2 1 7.9Columbus, OH 107 18 47.8 11 32.2Dallas-Fort Worth-Arlington, TX 240 66 60.1 52 47.5Dayton, OH 76 7 26.4 3 11.3Denver-Aurora-Broomfield, CO 110 39 64.6 29 43.1Des Moines-West Des Moines, IA 75 7 48.4 3 25.5Detroit-Warren-Livonia, MI 176 44 55.8 39 49.0El Paso, TX 28 8 55.9 5 41.6Fresno, CA 53 9 51.7 6 40.0Grand Rapids-Wyoming, MI 57 7 55.6 5 37.0Greensboro-High Point-Mauldin-Easley, SC 52 3 18.8 0 0.0Greenville, SC 43 4 44.3 2 13.3Harrisburg-Carlisle, PA 61 8 37.2 1 4.7Hartford-West Hartford-East Hartford, CT 98 14 27.8 7 5.8Honolulu, HI 35 6 61.5 0 0.0Houston-Sugar Land-Baytown, TX 187 55 63.1 44 52.8Indianapolis, IN 107 13 41.5 9 27.7Jackson, MS 46 5 20.8 1 1.3Jacksonville, FL 57 5 24.3 1 6.4Kansas City, MO-KS 169 27 46.6 17 32.8Knoxville, TN 56 4 20.4 1 9.6

BROOKINGS | April 201322
Metro�Area Number�of�ZIP�Codes�
Within�35�Miles�of�CBD
Number�of�High�Density�
ZIP�Codes�Within�35�
Miles�of�CBD
Share�of�Jobs�Within�High�Density�
ZIP�Codes�(%)
Number�of�High�Density�ZIP�
Codes�More�than�3�Miles�
from�CBD
Share�of�Jobs�Within�High�Density�
ZIP�Codes�More�than�3�Miles�
from�CBD�(%)
Lakeland-Winter Haven, FL 35 0 0.0 0 0.0Lancaster, PA 52 3 29.2 2 1.5Las Vegas-Paradise, NV 67 19 72.9 12 26.7Little Rock-North Little Rock, Conway, AR 60 5 36.7 2 9.9Los Angeles-Long Beach-Santa Ana, CA 375 246 86.5 216 76.7Louisville-Jefferson County, KY-IN 112 17 50.2 8 28.1Madison, WI 58 8 41.5 3 14.8McAllen-Edinburg-Mission, TX 22 2 30.8 1 13.8Memphis, TN-MS-AR 73 15 51.5 11 40.4Miami-Fort Lauderdale-Pompano Beach, FL 183 82 67.0 54 45.3Milwaukee-Waukesha-West Allis, WI 81 21 53.1 13 29.6Minneapolis-St. Paul-Bloomington, MN-WI 193 55 61.8 32 37.6Modesto, CA 24 2 30.3 0 0.0Nashville-Davidson-Murfreesboro-Franklin, TN 91 12 35.0 2 10.9New Haven-Milford, CT 43 5 27.0 0 0.0New Orleans-Metairie-Kenner, LA 67 16 55.1 7 26.0New York-Northern New Jersey-Long Island, NY-NJ-PA 633 367 84.6 320 54.1North Port-Bradenton-Sarasota, FL 45 3 17.6 1 4.3Ogden-Clearfield, UT 24 0 0.0 0 0.0Oklahoma City, OK 90 14 39.9 5 15.5Omaha-Council Bluffs, NE-IA 111 17 64.3 11 48.1Orlando-Kissimmee-Sanford, FL 93 21 55.9 15 43.6Oxnard-Thousand Oaks-Ventura, CA 34 2 24.4 1 13.9Palm Bay-Melbourne-Titusville, FL 28 3 27.5 1 4.3Philadelphia-Camden-Wilmington, PA-NJ-DE-MD 319 103 56.3 85 41.8Phoenix-Mesa-Glendale, AZ 136 41 66.1 30 48.0Pittsburgh, PA 253 32 37.6 20 12.4Portland-Vancouver-Hillsboro, OR-WA 120 32 61.8 21 39.7Poughkeepsie-Newburgh-Middletown, NY 70 2 18.1 0 0.0Providence-New Bedford-Fall River, RI-MA 111 27 47.7 17 27.9Provo-Orem, UT 26 3 22.8 2 15.8Raleigh-Cary, NC 57 7 31.8 4 21.5Richmond, VA 101 9 35.9 5 23.4Riverside-San Bernardino-Ontario, CA 115 13 35.8 9 27.7Rochester, NY 96 15 47.0 5 22.0Sacramento-Arden-Arcade-Roseville, CA 93 17 47.0 10 33.6St. Louis, MO-IL 175 29 48.1 21 34.6Salt Lake City, UT 48 18 66.4 10 41.4San Antonio-New Braunfels, TX 104 17 52.6 12 42.3San Diego-Carlsbad-San Marcos, CA 92 30 66.2 23 55.2San Francisco-Oakland-Fremont, CA 162 79 77.1 62 52.4San Jose-Sunnyvale-Santa Clara, CA 68 34 78.4 8 10.2Scranton-Wilkes-Barre, PA 69 6 17.8 1 1.9Seattle-Tacoma-Bellevue, WA 149 46 71.0 33 45.3Springfield, MA 80 6 23.8 1 1.1
Appendix D. Employment Located in High-Density ZIP codes, 100 Metro Areas, 2010 (continued)
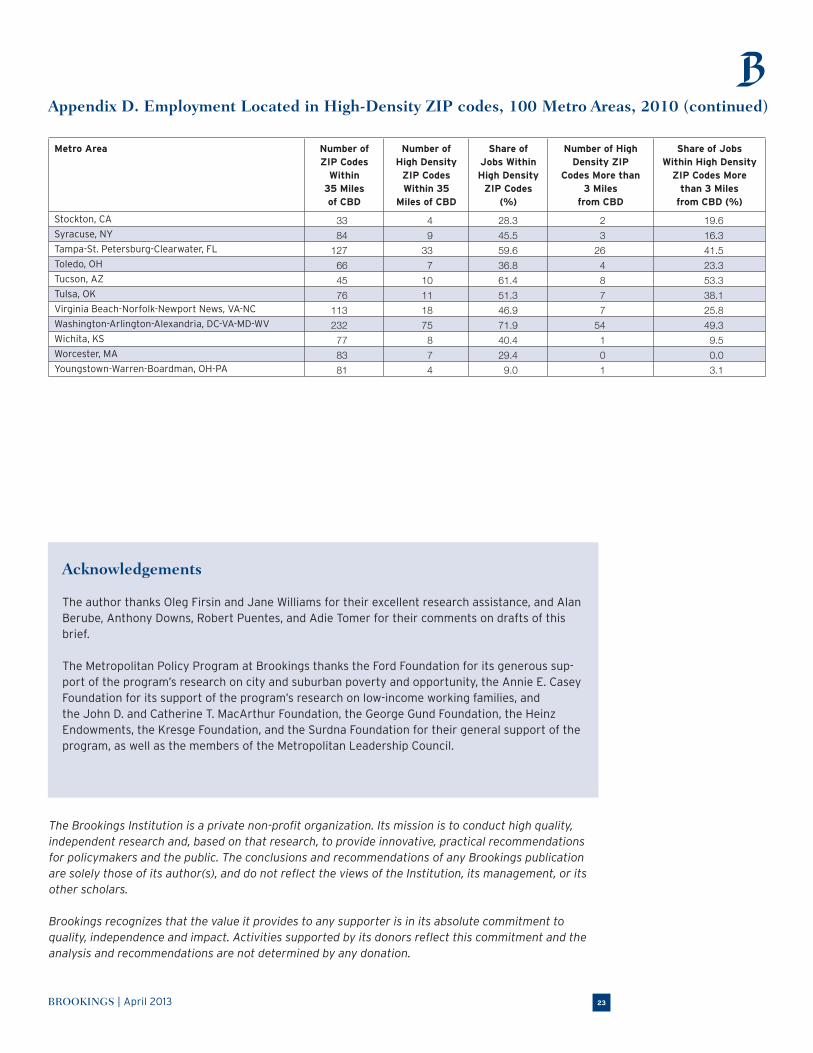
BROOKINGS | April 2013 23
Appendix D. Employment Located in High-Density ZIP codes, 100 Metro Areas, 2010 (continued)
Metro�Area Number�of�ZIP�Codes�
Within�35�Miles�of�CBD
Number�of�High�Density�
ZIP�Codes�Within�35�
Miles�of�CBD
Share�of�Jobs�Within�High�Density�
ZIP�Codes�(%)
Number�of�High�Density�ZIP�
Codes�More�than�3�Miles�
from�CBD
Share�of�Jobs�Within�High�Density�
ZIP�Codes�More�than�3�Miles�
from�CBD�(%)
Stockton, CA 33 4 28.3 2 19.6Syracuse, NY 84 9 45.5 3 16.3Tampa-St. Petersburg-Clearwater, FL 127 33 59.6 26 41.5Toledo, OH 66 7 36.8 4 23.3Tucson, AZ 45 10 61.4 8 53.3Tulsa, OK 76 11 51.3 7 38.1Virginia Beach-Norfolk-Newport News, VA-NC 113 18 46.9 7 25.8Washington-Arlington-Alexandria, DC-VA-MD-WV 232 75 71.9 54 49.3Wichita, KS 77 8 40.4 1 9.5Worcester, MA 83 7 29.4 0 0.0Youngstown-Warren-Boardman, OH-PA 81 4 9.0 1 3.1
Acknowledgements
The author thanks Oleg Firsin and Jane Williams for their excellent research assistance, and Alan Berube, Anthony Downs, Robert Puentes, and Adie Tomer for their comments on drafts of this brief. The Metropolitan Policy Program at Brookings thanks the Ford Foundation for its generous sup-port of the program’s research on city and suburban poverty and opportunity, the Annie E. CaseyFoundation for its support of the program’s research on low-income working families, and the John D. and Catherine T. MacArthur Foundation, the George Gund Foundation, the Heinz Endowments, the Kresge Foundation, and the Surdna Foundation for their general support of the program, as well as the members of the Metropolitan Leadership Council.
The Brookings Institution is a private non-profit organization. Its mission is to conduct high quality, independent research and, based on that research, to provide innovative, practical recommendations for policymakers and the public. The conclusions and recommendations of any Brookings publication are solely those of its author(s), and do not reflect the views of the Institution, its management, or its other scholars.
Brookings recognizes that the value it provides to any supporter is in its absolute commitment to quality, independence and impact. Activities supported by its donors reflect this commitment and the analysis and recommendations are not determined by any donation.

About the Metro Opportunity SeriesLaunched in 2009 the Metropolitan Opportunity Series documents the changing geography of poverty and opportunity in metropolitan America, analyzes its drivers and implications, and offers policyrecommendations to enhance the well-being of lower-income families and communities in both cit-ies and suburbs. This study and other publications, speeches, presentations, and commentary in the series are available at: www.brookings.edu/metro/MetropolitanOpportunity.aspx
About the Metropolitan Policy Program at the Brookings InstitutionCreated in 1996, the Brookings Institution’s Metropolitan Policy Program provides decision makers with cutting-edge research and policy ideas for improving the health and prosperity of cities and metropolitan areas including their component cities, suburbs, and rural areas. To learn more visit: www.brookings.edu/metro.
1775 Massachusetts Avenue, NW Washington D.C. 20036-2188telephone 202.797.6000fax 202.797.6004web site www.brookings.edu
telephone 202.797.6139 fax 202.797.2965web site www.brookings.edu/metro
BROOKINGS
For More InformationElizabeth Kneebone FellowBrookings Metropolitan Policy [email protected]
For General InformationMetropolitan Policy Program at Brookings202.797.6139www.brookings.edu/metro�
1775 Massachusetts Avenue NWWashington D.C. 20036-2188telephone 202.797.6139fax 202.797.2965
In the Series• Job Sprawl Revisited: The Changing Geography of Metropolitan
Employment • Job Sprawl and the Suburbanization of Poverty • Missed Opportunity: Transit and Jobs in Metropolitan America