metrological experiments in biomarker development (mass spectrometry—statistical issues) walter...
TRANSCRIPT

Metrological Experiments inBiomarker Development (Mass Spectrometry—Statistical Issues)
Walter Liggett Statistical Engineering Division
Peter BarkerBiotechnology Division
National Institute of Standards and Technology

Biomarker(Clinical Pharmacology & Therapeutics, 2001)
A characteristic that is objectively measured and evaluated as an indicator of normal biological processes, pathogenic processes, or pharmacologic responses to a therapeutic intervention.
Two parts of a biomarker– Execution of measurement protocol– Interpretation of measured response

Metrology
• Development and evaluation of a measurement protocol, the first part of a biomarker
• Diverse lessons learned from varied applications• Focus on general purpose protocols which may be
adequate for a particular purpose• The use of metrology in biomarker development is
the subject of this talk

Metrological Experiments
• Experimental units (specimens)– Knowledge of their characteristics
– Relation to unknowns of future interest
• Response– Univariate—interval-scale variable
– Multivariate/Functional
• Protocol parameters—parameter design• Cost of experimental runs—high throughput?

Outline
• Alternative statistical formulations– Classification based on cases and controls– Measurement of an interval-scale variable
• Aspects of protocol development– Property of interest– Realization of protocol
• Multivariate and functional measurements

Statistics for Classification
• Assume gold standard for disease status
• Evaluate marker on training data– Sensitivity—true positive rate– Specificity—1 – false positive rate
• Continuous test result—ROC curves
• Multivariate test result—classification, discriminant analysis

Pepe, et al., J. National Cancer Institute, 2001Specimen Selection
1. Wide spectrum of tumor and non-tumor tissue
2. Serum from cases and controls in a target screening population
3. Apparently healthy subjects monitored for development of cancer
4. Cohort from a population that might be targeted
5. Subjects randomly selected from populations in which the screening program is likely
Thinking Outside the Box
• Bottom line is prediction of disease status
• Definitive gold standard may not be available
• Including laboratory sources of error in training data is a problem
• There are metrological experiments that do not require a gold standard
The Role of Science
• Given valid training data, statisticians can proceed without scientific knowledge
• In the classification approach, scientific thought must go into specimen selection
• In the metrological approach, focus is on a property to be measured
• Scientific thought must go into the relation of the metrological property to biomarker goals

Statistics for Metrology
• Focus (as best one can) on the property to be measured, an interval- or ratio-scale variable
• Specify a baseline measurement protocol• Experiment with realizations of alternative
protocols• Optimize repeatability (at least) and then ask if the
measurement protocol is adequate for the purpose

Framework of Metrology
• Relation between property and protocol obtained scientifically or through realization
• Metrology explores faithfulness of realization before adequacy for the purpose
Property
Realization Protocol

Some Metrological Experiments
• Protocol development through classes of units known to differ in the property of interest
• Protocols linked to a scientific definition of the property of interest in such a way that all sources of error can be assessed (definitive methods)
• Sets of protocols that measure the same property but are based on different scientific principles (independent methods)

Aspects of Performance
• Repeatability• All manner of reproducibility
– Operator, equipment– Inter-laboratory
• Noise factors, effect of sample matrix• Calibration• Measurement assurance• Uncertainty components, type A and type B
uncertainties

Experimental Units(Reference Materials)
• Homogeneity (solution versus particles)
• Quantity (cost)
• Adaptable to high-throughput experiments
• Known value of the property of interest
• Classes with different values of the property of interest
From Univariate to Functional
• Carryover has been done for classification
• Extending measurement performance concepts to multivariate and functional responses is still a challenge
• Chemometrics is the key word for much of the literature in this area
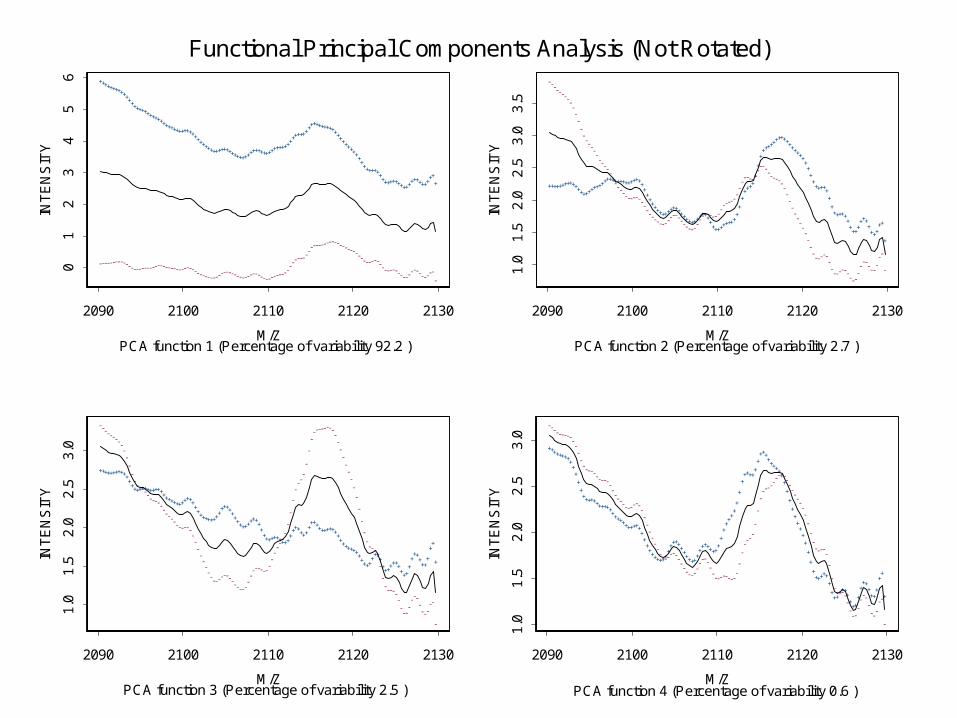
Functional Principal Components Analysis (Ramsay and Silverman)
• Metrologists like to look at the spread of a batch of measurements (outliers, more than one mode)
• For functional measurements, functional PCA provides a way to look at the spread
• Consider results of functional PCA on Petricoin’s Lancet…/Normal Healthy (SPLUS, Ramsay’s software)
• Main purpose is to illustrate metrological thinking

1800 1900 2000 2100 2200 2300
M/Z
05
1015
20
INT
EN
SIT
YLancet ... Normal Healthy SELDI-TOF Mass Spectra

2200 2220 2240 2260 2280 2300
M/Z
0.00
0.05
0.10
0.15
0.20
0.25
VA
LUE
OF
PC
CU
RV
E
Functional Principal Components Analysis
2200 2220 2240 2260 2280 2300
M/Z
-0.2
-0.1
0.0
0.1
VA
LUE
OF
PC
CU
RV
E
2200 2220 2240 2260 2280 2300
M/Z
-0.1
0.0
0.1
0.2
0.3
VA
LUE
OF
PC
CU
RV
E
2200 2220 2240 2260 2280 2300
M/Z
-0.1
00.
000.
100.
20
VA
LUE
OF
PC
CU
RV
E
Functional Principal Components Analysis

2200 2220 2240 2260 2280 2300
0.0
0.5
1.0
1.5
2.0
2.5
3.0
INT
EN
SIT
Y
+++++
+++
++++++++++
++++
+++++
++
+++++++++
++++++
++++++
+
+
+
+
+
+
+
++++
+
+
++
+
+
++
+
+++
+++++++++
+++++
+++++++++
+++++
++++++
++++
++++
+
+++
+++
+++
+
++
--------
----------
----
-----
--
---------
------
-----
---
-
--
-
-
----
-
----
------
-------
-------
-----------
------
------
------
----
--
-
---
-
--
M/Z
Rotated Functional Principal Components Analysis
2200 2220 2240 2260 2280 2300
0.0
0.5
1.0
1.5
2.0
INT
EN
SIT
Y
++++++++
++++++++++
++++
++
+++
++
+++++++++
++++++
+++
++++
+
+
+
+
+
+
+
+++
+
+
+++
+++
+
+++++
+
+++++
+++++
++++++
++++
+++++
+++++
+++++
++++
+
++
+
++
+
++
+
+
++
------
--
----------
----
--
---
--
---------
------
---
----
-
-
-
-
-
-
--
--
-
-
--
-
-
--
-
-----
-----
-------
---------
---
----
------
--
---
--
--
-
--
-
--
-
-
--
M/Z
2200 2220 2240 2260 2280 2300
0.0
0.5
1.0
1.5
2.0
INT
EN
SIT
Y
+++++
+++
+++++++
+++++++
++
+++
++
+++++++++
++++++
+++
++++
+
+
+
+
+
+
++++
+
+
++
+
+++
+
++++++
++++
++++
+++++
++++++++++
++++
++++++
++++++
+
++
+
++
+
+++
+
++
--------
----------
----
--
---
--
--------
---
----
---
----
-
-
-
-
-
-
----
-
-
--
-
---
-
-----
----
-------
-------
--------
-----
-----
----
-
--
-
--
-
-
-
-
-
--
M/Z
2200 2220 2240 2260 2280 2300
0.0
0.5
1.0
1.5
2.0
INT
EN
SIT
Y
++++++++
++++++++++
++++
++
+++
++
+++++++++
++++++
+++
++++
+
+
+
+
+
+
++++
+
+
++
+
++++
+++++
+
+++
+++++++
++++
++++++
+++++
++++
++++
++
+++
++
++
+
++
+
++
+
+
++
------
--
----------
----
--
---
--
-----
------
----
---
----
-
-
-
-
-
-
----
-
-
--
-
----
-----
----
-----
------
------
---
----
--------
----
-
--
-
--
-
--
-
-
--
M/Z
2090 2100 2110 2120 2130
PCA function 1 (Percentage of variability 92.2 )
01
23
45
6
INT
EN
SIT
Y
++++++++++++++++++++++++++++++++++++++++++++++++++++++++++++++++++
+++++++
+++++++
++++++++++++++++++++++++++++++++++++++
+++++++++
+
----------------------------------------------
-------------------------
----
------
--------------------------------------------
---
M/Z
Functional Principal Components Analysis (Not Rotated)
2090 2100 2110 2120 2130
PCA function 2 (Percentage of variability 2.7 )
1.0
1.5
2.0
2.5
3.0
3.5
INT
EN
SIT
Y
++++++++++++++++++++
++++++++++++++++
++++++++++
+++++++++++++++
+++++
++++++++++
+++
+++++
+++++++++++++
+++++++++
+++++++
++++
++++
++++
++
+
------------------
-----
-------------
----------
-------------------
----
----------
----------
------------------
----
------
-------
---
-
M/Z
2090 2100 2110 2120 2130
PCA function 3 (Percentage of variability 2.5 )
1.0
1.5
2.0
2.5
3.0
INT
EN
SIT
Y
++++++++++++++++++++++++++++++++
+++++++++++++
++++++
++++++++++
+++++++++++
+++++++
++++++++++++
++++++++++++
+++
++++
+++++++
++++
+++
+
++
+
------------------------
----------------------
------------------
--------
-
-
---
-
-
-
-----
-------------
-
-
-----
-
-
------
----
----
----
--
-
M/Z
2090 2100 2110 2120 2130
PCA function 4 (Percentage of variability 0.6 )
1.0
1.5
2.0
2.5
3.0
INT
EN
SIT
Y
+++++++++++++++++++++++++++++++++++
++++++++++
+++
++++++++
++++++++
++++++
++
+
+++++
+++++
+++++
+++++++++++
+++++
++++++
+++++++
++++
+++
+
++
+
------------------------
---------
-------------
----------
---
------------
--
----
--
-
----
-------
---------------
-
------
----
----
---
---
-
M/Z

Conclusion
• Producing large data sets has become easier except perhaps for selecting individuals with a particular disease status
• With scientific and statistical reasoning, the advances in experimentation technology can be used to speed biomarker development
• Statisticians have a role in formulating overall experimental strategy, allocating effort among different approaches