metro · metro fiscal year 2018 monthly performance report revenue • expense • ridership •...
TRANSCRIPT

METRO
Fiscal Year 2018
Monthly Performance Report
Revenue • Expense • Ridership • Performance
March 2018
(Second Quarter Fiscal Year-to Date)
4/12/2018

Section A Sales Tax Revenue
Section B Fare Revenue
Section C Grant and Interest & Miscellaneous Revenue
Section D Budget and Expense Summary
Section E Operating Expenses
March 2018 Budget vs. Actual
FY2018 YTD Budget vs. Actual
FY2018 YTD Major Variance Items
FY2018 YTD Operating Budget/Expenses by Department
Section F Capital and Debt Service Expenditures
General Mobility Transfers
Section G Ridership by Service Category
Section H Performance Statistics
Performance Statistics Notes
Section I Balance Sheet
Section J Quarterly Budget Change Requests
March 2018
MONTHLY PERFORMANCE REPORT
Table of Contents

Budget Actual Variance %
October 55.7 50.1 (5.6) (10.0%)
November 64.4 62.9 (1.6) (2.4%)
December 56.6 64.2 7.7 13.6%
January 56.1 60.6 4.6 8.1%
February 77.4 77.7 0.4 0.5%
March 54.6 56.7 2.1 3.8%
April 54.2 55.1 1.0 1.8%
May - - - 0.0%
June - - - 0.0%
July - - - 0.0%
August - - - 0.0%
September - - - 0.0%
FY2018 YTD 419.0$ 427.4$ 8.4$ 2.0%
Prior Year Current Year Variance %
October 52.4 50.1 (2.3) (4.4%)
November 61.2 62.9 1.6 2.7%
December 52.3 64.2 11.9 22.7%
January 53.8 60.6 6.9 12.8%
February 70.4 77.7 7.4 10.5%
March 54.3 56.7 2.4 4.3%
April 55.2 55.1 (0.0) (0.1%)
May - - - 0.0%
June - - - 0.0%
July - - - 0.0%
August - - - 0.0%
September - - - 0.0%
FY2018 YTD 399.7$ 427.4$ 27.7$ 6.9%
MONTHLY PERFORMANCE REPORT
April 2018
Sales Tax Revenue
Sales Tax revenue for the month of April 2018 is $1.0 million or 1.8% over estimates.
Sales Tax revenue for the year-to-date through April 2018 of $427.4 million is $8.4 million or 2.0% over estimates.
Total FY2018 Sales Tax budget is $729.2 million
($ millions)
Prior Year vs. Current Year
($ millions)
Budget to Actual FY2018
$20.0
$30.0
$40.0
$50.0
$60.0
$70.0
$80.0
OCT NOV DEC JAN FEB MAR APR MAY JUN JUL AUG SEP
mill
ion
s
FY2018 Budget FY2018 Actual FY2017 Actual
Section A Page 3

Budget Actual Variance %
October 6.0 5.5 (0.5) (8.3%)
November 5.5 5.4 (0.1) (1.8%)
December 5.6 4.9 (0.7) (12.5%)
January 5.6 5.7 0.1 1.8%
February 5.4 5.5 0.1 1.9%
March 6.8 6.4 (0.4) (5.9%)
April - - - 0.0%
May - - - 0.0%
June - - - 0.0%
July - - - 0.0%
August - - - 0.0%
September - - - 0.0%
FY2018 YTD 34.8$ 33.3$ (1.5)$ (4.3%)
Prior Year Current Year Variance %
October 5.7 5.5 (0.2) (3.5%)
November 5.0 5.4 0.4 8.0%
December 5.1 4.9 (0.2) (3.9%)
January 5.6 5.7 0.1 1.8%
February 5.6 5.5 (0.1) (1.8%)
March 6.9 6.4 (0.5) (7.2%)
April - - - 0.0%
May - - - 0.0%
June - - - 0.0%
July - - - 0.0%
August - - - 0.0%
September - - - 0.0%
FY2018 YTD 33.9$ 33.3$ (0.6)$ (1.8%)
Fare Revenue
March 2018
MONTHLY PERFORMANCE REPORT
Fare Revenue for the month of March 2018 of $6.4 million is $0.4 million or 5.9% under budget.
Fare Revenue for the year-to-date through March 2018 of $33.3 million is $1.5 million or 4.3% under budget.
Total FY2018 Fare Revenue budget is $68.7 million
Budget to Actual FY2018
($ millions)
($ millions)
Prior Year vs. Current Year
$4.0
$4.5
$5.0
$5.5
$6.0
$6.5
$7.0
$7.5
OCT NOV DEC JAN FEB MAR APR MAY JUN JUL AUG SEP
mill
ions
FY2018 Budget FY2018 Actual FY2017 Actual
Section B Page 4

Budget Actual Variance %
October 6.3 2.8 (3.5) (55.6%)
November 6.3 0.8 (5.5) (87.3%)
December 6.3 0.4 (5.9) (93.7%)
January 6.3 0.4 (5.9) (93.7%)
February 6.3 0.4 (5.9) (93.7%)
March 6.3 0.5 (5.8) (92.1%)
April - - - 0.0%
May - - - 0.0%
June - - - 0.0%
July - - - 0.0%
August - - - 0.0%
September - - - 0.0%
FY2018 YTD 38.1$ 5.4$ (32.7)$ (85.8%)
Budget Actual Variance %
October 3.4 0.2 (3.2) (94.1%)
November 3.4 1.1 (2.3) (67.6%)
December 3.4 0.9 (2.5) (73.5%)
January 3.4 0.3 (3.1) (91.2%)
February 3.4 0.3 (3.1) (91.2%)
March 3.4 0.6 (2.8) (82.4%)
April - - - 0.0%
May - - - 0.0%
June - - - 0.0%
July - - - 0.0%
August - - - 0.0%
September - - - 0.0%
FY2018 YTD 20.5$ 3.5$ (17.0)$ (82.9%)
Service Related Grant Revenue for the year-to-date through March 2018 of $5.4 million is $32.7 million
or 85.8% under budget.
Capital Grant Revenue for the year-to-date through March 2018 of $3.5 million is $17.0 million under
budget.
Total FY2018 Capital Grant budget is $52.2 million
($ millions)
Capital Grant Revenue
Service Related Grant Revenue for the month of March 2018 of $0.5 million is $5.8 million or 92.1%
under budget.
MONTHLY PERFORMANCE REPORT
March 2018
Service Related Grant Revenue
Total FY2018 Service Related Grant budget is $76.1 million($ millions)
Section C Page 5

Budget Actual Variance %
October 1.2 1.1 (0.1) (8.3%)
November 1.1 1.4 0.3 27.3%
December 1.0 1.6 0.6 60.0%
January 1.1 1.0 (0.1) (9.1%)
February 1.2 1.2 0.0 0.0%
March 1.7 2.0 0.3 17.6%
April - - 0.0 0.0%
May - - 0.0 0.0%
June - - 0.0 0.0%
July - - 0.0 0.0%
August - - 0.0 0.0%
September - - 0.0 0.0%
FY2018 YTD 7.4$ 8.5$ 1.2$ 14.9%
$ millions % of Total $ millions % of Total
Interest Income 3.2 37.5% 0.6 32.0%
HOT Lanes Revenue 3.5 41.7% 0.9 45.3%
Inter Government Revenue 0.0 0.0% 0.0 0.0%
Other 1.8 20.8% 0.5 22.7%
Total 8.5$ 100.0% 2.0$ 100.0%
Interest & Miscellaneous Revenue
MONTHLY PERFORMANCE REPORT
March 2018
Total FY2018 Interest & Miscellaneous Revenue budget is $19.2 million
Composition of Interest & Miscellaneous Revenue
Interest & Misc. Revenue for the year-to-date of $8.5 million through March 2018 is $1.2 million or 14.9% over
budget.
($ millions)
Year-to-Date Actual Current Month Actual
Section C Page 6

FY2018 Annual Operating Budget 620.1$
FY2018 YTD Operating Budget 292.0$
FY2018 Annual Capital Budget 217.7$
FY2018 YTD Capital Budget 119.8$
FY2018 Annual Debt Service Budget 97.0$
FY2018 YTD Debt Service Budget 47.4$
FY2018 Annual GMP Projected Allocation 176.8$
FY2018 YTD GMP Projected Allocation 88.8$
MONTHLY PERFORMANCE REPORT
March 2018
Budget Summary
($ millions)
-0.4%
$- $10 $20 $30 $40 $50
Debt Service
Budget Actual
-27.2%
-93.0%
$- $20 $40 $60 $80 $100
CIP Program
METRORail Completion
Budget Actual
1.0%
$- $15 $30 $45 $60 $75 $90
GMP Projection
Projected Allocation
-5.5%
$- $50 $100 $150 $200 $250 $300
Operating
Budget Actual
Section D Page 7

Comparison of Budget to Actual for the Month (March 2018)
FY18 Annual March March $ Variance % Variance
Budget Budget Actual
Labor & Fringe Benefits $ 359,497,801 $ 29,938,857 $ 29,158,119 $ (780,738) (2.6%)
Non-Labor 248,065,200 $ 20,378,984 $ 18,168,547 (2,210,437) (10.8%)
Subtotal Labor & Non-Labor 607,563,000 50,317,842 47,326,667 (2,991,175) (5.9%)
Contingency 12,500,000 - - - 0.0%
Total Operating Budget $ 620,063,000 $ 50,317,842 $ 47,326,667 $ (2,991,175) (5.9%)
Comparison of Budget to Actual Year-to-Date March 2018 (6 months)
FY18 Annual Year-to-Date Year-to-Date $ Variance % Variance
Payroll & Benefits Budget Budget Actual
Wages $ 139,513,082 $ 70,247,314 $ 69,086,470 $ (1,160,844) (1.7%)
Union Fringe Benefits 81,746,143 37,945,372 37,154,723 (790,650) (2.1%)
Subtotal Union Labor 221,259,226 108,192,686 106,241,192 (1,951,494) (1.8%)
Salaries and Non-Union Wages 104,005,445 50,923,036 47,477,327 (3,445,709) (6.8%)
Non-Union Fringe Benefits 44,861,800 22,120,971 21,222,495 (898,477) (4.1%)
Subtotal Non-Union Labor 148,867,245 73,044,007 68,699,822 (4,344,185) (5.9%)
Allocation to Capital & GMP (10,628,670) (5,314,335) (3,975,773) 1,338,562 25.2%
Subtotal Labor and Fringe Benefits 359,497,801 175,922,358 170,965,242 (4,957,117) (2.8%)
Materials & SuppliesServices 61,942,056 26,055,259 18,631,611 (7,423,649) (28.5%)
Materials and Supplies 30,971,714 14,919,258 14,035,885 (883,374) (5.9%)
Fuel and Utilities 34,870,436 16,421,073 15,594,630 (826,443) (5.0%)
127,784,205 57,395,591 48,262,126 (9,133,465) (15.9%)
AdministrationCasualty and Liability 4,354,609 2,132,741 2,198,949 66,208 3.1%
Purchased Transportation 102,232,281 50,662,826 49,007,396 (1,655,430) (3.3%)
Leases, Rentals and Misc. 14,324,188 6,245,594 5,589,898 (655,696) (10.5%)
Allocation to Capital & GMP - Non-Labor (630,084) (315,042) - 315,042 (100.0%)
120,280,994 58,726,119 56,796,243 (1,929,876) (3.3%)
Subtotal Non-Labor 248,065,200 116,121,710 105,058,369 (11,063,341) (9.5%)
Subtotal Labor and Non-Labor 607,563,000 292,044,068 276,023,610 (16,020,458) (5.5%)
Contingency 12,500,000 - - - 0.0%
Subtotal Contingency 12,500,000 - - - 0.0%
Total Operating Budget $ 620,063,000 $ 292,044,068 $ 276,023,610 $ (16,020,458) (5.5%)
Non-Budgeted Expense
Gain/ Loss Disposal - - (178,368) (178,368) 0.0%
Grand Total $ 620,063,000 $ 292,044,068 $ 275,845,243 $ (16,198,825) (5.6%)
MONTHLY PERFORMANCE REPORT
(favorable)/unfavorable
(favorable)/unfavorable
Operating Expenses
March 2018
Operating Expenses for the month of March 2018 of $47.3 million are $3.0 million or 5.9% under budget.
Operating Expenses year-to-date of $276.0 million through March 2018 are $16.0 million or 5.5% under budget.
Section E Page 8

Expense Type FY2018 Budget FY2018 Actual
Payroll & Benefits
Union Labor 108,192,686 106,241,192 $ (1,951,494)
(3,010,000)
(1,848,000)
(564,000)
(395,000)
Offset by
Pension Union - DC 253,000
1,599,000
1,923,000
Non-Union Labor 73,044,007 68,699,822 $ (4,344,185)
(4,198,000)
(688,000)
92,000
491,000
Materials & Supplies 57,395,591 48,262,126 $ (9,133,465)
Services
(1,437,000)
(823,000)
(630,000)
(581,000)
(466,000)
(384,000)
(373,000)
(336,000)
(154,000)
(100,000)
(916,000)
(861,000)
(370,000)
Continued on Next Page
Legal mainly due to lower than expected legal fees (-$236,000) and legislative coordination
(-$230,000).
Human Resources due to underrun in contract management (-$262,000) and contract
employment services (-$111,000).
General underspending in other areas Authority wide not mentioned above
Savings in base salaries
Offset by
Salaried overtime mainly driven by vacancies
Retiree Health Benefits
Information Technology due to underrun in equipment repairs & maintenance
(-$587,000) and contract management (-$236,000).
Communications due to underrun in advertising.
Facility Maintenance due to underspending in building & grounds maintenance
(-$558,000), BOF maintenance cost (-$533,000), custodial services (-$182,000) and security
services (-$164,000).
Operations due to underrun in contract management (-$368,000) and building & grounds
maintenance (-$262,000).
Union Vacancies - Fringes driven by underrun in FICA wages
Savings in healthcare
(under budget) / over budget
Wages & Fringe Benefits - savings from bus operator vacancies offset with workers comp
Wages & Fringe Benefits - savings from primarily mechanic, technician, cleaners
Underrun in health benefit due to lower than expected health care expense & longevity pay
Overtime primarily in METRO rail, bus maintenance & public facilities
Overtime in bus transportation to cover routine vacancies
MONTHLY PERFORMANCE REPORT
March 2018
Major Operating Budget Variance Items - Categories with major variances
Fiscal Year 2018
$ Variance
Support services and other services
Underspending in education and training throughout the Authority (excludes bus operator and
other Operations staff related training)
Planning due to underrun in contract management.
Engineering and Capital Projects mostly due to underruns in contract management.
Safety due to underrun in contract management
Finance due to underspending in contract management.
Other miscellaneous services type expenses mostly contractual and required on an as
needed basis
UpdatedUpdated
Section E Page 9
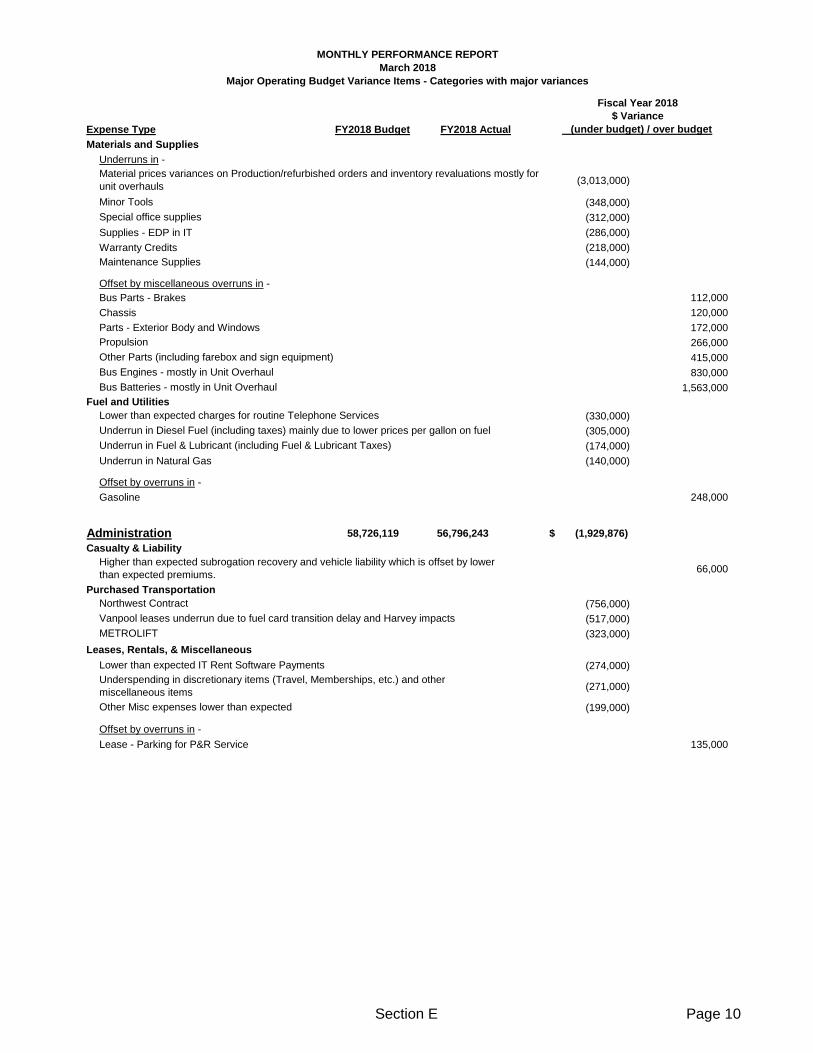
Expense Type FY2018 Budget FY2018 Actual
Materials and Supplies
Underruns in -
(3,013,000)
(348,000)
(312,000)
Supplies - EDP in IT (286,000)
Warranty Credits (218,000)
(144,000)
Offset by miscellaneous overruns in -
Bus Parts - Brakes 112,000
Chassis 120,000
Parts - Exterior Body and Windows 172,000
266,000
415,000
830,000
1,563,000
Fuel and Utilities
(330,000)
(305,000)
(174,000)
Underrun in Natural Gas (140,000)
Offset by overruns in -
Gasoline 248,000
Administration 58,726,119 56,796,243 $ (1,929,876)
Casualty & Liability
66,000
Purchased Transportation
(756,000)
(517,000)
(323,000)
Leases, Rentals, & Miscellaneous
(274,000)
(271,000)
(199,000)
Offset by overruns in -
Lease - Parking for P&R Service 135,000
Lower than expected charges for routine Telephone Services
MONTHLY PERFORMANCE REPORT
March 2018
Major Operating Budget Variance Items - Categories with major variances
Fiscal Year 2018
$ Variance
Propulsion
Other Parts (including farebox and sign equipment)
Maintenance Supplies
Minor Tools
Vanpool leases underrun due to fuel card transition delay and Harvey impacts
Northwest Contract
(under budget) / over budget
Special office supplies
Material prices variances on Production/refurbished orders and inventory revaluations mostly for
unit overhauls
Underrun in Fuel & Lubricant (including Fuel & Lubricant Taxes)
Higher than expected subrogation recovery and vehicle liability which is offset by lower
than expected premiums.
Bus Engines - mostly in Unit Overhaul
Bus Batteries - mostly in Unit Overhaul
Underrun in Diesel Fuel (including taxes) mainly due to lower prices per gallon on fuel
METROLIFT
Lower than expected IT Rent Software Payments
Underspending in discretionary items (Travel, Memberships, etc.) and other
miscellaneous items
Other Misc expenses lower than expected
UpdatedUpdated
Section E Page 10

--Current Month--
Department Annual Budget Budget Expense Variance Variance
3,569 Oper, Public Safety, & Cust Service 455,924,140 225,834,500 218,803,414 (7,031,086) (249,068)
3,121 Operations 414,950,997 206,180,534 201,118,355 (5,062,179) (43,026)
328 METRO Police 26,362,579 12,644,008 11,308,951 (1,335,057) (149,765)
42 Safety 8,690,303 4,109,117 3,746,874 (362,243) (60,453)
69 Customer Services 4,679,935 2,286,526 2,046,616 (239,909) 2,258
9 EVP Oper Pub Safety & Cust Service 1,240,327 614,315 582,618 (31,697) 1,918
240 Administration 57,019,509 29,885,680 27,150,019 (2,735,661) (1,567,311)
74 IT 23,452,942 13,187,661 11,227,664 (1,959,997) (492,709)
42 Human Resources 21,530,876 10,702,793 10,273,568 (429,225) (1,009,742)
119 Procurement & Materials 11,093,276 5,540,453 5,219,299 (321,154) (52,120)
5 EVP, Administration 942,415 454,773 429,488 (25,285) (12,740)
243 Planning, Engineer, & Construction 42,151,654 20,277,424 17,511,201 (2,766,223) (606,242)
177 Facilities Maint 32,628,675 15,394,506 13,400,727 (1,993,779) (616,091)
37 Planning 8,144,872 4,072,722 3,735,651 (337,071) 20,373
27 Engineering & Cap Project 1,236,377 742,307 368,352 (373,955) 5,306
2 EVP PE&C 141,730 67,889 6,471 (61,418) (15,830)
80 Finance 10,833,063 5,312,565 4,631,581 (680,984) (76,502)
76 Finance 9,872,858 4,908,323 4,334,912 (573,411) (70,651)
4 CFO 960,205 404,242 296,669 (107,573) (5,851)
18 Govt & Public Affairs 3,208,989 1,551,752 1,150,480 (401,273) (5,456)
10 Public Engagement 1,728,451 762,692 635,717 (126,975) (16,857)
5 Ridership & Client Services 1,010,884 539,161 326,011 (213,150) 10,768
3 Gov't Affairs 469,654 249,899 188,752 (61,148) 633
18 Legal 5,547,379 2,772,783 2,107,603 (665,180) (59,340)
34 Communications 18,630,718 3,930,376 2,619,045 (1,311,330) (307,823)
2 EVP, Communications 273,192 127,992 133,956 5,964 1,417
7 Press Office 689,441 329,522 318,779 (10,743) 38,566
25 Marketing & Corporate Communication 17,668,085 3,472,862 2,166,310 (1,306,552) (347,806)
13 Executive and Board 2,793,507 1,366,116 1,238,790 (127,326) (13,343)
11 Audit 1,573,529 781,801 659,517 (122,283) (102,055)
3 Office of Innovation 604,208 323,118 151,960 (171,158) (6,816)
Non Departmental 9,276,305 7,954 - (7,954) 2,782
President & CEO Contingency 12,500,000 - - - -
Other (MTA Revenue/Expense) - - - - -
4,229 Grand Total 620,063,000 292,044,068 276,023,610 (16,020,458) (2,991,175)
MONTHLY PERFORMANCE REPORT
March 2018
Total Net Operating Budget / Expenses by Department
Authorized
EOY
Headcount
-----------------------Year-to-Date-------------------- UPDATED
Section E Page 11

-----------------------Year-to-Date--------------------
Department Budget Expense Variance Budget Expense Variance
Operations, Public Safety and Customer Service 225,834,500 218,803,414 (7,031,086) 221,445,673 215,449,159 (5,996,514)
Operations 206,180,534 201,118,355 (5,062,179) 203,137,863 197,448,611 (5,689,252)
EVP Oper Pub Safety & Cust Serv 614,315 582,618 (31,697) 572,446 569,615 (2,831)
METRO Police 12,644,008 11,308,951 (1,335,057) 11,255,289 11,713,579 458,290
Safety 4,109,117 3,746,874 (362,243) 4,007,526 3,520,263 (487,263)
Customer Service 2,286,526 2,046,616 (239,909) 2,472,550 2,197,091 (275,459)
Administration 29,885,680 27,150,019 (2,735,661) 28,583,387 25,394,352 (3,189,035)
EVP, Administration 454,773 429,488 (25,285) 314,487 226,472 (88,015)
IT 13,187,661 11,227,664 (1,959,997) 12,192,530 10,437,423 (1,755,106)
Human Resources 10,702,793 10,273,568 (429,225) 10,772,416 9,740,812 (1,031,604)
Procurement & Materials 5,540,453 5,219,299 (321,154) 5,303,954 4,989,645 (314,309)
Planning, Engineering and Construction 20,277,424 17,511,201 (2,766,223) 17,976,322 15,698,247 (2,278,075)
EVP PE&C 67,889 6,471 (61,418) 20,622 39,125 18,503
Engineering & Cap Project 742,307 368,352 (373,955) 21,395 261,248 239,853
Planning 4,072,722 3,735,651 (337,071) 3,153,892 2,273,200 (880,692)
Facilities Maintenance 15,394,506 13,400,727 (1,993,779) 14,780,413 13,124,674 (1,655,739)
Finance 5,312,565 4,631,581 (680,984) 5,087,074 4,415,113 (671,960)
Finance 4,908,323 4,334,912 (573,411) 4,780,691 4,212,142 (568,548)
CFO 404,242 296,669 (107,573) 306,383 202,971 (103,412)
Gov't & Public Affairs 1,551,752 1,150,480 (401,273) 926,633 756,954 (169,679)
Public Engagement 762,692 635,717 (126,975) 676,259 564,347 (111,912)
Ridership & Client Services 539,161 326,011 (213,150) N/A N/A N/A
Gov't Affairs 249,899 188,752 (61,148) 250,374 192,607 (57,766)
Legal 2,772,783 2,107,603 (665,180) 2,104,908 2,311,385 206,477
Communications 3,930,376 2,619,045 (1,311,330) 4,248,243 2,624,347 (1,623,896)
EVP, Communications 127,992 133,956 5,964 N/A N/A N/A
Press Office 329,522 318,779 (10,743) 425,553 418,757 (6,796)
Marketing & Corporate Communication 3,472,862 2,166,310 (1,306,552) 3,822,690 2,205,590 (1,617,100)
Executive & Board 1,366,116 1,238,790 (127,326) 1,071,017 911,305 (159,712)
Audit 781,801 659,517 (122,283) 774,015 659,768 (114,247)
Office of Innovation 323,118 151,960 (171,158) 326,644 264,883 (61,761)
Contingency - - - - - -
Non-Departmental 7,954 - (7,954) - - -
Other MTA Revenue / Expense - - - - 199,618 199,618
TOTAL NET OPERATING 292,044,068$ 276,023,610$ (16,020,458)$ 282,543,916$ 268,685,131$ (13,858,785)$
--------------------Year-to-Date----------------
MONTHLY PERFORMANCE REPORT
March 2018
Total Net Operating Budget / Expenses by Department
as of the end of March 2018 vs. March 2017
March 2018 March 2017 Updated
Section E Page 12

Capital BudgetFY2018
Annual
Budget Budget Actual $ % Budget Actual $ %
51.5$ 4.4$ 0.5$ (3.9)$ (88.6%) 25.7$ 1.8$ (23.9)$ (93.0%)
166.2$ 9.1$ 11.2$ 2.1$ 23.1% 94.1$ 68.5$ (25.6)$ (27.2%)
217.7$ 13.6$ 11.7$ (1.9)$ (14.0%) 119.8$ 70.3$ (49.5)$ (41.3%)
Debt Service Budget
FY2018
Annual
Budget Budget Actual $ % Budget Actual $ %
97.0$ 7.7$ 7.7$ (0.0)$ (0.0%) 47.4$ 47.2$ (0.2)$ (0.4%)
General Mobility Transfers
FY2018
Annual
Projection Projection Allocation $ % Projection Allocation $ %
176.8$ 13.3$ 13.5$ 0.2$ 1.5% 88.8$ 89.7$ 0.9$ 1.0%
Month of March 2018
Variance
Funds allocated to the General Mobility Fund totaling $89.7 million for the year-to-date through March 2018 are $0.9 million or 1.0% more than the amount projected.
Total Capital
Debt Service
General Mobility
General Mobility Program Projections
Projected Funding vs. Actual Allocation - Month and Fiscal Year-to-Date
Debt Service expenses for the year-to-date through March 2018 of $47.2 million is $0.2 million under budget.
MONTHLY PERFORMANCE REPORT
March 2018
Capital, and Debt Service Expenses
Budget vs. Actual - Month and Fiscal Year-to-Date
($ millions)
Month of March 2018 Fiscal Year to Date
Month of March 2018 Fiscal Year to Date
Variance Variance
Variance Variance
Fiscal Year to Date
Variance
($ millions)
METRORail Completion expenses for the year-to-date through March 2018 of $1.8 million are $23.9 million or 93.0% under budget.
Other Capital Improvement Program expenses for the year-to-date through March 2018 of $68.5 million are $25.6 million or 27.2% under budget.
METRORail Completion
Capital Improvement Program
Section F Page 13

YTD % Change
Mar-18 Mar-17 Mar-18 Mar-18
Service Category Mar-17 Mar-18 vs. YTD YTD vs.
Boardings Boardings Mar-17 Boardings Boardings Mar-17
Fixed Route Services
Local Network
Local Bus 5,091,151 5,123,729 0.6% 29,501,650 29,548,615 0.2%
METRORail
Red (North) Line 1,839,621 1,660,016 (9.8%) 8,108,688 7,859,752 (3.1%)
Green (East) Line 122,117 132,240 8.3% 569,112 736,768 29.5%
Purple (Southeast) Line 140,098 151,847 8.4% 747,655 910,007 21.7%
METRORail (all lines) 2,101,836 1,944,103 (7.5%) 9,425,455 9,506,527 0.9%
METRORail-Bus Bridge 0 490 0.0% 74,905 17,843 (76.2%)
METRORail total 2,101,836 1,944,593 (7.5%) 9,500,360 9,524,370 0.3%
Subtotal Local Network 7,192,987 7,068,322 (1.7%) 39,002,010 39,072,985 0.2%
Commuter
Park & Ride 722,767 658,263 (8.9%) 3,898,198 3,726,103 (4.4%)
Subtotal Fixed Route Service 7,915,754 7,726,585 (2.4%) 42,900,208 42,799,088 (0.2%)
Special Events 200,657 162,457 (19.0%) 223,220 202,881 (9.1%)
Total Fixed Route 8,116,411 7,889,042 (2.8%) 43,123,428 43,001,969 (0.3%)
Customized Bus Services
METROLift 171,547 174,177 1.5% 953,002 960,684 0.8%
METRO STAR Vanpool 185,965 167,503 (9.9%) 1,022,385 950,773 (7.0%)
Internal Service 0 44 0.0% 135 68 0.0%
Subtotal Customized Bus 357,512 341,724 (4.4%) 1,975,522 1,911,525 (3.2%)
HOV/HOT Carpools, Vanpools,
and Non-METRO Buses2,520,984 2,273,062 (9.8%) 12,922,674 12,426,874 (3.8%)
Total System 10,994,907 10,503,828 (4.5%) 58,021,624 57,340,368 (1.2%)
MONTHLY PERFORMANCE REPORT
March 2018
Ridership by Service Category
Section G Page 14

METRORail ridership year-to-date through March 2018 of 9.5 million is 0.3% greater than last year.
Fixed Route ridership is reported on the same basis as in the National Transit Database
MONTHLY PERFORMANCE REPORT
March 2018
Ridership by Service Category
The Special Events category of ridership reflects customer service oriented short-term additional motor bus
service provided for events at Reliant Park such as football games and RODEO Houston.
Total fixed route ridership, excluding special events, for the year-to-date through March 2018 of 42.8 million is 0.1 million or
0.2% less than last year.
Total fixed route ridership, excluding special events, for the month of March 2018 of 7.7 million is 0.2 million or 2.4% less
than last year.
METRORail ridership for the month of March 2018 of 1.9 million is 7.5% less than last year.
0.0
2.0
4.0
6.0
8.0
10.0
12.0
OCT NOV DEC JAN FEB MAR APR MAY JUN JUL AUG SEP
Millio
ns
Fixed Route and Total System RidershipFY2017 - FY2018
FY2017 in Blue FY2018 in Green
Fixed Route Ridership
Total System Ridership
Section G Page 15

Current FY2018 FY2018
Month YTD YTD
SAFETY & SECURITY OCT NOV DEC JAN FEB MAR APR MAY JUN JUL AUG SEP Target Actual GOAL
Bus Accidents (Includes METROLift) 48 30 49 43 54 53 0 0 0 0 0 0 56 277 313
Bus Accidents per 100,000 vehicle miles 0.76 0.51 0.82 0.73 0.95 0.82 1.20 0.77 1.20
Rail Accidents 9 15 8 11 6 12 0 0 0 0 0 0 8 61 51
Rail Accidents per 100,000 vehicle miles 2.92 4.86 2.60 3.72 2.13 3.67 2.80 3.33 2.80
Major Security Incidents - total 76 44 36 34 25 43 0 0 0 0 0 0 70 258 420
Major Security Incidents per 100,000 boardings 0.726 0.460 0.411 0.384 0.272 0.409 #DIV/0! #DIV/0! #DIV/0! #DIV/0! #DIV/0! 0.98 0.450 0.98
Major Security Incidents - METRO properties 51 14 25 26 19 32 0 0 0 0 0 0 28 167 165
Major Security Incidents per 100,000 boardings 0.487 0.146 0.285 0.294 0.207 0.305 #DIV/0! #DIV/0! #DIV/0! #DIV/0! #DIV/0! 0.40 0.291 0.40
Current FY2018 FY2018
Month YTD YTD
CUSTOMER SERVICE OCT NOV DEC JAN FEB MAR APR MAY JUN JUL AUG SEP Target Actual GOAL
Complaint Contacts per 100,000 Boardings 17.28 15.45 18.42 15.82 16.76 15.50 #DIV/0! #DIV/0! #DIV/0! #DIV/0! #DIV/0! #DIV/0! 20.00 16.51 20.00
Commendations 375 281 274 279 294 276 - - - - - - 308 1,779 1848
Average Call Center Answer Delay (Sec.) 108 140 73 103 68 58 - - - - - 105 92 105
• Complaint contacts per 100,000 boardings met the goal for the month and the year-to-date.
• The number of commendations did not meet the goal for the month or the year-to-date.
• The average call center answer delay met the goal for the month and the year-to-date.
Safety & Security
MONTHLY PERFORMANCE REPORT
March 2018
Performance Statistics
Fiscal Year 2018
Benchmark MissedBenchmark Met
Customer Service
• The number of bus accidents met the safety goal for the month and the year-to-date.
• The number of rail accidents did not meet the safety goal for the month or the year-to-date.
• Total major security incidents met the benchmark for the month and the year-to-date.
• Major security incidents on METRO properties did not meet the benchmark for the month or the year-to-date.
≤
≤
≤ ≤
≤
≤
≤
≤
≤
≤
≤
≤
≤
≤
≤
< <
< <
≥ ≥
≤
Section H Page 16

Current FY2018 FY2018
Month YTD YTD
SERVICE & RELIABILITY OCT NOV DEC JAN FEB MAR APR MAY JUN JUL AUG SEP Target Actual GOAL
On-Time Performance
Local Bus 73.7% 73.7% 74.1% 75.1% 75.4% 74.9% 75% 74.5% 75%
Park & Ride 76.9% 76.4% 75.4% 76.4% 77.1% 76.1% 0.0% 0.0% 0.0% 0.0% 0.0% 0.0% 75% 76.4% 75%
Weighted Average Bus 75.0% 74.8% 74.6% 75.6% 76.1% 75.4% 75% 75.3% 75%
METROLift 88.8% 90.9% 91.7% 92.6% 90.9% 89.9% 0.0% 0.0% 0.0% 0.0% 0.0% 0.0% 90% 90.8% 90%
Rail - Red Line OTP 78.8% 79.0% 74.6% 87.1% 90.8% 80.3% 90% 82.0% 90.0%
Rail - South East Purple Line OTP 96.6% 98.0% 98.8% 96.9% 98.3% 98.8% 95% 97.8% 95.0%
Rail - East End Green Line OTP 96.3% 97.8% 98.2% 98.4% 98.9% 99.0% 95% 98.0% 95.0%
MDBF (Mean Distance Between
Mechanical Failures) - All Buses10,065 12,490 13,045 12,968 12,651 13,157 9,700 12,277 9,375
MDBF (Mean Distance Between
Mechanical Failures) - METROLift22,705 28,567 34,535 15,784 23,308 27,004 20,000 24,011 20,000
MDBSI (Mean Distance Between Service
Interruptions) - METRORail38,547 22,053 18,075 15,575 16,573 19,257 15,000 19,885 15,000
I-45 North HOV 53 54 54 54 53 54 45 54 45
I-45 South HOV 63 52 53 53 52 54 45 55 45
US-290 HOV 56 56 55 55 56 58 45 56 45
US-59 North HOV 60 62 61 62 61 62 45 61 45
US-59 South HOV 49 50 53 51 49 52 45 51 45
On-Time Performance
MONTHLY PERFORMANCE REPORT
March 2018
Performance Statistics
Benchmark Met Benchmark Missed
Fiscal Year 2018
Average Peak HOT Lanes Speed (mile per hour)
• On-time performance for Local Bus routes did not meet the minimum performance standard for the month or the year-to-date.
• On-time performance for Park & Ride routes met the minimum performance standard for the month and the year-to-date.
• On-time performance for METROLift did not meet the minimum performance standard for the month but did for the year-to-date.
• Rail (red line) did not meet the benchmark for the month or the year-to-date.
• Rail (purple line) met the benchmark for both the month and the year-to-date.
• The Mean Distance Between Service Interruptions (MDBSI) for METRORail met the minimum performance standard for the month and the year-to-date.
METRORail On-Time Performance
Service Reliability
HOT Lane Average Speed
• The average peak speed for all HOT Lanes met the monthly and year-to-date goals.
• The Mean Distance Between Mechanical Failures (MDBF) for All Buses met the minimum performance standards for the month and the year-to-date.
• The Mean Distance Between Mechanical Failures (MDBF) for METROLift met the minimum performance standard for the month and the year-to-date.
• Rail (green line) met the benchmark for both the month and the year-to-date.
≥
≥
≥
≥
≥
≥
≥
≥
≥ ≥
≥
≥ ≥
≥
≥≥
≥
≥
≥
≥
≥
≥
≥
≥
≥
≥
≥
≥
≥
≥
Section H Page 17
MONTHLY PERFORMANCE REPORT
March 2018
Performance Statistic Definitions
Bus and Rail Accidents - An accident is a transit incident with passenger injuries that require immediate medical treatment away from the scene or a collision between a
revenue vehicle and an object such that the amount of damage exceeds $1,000. Bus accidents (which include METROLift) and rail accidents are reported separately and
in terms of the absolute number of accidents and the relative number of accidents per 100,000 vehicle miles. Rail accidents reflect collisions between METRORail and
other vehicles, pedestrians, or bicyclists. This definition has been revised beginning in FY2011 to include pedestrian accidents.
Major Security Incidents - The total Major Security Incidents is based on two industry standards: the FBI Uniform Crime Report and the National Transit Database
(NTD) Report issued by the Federal Transit Administration (FTA). The eight (8) categories included are: homicide, forcible rape, robbery, aggravated assault, burglary,
larceny and theft, motor vehicle theft and arson. This metric is reported both in terms of the absolute number of incidents and the number of incidents per 100,000
boardings.
Major Security Incidents - METRO Properties - The total Major Security Incidents - METRO Properties is the number of incidents that occur at Park & Ride lots, Transit
Centers, on-board buses and trains and on Light Rail Vehicle (LRV) platforms. This metric is reported both in terms of the absolute number of incidents and the number
of incidents per 100,000 boardings.
On-Time Performance (OTP) - A local bus is considered on-time if it does not leave early and is within a five (5) minute window after the scheduled departure time. A
Park & Ride bus is considered on-time if it does not depart early (except in the morning when a bus can leave from a Park & Ride lot when full) and is within a five (5)
minute window after the scheduled departure time, with measurements during peak hours. OTP is measured by the IVOMS system which calculates data to the second,
and the five (5) minute window is defined as anything less than six (6) minutes. For METRORail, a train departing from the beginning of the line or arriving at the end of
the line less than five (5) minutes after the scheduled time is considered on-time. For METROLift, a trip is considered on-time if the vehicle arrives within 30 minutes of
the scheduled pick-up time and no later than the appointment time.
Mean Distance Between Mechanical Failures (MDBF) - MDBF reflects any mechanical issue encountered during operation of the vehicle in revenue service that
requires a maintenance action resulting from a mechanical failure. Mechanical failures include warranty and fleet defects but exclude accidents.
Average Peak HOT Lane Speed - HOT Lane speed is based on an average of measurements conducted during the AM and PM high-volume commuter periods.
METRO's 45 mph benchmark is based on Federal statute 23 USC 166: HOV facilities, which sets 45 mph as a minimal acceptable rate of speed.
Mean Distance Between Service Interruptions (MDBSI) - Measures total revenue service miles traveled by Light Rail Vehicles (LRVs) between service interruptions
that delay LRVs for one minute or more due to mechanical failures.
Complaint Contacts - Patrons may contact METRO’s Customer Care Center to express dissatisfaction with METRO Operations. Contacts made via telephone and over
the internet which result in a complaint record being generated in the Public Comment System are reported as the number of contacts per 100,000 boardings.
Commendations - Patrons may contact METRO's Customer Care Center to recognize, compliment or praise a METRO employee or the METRO organization for
exemplary work or performance. Contacts made via telephone, internet, email or mail which result in a commendation record being generated in the Public Comment
System are reported only on the basis of the absolute number of contacts received.
Average Call Center Answer Delay - METRO is committed to providing customers with accurate, customer-friendly bus and service information in a timely manner.
Customers may obtain bus information over METRO's website and by telephone using an interactive voice response system without speaking to a representative and with
no customer wait time. For those customers who prefer to speak with a representative, METRO's goal is to answer their calls in 105 seconds or less.
Section H Page 18

March 31, 2017 ($) March 31, 2018 ($) Change ($)Assets
Cash 12,503,656 1,773,002 (10,730,654)
Receivables 126,859,834 148,135,557 21,275,723
Inventory 34,068,086 35,768,390 1,700,304
Investments 390,221,390 397,928,398 7,707,009
Other Assets 9,170,251 8,589,393 (580,858)
Land & Improvements 355,168,194 362,231,927 7,063,733
Capital Assets, Net of Depreciation 2,658,885,862 2,541,133,728 (117,752,133)
Total Assets 3,586,877,273 3,495,560,395 (91,316,878)
Deferred Outflow of Resources 110,710,438 94,282,269 (16,428,168)
3,697,587,711 3,589,842,664 (107,745,046)
LiabilitiesTrade Payables 45,785,216 44,451,639 (1,333,577)
Accrued Payroll 29,890,307 29,319,204 (571,103)
Commercial Paper - - -
Debt Payable 1,249,325,925 1,267,110,920 17,784,995
Debt Interest Payable - - -
Pension and OPEB Liabilities 512,821,185 534,867,678 22,046,494
Other Liabilities 31,211,541 46,786,023 15,574,483
Total Liabilities 1,869,034,173 1,922,535,466 53,501,292
Deferred Inflow of Resources - - -
Net Assets - Retained Earnings 1,828,553,537 1,667,307,199 (161,246,339)
Total Liabilities and Net Assets 3,697,587,711 3,589,842,664 (107,745,046)
- - Note:
* A deferred outflow of resources is defined by the Governmental Accountability Standards Board as “a consumption of net assets by the government
that is applicable to a future reporting period,” and a deferred inflow of resources is defined as “an acquisition of net assets by the government that is
applicable to a future reporting period.”
The deferred outflow for FY2018 includes [1] Mark-to-Market (MTM) values of outstanding diesel fuel SWAP agreements at the fiscal year end
($3,805,801), [2] Non Union Pension Plan ($37,419,380), [3] Union Pension Plan ($40,135,541), and [4] Bonds ($12,921,547). These items will be
recognized as expenses in future periods to which they relate.
MONTHLY PERFORMANCE REPORT
March 2018
Balance Sheet
Section I Page 19

Date Type Description Amount
January-18Technical /
Administrative
Reallocation of Facilities Maintenance funds to relocate a fence at
METRO property located at 2401 Texas St.7,000
January-18Technical /
Administrative
Reallocation of Facilities Maintenance funds for parking lot
restriping project at West BOF tagged by Safety Dept43,000
January-18Technical /
Administrative
Reallocation of Bus Facilities funds to cover additional landscaping
services on the Amerimowers contract40,000
January-18Technical /
Administrative
Reallocation of Support Facilities funds to cover the Detention Pond
work5,000
January-18Technical /
AdministrativeReallocation of Operating Facilities funds to cover HVAC projects 29,000
January-18Technical /
Administrative
Reallocation of Operating Facilities funds to cover budget shortage
in Janitorial account due to additional services required for the
facility
7,000
February-18Technical /
Administrative
Reallocation of Bus Facilities funds to cover additional landscaping
services 34,000
February-18Technical /
Administrative
Reallocation of Facilities Maintenance HQ funds to cover parking lot
cleaning services30,000
February-18Technical /
Administrative
Reallocation of Engineering & Capital funds to correct a Purchase
Order and Internal Order issue related to R&M issues that may arise
on the SE, EE and DT lines that have not been accepted by the City
of Houston
126,376
February-18Technical /
Administrative
Reallocation of employees FY2018 salary from EVP, Administration
to State of Good Repair to correct a budget error66,860
February-18Technical /
Administrative
Reallocation of Facilities Maintenance funds to cover Fallbrook
Building Automation Upgrade45,000
February-18Technical /
Administrative
Funds reclassification of State of Good Repair, Sr Asset
Management Analyst position6,200
February-18Technical /
Administrative
Funds reclassification of Marketing, Advertising Account Executive
position5,710
February-18Technical /
Administrative
Reallocation of Facilities Maintenance - Kashmere BOF funds to
cover janitorial service2,600
February-18Technical /
Administrative
Reallocation of Facilities Maintenance contract services funds to the
furniture account20,000
February-18Technical /
Administrative
Reallocation of Facilities Maintenance funds to cover the recycling
contract with DSS9,000
February-18Technical /
Administrative
Respreads Facilities Maintenance - Field SC/CS funds to future
months to allow for the preparation of pending OWS cleaning and
pending roofing repair at FSC
23,000
February-18Technical /
Administrative
Reallocation of METROLift Moving Forward advertising funds from
Marketing to METROLift to align the budget with the correct fund
center
106,066
February-18Technical /
Administrative
Reallocation of Office of Innovation funds to allow for various
expenses incurred while hosting meetings and training sessions
throughout the year
5,000
February-18Technical /
Administrative
Reallocation of Preventative Maintenance CNG funds to warranty in
order to cover BAE Warranty Amortization142,500
February-18Technical /
Administrative
Reallocation of Facilities Maintenance Fallbrook BOF funds to cover
HVAC repairs3,000
February-18Technical /
Administrative
Reallocation of Information Technology funds to cover half the
budgeted salary of the new Information Security Specialist IV
position
32,450
February-18Technical /
Administrative
Reallocation of Jerome Gray's FY2018 salary from Press Office to
EVP, Communications to align with METRO reorganization241,633
February-18Technical /
Administrative
Respreads Facilities Maintenance funds for Buffalo Bayou to
September as METRO Police will not be moving to Buffalo Bayou
this fiscal year
495,000
February-18Technical /
Administrative
Reallocation of Wellness Programs funds to cover costs of a
Wellness Leave Coordinator PSA6,432
March-18Technical /
Administrative
Reallocation of Finance funds to move education, training, travel
and membership budgets to align with employees current fund
center
3,000
March-18Technical /
Administrative
Reallocation of Facilities Maintenance West BOF funds to cover a
purchase order for repairs to a damaged dumpster5,000
March-18Technical /
Administrative
Reallocation of Public Safety funds to cover a purchase order for
METRO Police Department promotional testing7,000
March-18Technical /
AdministrativeReallocation of METROLift Services funds for Support Services 7,965
March-18Technical /
Administrative
Reallocation of Support Facilities funds to relocate a fence at
METRO property located at 2401 Texas St.4,000
March-18Technical /
Administrative
Funds reclassification of Manager, Safety Management Systems
(SMS) position95,400
March-18Technical /
Administrative
Reallocation of Facilities Maintenance funds to cover the upgrade of
the Building Automation Systems at the Rail Operating Center70,000
March-18Technical /
Administrative
Reallocation of Human Resources funds to cover expense of
printing Labor Agreement Booklets3,000
March-18Technical /
Administrative
Reallocation of Labor Relations funds to cover expense of printing
Labor Agreement Booklets2,500
March-18Technical /
Administrative
Reallocation of Government Affairs Telephone funds to
Communications to align with organizational changes1,118
March-18Technical /
Administrative
Reallocation of Public Facilities funds to cover Purchase Order for
Lamp and Bulb Recycling1,000
March-18Technical /
Administrative
Reallocation of Operating Facilities funds to cover the upgrade of
the Boiler and Chiller Automation Systems at the Kashmere Bus
Operating Facility
20,486
March-18Technical /
Administrative
Funds reclassification of Government Affairs, Government Affairs
Manager position5,843
March-18Technical /
Administrative
Funds half the required salary of the new Information Technology,
Information Security Specialist IV position32,450
March-18Technical /
Administrative
Funds upgrade of Communications, EVP & Chief Communications
Officer position31,559
March-18Technical /
Administrative
Funds the required salary of the new Information Technology,
Director IT Digital Technology position94,514
Second Quarter Total 1,916,663$
Notes:
Budget Change Request Report
Operating Budget - $620.1 million
Second Quarter - Fiscal Year 2018
Tech/Admin changes are changes within the original scope of the budgets and do not represent a change in the
Authority's work plan or priorities.
MONTHLY PERFORMANCE REPORT
Section J Page 20

Date Type Description Amount
February-18 Budget HOT Lanes 1,283,000
February-18 Budget Northwest BOF Air Compressor Replacement 102,000
February-18 Budget Hybrid Bus Parts 50,000
February-18 Budget Oil water separator system @ Polk BOF 588,000
February-18 BudgetFrom 40' Transit Bus project VB.441217 to METROLift Vehicle
VB.443016100,000
March-18 BudgetBurnett Bridge Insulator Replacement & Safety Strap
Installation - 247,000
March-18 Budget Axle Counter Evaluation & Remote Reset Capability 50,000
Second Quarter Total 2,420,000$
Notes:
Budget Change Request Report
Capital Budget - $217.7 million
Second Quarter - Fiscal Year 2018
Tech/Admin changes are changes within the original scope of the budgets and do not represent a change
in the Authority's work plan or priorities.
MONTHLY PERFORMANCE REPORT
Section J Page 21