meto 200 lesson 7. fig. 7-1, p. 189 voyage of christopher columbus columbus sailed down the coast of...
TRANSCRIPT
METO 200Lesson 7

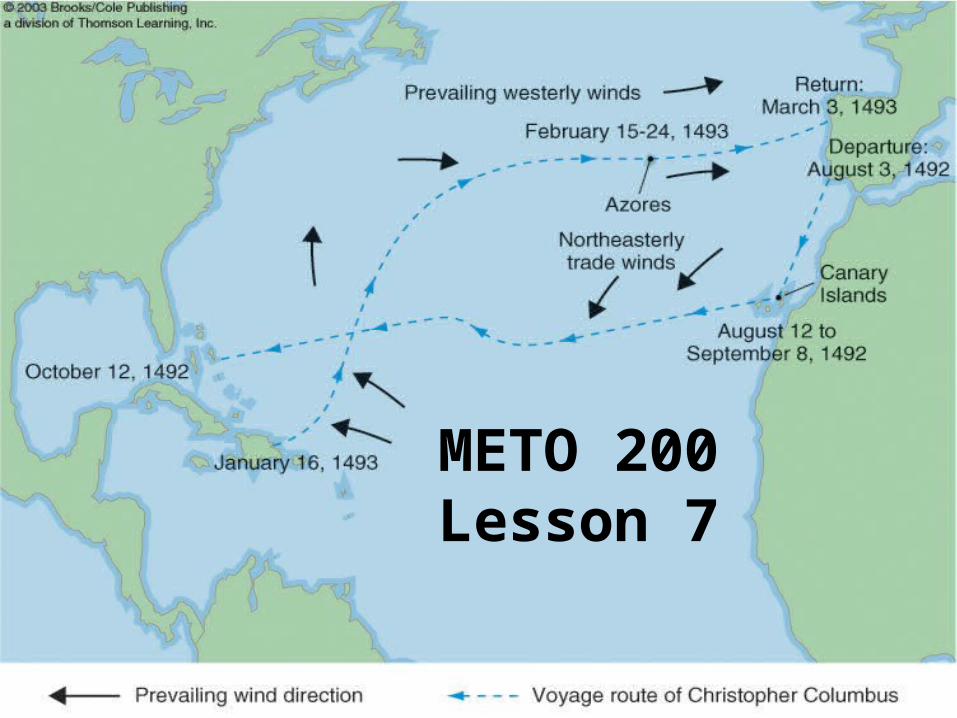
Fig. 7-1, p. 189

Voyage of Christopher Columbus
• Columbus sailed down the coast of Africa to pick up the Northeasterly winds (The trade winds).
• He returned by sailing North and then picked up the prevailing Westerlies.
• Why is there this change of wind direction as one goes North?

Fig. 7-2, p. 190

Voyage of MHS Beagle
• This was the second voyage undertaken by the HMS Beagle, and is noteworthy as the one on which Charles Darwin was a passenger.
• The route taken also took advantage of the prevailing winds at the low latitudes.

Hadley Cell

GLOBAL CIRCULATION
• George Hadley first suggested in 1735 the general concept of atmospheric circulation to explain the existence of the trade winds at the surface
• He envisioned a single convective cell which extended from the equator to the pole.
• Cold air at pole - high pressure at surface. Warm air at equator - low pressure at surface. Pressure gradient force at surface will move air from pole to equator at surface. Return path at high altitudes.
• Coriolis force produces the trade winds.

Global Circulation• However although Hadley explained the north easterlies, he could not explain with the same model, the prevailing westerlies at mid latitudes.
• So his model cannot be complete.• Another intriguing question – why are the deserts mainly seen about 30 degrees N and S?
• The answer is that the strength of the upwelling at the equator in not enough to complete the single convective cell
• In fact we have three convective cells between the equator and the poles.

Fig. 7-6, p. 193
Three cell model

GLOBAL CIRCULATION• These three cells have boundaries at about
30 and 60 degrees latitude.
• This results in sinking air at 30 N and 30 S. But sinking air warms, suppressing cloud development and precipitation. Hence most of the worlds deserts occur along these latitudes.
• These latitudes are where one finds the sub-tropical highs.
• Also known as the Horse latitudes

Global Circulation
• At the equator the Northern and Southern Easterly winds (the Trade Winds) meet and the warm air rises.
• The zone where the two winds interact is known as the Inter-tropical Convergence Zone , ITCZ
• In this region the pressure gradients are weak and the winds are light, This region is referred to as the Doldrums.
• The cell between the equator and 30 degrees is called the Hadley cell.

Fig. 7.10Composite (clouds, surface temperature (colors)) image. Note the line of clouds
along the ITCZ

Global Circulation• The cell between 30 and 60 degrees latitude is called the Ferrel cell.
• At latitudes between 30 and 60 degrees the circulation at the surface is towards the pole, which when combined with the Coriolis force produces the prevailing Westerlies
• At about 60 degrees latitude the air rises, which produces precipitation.
• Not as much as in the tropics, Why?• Because the air is colder and can hold less water vapor.

Global Circulation• The cell between 60 degrees latitude and the pole is known as the Polar cell
• The circulation at the ground is from the pole to 60 degrees, which when combined with the Coriolis force produces easterly winds.
• Polar easterlies.

Fig. 7-22a, p. 188
The three cell conceptual model depicted earlier is somewhat simplistic. Shown above is the actual position of the lows and highs for the northern winter. The difference from the conceptual model is because of the differential heating between land and water.

Fig. 7-22b, p. 189
Highs and lows for the northern summer. Note that the ITCZ has moved northward from its position in the winter.

Fig. 7-7, p. 194

Conservation of Angular Momentum
• At the Equator the earth rotates eastward at about 1000 miles per hour. On a windless day the air at the surface rotates at the same speed.
• If the earth were to stop rotating the air would continue to rotate until friction slowed it down.
• The air keeps moving because it has momentum.
• Linear momentum is the product of the mass (m) of the object times its velocity (v)
momentum = mv

Conservation of Angular Momentum
• If the body is rotating about a central point then we define the angular momentum as the product of its mass, M, times its velocity , V, times its distance from the center, R, :
Angular momentum = MVR• If no external force is applied then the angular momentum of the system does not change

Fig. 7-8, p. 194

Conservation of Angular Momentum
• The skater or diver decrease their distance R from the center of rotation by bringing their arms (in the case of the skater) and their arms and legs (in the case of the diver), in toward the body.
• This increases the speed of rotation (VR) about the center.

Fig. 7.11

Jet Streams
• As the parcel of air moves from the equator to 30 degrees at high altitudes, its velocity increases to conserve angular momentum
• At the same time the Coriolis force acts to produce a strong westerly wind – the sub-tropical jet stream.
• A similar jet forms at 60 degrees – the polar jet, or polar front jet

Fig. 7-26, p. 190

Fig. 7-27, p. 191

Fig. 7.9
Cloud band from equatorial Pacific to Florida follows the Sub-tropical jet
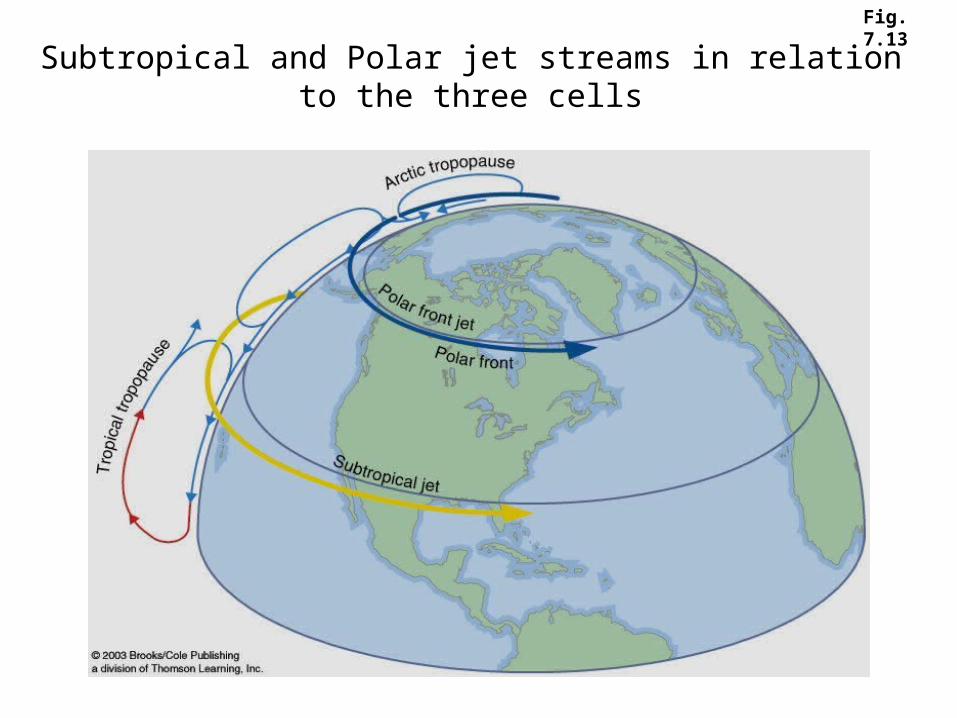
Fig. 7.13
Subtropical and Polar jet streams in relation to the three cells

WESTERLIES• IN THE UPPER TROPOSPHERE THERE IS HIGH PRESSURE OVER THE EQUATOR, AND A LOW PRESSURE OVER THE POLES.
• THIS PRODUCES A NET FLOW FROM THE EQUATOR TO THE POLES.
• THIS FLOW PLUS THE CORIOLIS FORCE PRODUCES WESTERLIES.
• WINDS ARE GEOSTROPHIC• PRESSURE GRADIENT INCREASES WITH ALTITUDE. THUS SO DOES THE WIND SPEED
• JET STREAMS ARE PART OF THE WESTERLIES

Dish-pan Experiment


Fig. 7-14, p. 199

Fig. 7-15, p. 200
500 mb winds

Fig. 7-16, p. 200
(A) Zonal flow pattern – air flows nearly parallel to latitudes
(B) Meridional flow pattern –
(C) Combination of the two flows
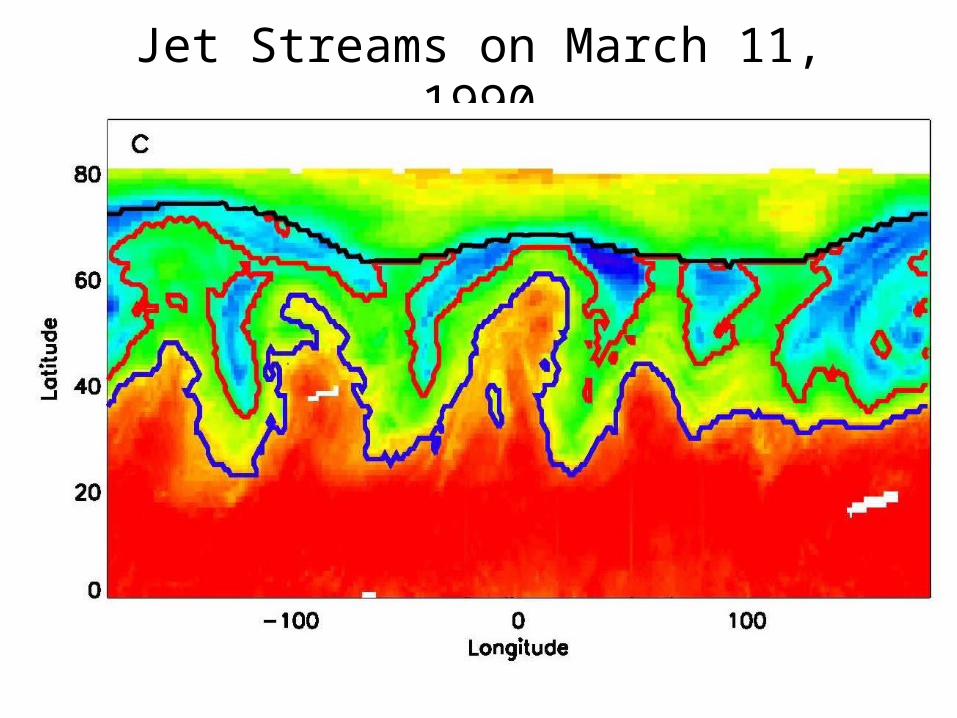
Jet Streams on March 11, 1990

Jet streams on March 11, 1990
• The next slide is an image of the total column of ozone measured from a satellite.
• Ozone can be used to trace the changes in dynamics of the atmosphere. In this case it can be used to locate the jet streams.
• Note the undulations within the Jet streams (Rossby waves).
• Also note the cut off low.
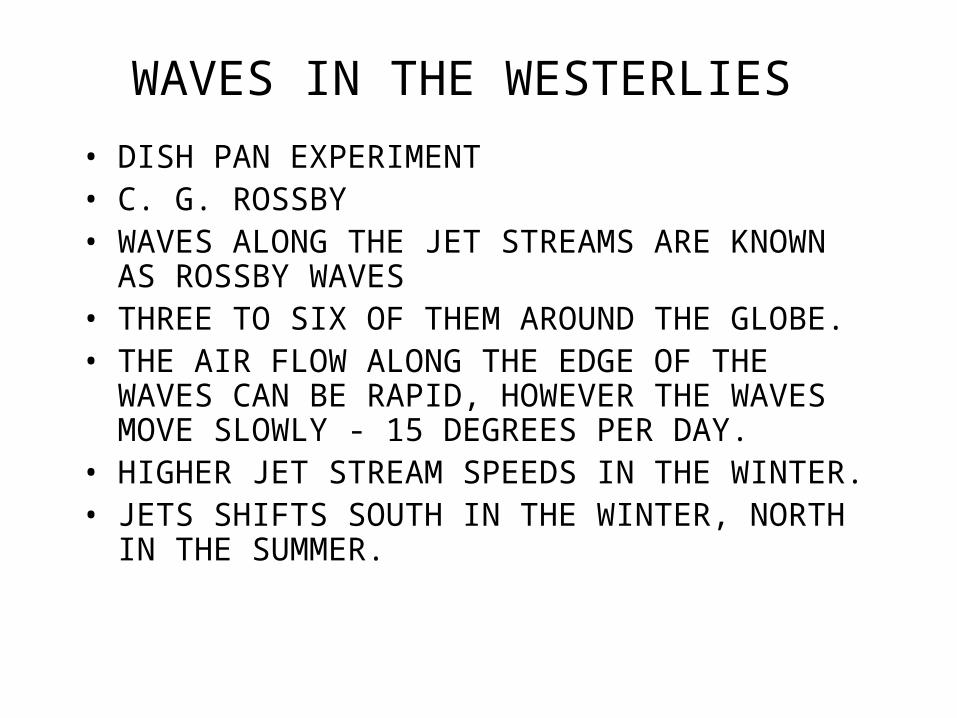
WAVES IN THE WESTERLIES • DISH PAN EXPERIMENT• C. G. ROSSBY • WAVES ALONG THE JET STREAMS ARE KNOWN AS ROSSBY WAVES
• THREE TO SIX OF THEM AROUND THE GLOBE. • THE AIR FLOW ALONG THE EDGE OF THE WAVES CAN BE RAPID, HOWEVER THE WAVES MOVE SLOWLY - 15 DEGREES PER DAY.
• HIGHER JET STREAM SPEEDS IN THE WINTER. • JETS SHIFTS SOUTH IN THE WINTER, NORTH IN THE SUMMER.

Cut-off Low

WESTERLIES AND THE HEAT BUDGET
• MAJOR FUNCTION OF ATMOSPHERIC DYNAMICS IS TO MOVE HEAT FROM THE EQUATOR TO THE POLES.
• BUT HOW CAN WINDS MOVE HEAT WHEN THE PREDOMINATE WIND DIRECTION IS ZONAL (E TO W, OR W TO E).
• THE MEANDERINGS OF THE JET STREAMS CONTINUALLY MIX COLD AND WARM AIR, THUS TRANSPORTING HEAT.
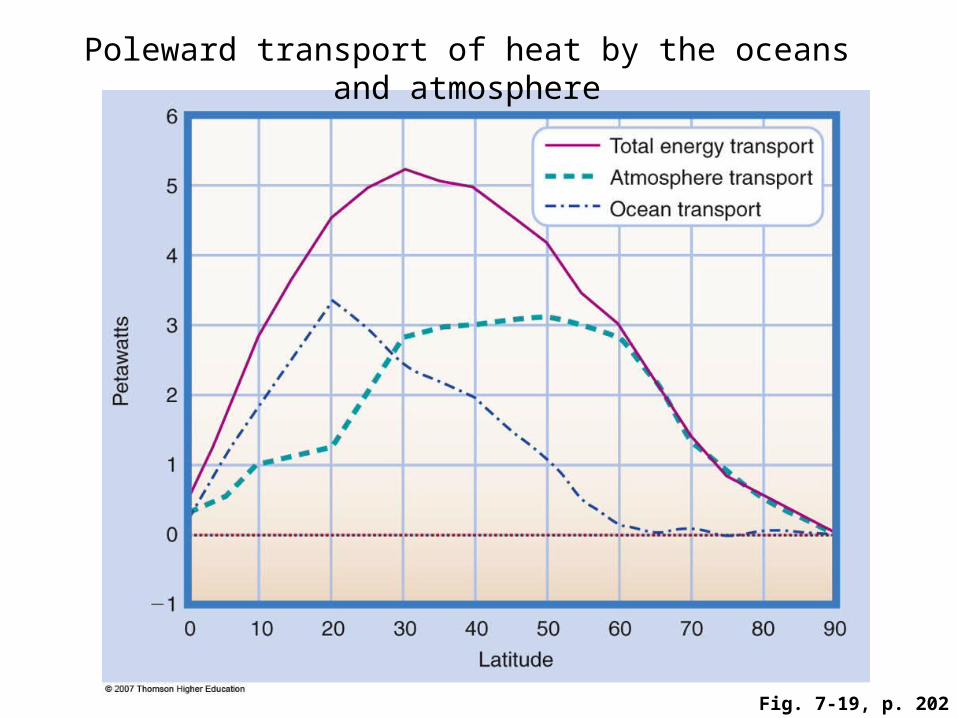
Fig. 7-19, p. 202
Poleward transport of heat by the oceans and atmosphere

Poleward transport of Energy
• We noted before that there is an inbalance between the energy from the sun received by the tropics and that received at the Poles.
• There must be a net movement of energy from the equator to the Poles.
• This transfer of energy is achieved by the atmosphere and the oceans.
• The atmosphere moves energy at the mid-latitudes, while the oceans move energy predominately in the tropics.

Fig. 7-20, p. 203
Approximate position of the ITCZ in January and July

Monsoon
• A monsoon is a weather feature driven by the change in position of the ITCZ
• In the winter the ITCZ is South of the Equator and the dominant feature over the Himalayas is a High pressure system. This brings winds from the North across India – cool dry air.
• But in the summer that ITCZ is now North of India, and the dominant weather feature is a Low pressure system. This brings large amounts of rainfall.
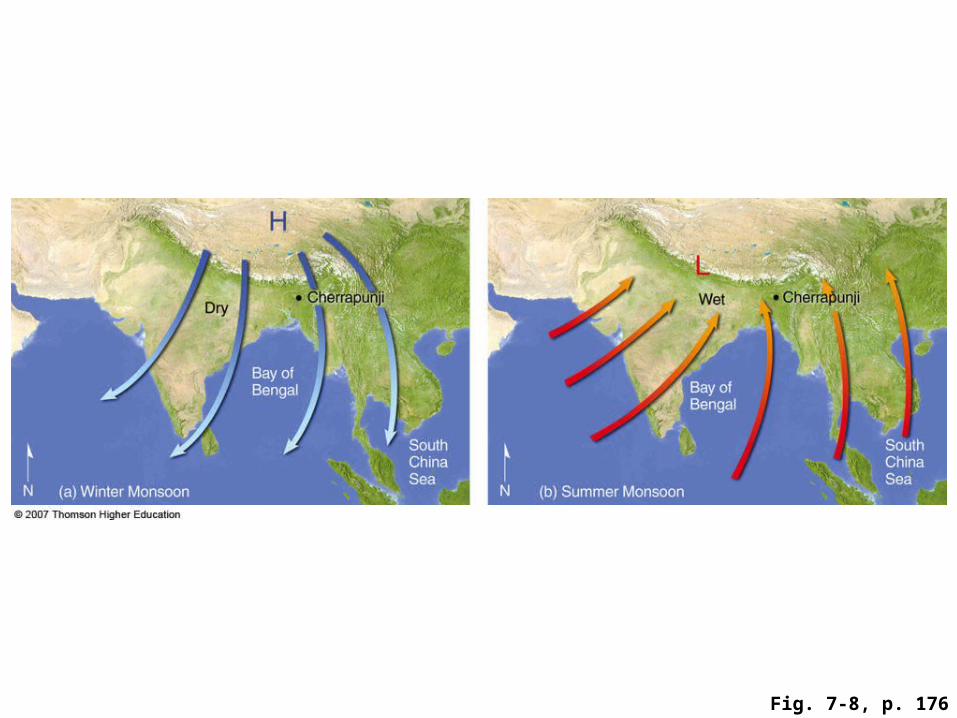
Fig. 7-8, p. 176


Box 7-2, p. 204
Precipitation patterns and topography

Precipitation patterns and Topography
• At the beginning when the air is lifted up the mountain the air cools at the dry adiabatic lapse rate.
• The dew point temperature also falls.• At I km altitude the dew point temperature equals the air temperature – saturation.
• As the air goes further up the mountain it now cools at the wet adiabatic lapse, and the dew point temperature must equal the air temperature
• Why? Because the air is saturated.• At the top of the mountain both the air and dew point temperature are at -2 C.
• The absolute water vapor pressure of the air is set by the dew point temperature at the top of the mountain
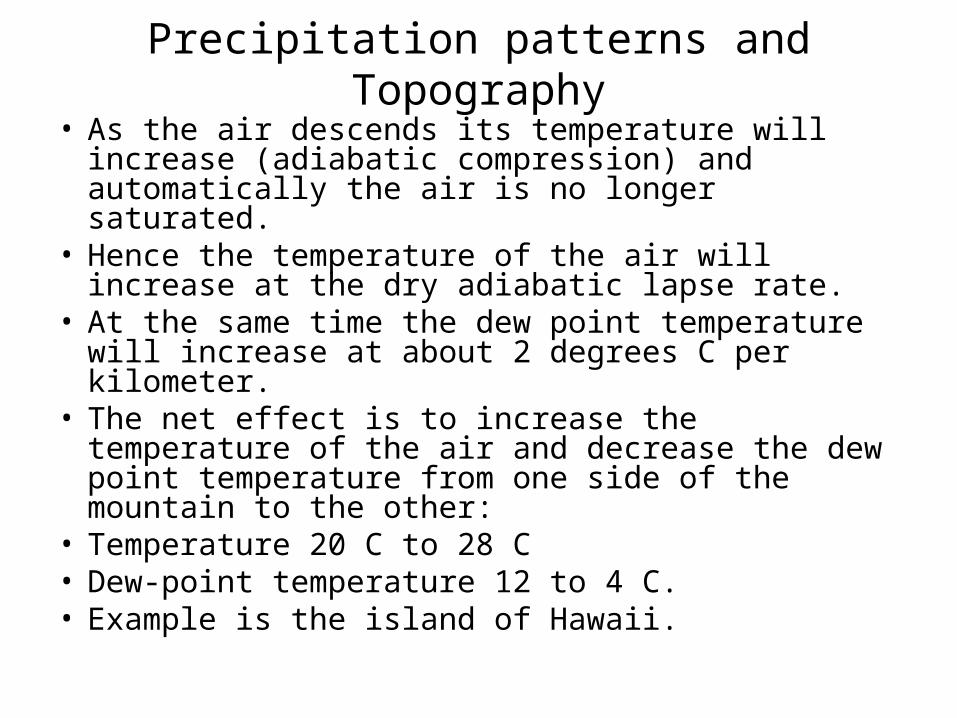
Precipitation patterns and Topography
• As the air descends its temperature will increase (adiabatic compression) and automatically the air is no longer saturated.
• Hence the temperature of the air will increase at the dry adiabatic lapse rate.
• At the same time the dew point temperature will increase at about 2 degrees C per kilometer.
• The net effect is to increase the temperature of the air and decrease the dew point temperature from one side of the mountain to the other:
• Temperature 20 C to 28 C• Dew-point temperature 12 to 4 C.• Example is the island of Hawaii.