methods to assist plagiarism detection
TRANSCRIPT

University of Ljubljana
Faculty of Computer and Information Science
Ziga Makuc
Methods to Assist Plagiarism
Detection
DIPLOMA THESIS
UNIVERSITY STUDY PROGRAMME
COMPUTER AND INFORMATION SCIENCE
Mentor: doc. dr. Dejan Lavbic
Ljubljana, 2013


Univerza v Ljubljani
Fakulteta za racunalnistvo in informatiko
Ziga Makuc
Metode za pomoc pri zaznavi
plagiatorstva
DIPLOMSKO DELO
UNIVERZITETNI STUDIJSKI PROGRAM
RACUNALNISTVO IN INFORMATIKA
Mentor: doc. dr. Dejan Lavbic
Ljubljana, 2013


To delo je ponujeno pod licenco Creative Commons Priznanje avtorstva Del-
jenje pod enakimi pogoji 2.5 Slovenija. To pomeni, da se tako besedilo, slike, grafi
ter druge sestavine dela kot tudi rezultati diplomskega dela, izvorna koda, njeni
rezultati in v ta namen razvita programska oprema lahko prosto distribuirajo, re-
producirajo, uporabljajo, priobcujejo javnosti in predelujejo pod pogojem, da se
jasno in vidno navede avtorja in naslov tega dela in da se v primeru spremembe,
preoblikovanja ali uporabe tega dela v svojem delu lahko distribuira predelava le
pod licenco, ki je enaka tej. Podrobnosti licence so dostopne na spletni strani
http://creativecommons.si ali na Institutu za intelektualno lastnino, Streliska
1, 1000 Ljubljana.
cba
Besedilo je oblikovano z urejevalnikom besedil LATEX.


Izjava o avtorstvu diplomskega dela
Podpisani Ziga Makuc, z vpisno stevilko 63070200, sem avtor
diplomskega dela z naslovom:
Methods to Assist Plagiarism Detection
S svojim podpisom zagotavljam, da:
• sem diplomsko delo izdelal samostojno pod mentorstvom
doc. dr. Dejana Lavbica
• so elektronska oblika diplomskega dela, naslov (slov., angl.), povzetek
(slov., angl.) ter kljucne besede (slov., angl.) identicni s tiskano obliko
diplomskega dela
• soglasam z javno objavo elektronske oblike diplomskega dela v zbirki
”Dela FRI”.
V Ljubljani, dne 21. junija 2013 Podpis avtorja:

Ker je diplomska naloga tudi zakljucek studija, bi se na tem mestu rad
zahvalil vsem, ki so mi kakor koli pomagali pri doseganju tega cilja. Na
prvem mestu bi se rad zahvalil vsem clanom svoje druzine, saj so me podpirali
v celotnem obdobju studija in seveda tudi pred tem. Poleg tega bi se rad
zahvalil tudi prijateljem in sosolcem, ki so mi stali ob strani in poskrbeli, da
sem uspesno prisel do tega cilja. Ne nazadnje gre zahvala tudi Lidiji Sega, ki
je svoj cas in trud vlozila v lektoriranje tega dela.
Zahvaljujem se tudi mentorju, doc. dr. Dejanu Lavbicu, ki je s svojimi
strokovnimi komentarji in predlogi pripomogel k uspesno izdelani diplomski
nalogi.


Contents
Contents
List of Used Acronyms
Povzetek
Abstract
1 Introduction 1
1.1 Four-Stage Plagiarism Detection Process . . . . . . . . . . . . 2
1.2 Diploma Thesis Overview . . . . . . . . . . . . . . . . . . . . 4
2 Related Work 5
2.1 Review of Related Approaches . . . . . . . . . . . . . . . . . . 5
2.2 Proposal for Solution . . . . . . . . . . . . . . . . . . . . . . . 10
3 Used Technologies 11
3.1 PHP . . . . . . . . . . . . . . . . . . . . . . . . . . . . . . . . 12
3.2 MySQL . . . . . . . . . . . . . . . . . . . . . . . . . . . . . . 12
3.3 Apache Web Server . . . . . . . . . . . . . . . . . . . . . . . . 13
3.4 D3.js . . . . . . . . . . . . . . . . . . . . . . . . . . . . . . . . 13
3.5 FPDF . . . . . . . . . . . . . . . . . . . . . . . . . . . . . . . 18
3.6 Wkhtmltopdf . . . . . . . . . . . . . . . . . . . . . . . . . . . 18
3.7 Website Template . . . . . . . . . . . . . . . . . . . . . . . . . 19
3.8 Moss . . . . . . . . . . . . . . . . . . . . . . . . . . . . . . . . 19

3.9 Facebook API . . . . . . . . . . . . . . . . . . . . . . . . . . . 20
3.10 Twitter API . . . . . . . . . . . . . . . . . . . . . . . . . . . . 27
3.11 Google API . . . . . . . . . . . . . . . . . . . . . . . . . . . . 31
4 Implementation of PDA 33
4.1 Database . . . . . . . . . . . . . . . . . . . . . . . . . . . . . . 35
4.2 Use of Moss . . . . . . . . . . . . . . . . . . . . . . . . . . . . 41
4.3 Social Media and Google Search . . . . . . . . . . . . . . . . . 42
4.4 Functionalities . . . . . . . . . . . . . . . . . . . . . . . . . . . 45
4.5 Visualisation . . . . . . . . . . . . . . . . . . . . . . . . . . . . 64
4.6 Generating Report . . . . . . . . . . . . . . . . . . . . . . . . 72
5 Conclusions and Future Work 75
5.1 Results . . . . . . . . . . . . . . . . . . . . . . . . . . . . . . . 75
5.2 Problems . . . . . . . . . . . . . . . . . . . . . . . . . . . . . . 76
5.3 Future Work . . . . . . . . . . . . . . . . . . . . . . . . . . . . 78
Bibliography 81
List of Figures 86
List of Codes 87
List of Used Acronyms
API Application Programming Interface
CSS Cascading Style Sheets
CSV Comma-Separated Values
Captcha Completely Automated Public Turing Test
to Tell Computers and Humans Apart
D3 Data-Driven Documents
DBMS Database Management System
DOM Document Object Model
FB Facebook
FPDF A PHP class which allows to generate PDF files
FTP File Transfer Protocol
HTML HyperText Markup Language
HTTP HyperText Transfer Protocol
ID Identifier
IP Internet Protocol
JPlag A system that finds similarities among multiple
sets of source code files
JSON JavaScript Object Notation
Moss Measure of Software Similarity
MySQL My Structured Query Language
OAuth An Open Standard for Authorization

PDA Plagiarism Detection Assistant
PDF Portable Document Format
PHP An Open-Source Server-Side Scripting Language
SQL Structured Query Language
SSL Secure Sockets Layer
SVG Scalable Vector Graphics
TW Twitter
UNIX A Multitasking, Multi-User Computer Operating System
URL Uniform Resource Locator
Wkhtmltopdf Simple Shell Utility to Convert HTML to PDF
X11 The X Window System
XML Extensible Markup Language
XVFB X Virtual Framebuffer
cURL A command line tool for transferring data
with URL syntax
Povzetek
Dandanes je povezovanje ljudi vedno lazje in bolj dostopno. Z uporabo inter-
neta in telefonov lahko studentje in dijaki lazje komunicirajo in si izmenjujejo
sporocila. Ker je sama komunikacija bolj enostavna, dostopnejsa in hitrejsa,
se to pozna tudi pri solskem delu. Ucenci si veliko lazje pomagajo med seboj,
saj se lahko slisijo preko telefona ali interneta prakticno kadarkoli, ne glede
na to, kje so. Pri solskem delu je pa zelo tanka meja med pomaganjem in
prepisovanjem.
V diplomskem delu se ukvarjam predvsem s tem, kako bi lahko poenostavil
in izboljsal proces ugotavljanja plagiatorstva. Razvita je bila spletna ap-
likacija, ki s pomocjo zunanjega ponudnika omogoca ugotavljanje podobnosti
in se poveze tudi s socialnimi omrezji kot sta Facebook in Twitter. Aplikacija
je poimenovana Plagiarism Detection Assistant, ali po slovensko Asistent pri
zaznavanju plagiatorstva. Ta aplikacija je narejena za ugotavljanje podob-
nosti v programski kodi. V ta namen se uporablja orodje Moss (prej omenjeni
zunanji ponudnik), ki sprejme vhodne datoteke, kot izhod pa vrne porocilo
o podobnosti.
Sama aplikacija je zasnovana tako, da oseba, ki preverja podobnost,
naredi nov projekt (ime predmeta) in doda domace naloge. Pri vsaki domaci
nalogi lahko v aplikacijo nalozi ucenceve domace naloge (datoteke), ki jih
potem preveri s pomocjo orodja Moss. To se naredi avtomaticno s klikom na
gumb, ki to preverjanje zazene. Aplikacija potem to porocilo avtomaticno
pregleda in prepise vse ustrezne podatke v svojo podatkovno bazo. Te pri-
dobljene informacije lahko nato uporabnik vizualizira.
Na voljo sta dva tipa vizualizacije. Prvi je vizualizacija v obliki grafa. V
tem primeru vsako vozlisce predstavlja ucenca, povezava med dvema ucencema
pa predstavlja zaznano podobnost v njuni kodi. Ker aplikacija omogoca
vec domacih nalog, se lahko potem jasno vidi, kdo je od koga prepisoval
skozi celoten semester ali leto. Drug nacin vizualizacije je tako imenovana
sopojavitvena matrika, pri kateri leva navpicna os in desna vodoravna os
predstavljata ucence. Sama vizualizacija je predstavljena kot matrika, kjer
je potem prikaz plagiatorstva predstavljen v kvadratkih. S klikom na os-
ebo (torej v primeru grafa na vozlisce, v primeru matrike pa na ime, ki je
napisano ob matriki) se odpre nova stran, kjer so podatki o osebi. S klikom
na povezavo (v primeru grafa povezava med vozliscema, v primeru matrike
pa kvadratek) se odpre nova stran, kjer so podatki o tem ujemanju.
Stran, ki prikazuje podatke o osebi, vsebuje vec informacij. Sama stran je
razdeljena na tri razdelke. Prvi prikazuje ime in priimek ter vpisno stevilko
ucenca. Poleg tega je prikazana tudi profilna slika, ce je le ta na voljo iz
socialnih omrezij. Drugi razdelek je namenjen socialnim omrezjem. Ap-
likacija podpira povezavo s spletno stranjo Facebook in Twitter. Uporabnik
ima moznost avtomaticno poiskati profile na teh socialnih omrezjih - glede
na ime ucenca. Za dobljene profile lahko preveri, ce so ustrezni, in pravil-
nega potrdi, nepravilne pa zavrze. Uporabnik ima opcijo tudi rocno dodati
profil. Tretji razdelek vsebuje informacije, s katerimi drugimi ucenci je za-
znana podobnost v kodi. Uporabnik lahko nato pregleda dejansko kodo in
vidi podobnost (rezultat, ki ga vrne Moss). Nato lahko potrdi ta plagiat kot
resnicen ali pa ga zavrne. Tako se sestavi seznam ujemanj, ki mu pomaga
pri kasnejsem ugotavljanju plagiatorstva.
Stran, ki prikazuje podatke o ujemanju dveh oseb, je tudi razdeljena na
tri razdelke. Prva dva vsebujeta informacije o teh dveh osebah. Tretji pa
vsebuje informacije o ujemanjih na socialnih omrezjih. Ce sta ti dve osebi
prijatelja na socialnem omrezju Facebook ali Twitter, se to izpise. Poleg tega
se tukaj izpisejo tudi podatki o stevilu ujemanj njunih imen in priimkov na
iskalniku Google. V tem razdelku pa so tudi podatki, pri katerih domacih

nalogah sta ta ucenca imela ujemanje v kodi.
Poleg tega ima uporabnik moznost generiranja porocila, v katerem so
zajeti vsi pomembni podatki. Vidi se, kateri ucenci so si med seboj pomagali
(ce so povezani v skupine, se vidi tudi to), kaksne so bile podobnosti med
njihovimi deli ter izris obeh vizualizacij.
Namen diplomske naloge je torej bil predstaviti razlicne nacine, kako
lahko poenostavimo preverjanje plagiatorstva (oziroma naredimo to delo bolj
cloveku prijazno) in v to vkljucimo se socialna omrezja, ki lahko podkrepijo
nase domneve. Seveda je po zakljucenem preiskovanju potreben se razgovor
s temi ucenci. S tem potem dejansko potrdimo ali zavrzemo sum o pla-
giatorstvu. Aplikacija vsebuje mnogo funkcionalnosti, ki so opisane v sami
diplomski nalogi. Pri razvoju teh funkcionalnosti sem naletel tudi na mnogo
tezav. Dolocene so se dale odpraviti, dolocene so bile pa resene tako, da kljub
tej tezavi zadovoljijo potrebe uporabnika - vendar ne na najbolj optimalen
nacin. Ob razvoju aplikacije se je porodilo tudi mnogo drugih idej, ki pa
trenutno se niso razvite, vendar pa je opisano, kako bi se jih dalo implemen-
tirati.
Iz tega je razvidno, da dolocene funkcionalnosti omogocijo boljsi pregled
nad delom ucencev. Kaksne bi bile sankcije za ugotovljeno plagiatorstvo v
tem trenutku niti ni pomembno, saj se mi zdi, da je bolj pomembno to,
da uporabnik ugotovi, zakaj je prislo do plagiatorstva. Tako orodje namrec
odkrije plagiate in s tem omogoci uporabniku, da povabi ucence na razgovor
in tako razkrije razloge za plagiatorstvo. S tem v mislih potem tudi ve, kako
pravilno pristopiti k podaji nalog naslednje leto, da bi ze vnaprej preprecil
plagiatorstvo in tako ucencem omogocil pravilen pristop k izdelavi nalog.
Kljucne besede:
plagiatorstvo, vizualizacija, Moss, Twitter, Facebook, Google

Abstract
Modern technologies enable students to interact with each other much eas-
ier than in the past. This enables students to help each other with their
school assignments, which can quickly lead to plagiarism. The purpose of
this diploma thesis was to create an application which simplifies detecting
plagiarism. It also has some functionalities which connect to social media
websites and can add valuable information in detecting plagiarism.
The application is designed in such a way that user can upload student
submissions and then check them for plagiarism. This application supports
source code plagiarism detection. After submissions have been checked (with
external provider - Moss), the user can create visualisations which are based
on retrieved data. Currently two types of visualisations are implemented -
Graph visualisation of plagiarism and Co-Occurrence Matrix visualisation.
The user can then check each plagiate and confirm or reject it. With that
he can later create a list of persons which are potential plagiators and invite
them on an interview to verify the suspicion of plagiarism. This application
supports multiple assignments, so that the user can track each person for
plagiarism through all assignments.
Connection to social media websites such as Facebook and Twitter is
also implemented. With that the user can retrieve information whether two
persons are friends on those sites. Also a number of Google results including
their names is provided.

This leads to conclusion that different functionalities enable the user to
get better overview of student work. With discovering plagiates the user can
then determine why plagiarism has occurred in the first place and it can help
him prevent this from happening in future courses.
Key words:
plagiarism, visualisation, Moss, Twitter, Facebook, Google
Chapter 1
Introduction
Every teacher struggles with the question, whether the work of a student is his
own work or is it a plagiate. With the rise of computer era and World Wide
Web, plagiarism has become more attractive. Students can now interact with
their classmates easier than in the past. They are likely to connect together
and form groups, as new ways of communications are available [1]. With
increasing growth of plagiarism, new methods to discover plagiarism must
be presented. But what methods could be used and in what way can they
help teachers? There are many methods, some are adequate for this matter
and some are not. But first, some terms should be described. Plagiarism,
looked at a wider angle, can be classified in different ways [2].
One way of classifying plagiarism is according to the source of plagiarism.
The process begins with a student being given an assignment. The work he
later submits is called student submission. The set, which contains all student
submissions for a given assignment is called corpus.
Plagiarism within that corpus is called intra-corpal plagiarism. This
means that the source of plagiarism was within that corpus. Either one
submission is connected to another submission, or more submissions were
connected to each other. This group of connected submissions is then called
cluster. Which submission was source and which was copied is not evident at
the beginning, but it could be determined later in the stage of investigation.
1
2 CHAPTER 1. INTRODUCTION
If the source of plagiarism is outside of the corpus, this is then called
extra-corpal plagiarism. Sources can be books, articles, solutions from other
institutions and particularly World Wide Web which is becoming more and
more appealing due to its simplicity to search required information. When
two or more students copy from the same source outside the corpus, this can
also appear as students copying from themselves, so the investigator must be
aware of this.
Another way of classifying plagiarism is according to the type of material
being examined. Source code submissions refer to computer code written in
different languages (PHP, Java, C#,...). Free text submissions refer to texts,
essays, theses, articles, etc. written in natural language such as English.
This diploma thesis is dealing with easing the investigation of intra-corpal
source code plagiarism. Although investigating extra-corpal plagiairsm as
well as investigating free text plagiarism could also be integrated in this
project. What words detecting, investigating and others mean in relation to
plagiarism, is revealed in the next chapter.
1.1 Four-Stage Plagiarism Detection Process
Figure 1.1 shows the Four-Stage Plagiarism Detection Process which was
defined by Culwin and Lancaster [3]. Some stages in this process can be fully
automated and some can be automated just in parts. Stages where computer
icon is present can be automated by computer. Stages where person icon
is present must have human assistance as well. If both are present, both
computer and human assistance are needed.
First stage is called collection, where students submit their work. Second
stage is called analysis, where the corpus of submissions is run through a
similarity engine. This similarity engine produces an output where poten-
tially plagiarised submissions are shown. Similarity between them is shown
with specific measure. The effectiveness of the detection depends on similar-
ity engine. There are many similarity engines available for use [4]. Similarity

1.1. FOUR-STAGE PLAGIARISM DETECTION PROCESS 3
Figure 1.1: Four-Stage Plagiarism Detection Process
is just a score, shown in a defined measure, but does not yet indicate a pla-
giate. For a submission to become a plagiate, confirmation stage must be
completed, where the submission is examined and verified. Therefore these
two terms must be distinguished. The third stage is the stage of confirmation
which is done by human. This stage is necessary to decide whether the re-
ported similarity represents plagiarism or not. It can also be automated, but
false positive and false negative results might occur. Any similarity which is
confirmed as positive is then considered further in the investigation stage.

4 CHAPTER 1. INTRODUCTION
1.2 Diploma Thesis Overview
This diploma thesis addresses the following questions:
• What methods can assist in plagiarism detection process?
• Can social media sites and web search engines provide valuable infor-
mation in plagiarism detection process?
• Can plagiarism be visualized and how can this help retrieving new
information?
• What methods can be developed in future to help detect plagiarism?
This diploma thesis is organized as follows: Chapter 2 presents an overview
of existing solutions. Revealing their disadvantages shows why this work can
be used in detecting plagiarism. Chapter 3 focuses on technologies and tools
that are essential for this program to work. Chapter 4 reveals how the ap-
plication is composed and how each component works. It also describes the
application functionalities. Chapter 5 sums up all the problems which were
encountered during the application development. It also covers further work
possibilities.

Chapter 2
Related Work
2.1 Review of Related Approaches
There are many tools for plagiarism detection available. One of the most
popular are Sherlock [5], JPlag [6] and Moss [7]. Their basic functionality is
very simple. Selected submissions are run through similarity engine which
provides results with potential plagiates. JPlag and Moss do not have many
other parameters to be changed.
One of the options in Moss is that user can set which programming lan-
guage will be in corpus (Moss also automatically detects which language is
used). Another option is to set how many results are shown (by default this
value is 250, which is more than enough, but it can be reduced or increased).
It also has option to select base file. When instructor gives assignment in-
structions, he can also provide some algorithms that can be used in that
assignment. If user sets this algorithm as base file, the code that is included
in that base file is ignored in every submission. Moss can also automatically
detect these patterns even though they are not specifically added as base
file. Yet another option is the option to set maximum number of times a
given passage may appear before it is ignored. It is actually used to control
Moss’s sensitivity. If this number is N, then part of code must be present
in N submissions to be ignored. So the bigger the N, more rigorous is the
5
6 CHAPTER 2. RELATED WORK
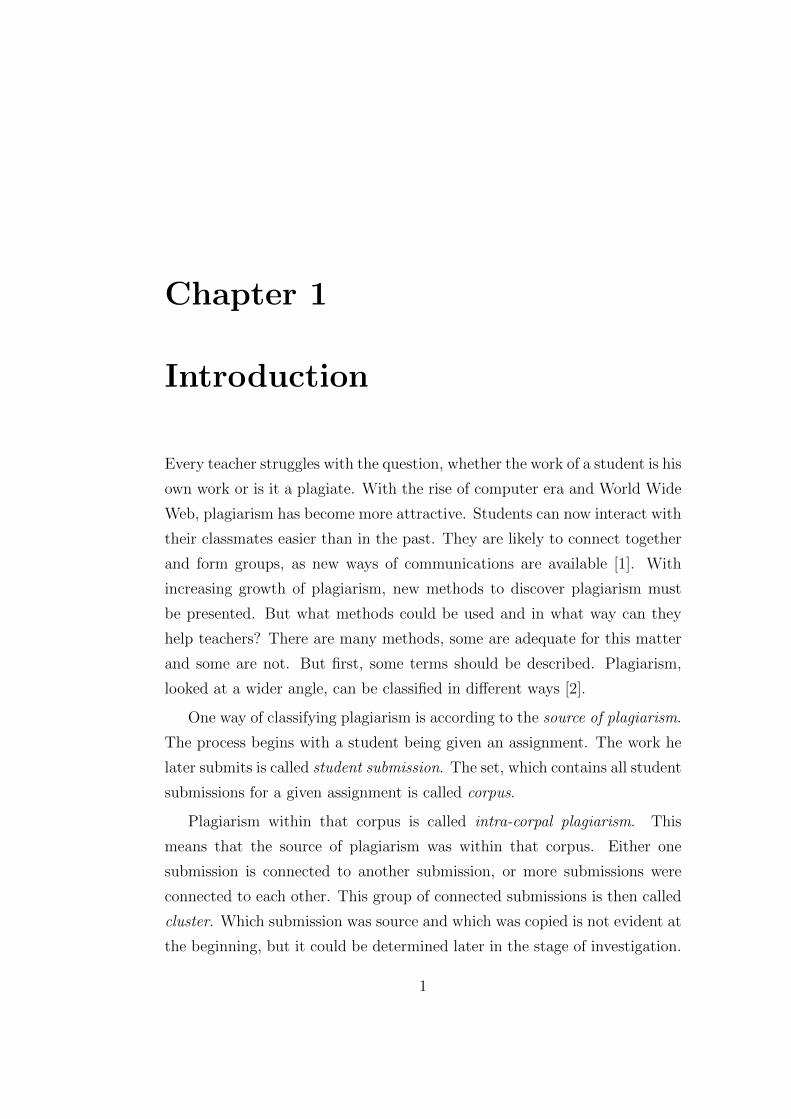
Figure 2.1: Example of Moss results
similarity engine. With smaller N, many code parts are ignored and thus not
shown as a match. When submissions are sent, the user receives an URL
in which comparison data (output) is shown. Output is practically a list of
matches (i.e. one submission was detected to be similar to another one), with
percent of similarity and link to show where code similarity was detected.
Example output is shown in Figure 2.1 and Figure 2.2. Moss can analyze
code written in many languages. These are C, C++, Java, C#, Python,
Visual Basic, JavaScript, Pascal, Perl and many others. A disadvantage of
Moss is that submission script is currently available only for Linux. That
being mentioned, every setting is set through attributes when starting script
in shell.
JPlag is a Java based system that works like Moss. User sends submissions

2.1. REVIEW OF RELATED APPROACHES 7
Figure 2.2: Example of comparison between two submissions in Moss
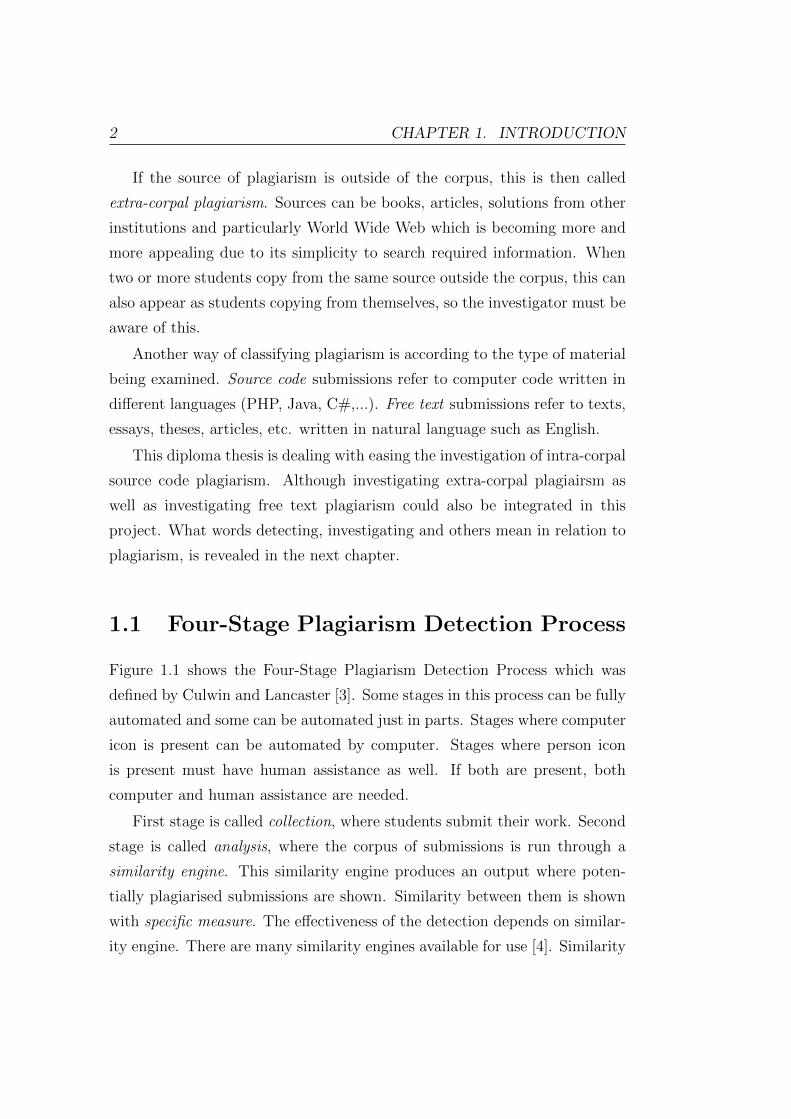
to be checked. There are practically no extra settings in JPlag. Output with
comparison data is similar to Moss and is shown in Figure 2.3, which was
taken from a website that demonstrates how JPlag tool is used [8]. JPlag
currently supports Java, C#, C, C++, Scheme and in contrast to Moss it
also supports free text submission comparison. Both Moss and JPlag have
HTML output, which means results can easily be parsed and stored in other
formats to be used for other purposes. What JPlag and Moss do not offer is
an option to create a list of matches where plagiarism is believed to be true.
With that option, investigator (i.e. the person who checks for plagiarism)
could easily go through desired matches and create a list of persons for further
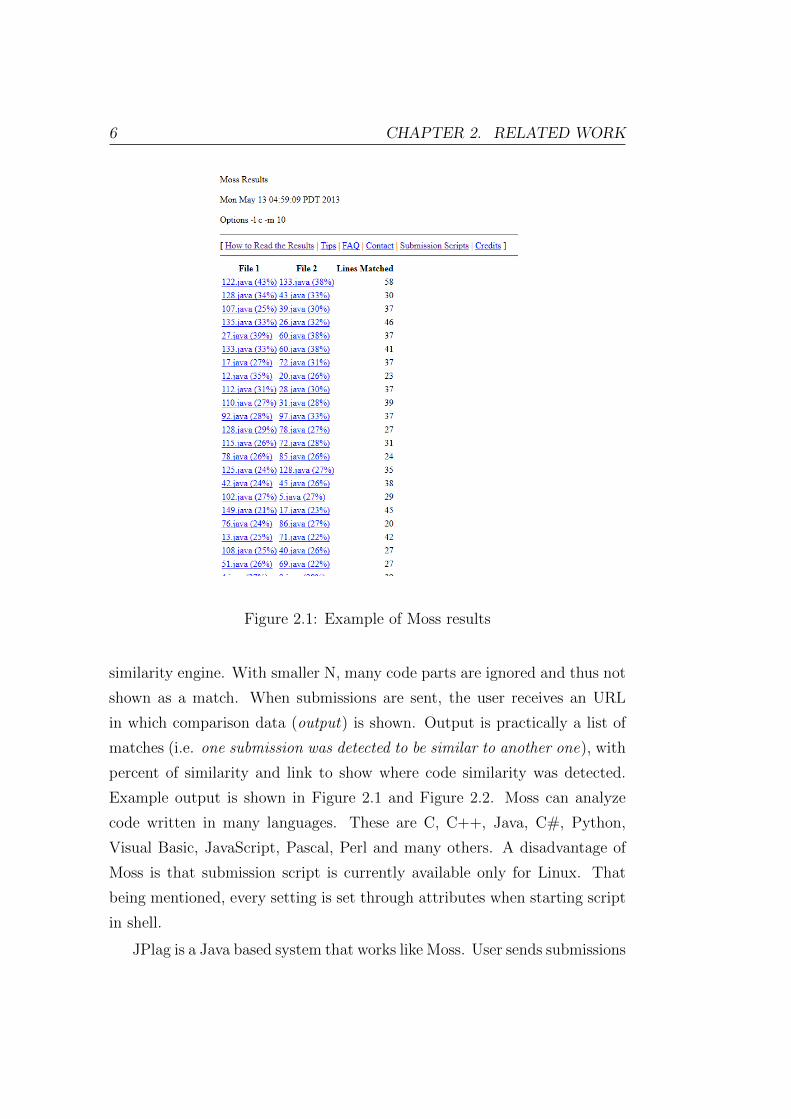
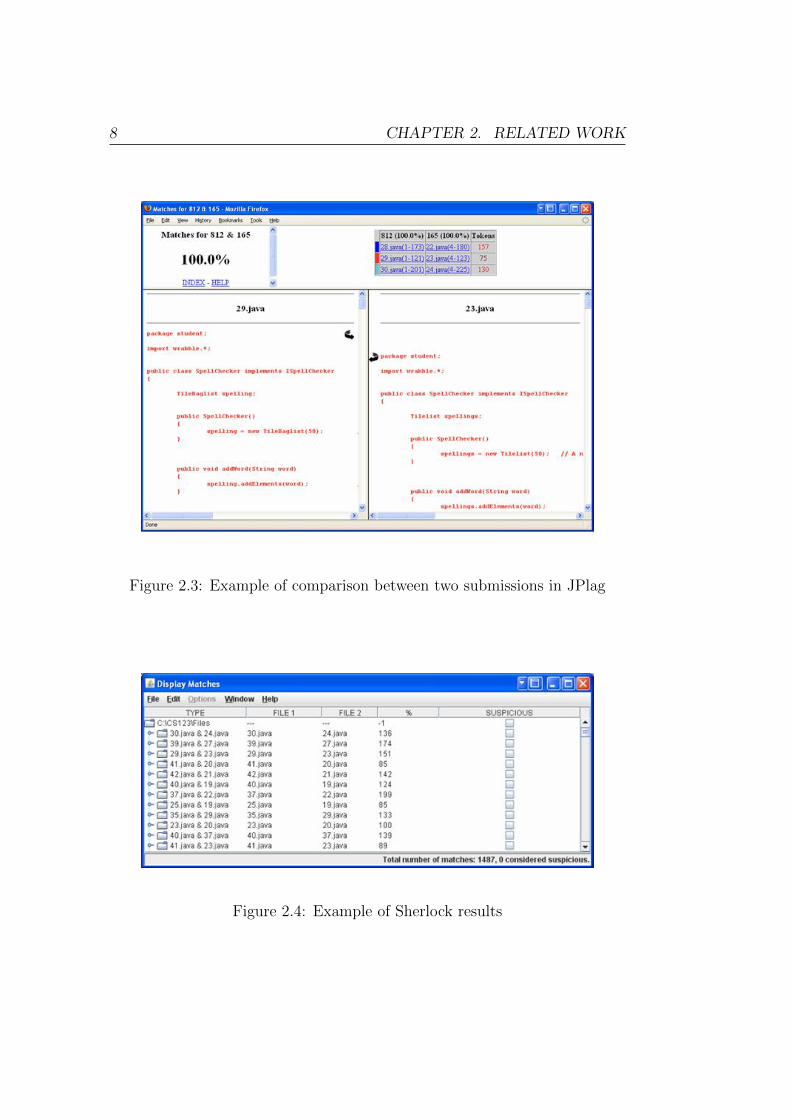
investigation. This feature however is available in Sherlock. Sherlock also
has the feature to visualize matches and show them by clusters. But its
visualisation system is obsolete and does not help much with investigation.
That being said, Sherlock covers much more functionalities than Moss and
JPlag, but output generated by similarity engine cannot be directly exported
to other formats. Examples of Sherlock output are shown in Figure 2.4,
Figure 2.5 and Figure 2.6 which were taken from a website that demonstrates
how Sherlock tool is used [9]. Sherlock is in comparison to JPlag and Moss
harder to install and regular user can have many problems initializing it.
8 CHAPTER 2. RELATED WORK
Figure 2.3: Example of comparison between two submissions in JPlag
Figure 2.4: Example of Sherlock results

2.1. REVIEW OF RELATED APPROACHES 9
Figure 2.5: Comparison between two submissions in Sherlock
Figure 2.6: Example of visualizing matches in Sherlock
10 CHAPTER 2. RELATED WORK
2.2 Proposal for Solution
In contrast to these available tools, the purpose of this work was to create a
prototype application which provides the investigator new visualisation tech-
niques and other methods to assist plagiarism detection. Sherlock does not
support more than one assignment (corpus) to be available for investigation.
This prototype can visualize more corpora (plural of corpus), which enables
investigator to have an overview of student plagiarism through entire module
(class). Different types of visualisations are also available in this prototype.
Investigator can select suspicious matches and create a list which can be later
further investigated. This functionality is also covered in Sherlock, but again
it cannot be used for more assignments. This prototype also connects to so-
cial media websites, such as Facebook and Twitter, and looks for friendship
relations between students. This gives important information in investigat-
ing plagiarism. It also checks name correlations on Google search engine.
In the end, when matches have been investigated, report can be generated
and printed. Investigator can then invite selected students for an interview,
where they are evaluated whether they have plagiarised or not.
What would be the penalties for confirmed plagiates is not important
in this case. What is important is the fact that investigator could receive
an information why the plagiarism occurred in the first place. With that
in mind he can prevent this from happening in future courses. By this, the
teacher can provide students with the proper mindset not to plagiarise. If
students continue with the old mindset and continue with plagiarism, this
can also lead to violations of work place policies in the future, when they are
employed [10].
In general, this prototype shows examples of how elementary function-
alities make plagiarism detection tool more useful. Simple visualisations,
connecting with World Wide Web, easy graphical user interface and other
methods, which are described in later chapters, can simplify work for inves-
tigator.

Chapter 3
Used Technologies
The prototype application, created in this diploma thesis, uses different tech-
nologies. How this technologies and application are connected is shown in
Figure 3.1. Basic functionalities in the application require Apache Web
Server, PHP, MySQL Database and Local Storage to work. Web template is
embedded in the application, so it is required as well. Because no similarity
engine was developed in this application, it needs to connect to a provider
from outside (in this case, Moss). These are the basic technologies that are
needed. User can view different matches and users and also confirm and re-
ject matches. Whether the user wishes to see visualisations, D3.js library is
needed. If user wishes to connect to social media websites such as Facebook
and Twitter, or check name correlations on Google, these technologies need
to be available as well. Whether the user wishes to create a report, FPDF
is needed. To include visualisations in this report, the application called
Wkhtmltopdf is needed.
Each mentioned technology is described in further sections. Local stor-
age is excluded, as it is not a technology but is a priori available on this
application location. Why local storage is needed is explained in Chapter
4.1.
11

12 CHAPTER 3. USED TECHNOLOGIES
Figure 3.1: Architecture diagram of the application
3.1 PHP
PHP [11] is a very popular scripting language. It is especially suited for
Web development. This language was created to generate dynamic output on
websites (output that can be different each time a browser requests a page).
PHP documents generally end with extension .php and can be embedded
into HTML. This application has been developed in PHP language and that
is why this technology is needed.
3.2 MySQL
MySQL [12] is one of the most popular database management systems
(DBMS ) for web servers. It was developed in mid-1990s and the fact that it
has become so popular and wide-spread is because it is free to use, like PHP.
MySQL implements relation database and uses SQL, which means Structured
Query Language. With SQL queries, data can be retrieved from database.
MySQL database contains one or more tables called entities. Each table
has one or more columns called attributes. It also has one or more rows. Each
row represents one entry in that table. Attributes define properties of that
entity. Each entity can be connected to one and more other entities. With
3.3. APACHE WEB SERVER 13
such specifications, database is created. Database server can contain multiple
databases. The application that was developed in this diploma thesis uses
MySQL database to store almost all data that it uses.
3.3 Apache Web Server
The Apache Web Server [13] is an open-source HTTP server. It can operate
on many operating systems including UNIX, Microsoft Windows, Mac OS/X
and Netware. Apache has been one of the most popular web servers since year
1996. It supports integration with PHP and many other scripting languages.
It is required for this application to work, because the application is web-
based.
3.4 D3.js
3.4.1 Introduction
D3 is a JavaScript library which manipulates documents based on given
data. D3 connects elements such as HTML, CSS and SVG. It was created
as a successor to a similar tool called Protovis, which was also intended to
create simple and more complex visualisations.
The D3 library can be downloaded from http://d3js.org. Example of
how D3 library can be used is shown in Code 3.1 [14].

14 CHAPTER 3. USED TECHNOLOGIES
< !DOCTYPE html>
<html>
<head>
<meta charset=”utf−8”><script src=”d3 . j s ”></ script> Ê
<script>
f unc t i on v i s u a l i s a t i o n ( data ) { Ë
// To the g iven data , v i s u a l i s a t i o n i s c r ea ted
}</ script>
</head>
<body>
<script>
d3 . j son ( ”data . j son ” , v i s u a l i s a t i o n ) ; Ì
</ script>
</body>
</html>
Code 3.1: Example of D3 library usage as shown in Mike Dewar’s Getting
Started with D3
Ê Include D3 library in web page to give access to D3 methods.
Ë Example of one-argument function, which is called when data is loaded at
step 3.
Ì Load JSON data from file data.json and call function visualisation - data
is passed as an argument.

3.4. D3.JS 15
Data that is used with D3 library is stored in JSON format. Other for-
mats, such as XML and CSV, could also be used, but in this case JSON
structure is used. Example of data.json file is shown in Code 3.2. It has
one attribute called nodeSet. It is an array and has two entries. Each entry
has five more attributes named id, name, group, hlink and count and they
all have some assigned value. For example the first entry has attribute ”id”
with value ”1”. This example is also used in visualisations and is described
in Chapter 4.5.
{”nodeSet ” = [
{” id ” : ”1” ,
”name” : ”10090101” ,
”group ” : ”0” ,
” h l i nk ” : ”? view p=1”,
” count ” : ”2”
} ,{
” id ” : ”2” ,
”name” : ”10090105” ,
”group ” : ”0” ,
” h l i nk ” : ”? view p=2”,
” count ” : ”2”
}] ;
}
Code 3.2: Example of JSON data file
16 CHAPTER 3. USED TECHNOLOGIES
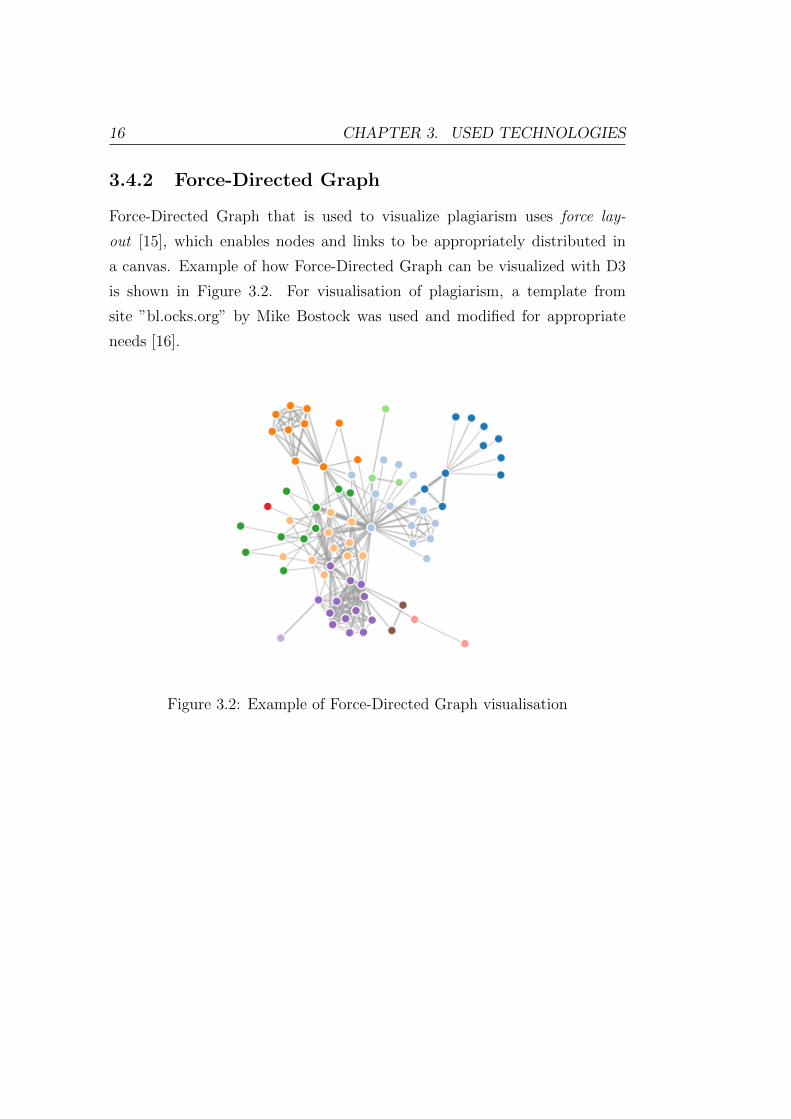
3.4.2 Force-Directed Graph
Force-Directed Graph that is used to visualize plagiarism uses force lay-
out [15], which enables nodes and links to be appropriately distributed in
a canvas. Example of how Force-Directed Graph can be visualized with D3
is shown in Figure 3.2. For visualisation of plagiarism, a template from
site ”bl.ocks.org” by Mike Bostock was used and modified for appropriate
needs [16].
Figure 3.2: Example of Force-Directed Graph visualisation

3.4. D3.JS 17
3.4.3 Co-Occurrence Matrix
Example of how Co-Occurrence Matrix looks like when visualizing it with
D3 library is shown in Figure 3.3. For visualisation of plagiarism, a template
from site ”bost.ocks.org” by Mike Bostock was used and modified for appro-
priate needs [17].
Figure 3.3: Example of Co-Occurrence Matrix visualisation

18 CHAPTER 3. USED TECHNOLOGIES
3.5 FPDF
To generate a report, FPDF was used. FPDF is a PHP class, which generates
PDF files. It can be retrieved from http://www.fpdf.org.
3.6 Wkhtmltopdf
Wkhtmltopdf is software used to generate PDF files from HTML. When
generating report, pictures of visualisation are also shown. D3 is a JavaScript
based library, which means that the code to generate visualisation is run
on the client side. To save generated visualisation, some interface must be
available, which can act as a client. Wkhtmltopdf is used to create snapshots
of this visualisations so that they can later be integrated in report.
If application is run on a Linux based system that supports aptitude, next
commands should be executed.
sudo apt−get i n s t a l l x i n i t Ê
sudo apt−get i n s t a l l xvfb Ë
sudo apt−get i n s t a l l wkhtmltopdf Ì
Ê Xinit is needed to install everything necessary for X Windows System to
work.
Ë Xvfb is X11 server, that can perform graphical operations, without show-
ing any screen output.
Ì Wkhtmltopdf is the previously described application.
To start Wkhtmltopdf in a shell it must be run through Xvfb. Script to
start Wkhtmltopdf through Xvfb is already included in this application in
file wkhtmltopdf.sh. Contents of this file are as follows:
xvfb−run −a −s ”−s c r e en 0 640 x480x16” wkhtmltopdf $∗ r
If aptitude is not available, following installation guide is available at
http://code.google.com/p/wkhtmltopdf/wiki/compilation. Note that
Wkhtmltopdf must be accessible to wkhtmltopdf.sh if visualisations are to

3.7. WEBSITE TEMPLATE 19
be integrated in the report. If this application is not available, option to
show visualisations in the report will be disabled.
3.7 Website Template
To make website look more user friendly, a web template was needed. Web
template Charisma, created by Muhammad Usman was used [18]. It is li-
censed under Apache License, Version 2.0 [19]. It had all necessary features,
had clean look and was free to use, modify and publish.
3.8 Moss
Moss (Measure Of Software Similarity) is a system for detecting software
plagiarism. As it was mentioned before, this is so-called similarity engine.
Moss was developed in 1994 and is very effective in this role. Moss service
is provided through Internet. Moss functionalities are described in Chapter
2.1. If user wishes to use Moss, an account must be created. This can be
done by sending the following email to [email protected].
r e g i s t e r u s e r
mail username@mail
Note that email address in italics is user’s email address. User then
receives ID, which is used to authenticate queries to the server. Without this
ID, Moss does not work. More on how Moss similarity engine works can be
read in Winnowing: Local Algorithms for Document Fingerprinting [20].

20 CHAPTER 3. USED TECHNOLOGIES
3.9 Facebook API
Facebook created special API (Application programming interface), so that
developers can create applications which are connected with Facebook. For
this work only queries on Facebook database are executed, so the application
development changed it’s original meaning. But in order to make queries,
application on Facebook needs to be created.
1. First step is to create Facebook account. If the investigator who uses
this application, has no account yet, one should be created. Note that
multiple and fake Facebook accounts are prohibited.
2. Next step is to create Facebook application. This is done at the fol-
lowing page: https://developers.facebook.com/apps. To create a
new application, click button ”Create New App”.
3. Enter name of application, then enter address where this application is
hosted. Address should be entered in sections ”Website with Facebook
Login” and ”App on Facebook”.
4. Then save changes and go to ”Use Graph API Explorer”. User access
token is generated, and this access token is then used when making
queries on Facebook.
Now that user access token is available, some specific characteristics of
the token must be changed. This is due to the fact that user access token
can become expired. This can happen because of four different reasons :
1. The token expires after expiration time, which is set to 2 hours by
default.
2. The token expires if user changes his password.
3. The token expires if user de-authorizes application.
4. The token expires if user logs out of Facebook.

3.9. FACEBOOK API 21
The second and third reason do not present a problem, but first and the
last do. So next thing to do is to make token valid, even if user logs out.
This means that it is available in off-line mode. Also expiry time must be
extended. Maximal expiration time is currently 60 days, so this option is
used. This can be achieved by visiting next URL. Note that APP ID, APP -
SECRET and EXISTING USER ACCESS TOKEN must be changed with
appropriate values.
https : // graph . facebook . com/oauth/ a c c e s s t ok en ?
c l i e n t i d=APP ID
&c l i e n t s e c r e t=APP SECRET
&grant type=fb exchange token
&fb exchange token=EXISTING USER ACCESS TOKEN
New access token is generated and it is shown in output. Now that user
access token is available in off-line mode and will not expire for next 60 days,
it can be used to get the required data.
To make queries on Facebook with PHP code, cURL is used. cURL
(libcurl in PHP) is a library created by Daniel Stenberg and is already inte-
grated in PHP. It allows user to connect and communicate with servers using
protocols such as HTTP, HTTPS, FTP and others. Simple example of how
HTTP request is sent with cURL is shown in Code 3.3.

22 CHAPTER 3. USED TECHNOLOGIES
<?php
func t i on r e t r i eveData ($u r l ) {$ch = c u r l i n i t ( ) ;Ê
c u r l s e t o p t a r r a y ($ch , array (Ë
CURLOPTURL => $ur l ,
CURLOPTRETURNTRANSFER => t rue
) ) ;
$ r e s u l t = cu r l e x e c ($ch ) ;Ì
c u r l c l o s e ($ch ) ;Í
r e turn $ r e s u l t ;Î
}?>
Code 3.3: Example of how cURL is used in PHP
Ê Initialize a cURL session.
Ë Set multiple options for cURL. In this case URL is defined. This is URL
where request is sent. Second parameter is enabled so that cURL returns a
string of answer, not just the value true or false. Other options could be also
added such as adding headers, port, SSL, user agent and many more, which
are not needed in this case.
Ì Perform a cURL session.
Í Close a cURL session.
Î Return results (e.g. HTML page or JSON file).
Facebook API has different options of how to make queries. The simplest
way is to use cURL and pass the appropriate URL. The following example
shows how to search for users, when user access token and search query
parameters are given. Note that even though some data is not hidden on
Facebook, one still requires user access token to have access to it. Results
from Facebook are returned in JSON format, which was previously described
in Code 3.2. Example with connecting to Facebook is shown in Code 3.4.
3.9. FACEBOOK API 23
<?php
func t i on getUsers ($search query , $ f b a c c e s s t o k en ) {$u r l = ” https : // graph . facebook . com/ search ? ac c e s s t oken =”.
$ f b a c c e s s t o k en .”&q=”. ur l encode ($search query ) .”& type=user ” ;Ê
$ r e t j s o n = re t r i eveData ($u r l ) ;Ë
$us e r s = j son decode ($ r e t j s on , t rue ) ;Ì
r e turn $us e r s ;Í
}?>
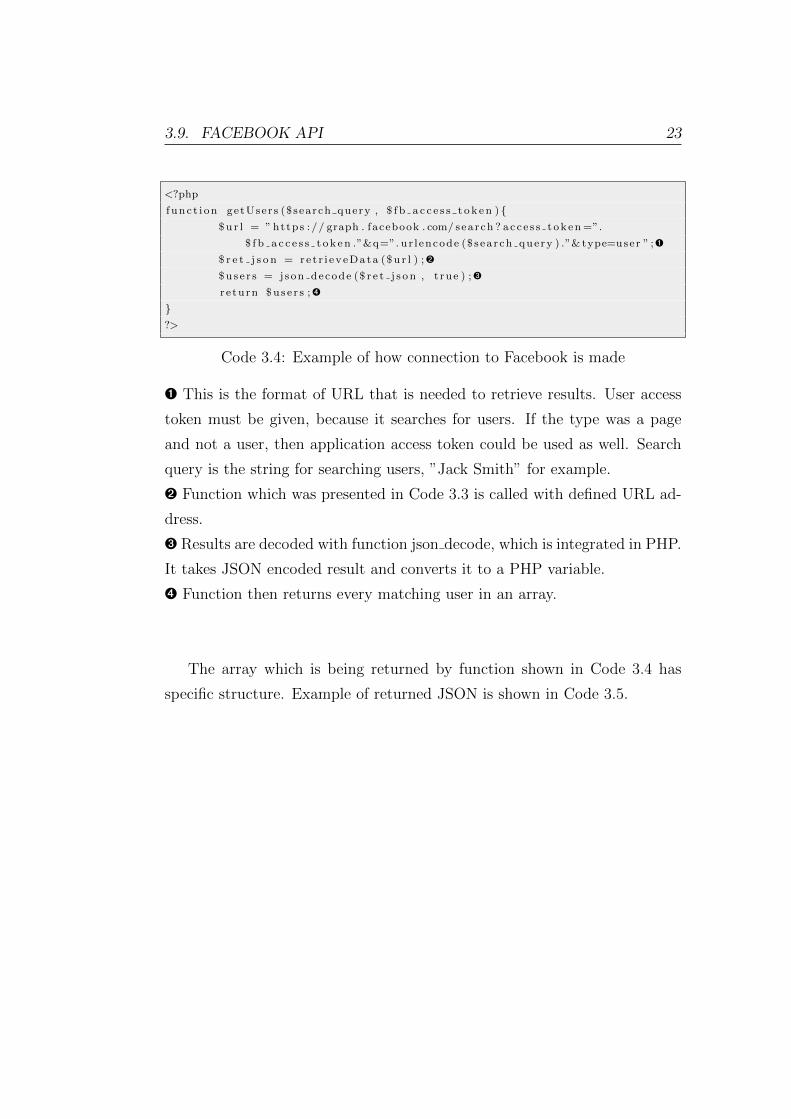
Code 3.4: Example of how connection to Facebook is made
Ê This is the format of URL that is needed to retrieve results. User access
token must be given, because it searches for users. If the type was a page
and not a user, then application access token could be used as well. Search
query is the string for searching users, ”Jack Smith” for example.
Ë Function which was presented in Code 3.3 is called with defined URL ad-
dress.
Ì Results are decoded with function json decode, which is integrated in PHP.
It takes JSON encoded result and converts it to a PHP variable.
Í Function then returns every matching user in an array.
The array which is being returned by function shown in Code 3.4 has
specific structure. Example of returned JSON is shown in Code 3.5.

24 CHAPTER 3. USED TECHNOLOGIES
{”data ” : [
{”name” : ”John Doe” ,
” id ” : ”100000000000001”
} ,{
”name” : ”Jack Smith ” ,
” id ” : ”100000000000002”
}] ,
” paging ” : {”next ” : ”<de leted , as i t i s not important f o r t h i s matter>”
}}
Code 3.5: Example of Facebook user search JSON output
The procedure is the same when retrieving user data. For this matter,
data that shows whether two users are friends must be retrieved. This is
done in example shown in Code 3.6.
<?php
func t i on r e t r i e v eF r i e nd s ($ f b u s e r i d , $ f b a c c e s s t ok en , $ f b f r i e n d i d ) {$u r l = ” https : // graph . facebook . com/” .$ f b u s e r i d . ” ? f i e l d s=f r i e n d s .
uid ( . $ f b f r i e n d i d )&acc e s s t oken =”.$ f b a c c e s s t o k en ;Ê
$ r e t j s o n = re t r i eveData ($u r l ) ;
$ f r i e n d s = j son decode ($ r e t j s on , t rue ) ;
r e turn $ f r i e n d s ;
}?>
Code 3.6: Example of how to retrieve a result that shows whether two users
are friends
Ê This is the format of URL that is needed to retrieve whether selected user
is friend with other Facebook user.
The array which is being returned by function shown in Code 3.6 has specific
structure. Example of returned JSON is shown in Code 3.7. If there is friend-
ship correlation, results in friends section will be shown. If there is no connec-
tion between selected users, data section would be empty. In this case user
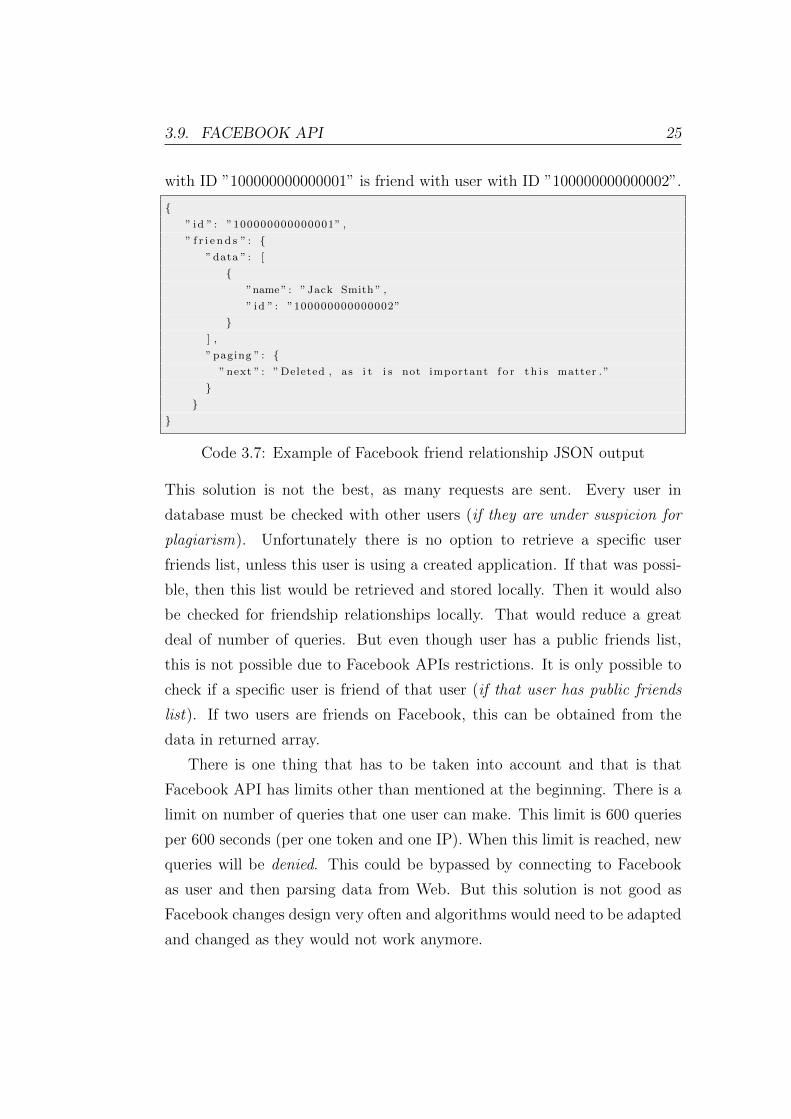
3.9. FACEBOOK API 25
with ID ”100000000000001” is friend with user with ID ”100000000000002”.
{” id ” : ”100000000000001” ,
” f r i e n d s ” : {”data ” : [
{”name” : ”Jack Smith ” ,
” id ” : ”100000000000002”
}] ,
” paging ” : {”next ” : ”Deleted , as i t i s not important f o r t h i s matter . ”
}}
}
Code 3.7: Example of Facebook friend relationship JSON output
This solution is not the best, as many requests are sent. Every user in
database must be checked with other users (if they are under suspicion for
plagiarism). Unfortunately there is no option to retrieve a specific user
friends list, unless this user is using a created application. If that was possi-
ble, then this list would be retrieved and stored locally. Then it would also
be checked for friendship relationships locally. That would reduce a great
deal of number of queries. But even though user has a public friends list,
this is not possible due to Facebook APIs restrictions. It is only possible to
check if a specific user is friend of that user (if that user has public friends
list). If two users are friends on Facebook, this can be obtained from the
data in returned array.
There is one thing that has to be taken into account and that is that
Facebook API has limits other than mentioned at the beginning. There is a
limit on number of queries that one user can make. This limit is 600 queries
per 600 seconds (per one token and one IP). When this limit is reached, new
queries will be denied. This could be bypassed by connecting to Facebook
as user and then parsing data from Web. But this solution is not good as
Facebook changes design very often and algorithms would need to be adapted
and changed as they would not work anymore.

26 CHAPTER 3. USED TECHNOLOGIES
These are the basics that are used in application. More on Facebook API
can be read at http://developers.facebook.com/docs/reference/api.

3.10. TWITTER API 27
3.10 Twitter API
Twitter has it’s own API like Facebook. The procedure to make queries is
almost identical as with Facebook. First application needs to be created to
retrieve the needed keys. With that keys user authorizes himself and then
queries can be made.
1. First step is to create Twitter account. If the investigator who uses
this application does not have account yet, one should be created.
2. Next step is to create Twitter application. This is done at the following
page: https://dev.twitter.com/apps. To create a new application,
click button ”Create a new application”.
3. Enter name of the application, description of application and then enter
address where this application is hosted.
4. Then save changes and go to ”Create my access token” in application
settings. OAuth access token is generated, and this access token is then
used when making queries on Twitter.
Now that access token (along with access token secret, consumer key and
consumer secret) is available, queries are ready to be executed. In contrast
to Facebook tokens, Twitter token does not expire. However to access to
Twitter API, OAuth is required. OAuth is an authentication protocol which
enables users to have access to Twitter API without sharing their password.
In this application, special OAuth library is used. It is called Twitter OAuth
and was created by Abraham Williams [21]. It is specifically created to
connect with Twitter API. Example of retrieving users is shown in Code 3.8.

28 CHAPTER 3. USED TECHNOLOGIES
<?php
func t i on getUsers ($search query , $consumer key , $consumer secret ,
$acce s s token , $ a c c e s s t o k e n s e c r e t ) {r e qu i r e on c e ( ’ tw i t t e roauth . php ’ ) ;Ê
$connect ion = new TwitterOAuth ($consumer key , $consumer secret ,
$acce s s token , $ a c c e s s t o k e n s e c r e t ) ;Ë
$ r e t j s o n = $connect ion−>get ( ’ https : // api . tw i t t e r . com/1/ use r s / search
. j son ?q= ’. ur l encode ($search query ) ) ;Ì
$us e r s = j son decode ( j son encode ($ r e t j s o n ) , t rue ) ;Í
r e turn $us e r s ;Î
}?>
Code 3.8: Example of how connection to Twitter is made
Ê Twitter OAuth library is loaded into script.
Ë New Twitter OAuth instance is created with corresponding keys and to-
kens.
Ì Connection to Twitter is made through Twitter OAuth library. URL,
similar to the one in Facebook, is passed with search query.
Í Results are decoded with function json decode, which is integrated in PHP.
It takes JSON encoded result and converts it to a PHP variable.
Î The function then returns every matching user in an array.
Example of structure of returned array is shown in Code 3.9. Note that
not all data is shown as it is not required for this case.
{{
” id ” : 100000001 ,
”name” : ”John Doe” ,
” screen name” : ”JohnDoe1 ” ,
} ,{
” id ” : 100000002 ,
”name” : ”Jack Smith ” ,
” screen name” : ”JSmith ” ,
}}
Code 3.9: Example of Twitter search JSON output

3.10. TWITTER API 29
When user wants to retrieve friendship data, this is similar to Facebook
API. The procedure is exactly the same as it is in Code 3.8, only the URL
is different. Line which is different as in Code 3.8 is shown below.
$ r e t j s o n = $connect ion−>get ( ’ https : // api . t w i t t e r . com/1/
f r i e n d s h i p s /show . j son ? s o u r c e i d = ’. $ s o u r c e i d . ’& t a r g e t i d = ’.
$ t a r g e t i d ) ;
Whether two users are following each other on Twitter, this can be ob-
tained from the data in returned array. Example of structure of returned
array is shown in Code 3.10. Note that not all data is shown as it is not
required for this case. In this example user with ID ”100000001” follows user
”100000002” but not the other way around.
{” r e l a t i o n s h i p ” : {
” source ” : {” fo l l owed by ” : f a l s e ,
” f o l l ow i n g ” : true ,
” id ” : 100000001 ,
” screen name” : ”JohnDoe1 ” ,
} ,” t a r g e t ” : {
” fo l l owed by ” : true ,
” f o l l ow i n g ” : f a l s e ,
” id ” : 100000002 ,
” screen name” : ”JSmith”
}}
}
Code 3.10: Example of Twitter friendship JSON output
Note that Twitter API also has limitations on how many queries can be
made. This limit is 150 queries per hour. When this number is reached
new queries will be denied. Note that this can also be bypassed like with
Facebook, but it would probably not work for long. This is due to the fact
that developers on Twitter continuously change site appearance and parsing
data from website would work only until the page is not changed. Then the
algorithm would have to be changed.

30 CHAPTER 3. USED TECHNOLOGIES
These are the basics that are used in application. More on Twitter API
can be read at https://dev.twitter.com/docs/api.

3.11. GOOGLE API 31
3.11 Google API
Connecting with Google API is very similar to Facebook and Twitter API.
The difference is only that user does not have to have an account or ap-
plication created to use API. But what user does need to provide is his IP
and referer IP address. Example of how to get results for a search query on
Google API is shown in Code 3.11. This example returns number of results.
Other data can also be retrieved and this data is presented as shown in Code
3.12.
<?php
func t i on getNumberOfResults ($ search query ) {$u r l = ’ https : // ajax . goog l e ap i s . com/ ajax / s e r v i c e s / search /web?v=1.0&q
= ’.$ search query . ’& us e r i p = ’.$ SERVER[ ’REMOTEADDR’ ] ; Ê
$ch = c u r l i n i t ( ) ;
c u r l s e t o p t ($ch , CURLOPT URL, $u r l ) ;
c u r l s e t o p t ($ch , CURLOPTREFERER, $ SERVER[ ’SERVERNAME’ ] ) ;Ë
c u r l s e t o p t ($ch , CURLOPTRETURNTRANSFER, true ) ;
$ r e s u l t h tm l = cu r l e x e c ($ch ) ;
$ r e s u l t j s o n = json decode ($ r e su l t h tml , t rue ) ;
c u r l c l o s e ($ch ) ;
r e turn $ r e s u l t j s o n [ responseData ] [ cu r so r ] [ est imatedResultCount ] ; Ì
}?>
Code 3.11: Example of how connection to Google is made
Ê URL required to get results from Google. Search query and user IP ad-
dress are passed as arguments.
Ë Among other parameters, IP address of server hosting application is passed.
Ì Number of estimated results count is returned.
32 CHAPTER 3. USED TECHNOLOGIES
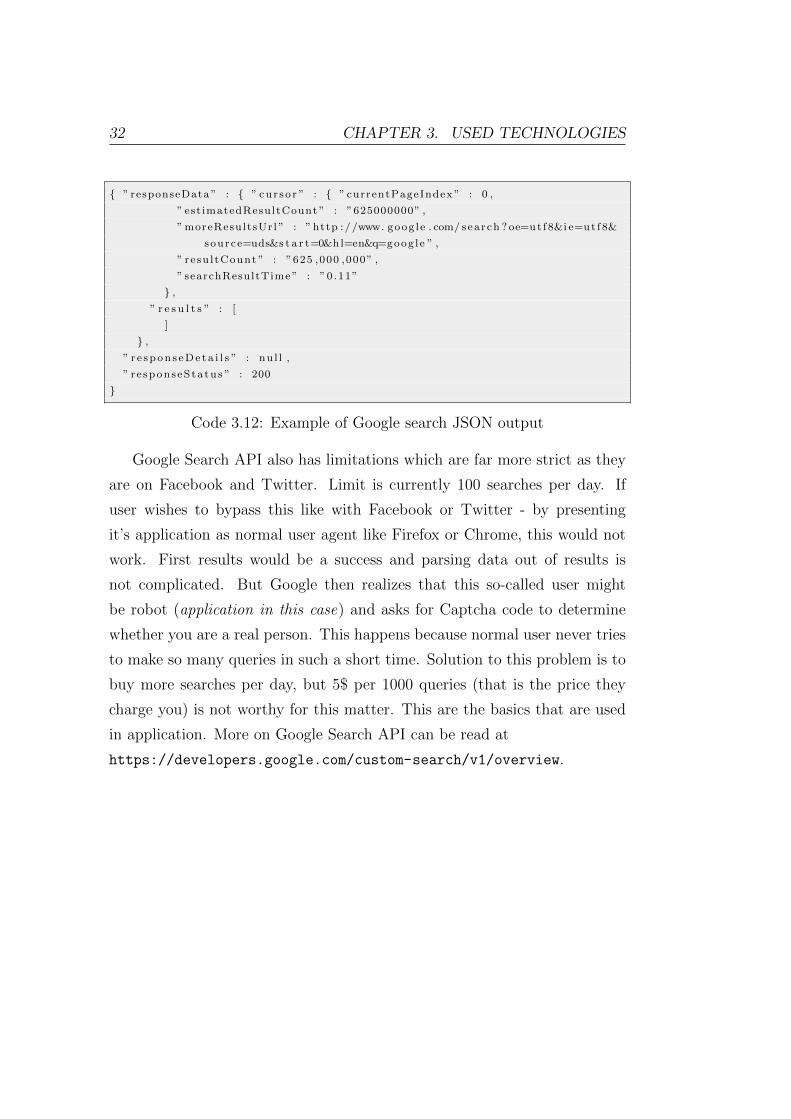
{ ” responseData ” : { ” cur so r ” : { ” currentPageIndex ” : 0 ,
” est imatedResultCount ” : ”625000000” ,
”moreResultsUrl ” : ” http ://www. goog l e . com/ search ? oe=ut f8&i e=ut f8&
source=uds&s t a r t=0&hl=en&q=goog le ” ,
” resu l tCount ” : ”625 ,000 ,000” ,
” searchResultTime ” : ”0 .11”
} ,” r e s u l t s ” : [
]
} ,” r e spon s eDe ta i l s ” : nu l l ,
” r e sponseStatus ” : 200
}
Code 3.12: Example of Google search JSON output
Google Search API also has limitations which are far more strict as they
are on Facebook and Twitter. Limit is currently 100 searches per day. If
user wishes to bypass this like with Facebook or Twitter - by presenting
it’s application as normal user agent like Firefox or Chrome, this would not
work. First results would be a success and parsing data out of results is
not complicated. But Google then realizes that this so-called user might
be robot (application in this case) and asks for Captcha code to determine
whether you are a real person. This happens because normal user never tries
to make so many queries in such a short time. Solution to this problem is to
buy more searches per day, but 5$ per 1000 queries (that is the price they
charge you) is not worthy for this matter. This are the basics that are used
in application. More on Google Search API can be read at
https://developers.google.com/custom-search/v1/overview.
Chapter 4
Implementation of PDA
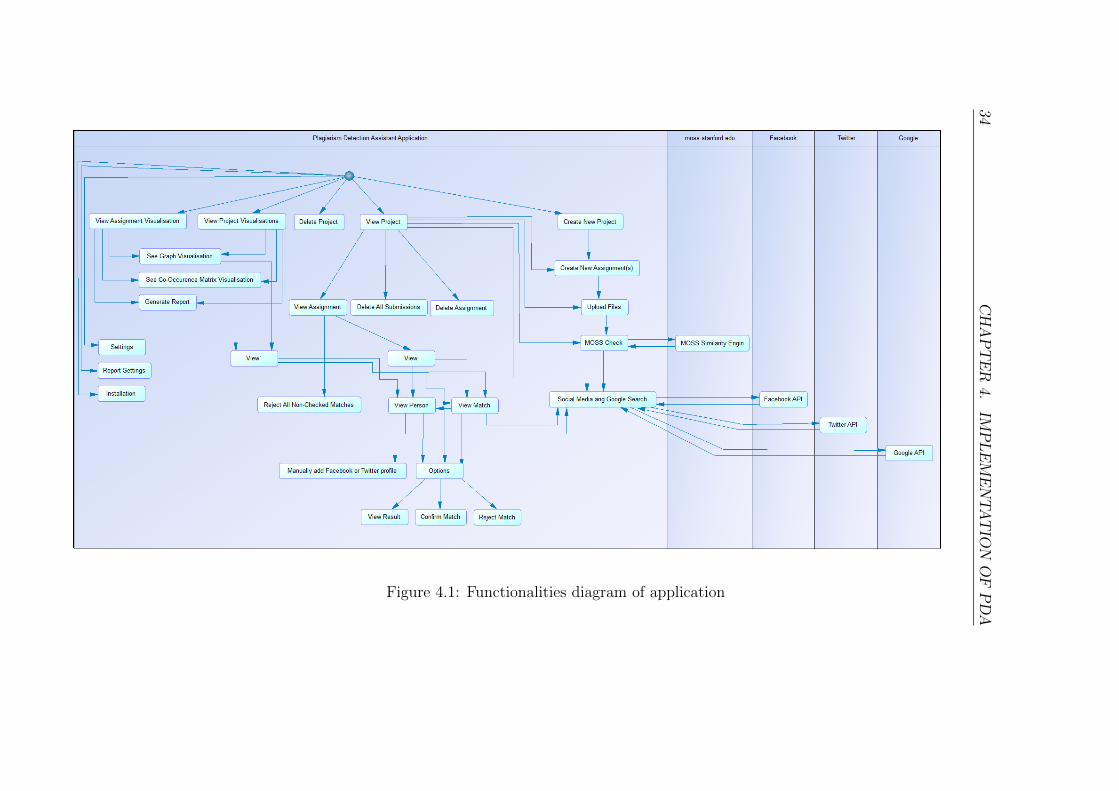
Application called Plagiarism Detection Assistant (or PDA) has multiple
functionalities available. Example of which functionalities a user can use is
shown in Figure 4.1. All functionalities shown in that figure are implemented
in this application, but names may be different compared to those in applica-
tion. Functionalities shown on the right side of diagram are also implemented
in this application but they need outside resources (moss.stanford.edu, Face-
book, Twitter and Google) to work and cannot work without them. This
chapter explains how this functionalities are implemented and how they work.
33
34CHAPTER
4.IM
PLEMENTATIO
NOFPDA
Figure 4.1: Functionalities diagram of application
4.1. DATABASE 35
4.1 Database
This diploma thesis application needs database to have different data stored.
Which data is stored in MySQL database and which is stored locally is pre-
sented in this chapter.
The data which is essential for this application to work is stored in MySQL
database as it is the most appropriate form of storing data. Figure 4.2 shows
physical diagram of database used in this application. Application is designed
so that investigator (later referenced as user of the application) creates new
project which is practically a class or module in school/university. Each class
consists of one or more assignments. And each assignment has one or more
submissions. Database is structured on the same form.
At the top of Figure 4.2 there is an entity called ”project”. Each instance
of this entity has it’s own unique ID which is also primary key. It also has
project name and project status. What the project status represents in this
case is whether this project is enabled or deleted. Every data, even if deleted
in application, still exists in database, but it is disabled. This means it will
not be shown and will not be available to user (it will look as if it is deleted).
If project status is set to ”1” it means it is enabled, if it is set to ”2” it means
it is deleted. By default status is set to ”1” when created.

36 CHAPTER 4. IMPLEMENTATION OF PDA
Figure 4.2: Physical diagram of used database
4.1. DATABASE 37
The next entity is called ”assignment”. Every project can have one or
more assignments. Each instance of this entity has it’s unique ID which is
also primary key. It also has foreign key to entity project, so every assign-
ment can be connected with the appropriate project. Assignment name is
also stored, so that the user can distinguish between different assignments.
Assignment begin date and end date are also available, but are currently not
used in application. They are only there so when next version of applica-
tion is released, it could support other functionalities in application which
have not been implemented yet. Like with entity project, this entity also has
it’s status. Assignment status can have three different values. When new
assignment is created it has assigned value ”0”. When submissions are run
through similarity engine, assignment status changes to value ”1”. If there
is a new submission uploaded to application, value changes to ”0” again. If
assignment is deleted (or project, which also includes this assignment), status
changes to value ”2”.
The next entity is called ”matches”. When submissions are run through
similarity engine, matches are returned. Each match includes data which
student (submission) is included in that match and what is the similarity
between these two submissions. Each instance of this entity has it’s unique
ID which is also primary key. It also has foreign key to be connected with
it’s assignment. In addition it also has two foreign keys which are referenced
to persons (students). As mentioned before every match has two submis-
sions connected. In this application new person is created for each submis-
sion. Submissions resulting from same person should have same file name in
different assignments, so that person can be followed through assignments.
Similarity between two submissions is also stored in this entity. Attribute
”match first sim” represents similarity that occurs between the first and the
second submission. Attribute ”match second sim” represents similarity that
occurs between the second and the first submission. Both are needed, be-
cause submissions are not of same length. The first submission can have 50%
similarity for example, and at the same time the second submission can have
38 CHAPTER 4. IMPLEMENTATION OF PDA
only 30% similarity related to the first submission. This is because there are
number of lines which are detected similar and similarity is a relative number
related to the length of file. Attribute ”match lines” is available so that num-
ber of similar lines is stored. Then there is an attribute called ”match fb”.
If there is a match found between two persons on Facebook it is stored in
this attribute. Example of entry in this attribute is ”id1&id2”. In this case
more Facebook matches are not needed because probability of more persons
with specific name and surname having friendship relation on Facebook is
very low. And for this case only information whether two persons are friends
on Facebook is needed. When searching for friendship relations on Facebook,
the algorithm stops after the first relation between two persons has been
found due to limitation of queries. If necessary, new matches can be added,
separated by comma or similar. If there is no relation found or if match has
not yet been checked for Facebook relations this attribute is empty. The
next attribute is ”match tw”, which works in the same way as ”match fb”.
The only difference is that here the direction of friendship relation is also
stored. It is stored as ”id1&id2&relation status”, where relation status can
have three different values. If relation status is ”1”, it means that the first
person follows the second person. If relation status is ”2” it means that the
second person follows the first person. If relation status is ”3” it means both
persons follow each other. Attribute ”match google” stores the number of
found results on Google. Search term on Google search query is in this case
”Name1 Surname1”+”Name2 Surname2”+”keywords”, where Name1 and
Surname1 are the name and surname of the first person in match, and the
same for the second person. Keywords are defined in settings menu and are
not mandatory. By default value of this attribute is ”-1”, which means the
search between selected persons was not yet started. If it is zero or greater
this is then the result. Attribute ”match url” has url of the similarity engine
match result. This file is stored locally (not in the database), because Moss
deletes this data from their servers after specific time. So every result is
downloaded and stored locally, and can be retrieved at any time. The last

4.1. DATABASE 39
attribute is status. Status of each match can have four possible values. If
match is added in database it gets default value ”0”. If user confirms selected
match as potential plagiate, it gets value ”1”. If it is rejected by user it gets
value ”2”. If match is deleted (this happens when corresponding assignment
or project is deleted), it gets value ”3”.
The next entity is called ”person” and stores each individual person’s
data. Every instance of this entity has its own unique ID which is also pri-
mary key. If name of the submission is for example
”Name Surname (person id).java”, name is stored in attribute ”person name”,
surname is stored in ”person surname” and person identification number is
stored in ”person ident”. Note that if person has two or more names or
surnames this will all be stored in ”person surname”. For example ”Name
Surname1 Surname2” would result in name being stored as name, and both
surnames stored in the surname attribute. If only name and surname are
provided (e.g. Name Surname.java), identification number will be generated
with the first number being project ID number, multiplied by 10000000 and
added number of which person was added (zero, one, two,...). If only iden-
tification number is provided (e.g. person id.java), name of the person will
be the same as person ID, surname will be empty and person ID will be
person ID. This entity also stores information whether Facebook or Twitter
relations were checked for this user. If it were and results were found, this
data is then stored in separated entity, because more results can be retrieved
for each user. By default this value is ”0” and means it was not checked. If
it is ”1” it means it was checked. If it is ”2” on the other hand it means that
this user has already been checked for Facebook accounts but relations check
was not yet started.
The next entity is called ”tw account”. Each instance of this entity has its
own unique ID which is also primary key. It also has foreign key which refers
to specific person. Twitter user ID is stored as well as it’s full name (tw -
name) and so called Twitter name (tw username), which is another option
for ID. The same data is stored for Facebook in the entity called ”fb account”,
40 CHAPTER 4. IMPLEMENTATION OF PDA
except that Facebook name is not stored as it is not required. Both also have
attribute called fb status or tw status. This attribute can have three values.
If it is ”0” it means it was added automatically when starting the search. If
it is ”1” it means it that user confirmed this account as correct one. If it is
”2” it means it was deleted by user as it was not correct.
This is everything concerning the MySQL database, but this application
also stores other data. This data is stored locally in map called ”projects”.
Each project has subfolders of assignments with names of assignment IDs.
Each assignment folder then has two more folders called ”moss” and ”sub-
missions”. In map ”submissions” all submissions are stored. In map ”moss”,
results of Moss are stored. If Moss was started multiple times, all results
are stored, but only the latest are used. This happens when user adds sub-
missions and starts Moss check. Then he can re-upload files, or upload new
files and starts Moss check again. New results are stored locally and changed
in database. Old matches are disabled. Old users stay in database. Note
that when submissions are uploaded and Moss check is done, Moss check
cannot be redone until after the change in submission area was made (new
file uploaded, files deleted,...).

4.2. USE OF MOSS 41
4.2 Use of Moss
When starting Moss check in this application, ID of the assignment is given
to the function which starts Moss check. First Moss script is started. By
default there are no special parameters given to the script. Script returns
URL of the results and they are downloaded to the local folder. Because
every result file was originally stored at Moss site (http://moss.stanford.
edu/results), every file must be changed so it can be used locally. This is
done by exchanging every link in results files with the appropriate one. After
that, results need to be converted and stored in database. First thing that is
done is that every match in database, which has the same assignment ID as
the current one is changed to disabled. If there are no matches yet, nothing
is done. But when there are (as described in the previous chapter, when
starting Moss check more than once), they need to be disabled as new will
be stored in database. Next assignment status is set to ”1”, which means it
was checked with Moss. At that time Moss check button (for this assignment)
disappears.
Results are then parsed with DOM (Document Object Model). First, per-
sons are created in database. At the beginning, procedure checks whether
user with the same user identification number already exists in the database
and if not, new is created. If the person already exists this part is skipped.
After two persons from match are added to database, new match is created.
Every data that was retrieved from parsing is added. Note that file format
must be as it was previously described (e.g. Name Surname (ident).java,
Name Surname1 Surname2 (ident).java, Name Surname.java,
Name Surname1 Surname2.java or ident.java). Number of surnames is un-
limited. Extension of file can be everything (c, java, php, cpp,...).

42 CHAPTER 4. IMPLEMENTATION OF PDA
4.3 Social Media and Google Search
4.3.1 Facebook
Due to limitations regarding the number of permitted queries (as mentioned
before, 600 queries per 600 seconds), functionality to check only first N
matches was added. In settings menu user can select so called Social me-
dia start and end position, which specifies which matches will be checked.
For instance if start position is set to ”0” and end position is set to ”9”
only first ten matches will be checked for Facebook, Twitter or Google. This
means that first ten matches will be checked. Note that if the tenth or greater
match (ordered by ”match first sim”) has the same similarity as the ninth,
this will also be used. How does this work: when user defines upper and
lower limit at matches, this algorithm checks similarity at that match and
when matches are checked with Social media and Google, they are limited
by similarity; so not necessarily the first ten will be checked, but it can also
happen that more will be checked. This functionality is added in this way
because user has limitations on queries and if he wishes to check all of them
he can easily check first ten matches, and then after six hundred seconds
he can repeat the procedure for next ten matches. Option to check specific
person or match is available as well.
At the beginning minimal and maximal allowed similarity is calculated
according to given settings. Then each user from database that complies with
limitations is selected. Note that one limitation is that match which is used
in current assignment must not have attribute ”match status” set to three as
this means it is disabled/deleted. Next users are searched like in Code 3.4.
Search query is in this case ”Name Surname” of each person. Facebook user
search does not provide 100% accurate results so they need to be checked
locally. This is done as follows. For every person two names are generated.
First is ”Name Surname” and second one is ”Surname Name”. For both
names Levenshtein distance is calculated with each retrieved result [22]. If
Levenshtein distance between the first generated name and retrieved name or
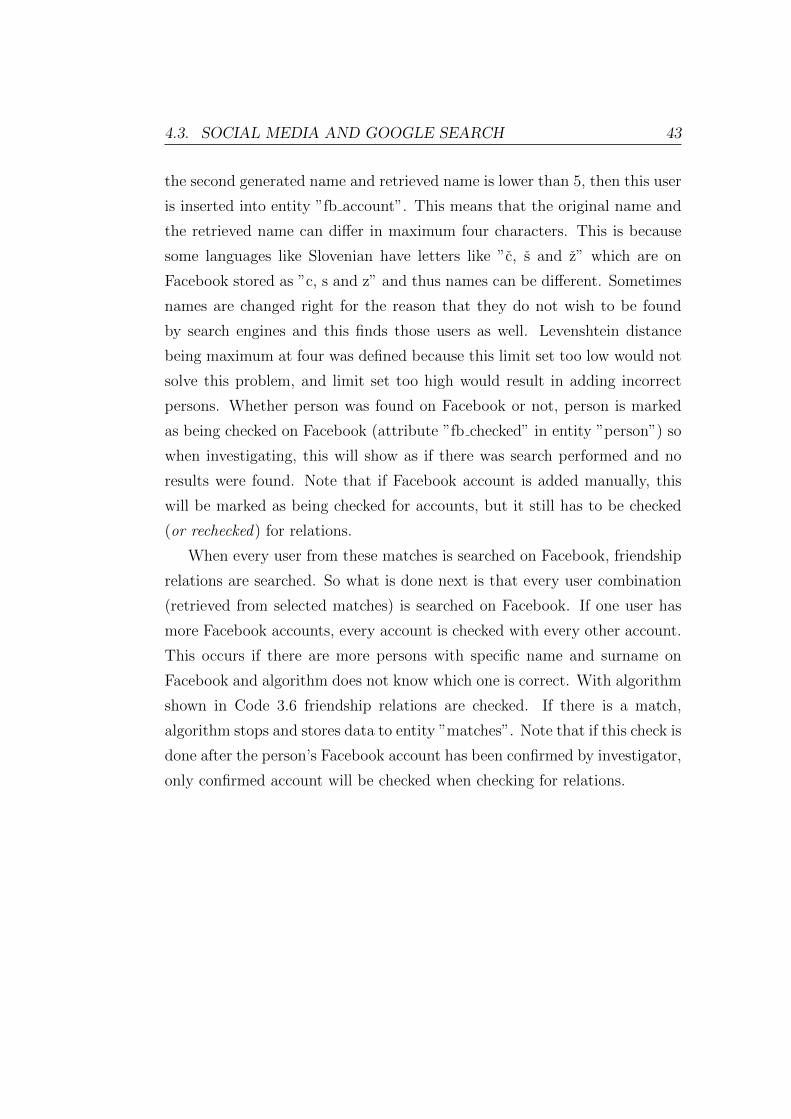
4.3. SOCIAL MEDIA AND GOOGLE SEARCH 43
the second generated name and retrieved name is lower than 5, then this user
is inserted into entity ”fb account”. This means that the original name and
the retrieved name can differ in maximum four characters. This is because
some languages like Slovenian have letters like ”c, s and z” which are on
Facebook stored as ”c, s and z” and thus names can be different. Sometimes
names are changed right for the reason that they do not wish to be found
by search engines and this finds those users as well. Levenshtein distance
being maximum at four was defined because this limit set too low would not
solve this problem, and limit set too high would result in adding incorrect
persons. Whether person was found on Facebook or not, person is marked
as being checked on Facebook (attribute ”fb checked” in entity ”person”) so
when investigating, this will show as if there was search performed and no
results were found. Note that if Facebook account is added manually, this
will be marked as being checked for accounts, but it still has to be checked
(or rechecked) for relations.
When every user from these matches is searched on Facebook, friendship
relations are searched. So what is done next is that every user combination
(retrieved from selected matches) is searched on Facebook. If one user has
more Facebook accounts, every account is checked with every other account.
This occurs if there are more persons with specific name and surname on
Facebook and algorithm does not know which one is correct. With algorithm
shown in Code 3.6 friendship relations are checked. If there is a match,
algorithm stops and stores data to entity ”matches”. Note that if this check is
done after the person’s Facebook account has been confirmed by investigator,
only confirmed account will be checked when checking for relations.
44 CHAPTER 4. IMPLEMENTATION OF PDA
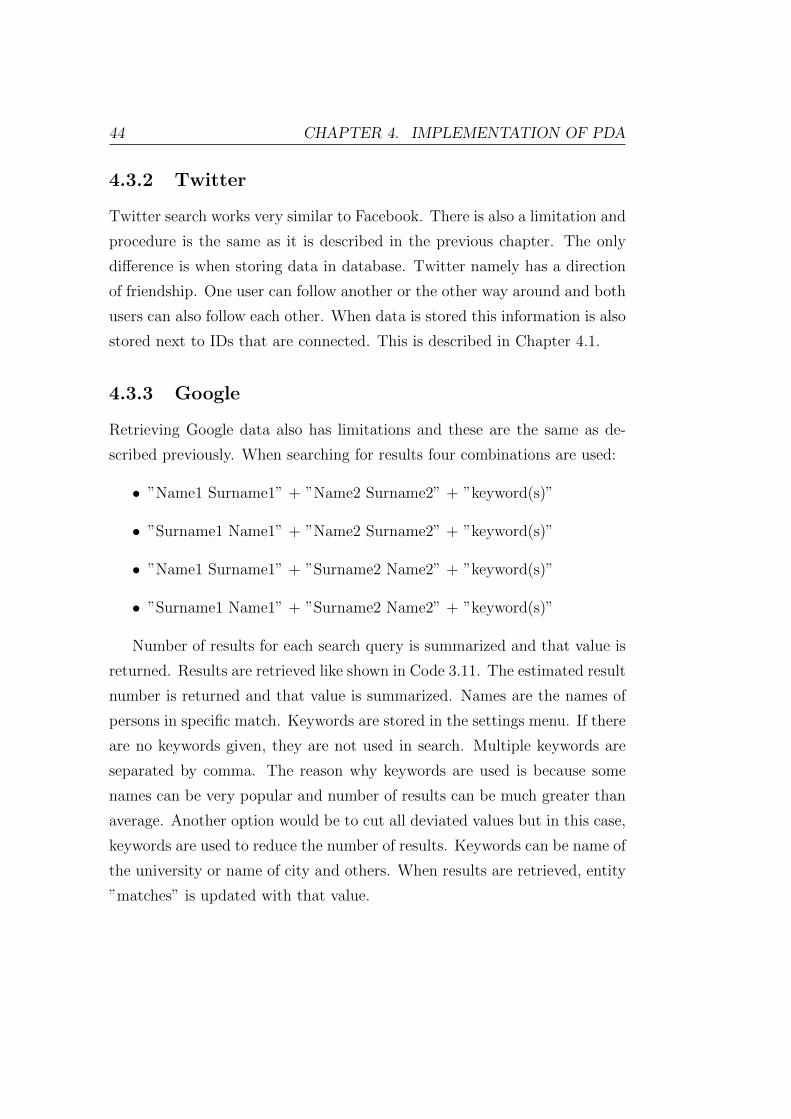
4.3.2 Twitter
Twitter search works very similar to Facebook. There is also a limitation and
procedure is the same as it is described in the previous chapter. The only
difference is when storing data in database. Twitter namely has a direction
of friendship. One user can follow another or the other way around and both
users can also follow each other. When data is stored this information is also
stored next to IDs that are connected. This is described in Chapter 4.1.
4.3.3 Google
Retrieving Google data also has limitations and these are the same as de-
scribed previously. When searching for results four combinations are used:
• ”Name1 Surname1” + ”Name2 Surname2” + ”keyword(s)”
• ”Surname1 Name1” + ”Name2 Surname2” + ”keyword(s)”
• ”Name1 Surname1” + ”Surname2 Name2” + ”keyword(s)”
• ”Surname1 Name1” + ”Surname2 Name2” + ”keyword(s)”
Number of results for each search query is summarized and that value is
returned. Results are retrieved like shown in Code 3.11. The estimated result
number is returned and that value is summarized. Names are the names of
persons in specific match. Keywords are stored in the settings menu. If there
are no keywords given, they are not used in search. Multiple keywords are
separated by comma. The reason why keywords are used is because some
names can be very popular and number of results can be much greater than
average. Another option would be to cut all deviated values but in this case,
keywords are used to reduce the number of results. Keywords can be name of
the university or name of city and others. When results are retrieved, entity
”matches” is updated with that value.
4.4. FUNCTIONALITIES 45
4.4 Functionalities
4.4.1 Overview
This application has different functionalities. The most important ones are
already integrated, and the ones which are not are described in the future
work chapter at the end. When investigator opens the application and the
config file is not defined yet, installation procedure begins. This procedure
prepares the environment so that it can be used with this application. After
installation all other functionalities appear. All of them are described and
shown in the sub-chapters below.
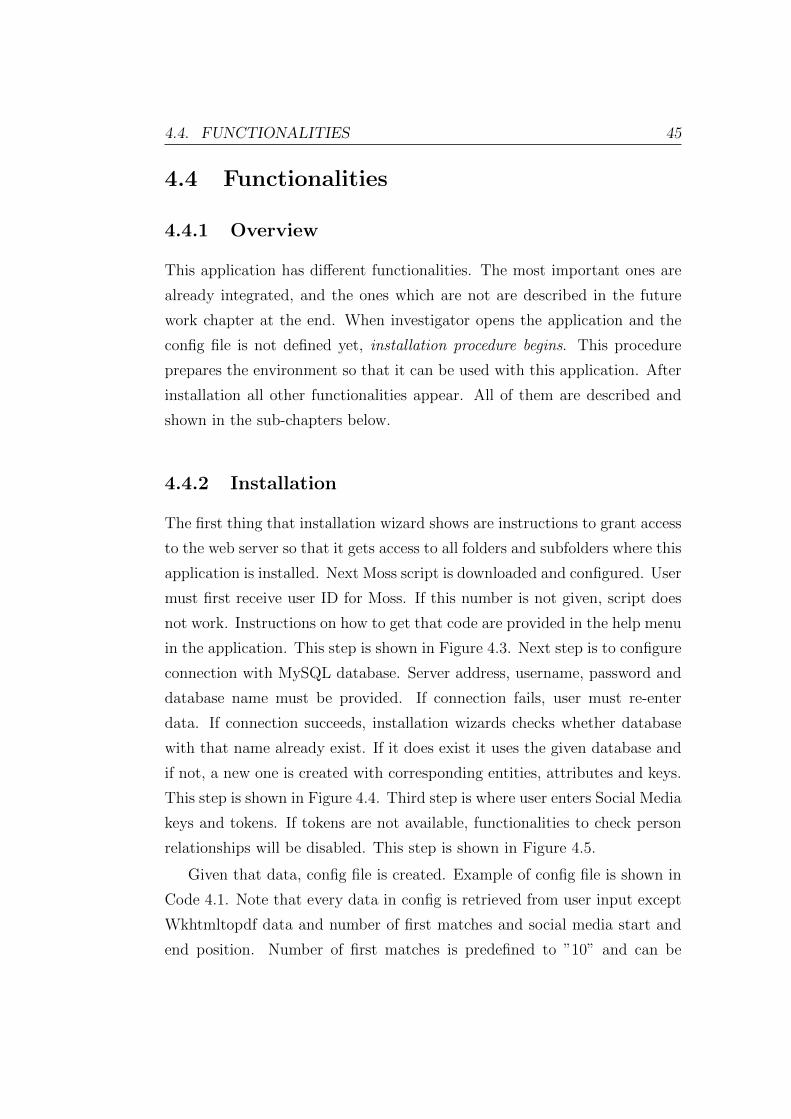
4.4.2 Installation
The first thing that installation wizard shows are instructions to grant access
to the web server so that it gets access to all folders and subfolders where this
application is installed. Next Moss script is downloaded and configured. User
must first receive user ID for Moss. If this number is not given, script does
not work. Instructions on how to get that code are provided in the help menu
in the application. This step is shown in Figure 4.3. Next step is to configure
connection with MySQL database. Server address, username, password and
database name must be provided. If connection fails, user must re-enter
data. If connection succeeds, installation wizards checks whether database
with that name already exist. If it does exist it uses the given database and
if not, a new one is created with corresponding entities, attributes and keys.
This step is shown in Figure 4.4. Third step is where user enters Social Media
keys and tokens. If tokens are not available, functionalities to check person
relationships will be disabled. This step is shown in Figure 4.5.
Given that data, config file is created. Example of config file is shown in
Code 4.1. Note that every data in config is retrieved from user input except
Wkhtmltopdf data and number of first matches and social media start and
end position. Number of first matches is predefined to ”10” and can be

46 CHAPTER 4. IMPLEMENTATION OF PDA
Figure 4.3: Screen capture of installation step 1
Figure 4.4: Screen capture of installation step 2

4.4. FUNCTIONALITIES 47
Figure 4.5: Screen capture of installation step 3

48 CHAPTER 4. IMPLEMENTATION OF PDA
later changed in the settings section. The same goes with social media start
position which is set to ”0” and end position to ”10”. To put visualisation
images in PDF report, Wkhtmltopdf is required. Installation procedure for
Wkhtmltopdf is described in Chapter 3.6. If this application does not exist
it will be disabled. If it does exist it will be enabled.
<?php
///////////////////////////////////////////////////////////////////////////
// //
// Plag iar i sm V i s u a l i s a t i o n Config F i l e
// User s e t t i n g s
// //
///////////////////////////////////////////////////////////////////////////
// Database c on f i g u r a t i on (MySQL)
$db host=” l o c a l h o s t ” ;
$db user=”username ” ;
$db pass=”secre tpassword ” ;
$db name=”p l a gv i s ” ;
// Facebook con f i g u r a t i on
$ f b a c c e s s t o k en=”exampleFacebookAccessToken123 ” ;
// Twitter c on f i gu r a i t on
$tw consumer key = ”exampleTwitterConsumerKey ” ;
$tw consumer secre t = ”exampleTwitterConsumerSecret ” ;
$ tw acce s s token = ”exampleTwitterAccessToken ” ;
$ tw a c c e s s t o k en s e c r e t = ” exampleTwitterAccessTokenSecret ” ;
// Google search keywords
$goog l e s ea rch keywords=array (” s tan fo rd ”) ;
// Show number o f f i r s t matches at v i s u a l i s a t i o n
$numbe r o f p e r s on s s im i l a r i t y =10;
// So c i a l media s t a r t and end po s i t i o n
$ s o c i a l m e d i a s t a r t p o s i t i o n =0;
$ s o c i a l med i a end po s i t i o n =10;
// I f wkhtmltopdf i s enabled
$wkhtmltopdf = 1 ;
?>
Code 4.1: Example of Application Config File
4.4. FUNCTIONALITIES 49
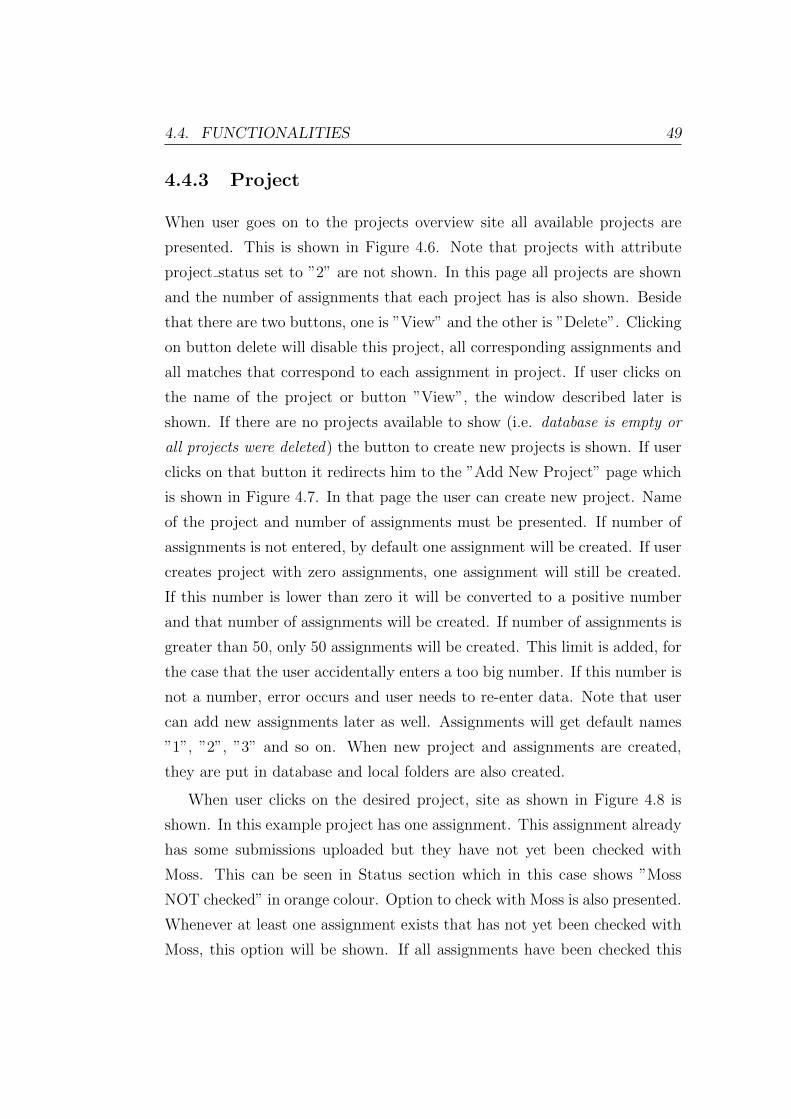
4.4.3 Project
When user goes on to the projects overview site all available projects are
presented. This is shown in Figure 4.6. Note that projects with attribute
project status set to ”2” are not shown. In this page all projects are shown
and the number of assignments that each project has is also shown. Beside
that there are two buttons, one is ”View” and the other is ”Delete”. Clicking
on button delete will disable this project, all corresponding assignments and
all matches that correspond to each assignment in project. If user clicks on
the name of the project or button ”View”, the window described later is
shown. If there are no projects available to show (i.e. database is empty or
all projects were deleted) the button to create new projects is shown. If user
clicks on that button it redirects him to the ”Add New Project” page which
is shown in Figure 4.7. In that page the user can create new project. Name
of the project and number of assignments must be presented. If number of
assignments is not entered, by default one assignment will be created. If user
creates project with zero assignments, one assignment will still be created.
If this number is lower than zero it will be converted to a positive number
and that number of assignments will be created. If number of assignments is
greater than 50, only 50 assignments will be created. This limit is added, for
the case that the user accidentally enters a too big number. If this number is
not a number, error occurs and user needs to re-enter data. Note that user
can add new assignments later as well. Assignments will get default names
”1”, ”2”, ”3” and so on. When new project and assignments are created,
they are put in database and local folders are also created.
When user clicks on the desired project, site as shown in Figure 4.8 is
shown. In this example project has one assignment. This assignment already
has some submissions uploaded but they have not yet been checked with
Moss. This can be seen in Status section which in this case shows ”Moss
NOT checked” in orange colour. Option to check with Moss is also presented.
Whenever at least one assignment exists that has not yet been checked with
Moss, this option will be shown. If all assignments have been checked this
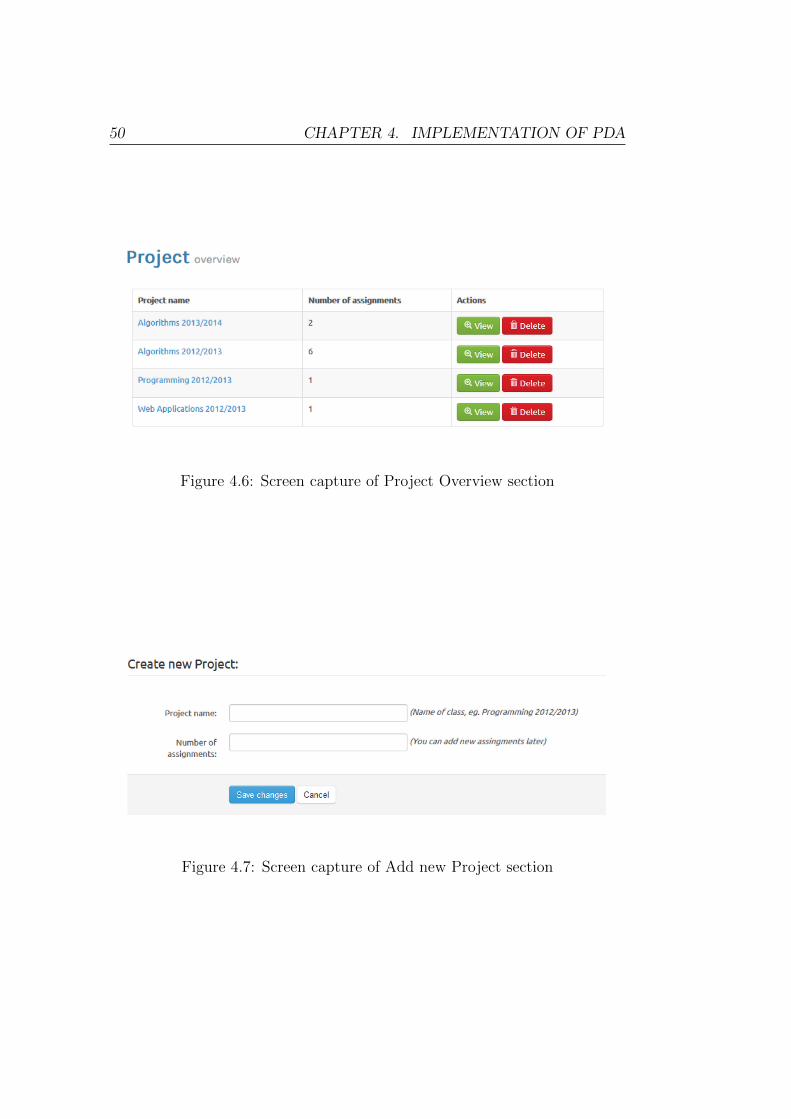
50 CHAPTER 4. IMPLEMENTATION OF PDA
Figure 4.6: Screen capture of Project Overview section
Figure 4.7: Screen capture of Add new Project section
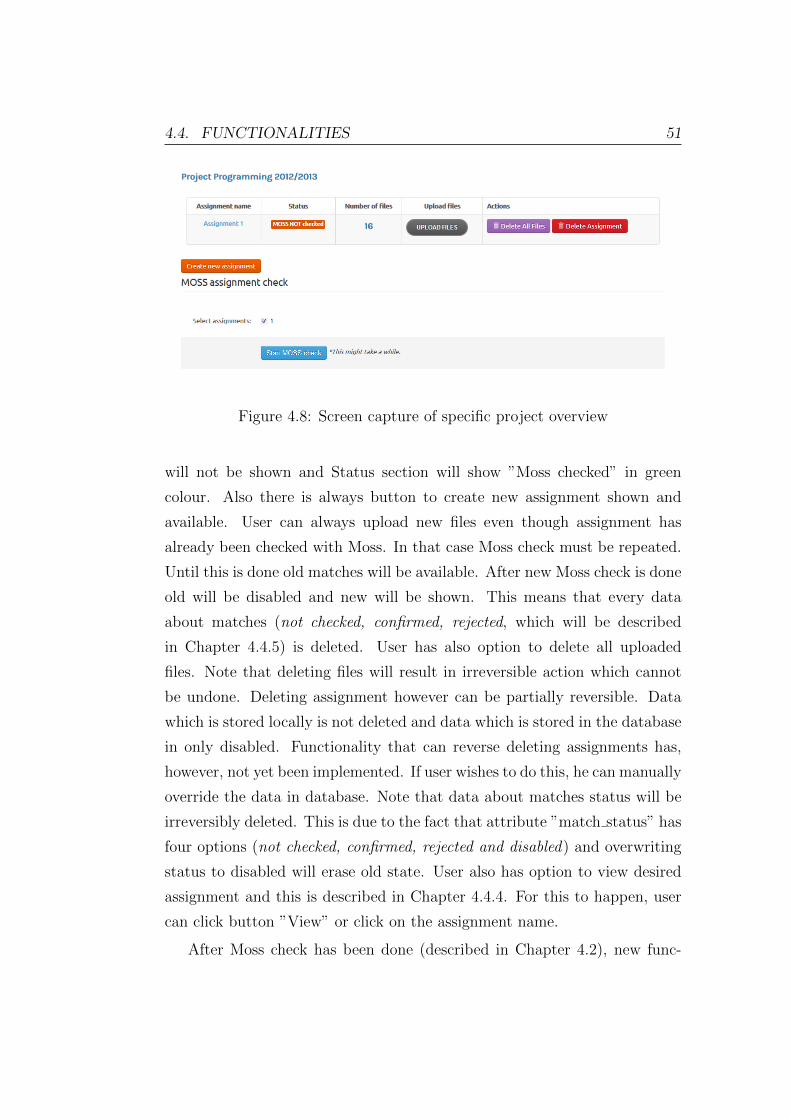
4.4. FUNCTIONALITIES 51
Figure 4.8: Screen capture of specific project overview
will not be shown and Status section will show ”Moss checked” in green
colour. Also there is always button to create new assignment shown and
available. User can always upload new files even though assignment has
already been checked with Moss. In that case Moss check must be repeated.
Until this is done old matches will be available. After new Moss check is done
old will be disabled and new will be shown. This means that every data
about matches (not checked, confirmed, rejected, which will be described
in Chapter 4.4.5) is deleted. User has also option to delete all uploaded
files. Note that deleting files will result in irreversible action which cannot
be undone. Deleting assignment however can be partially reversible. Data
which is stored locally is not deleted and data which is stored in the database
in only disabled. Functionality that can reverse deleting assignments has,
however, not yet been implemented. If user wishes to do this, he can manually
override the data in database. Note that data about matches status will be
irreversibly deleted. This is due to the fact that attribute ”match status” has
four options (not checked, confirmed, rejected and disabled) and overwriting
status to disabled will erase old state. User also has option to view desired
assignment and this is described in Chapter 4.4.4. For this to happen, user
can click button ”View” or click on the assignment name.
After Moss check has been done (described in Chapter 4.2), new func-
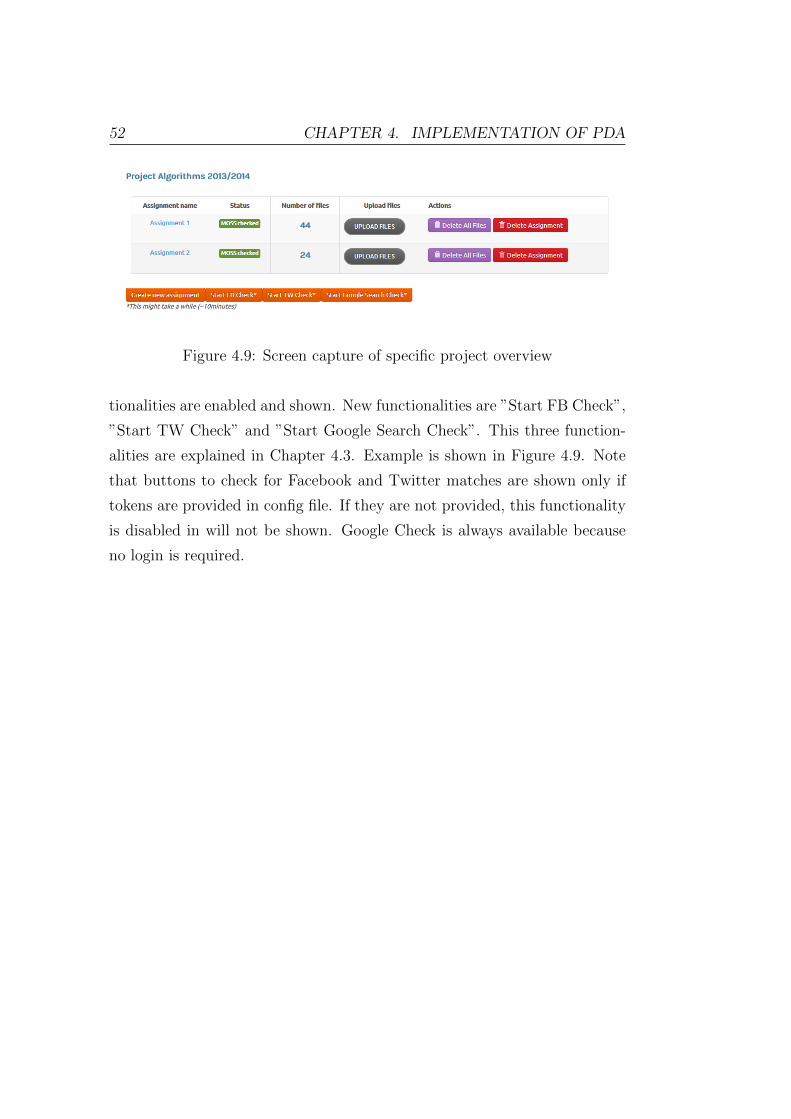
52 CHAPTER 4. IMPLEMENTATION OF PDA
Figure 4.9: Screen capture of specific project overview
tionalities are enabled and shown. New functionalities are ”Start FB Check”,
”Start TW Check” and ”Start Google Search Check”. This three function-
alities are explained in Chapter 4.3. Example is shown in Figure 4.9. Note
that buttons to check for Facebook and Twitter matches are shown only if
tokens are provided in config file. If they are not provided, this functionality
is disabled in will not be shown. Google Check is always available because
no login is required.

4.4. FUNCTIONALITIES 53
4.4.4 Assignment
When user clicks on the desired assignment, data concerned with this as-
signment is shown. At the top of the site there is some basic statistical data
which is shown in Figure 4.10. This functionality covers the following data:
• Number of matches that were detected in current assignment
• Average similar lines that were among all detected matches
• Maximal similar lines that were among all detected matches
• Average similarity that was detected through every match (first average
between two users in one match is calculated and then average of all
those averages)
• Maximal similarity that has been detected (from average of both simi-
larities in one match)
• Minimal similarity that has been detected (from average of both simi-
larities in one match)
• Number of matches that have not yet been checked (i.e. confirmed or
rejected).
In that part there is also functionality to reject all non-checked matches.
When user confirms or rejects some matches, he can decide to stop checking.
Usually user does not check every match but only first few, or those that
have large similarity. With that button he rejects all other matches and thus
examination in this assignment is completed.
The other section in this assignment view is a list of all matches. Example
is shown in Figure 4.11. Every match has two persons. In first column there
is the first person and in second column there is the second person. The
third column shows average similarity between these two persons. Fourth
column shows how many lines were found similar between these two per-
sons’ submissions. The fifth column shows whether a specific match was
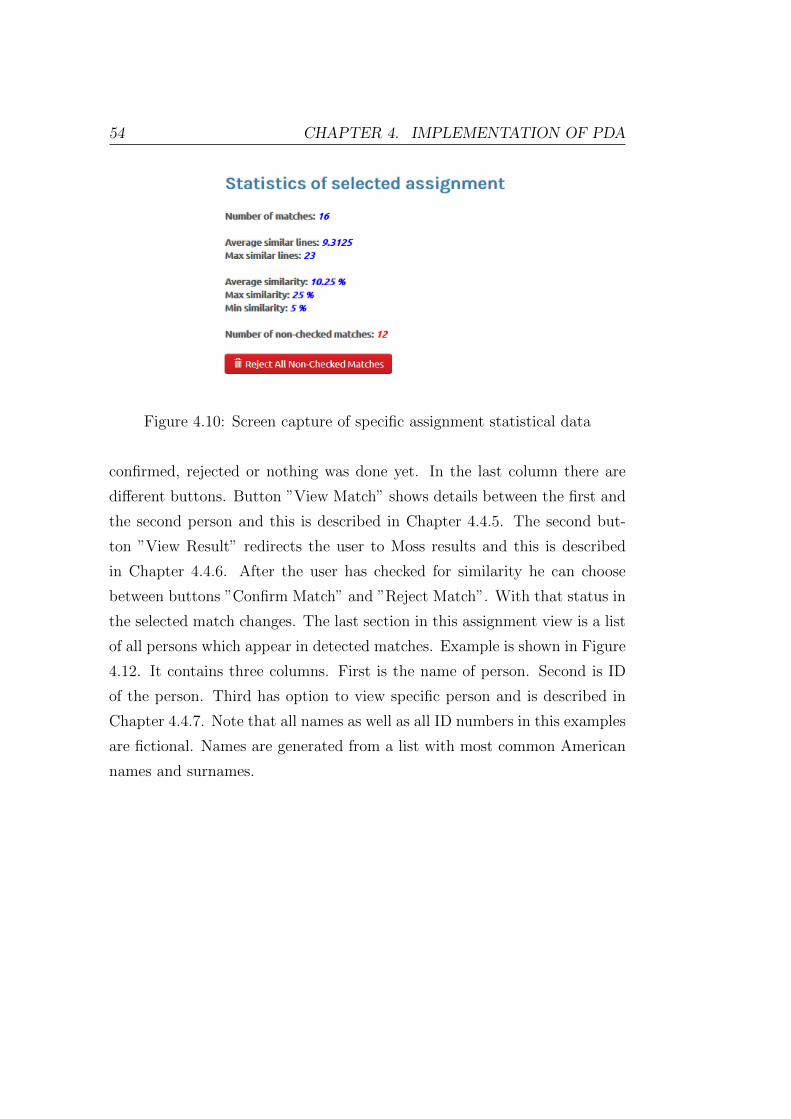
54 CHAPTER 4. IMPLEMENTATION OF PDA
Figure 4.10: Screen capture of specific assignment statistical data
confirmed, rejected or nothing was done yet. In the last column there are
different buttons. Button ”View Match” shows details between the first and
the second person and this is described in Chapter 4.4.5. The second but-
ton ”View Result” redirects the user to Moss results and this is described
in Chapter 4.4.6. After the user has checked for similarity he can choose
between buttons ”Confirm Match” and ”Reject Match”. With that status in
the selected match changes. The last section in this assignment view is a list
of all persons which appear in detected matches. Example is shown in Figure
4.12. It contains three columns. First is the name of person. Second is ID
of the person. Third has option to view specific person and is described in
Chapter 4.4.7. Note that all names as well as all ID numbers in this examples
are fictional. Names are generated from a list with most common American
names and surnames.

4.4. FUNCTIONALITIES 55
Figure 4.11: Screen capture of specific assignment list of matches

56 CHAPTER 4. IMPLEMENTATION OF PDA
Figure 4.12: Screen capture of specific assignment list of persons
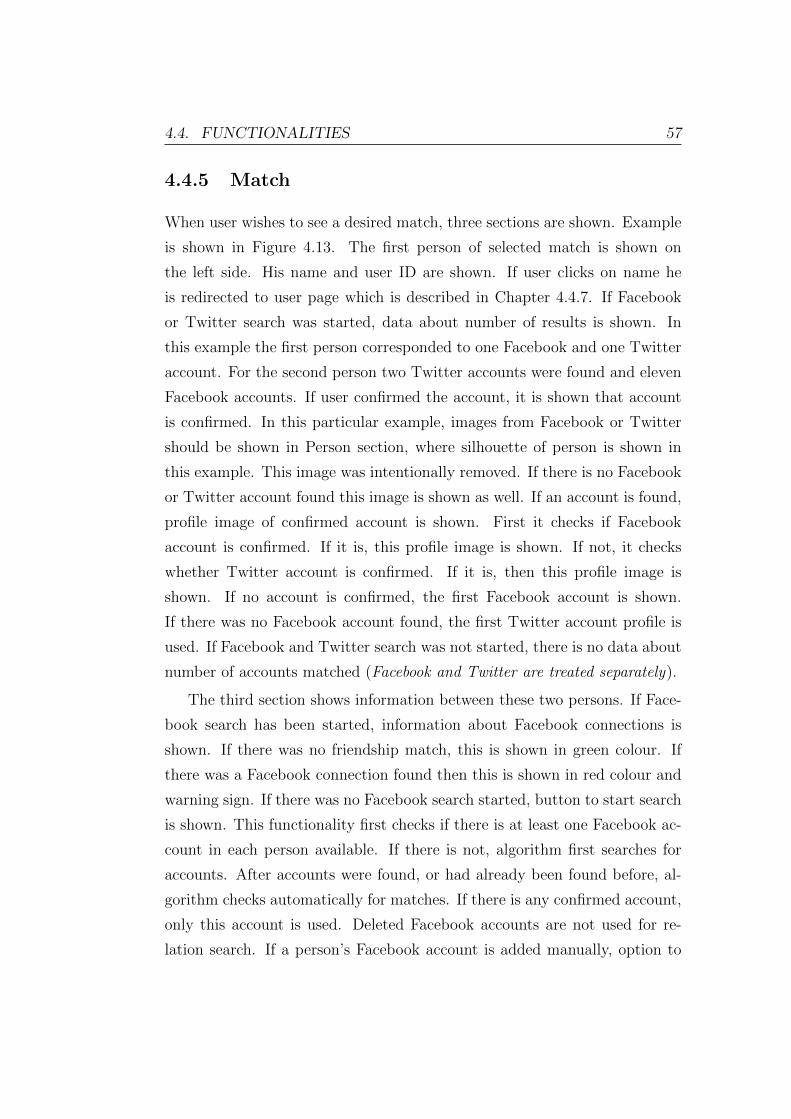
4.4. FUNCTIONALITIES 57
4.4.5 Match
When user wishes to see a desired match, three sections are shown. Example
is shown in Figure 4.13. The first person of selected match is shown on
the left side. His name and user ID are shown. If user clicks on name he
is redirected to user page which is described in Chapter 4.4.7. If Facebook
or Twitter search was started, data about number of results is shown. In
this example the first person corresponded to one Facebook and one Twitter
account. For the second person two Twitter accounts were found and eleven
Facebook accounts. If user confirmed the account, it is shown that account
is confirmed. In this particular example, images from Facebook or Twitter
should be shown in Person section, where silhouette of person is shown in
this example. This image was intentionally removed. If there is no Facebook
or Twitter account found this image is shown as well. If an account is found,
profile image of confirmed account is shown. First it checks if Facebook
account is confirmed. If it is, this profile image is shown. If not, it checks
whether Twitter account is confirmed. If it is, then this profile image is
shown. If no account is confirmed, the first Facebook account is shown.
If there was no Facebook account found, the first Twitter account profile is
used. If Facebook and Twitter search was not started, there is no data about
number of accounts matched (Facebook and Twitter are treated separately).
The third section shows information between these two persons. If Face-
book search has been started, information about Facebook connections is
shown. If there was no friendship match, this is shown in green colour. If
there was a Facebook connection found then this is shown in red colour and
warning sign. If there was no Facebook search started, button to start search
is shown. This functionality first checks if there is at least one Facebook ac-
count in each person available. If there is not, algorithm first searches for
accounts. After accounts were found, or had already been found before, al-
gorithm checks automatically for matches. If there is any confirmed account,
only this account is used. Deleted Facebook accounts are not used for re-
lation search. If a person’s Facebook account is added manually, option to

58 CHAPTER 4. IMPLEMENTATION OF PDA
recheck relations is shown. If this is done, previous data about relations is
deleted and is searched again. The process is the same with Twitter. The
only difference is that the direction of friendship is shown as well. The process
is then the same as with Google with the difference in information output.
If there was any result found statistical data from database is shown. The
following data is presented: average number of results for those matches that
were confirmed, those matches that were rejected and those matches that
have not yet been checked. This data includes all data in database and not
just data from the current assignment or project. Information of how many
results were found on Google can’t help user if he does not know what are
the averages. If for example average result for rejected matches was near zero
and average result for confirmed matches was around number ten, that would
mean that possibility of these two persons knowing each other is greater than
if they did not know each other. If Google Search was not yet started, button
to start Google search for this match is shown. At the bottom of this site in-
formation about these two persons matches is shown. For every assignment,
where similarity was found in the current project a new row is generated. The
first column shows the name of the assignment. The second column shows
the number of lines that were found similar in that assignment submissions.
The third shows average similarity in that match. The fourth column shows
status, whether this match has already been rejected or confirmed. The fifth
row has three options. The first one is to view Moss results, the second one
is to confirm the selected match and the last one is to reject it.
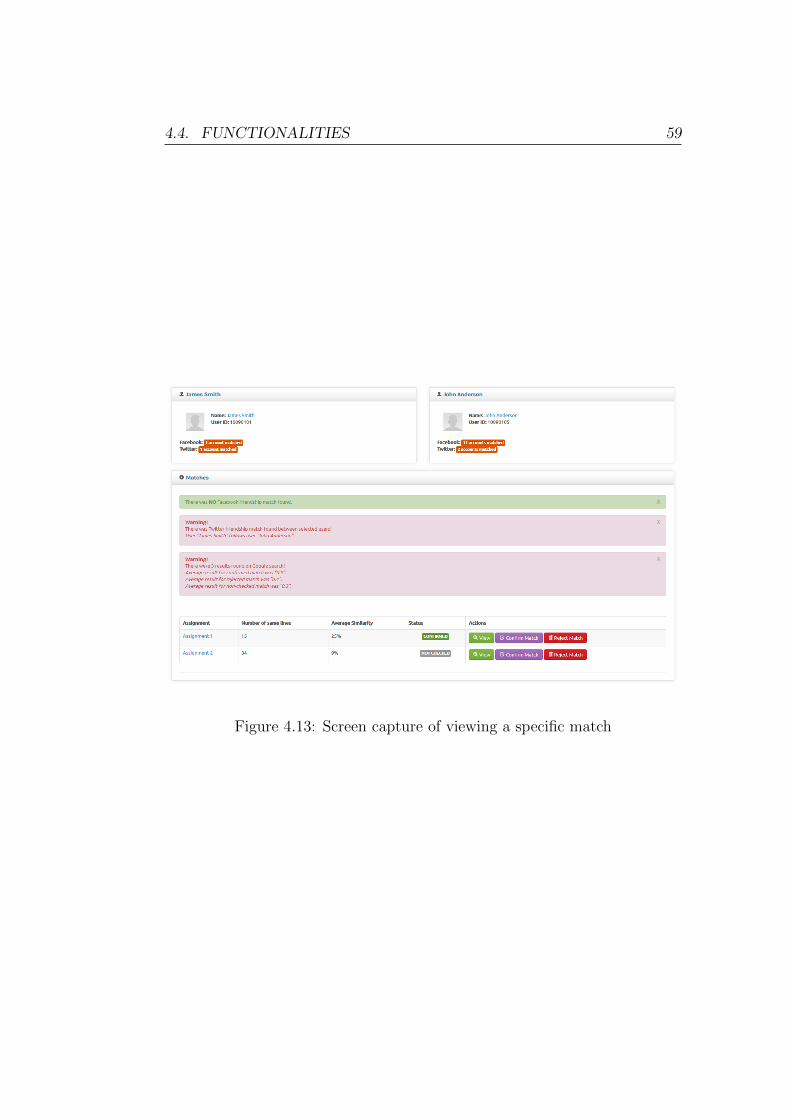
4.4. FUNCTIONALITIES 59
Figure 4.13: Screen capture of viewing a specific match

60 CHAPTER 4. IMPLEMENTATION OF PDA
4.4.6 Result
When user wishes to see a desired Moss match, he is redirected to appropriate
URL. Note that because Moss software deletes results after some time, they
were downloaded locally. Example of how this results can be seen is shown
in Figure 2.2. This page opens in a new window, so user can easily go back
to match and confirm or reject it.
4.4.7 Person
When user clicks on person, information about that person is shown. Ex-
ample is shown in Figure 4.14. This part is also divided in three sections.
The first section includes person’s name and ID. Profile image is selected like
it is selected when viewing a match. The second section shows information
about Social media. If Facebook or Twitter accounts exist they are shown
here. Links to their sites are provided so user can check them. If there are no
matches, it shows that there are no matches found. If Facebook or Twitter
search has not yet been started, options to automatically check for Facebook
account or Twitter accounts is shown (if available). There is also option to
manually add Facebook or Twitter account. If user manually adds a new
account, this account is then considered as confirmed, and others become
hidden. If then the user wishes to add a new account, this one has to be
un-confirmed first. User can also manually confirm accounts that were au-
tomatically found. Last option here is to delete account and consider it as
incorrect. Note that if a new account is added manually, button to recheck
for friendship relations appears when viewing matches. When rechecking for
relations only confirmed account is used. Third section shows every match
where this person appears. This information is divided by assignments and
this specific person can have multiple matches with different persons in that
assignment. Other information that is shown is trivial, as it was previously
described.

4.4. FUNCTIONALITIES 61
Figure 4.14: Screen capture of viewing specific person

62 CHAPTER 4. IMPLEMENTATION OF PDA
4.4.8 Visualisation
When user wishes to see visualisations or create report, ”See Visualisation”
site must be opened. Example of how this page looks like is shown in Figure
4.15. As can be seen from this example, every project is presented. User can
view project name, number of assignments in that project and option to view
different visualisations and PDF report. If user clicks on button ”Graph” he
will be redirected to Force-Directed Graph visualisation which is described
in Chapter 4.5.1. If user clicks on button ”Co-Occurrence Matrix” he will
be redirected to Co-Occurrence Matrix visualisation which is described in
Chapter 4.5.2. If user clicks on button ”PDF Report” a new window will
open where PDF report is generated. This is described in Chapter 4.6.
If user clicks on project, almost the same site is shown. The difference
is that instead of project list there is assignments list. User can also see
visualisations or create PDF report for each assignment only. In that case
only matches from the selected assignment are used. The other difference is
that instead of column that shows the number of assignments next to the
project name is here a column that shows the number of matches in each
assignment. If user clicks on assignment name he is redirected to the page
where information about assignment is shown.
Figure 4.15: Screen capture of visualisation projects listing
4.4. FUNCTIONALITIES 63
4.4.9 Settings
Example of how settings page looks like is shown in Figure 4.16. On this
site, user can change four parameters:
• User can enter Google search keywords (described in Chapter 4.3.3)
• User can enter how many first matches are shown in visualisations by
default
• User can enter social media start position (described in Chapter 4.3.1)
• User can enter social media end position (described in Chapter 4.3.1)
The first and the last two options are described in previous chapters. The
second one is required because Moss check returns by default maximum of
250 results. This means 250 matches are created in database. When opening
visualisations, this number of matches is too big to be shown appropriately.
That is why only the preset number of matches is shown when user opens
visualisation. Note that number of matches can be changed in visualisation
site, but default is preset in settings. This number can also be zero which
means that all matches are going to be shown in visualisation. Note that if
250 matches are going to be shown in visualisation this can be too complex for
computer to draw and it can be impossible to see anything in visualisation.
4.4.10 Report Settings
Report settings have so far only option to enable or disable showing generated
visualisations in PDF report. Note that if application called ”Wkhtmltopdf”
is not available, this option is disabled by default and cannot be changed.
Visualisations in report thus cannot be shown. The reason why that is so is
described in Chapter 3.6.
64 CHAPTER 4. IMPLEMENTATION OF PDA
Figure 4.16: Screen capture of settings page
4.5 Visualisation
Generating visualisations is one of the most complex functionalities in this
application. This is due to the fact that a lot of different data must be
prepared for visualisation.
4.5.1 Force-Directed Graph
Theory
Example of how Force-Directed Graph visualisation site looks like is shown
in Figure 4.17.
Each node represents a person that has detected similarity in one of the
matches in the project. Above the node is text which shows ID of that
specific person. When user goes over the ID, text font changes to bold. If
user clicks on the person he gets redirected to that specific person’s page,
which is described in Chapter 4.4.7. Each node is connected to some other
node with a link.
If there is a link between two nodes this means that these two persons
have detected similarity in some of the assignments. Text above the node
shows in which assignments this similarity occurs. At the beginning of the
text, names of the assignments are shown and separated by comma. After

4.5. VISUALISATION 65
Figure 4.17: Example of Force-Directed Graph visualisation in application
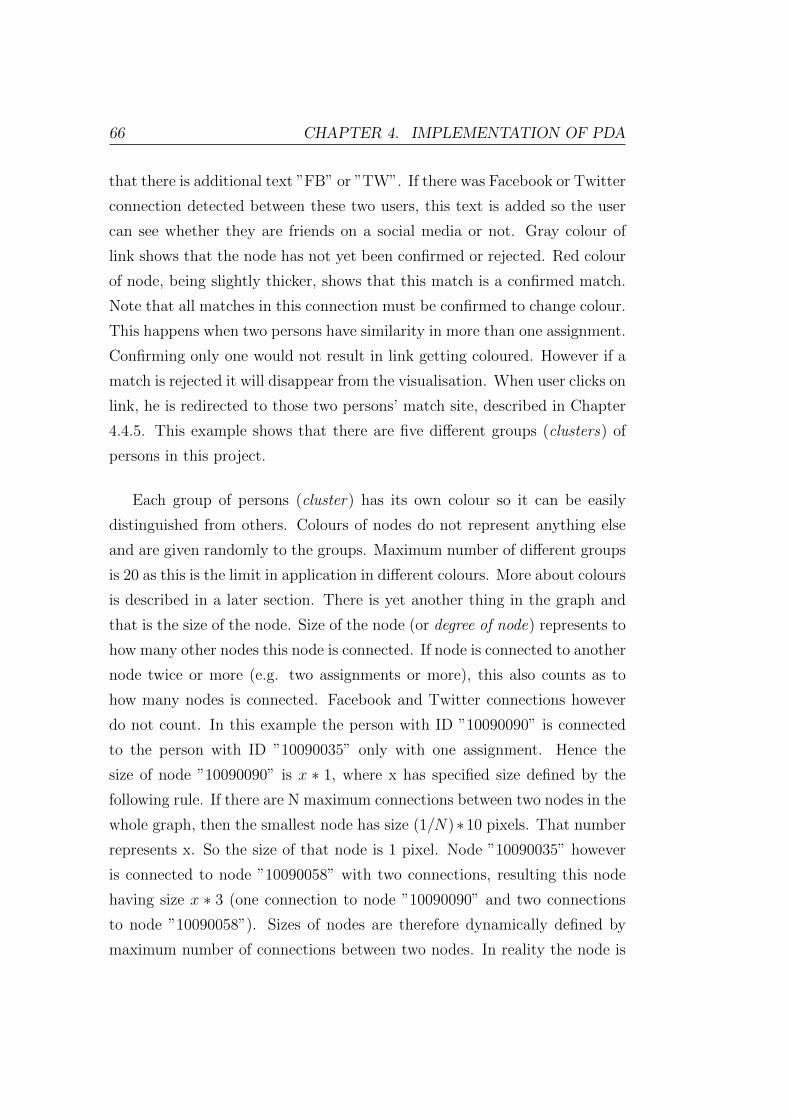
66 CHAPTER 4. IMPLEMENTATION OF PDA
that there is additional text ”FB” or ”TW”. If there was Facebook or Twitter
connection detected between these two users, this text is added so the user
can see whether they are friends on a social media or not. Gray colour of
link shows that the node has not yet been confirmed or rejected. Red colour
of node, being slightly thicker, shows that this match is a confirmed match.
Note that all matches in this connection must be confirmed to change colour.
This happens when two persons have similarity in more than one assignment.
Confirming only one would not result in link getting coloured. However if a
match is rejected it will disappear from the visualisation. When user clicks on
link, he is redirected to those two persons’ match site, described in Chapter
4.4.5. This example shows that there are five different groups (clusters) of
persons in this project.
Each group of persons (cluster) has its own colour so it can be easily
distinguished from others. Colours of nodes do not represent anything else
and are given randomly to the groups. Maximum number of different groups
is 20 as this is the limit in application in different colours. More about colours
is described in a later section. There is yet another thing in the graph and
that is the size of the node. Size of the node (or degree of node) represents to
how many other nodes this node is connected. If node is connected to another
node twice or more (e.g. two assignments or more), this also counts as to
how many nodes is connected. Facebook and Twitter connections however
do not count. In this example the person with ID ”10090090” is connected
to the person with ID ”10090035” only with one assignment. Hence the
size of node ”10090090” is x ∗ 1, where x has specified size defined by the
following rule. If there are N maximum connections between two nodes in the
whole graph, then the smallest node has size (1/N)∗10 pixels. That number
represents x. So the size of that node is 1 pixel. Node ”10090035” however
is connected to node ”10090058” with two connections, resulting this node
having size x ∗ 3 (one connection to node ”10090090” and two connections
to node ”10090058”). Sizes of nodes are therefore dynamically defined by
maximum number of connections between two nodes. In reality the node is
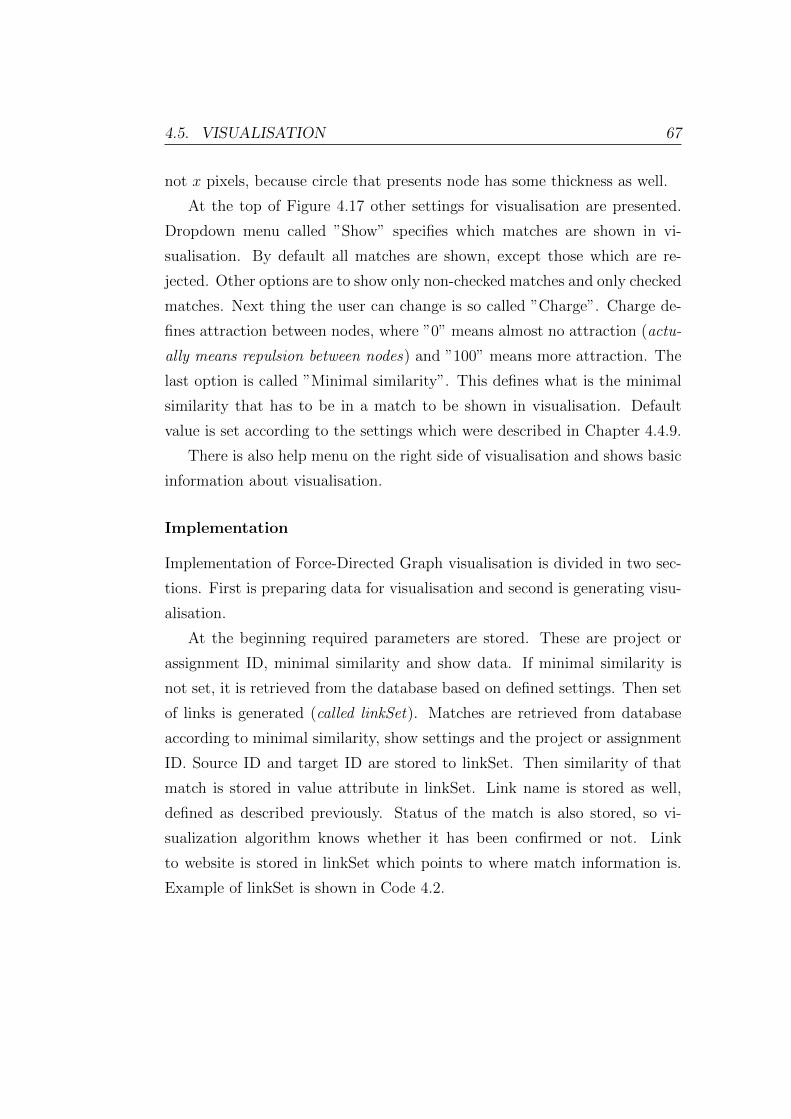
4.5. VISUALISATION 67
not x pixels, because circle that presents node has some thickness as well.
At the top of Figure 4.17 other settings for visualisation are presented.
Dropdown menu called ”Show” specifies which matches are shown in vi-
sualisation. By default all matches are shown, except those which are re-
jected. Other options are to show only non-checked matches and only checked
matches. Next thing the user can change is so called ”Charge”. Charge de-
fines attraction between nodes, where ”0” means almost no attraction (actu-
ally means repulsion between nodes) and ”100” means more attraction. The
last option is called ”Minimal similarity”. This defines what is the minimal
similarity that has to be in a match to be shown in visualisation. Default
value is set according to the settings which were described in Chapter 4.4.9.
There is also help menu on the right side of visualisation and shows basic
information about visualisation.
Implementation
Implementation of Force-Directed Graph visualisation is divided in two sec-
tions. First is preparing data for visualisation and second is generating visu-
alisation.
At the beginning required parameters are stored. These are project or
assignment ID, minimal similarity and show data. If minimal similarity is
not set, it is retrieved from the database based on defined settings. Then set
of links is generated (called linkSet). Matches are retrieved from database
according to minimal similarity, show settings and the project or assignment
ID. Source ID and target ID are stored to linkSet. Then similarity of that
match is stored in value attribute in linkSet. Link name is stored as well,
defined as described previously. Status of the match is also stored, so vi-
sualization algorithm knows whether it has been confirmed or not. Link
to website is stored in linkSet which points to where match information is.
Example of linkSet is shown in Code 4.2.
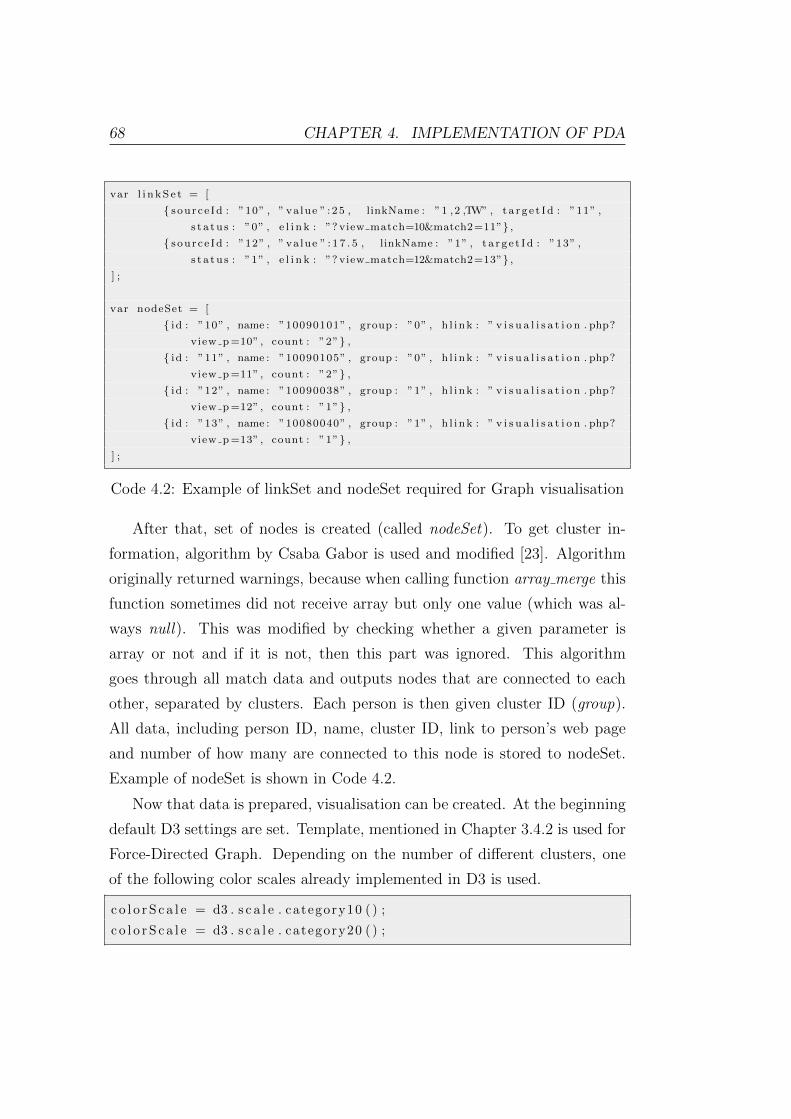
68 CHAPTER 4. IMPLEMENTATION OF PDA
var l i n kS e t = [
{ source Id : ”10” , ” va lue ” : 25 , linkName : ”1 ,2 ,TW” , t a r g e t Id : ”11” ,
s t a tu s : ”0” , e l i n k : ”? view match=10&match2=11”} ,{ source Id : ”12” , ” va lue ” : 1 7 . 5 , linkName : ”1” , t a r g e t I d : ”13” ,
s t a tu s : ”1” , e l i n k : ”? view match=12&match2=13”} ,] ;
var nodeSet = [
{ id : ”10” , name : ”10090101” , group : ”0” , h l i nk : ” v i s u a l i s a t i o n . php?
view p=10” , count : ”2”} ,{ id : ”11” , name : ”10090105” , group : ”0” , h l i nk : ” v i s u a l i s a t i o n . php?
view p=11” , count : ”2”} ,{ id : ”12” , name : ”10090038” , group : ”1” , h l i nk : ” v i s u a l i s a t i o n . php?
view p=12” , count : ”1”} ,{ id : ”13” , name : ”10080040” , group : ”1” , h l i nk : ” v i s u a l i s a t i o n . php?
view p=13” , count : ”1”} ,] ;
Code 4.2: Example of linkSet and nodeSet required for Graph visualisation
After that, set of nodes is created (called nodeSet). To get cluster in-
formation, algorithm by Csaba Gabor is used and modified [23]. Algorithm
originally returned warnings, because when calling function array merge this
function sometimes did not receive array but only one value (which was al-
ways null). This was modified by checking whether a given parameter is
array or not and if it is not, then this part was ignored. This algorithm
goes through all match data and outputs nodes that are connected to each
other, separated by clusters. Each person is then given cluster ID (group).
All data, including person ID, name, cluster ID, link to person’s web page
and number of how many are connected to this node is stored to nodeSet.
Example of nodeSet is shown in Code 4.2.
Now that data is prepared, visualisation can be created. At the beginning
default D3 settings are set. Template, mentioned in Chapter 3.4.2 is used for
Force-Directed Graph. Depending on the number of different clusters, one
of the following color scales already implemented in D3 is used.
c o l o r S c a l e = d3 . s c a l e . category10 ( ) ;
c o l o r S c a l e = d3 . s c a l e . category20 ( ) ;

4.5. VISUALISATION 69
If there are ten or less clusters, the first command is used. If there are more,
the second is used. Normally more than twenty clusters are never used, as
visualisation would become too complex. This is separated because if only
ten colours are used they can be more easily distinguished than those defined
by twenty colours.
After that other settings such as colour of link, thickness of link, size
of node are defined. After that text with link is added to nodes and links.
With all that being specified visualisation is created. Other functions such
as setting the minimal similarity, charge and which matches are shown can
be looked up in the source code.
4.5.2 Co-Occurrence Matrix
Theory
Example of how Co-Occurrence Matrix visualisation site looks like is shown
in Figure 4.18. Each cell represents a specific match. Colour of each cell is
defined by the cluster it belongs to. Cell opacity presents average similarity
between these two persons. The darker the cell, more similarity is between
two persons. The brighter the cell, less similar are the matches. On the left
and upper side of the matrix are IDs of corresponding matches. Similarity
between two persons is always 100%, hence the dark cell. If user does not
wish these cells to be coloured, he can disable that by checking box ”Hide
similarities between same users”. Cell opacity is also normalized, because
opacity would be too low in normal cases. Similarity of 20% would result
in cell opacity being only 20%, that is why opacity is normalized by the
highest similarity. This means that if the match with the highest similarity
has similarity 20%, it would have opacity 100%. Every other match then has
opacity normalized by this 20%, except those in diagonal which always have
100% opacity.
When user goes over the cell with mouse, average similarity is shown.
This average similarity is average in a match and overall average over all
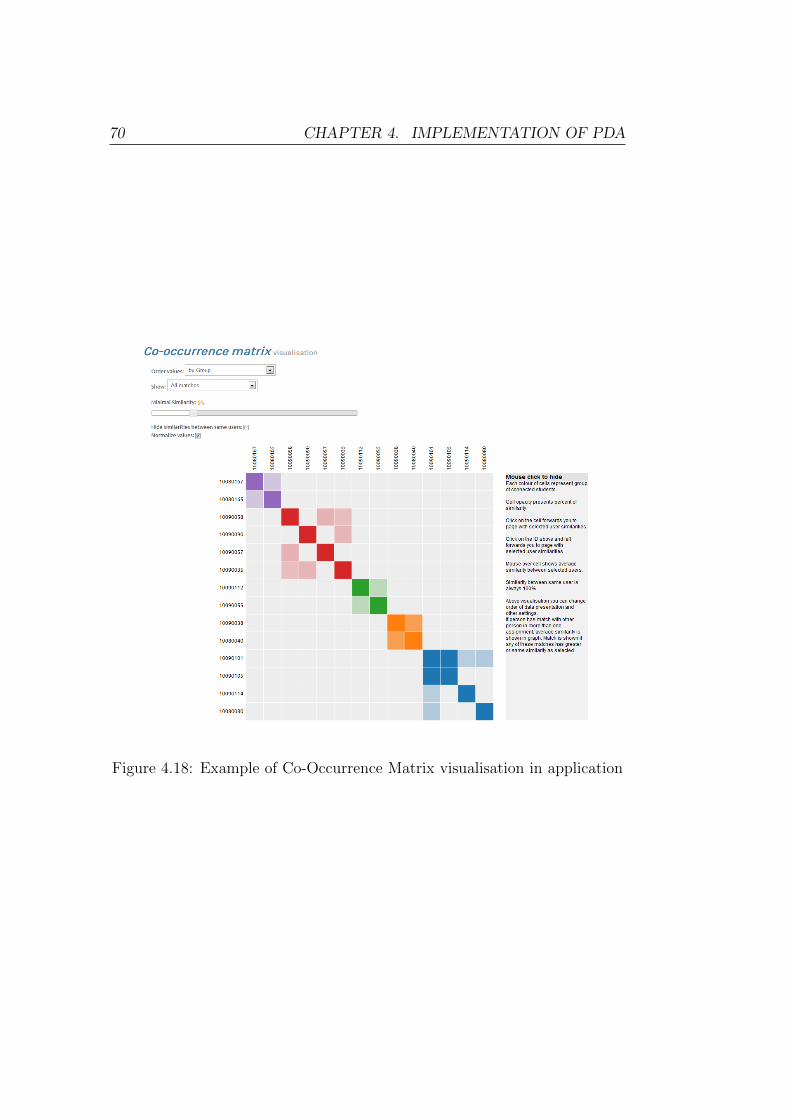
70 CHAPTER 4. IMPLEMENTATION OF PDA
Figure 4.18: Example of Co-Occurrence Matrix visualisation in application
4.5. VISUALISATION 71
assignments. If the user clicks on the cell he is redirected to the match
website which is described in Chapter 4.4.5. Clicking on IDs at the top
and left side redirects the user to the person’s website which is described in
Chapter 4.4.7.
User has some other options available as well. Along hiding similarities
between same users he can also denormalize or normalize values again. Min-
imal similarity is the same as it is in Graph visualisation. Default value
is set according to the settings, which were described in Chapter 4.4.9 and
can be changed manually. User can also select which matches are shown
in visualisation. By default all matches, except those which were rejected
are shown. Other options are to show only non-checked matches or only
confirmed matches. The last option which is implemented is how cells are
ordered in matrix. By default they are ordered by group (by cluster). Other
options are that they are ordered by name (ascending in alphabetical order),
or that they are ordered by similarity (descending by similarity value).
There is also help menu on the right side of visualisation and shows basic
information about visualisation.
Implementation
Implementation of Co-Occurrence Matrix visualisation is also divided in two
sections. First is preparing data for visualisation and second is generating
visualisation.
Preparation of data is very similar to that in Force-Directed Graph visu-
alisation. The only difference is that nodes need to be arranged in ascending
order by ID and must start with zero. This is how implementation of Co-
Occurrence Matrix mentioned in Chapter 3.4.2 requires it. Data in nodeSet
and linkSet are the same as they are in Graph visualisation, except that here
the status of match and number of connected nodes is not required and thus
not generated. Example of linkSet and nodeSet is shown in Code 4.2 (except
that there is no data about match status and number of connected nodes, and
IDs start with zero ascending by ID).

72 CHAPTER 4. IMPLEMENTATION OF PDA
Functions such as setting the minimal similarity, which matches are shown,
and others can be looked up in the source code but the idea is the same as
it is with Graph visualisation.
4.6 Generating Report
The user has two options when generating report. One is to create a report
based on project data and the second is based on assignment data. Report
based on project data includes all assignments that are in a specific project,
whereas reports based on assignment data include only data from that specific
assignment.
By default only confirmed matches are shown in the report. The purpose
of generating report is to print only confirmed data not printing all available
data. Report covers following data:
• All persons’ IDs and corresponding names that are included in con-
firmed matches separated by groups in which they are connected
• Similarities for each match, separated by assignments
• Co-Occurrence Matrix Visualisation
• Graph Visualisation
Note that visualisations are shown in the report only if they are enabled in
the Report Settings page. Report that is generated opens in a new page
and can be saved as PDF or printed. Visualisations are retrieved using
application called ”Wkhtmltopdf”. This application receives URL address of
desired website as input attribute and exports PDF generated from that site.
A special attribute called ”gen pdf” is added to the visualisation section. If
this attribute is added to visualisation site, only visualisation is shown. That
means no settings menu is available, no help, no other options (and no website
template either). With starting Wkhtmltopdf and passing the appropriate

4.6. GENERATING REPORT 73
URL as parameter, PDF is generated which includes that visualisation. This
PDF is then imported into final report.

74 CHAPTER 4. IMPLEMENTATION OF PDA
Chapter 5
Conclusions and Future Work
5.1 Results
As it was shown in previous chapters, this application provides an investiga-
tor with many assisting methods to discover plagiarism. These methods can
provide valuable information as well as simplify plagiarism detection pro-
cess. Creating this prototype application revealed many problems, which
were encountered during development. Some were solved and some were not
and are described in Chapter 5.2. There are also many functionalities that
have not yet been implemented and are mentioned in Chapter 5.3. These
functionalities can help investigator even more, but are not needed for basic
use.
The application which was developed in this diploma thesis is also avail-
able on-line on the site called Github [24]. Source code is licensed under
Creative Commons Attribution Share Alike 2.5 Slovenia license. This is the
same license under which this diploma thesis is licensed. Note that appli-
cation also uses the web template which is licensed under Apache License,
Version 2.0 [19]. Differences that were made in web-template are declared in
files that were changed. Other files only use this template and thus differ-
ences are not declared. However, the license is written in every file and it
states that source code is my work, while the web template is the work of its
75

76 CHAPTER 5. CONCLUSIONS AND FUTURE WORK
creator. Github project is available on site https://github.com/mziga/pda
and can be downloaded to desired location where application is going to be
used. Instructions on how to use the application and how to install it are
provided in this diploma thesis and in readme.txt file included in repository.
5.2 Problems
During the development of this application, many problems occurred. First
problem is that Facebook and Twitter require access tokens to grant access
to their data. Even though required data is public, they still provide that
data only through their APIs. To have access to this API, user needs to be
registered and create an application to retrieve required tokens. This problem
remains unsolved and cannot be bypassed. User has to have an account.
The second problem that occurred is that Facebook, Twitter and Google
API all have limitations on how many queries can be made in specific amount
of time. This problem was resolved by limiting which persons and matches
are checked on these social media sites. User can start automatic check for
first N matches, where N presents number of matches that are going to be
checked. User can also manually check for each account on user page or
manually check for relations on each match. This is how these limitations
are bypassed if user wished to check every account and every match. There
is also one other solution to this problem but would most probably work only
for limited period of time, if it would work at all. The solution would be to
parse data from websites and those limits would not apply here. This kind
of solution was checked with Google but it resulted unsuccessfully. Google
detected that algorithm might not be a real person and asked for Captcha
code, which made this functionality inoperative. What would happen on
Facebook and Twitter was not tested. It was not tested because even if
it worked, it could work only temporary and thus was not implemented.
Facebook and Twitter change their sites from time to time and this would
result in an inoperative algorithm.

5.2. PROBLEMS 77
Next problem which is worth mentioning has occurred when generating
the report. The idea of creating report is to have all investigated data in
one piece, which can be saved locally or printed. Report includes data about
different groups of connected people, their similarities and visualisations.
The problem occurred because visualisations are generated with library that
works on JavaScript. JavaScript is not generated on the server side, but
on client side. This means that visualisations cannot be saved as they are
generated only in client browser. Solution to this problem is that some kind
of browser must be started on server side and snapshot from that browser
is stored. This was done with application called ”Wkhtmltopdf”, which acts
as a browser and stores what is shown. Details about that can be read in
Chapter 3.6. This application then received input URL, where visualisation
is created and then stored it in PDF format. When generating the report
with application called ”FPDF”, these two files were included in the final
report.
One problem was also that Moss stored results of matches only for limited
period of time. That means if original link to results was stored then some
time later this would not be accessible anymore. Solution to this problem
was to download all reports generated by Moss and store them locally. Links
in these files were needed to be changed as well, so that everything worked
locally.
There were some other minor problems as well but are more of imple-
mentation nature and do not need to be particularly explained.

78 CHAPTER 5. CONCLUSIONS AND FUTURE WORK
5.3 Future Work
In the course of developing this application many ideas of how to upgrade
the application and extend its functionalities came up. Some were already
implemented and some not yet.
As it was mentioned in the introduction, this application can be used
for free text plagiarism detection as well. Currently it uses Moss to detect
similarity, but other tools could be implemented. The idea is that when
creating a project, user could select what kind of plagiarism is going to be
checked. Selection would be whether this project is going to have source
code or free text detection. Results would then also be stored along with the
similarity data. Everything else would be the same then.
An extension to current application could also be to add extra-corpal
plagiarism detection. This means that application would check source code
(or free text if implemented) on search engines as well. If match would be
found then this would be added in database as well. URL of detected page
would be stored as node, and then person would be connected with that node
in match. This would then be shown in visualisation as well and investigator
could clearly see if two or more persons copied from the same source on the
internet.
When generating visualisations, many other parameters could be changed
as well. One option would be to manually add persons directly on Graph
visualisation and connecting it to other nodes. In graph visualisation user
could get some tool tip, which would show more information on this match or
person. This is already implemented in Co-Occurrence Matrix visualisation.
There could be many more parameters in report settings as well. Now
only four options of report are available. One is generating report based on
project and second one is based on assignment. Both can have visualisa-
tions in it or not. An extension would be to add source code (or free text
if implemented), so investigator would have evidence of plagiarism in that
report.

5.3. FUTURE WORK 79
Another option would be to add retrieved social media information or
information from Google (friendship relations are currently shown only on
Graph visualisation). Perhaps different options for visualisations would be
available as well. Currently only confirmed matches are shown in report.
Functionalities in this application could also be implemented in applica-
tions which are already used in universities or schools (e.g. Moodle). This
would then be some kind of plug-in or extension and investigator would not
need to save submissions and then re-upload it to this application but do
everything there.
There could also be an upgrade on this application with the use of
jQuery [25], which was not implemented as this application is only proto-
type.
As it is evident, this application can be very widely extended and not
much is done in this area yet. If there is a need to extend this application
with previously mentioned functionalities, then results of this diploma thesis
could be used in next versions. Note that this application is only a prototype
and there is probability that some bugs can occur. Even though application
was tested repeatedly, perfect performance cannot be guaranteed.

80 CHAPTER 5. CONCLUSIONS AND FUTURE WORK

Bibliography
[1] M. Witherspoon, N. Maldonado, and C. H. Lacey, ”Undergraduates
and Academic Dishonesty,” International Journal of Business and Social
Science, vol. 3, no. 1, pp. 1-6, January 2012.
[2] T. Lancaster, ”Effective and Efficient Plagiarism Detection,” PhD the-
sis, South Bank University, London, 2003.
[3] F. Culwin and T. Lancaster, ”Visualising Intra-Corpal Plagiarism,”
Awaiting publication, available from South Bank University, London
2001.
[4] J. Hage, P. Rademaker, and N. van Vugt, ”A comparison of plagiarism
detection tools,” Department of Information and Computing Sciences
Utrecht University, Utrecht, Tech. Rep. UU-CS-2010-015, 2010.
[5] ”Sherlock - Plagiarism Detection Software.” [Online]. Available:
http://www2.warwick.ac.uk/fac/sci/dcs/research/ias/
software/sherlock, [2013].
[6] ”JPlag Detecting Software Plagiarism.” [Online]. Available:
https://jplag.ipd.kit.edu, [2013].
[7] ”Moss, A System for Detecting Software Plagiarism.” [Online]. Avail-
able:
http://theory.stanford.edu/~aiken/moss, [2013].
81

82 BIBLIOGRAPHY
[8] ”Demonstration of JPlag.” [Online]. Available:
http://www.ics.heacademy.ac.uk/resources/assessment/
plagiarism/demo_jplag.html, [2013].
[9] ”Demonstration of Sherlock.” [Online]. Available:
http://www.ics.heacademy.ac.uk/resources/assessment/
plagiarism/demo_sherlock.html, [2013].
[10] T.S. Harding, D.D. Carpenter, C.J. Finelli, and H.J. Passow, ”The Influ-
ence of Academic Dishonesty on Ethical Decision-Making in the Work-
place: A study of engineering students,” Proceedings of the 2004 ASEE
Annual Conference and Exposition, June 2004.
[11] ”PHP.” [Online]. Available:
http://php.net, [2013].
[12] ”MySQL Database.” [Online]. Available:
http://www.mysql.com, [2013].
[13] ”Apache Web Server.” [Online]. Available:
http://www.apache.org, [2013].
[14] M. Dewar. ”Introduction,” in Getting started with D3, California:
O’Reilly Media, 2012, pp.1-6.
[15] ”Force Layout.” [Online]. Available:
https://github.com/mbostock/d3/wiki/Force-Layout, [2013].
[16] ”Force-Directed Graph example.” [Online]. Available:
http://bl.ocks.org/mbostock/4062045, [2013].
[17] ”Co-Occurrence Matrix example.” [Online]. Available:
http://bost.ocks.org/mike/miserables, [2013].
[18] M. Usman, ”Charisma, Responsive Admin Template”. [Online]. Avail-
able:
http://usman.it/themes/charisma, [2013].
BIBLIOGRAPHY 83
[19] ”Apache License, Version 2.0.” [Online]. Available:
http://www.apache.org/licenses/LICENSE-2.0, [2013].
[20] S. Schleimer, D.S. Wilkerson, and A. Aiken, ”Winnowing: Local
Algorithms for Document Fingerprinting.” [Online]. Available:
http://theory.stanford.edu/~aiken/publications/papers/
sigmod03.pdf, [2013].
[21] ”Twitter OAuth.” [Online]. Available:
https://github.com/abraham/twitteroauth/tree/master/
twitteroauth, [2013].
[22] S. Konstantinidis, (2007, June), ”Computing the edit distance of a regu-
lar language,” ScienceDirect. [Online]. 205(9), pp. 1307-1316. Available:
http://dx.doi.org/10.1016/j.bbr.2011.03.031, [2013].
[23] ”Connected Components algorithm.” [Online]. Available:
http://bytes.com/topic/php/answers/
743887-multidimensional-array-search-relationships, [2013].
[24] ”Github.” [Online]. Available:
https://github.com, [2013].
[25] ”jQuery.” [Online]. Available:
http://jquery.com, [2013].

84 BIBLIOGRAPHY
List of Figures
1.1 Four-Stage Plagiarism Detection Process . . . . . . . . . . . . 3
2.1 Example of Moss results . . . . . . . . . . . . . . . . . . . . . 6
2.2 Example of comparison between two submissions in Moss . . . 7
2.3 Example of comparison between two submissions in JPlag . . 8
2.4 Example of Sherlock results . . . . . . . . . . . . . . . . . . . 8
2.5 Comparison between two submissions in Sherlock . . . . . . . 9
2.6 Example of visualizing matches in Sherlock . . . . . . . . . . . 9
3.1 Architecture diagram of the application . . . . . . . . . . . . . 12
3.2 Example of Force-Directed Graph visualisation . . . . . . . . . 16
3.3 Example of Co-Occurrence Matrix visualisation . . . . . . . . 17
4.1 Functionalities diagram of application . . . . . . . . . . . . . . 34
4.2 Physical diagram of used database . . . . . . . . . . . . . . . . 36
4.3 Screen capture of installation step 1 . . . . . . . . . . . . . . . 46
4.4 Screen capture of installation step 2 . . . . . . . . . . . . . . . 46
4.5 Screen capture of installation step 3 . . . . . . . . . . . . . . . 47
4.6 Screen capture of Project Overview section . . . . . . . . . . . 50
4.7 Screen capture of Add new Project section . . . . . . . . . . . 50
4.8 Screen capture of specific project overview . . . . . . . . . . . 51
4.9 Screen capture of specific project overview . . . . . . . . . . . 52
4.10 Screen capture of specific assignment statistical data . . . . . 54
4.11 Screen capture of specific assignment list of matches . . . . . . 55
85

86 LIST OF FIGURES
4.12 Screen capture of specific assignment list of persons . . . . . . 56
4.13 Screen capture of viewing a specific match . . . . . . . . . . . 59
4.14 Screen capture of viewing specific person . . . . . . . . . . . . 61
4.15 Screen capture of visualisation projects listing . . . . . . . . . 62
4.16 Screen capture of settings page . . . . . . . . . . . . . . . . . 64
4.17 Example of Force-Directed Graph visualisation in application . 65
4.18 Example of Co-Occurrence Matrix visualisation in application 70

List of Codes
3.1 Example of D3 library usage as shown in Mike Dewar’s Getting
Started with D3 . . . . . . . . . . . . . . . . . . . . . . . . . . 14
3.2 Example of JSON data file . . . . . . . . . . . . . . . . . . . . 15
3.3 Example of how cURL is used in PHP . . . . . . . . . . . . . 22
3.4 Example of how connection to Facebook is made . . . . . . . . 23
3.5 Example of Facebook user search JSON output . . . . . . . . 24
3.6 Example of how to retrieve a result that shows whether two
users are friends . . . . . . . . . . . . . . . . . . . . . . . . . . 24
3.7 Example of Facebook friend relationship JSON output . . . . 25
3.8 Example of how connection to Twitter is made . . . . . . . . . 28
3.9 Example of Twitter search JSON output . . . . . . . . . . . . 28
3.10 Example of Twitter friendship JSON output . . . . . . . . . . 29
3.11 Example of how connection to Google is made . . . . . . . . . 31
3.12 Example of Google search JSON output . . . . . . . . . . . . 32
4.1 Example of Application Config File . . . . . . . . . . . . . . . 48
4.2 Example of linkSet and nodeSet required for Graph visualisation 68
87