methods of measuring the distribution of socio-economic conditions
TRANSCRIPT
So&-Econ. Plan. Sci. Vol. 6, pp. 187495 (1972). Pergamon Prca. Printed in Great Britain
METHODS OF MEASURING THE DISTRIBUTION OF
SOCKS-ECONOMIC CONDITIONS*
WILLIAM H. CULLEY
Department of Sociology and Anthropology, Wake Forest University. Winston-Saiem, North Carolina 27109
and
CHARLES H. NEWTON
Department of Sociology and Anthropology, Memphis State University, Memphis, Tennessee 38111
(Rereiverl29 Jurle 1971; revised 14 Qcfober 1971)
A metropolitan community was faced with the problem of locating areas of the community in terms of more or less need for leisure-time services. The authors developed a set of methods and techniques to solve this problem. It was noted that these methods differed in some ways from prior efforts of this sort. The advantages of the methods were that they could use readily available data, did not require the use of a computer, and presented a relative level of need that was more than a simple ranking of planning areas. Further, the methods could be used to locate any number of conditions in which one might be interested.
In addition to spelling out the details of the original effort, an attempt is made to show how factor anafysis could be used as an alternate approach to the first effort. The pros and cons of factor analysis as a subst~tuie method are discussed. The major di~dva~ta~ would be if the particular ~~m.~unity did not have a large computer available. This is outweighed by the higher levels of accuracy, predictabii~ty and comparability provided by factor analysis.
THE PROCEDURES described in this paper evolved from a study in Richmond, Virginia in 1962. The goal of the original study was to provide the Richmond Area Community Council with an objective evaluation for planning a balanced program of leisure-time services within the larger metropolitan area served by the Council. This paper does not cancern itself with the conceptual and operational problems of leisure as discussed in Shelton and Moore [Z]. Specifically, this effort is an attempt to spell out the methods and techniques which we developed in coping with the challenge of the original study. An attempt is made also to suggest some refinements in our original effort. It is felt that these same methods and techniques could be used in the study of widely varying socio-economic conditions.
Because of the lim~tatiolls of time and money in the original research, the authors were inclined to utilize materials which were already available. Data from census pubiications, community agency files and city planning sources were used. The selected data were largely ordinal level measures and the hope was to treat them in such a manner as to make them more powerful and useful than would have otherwise been possible. There have been a number of attempts to attain this goal. Some of the better known efforts are Ho~iingshea~s indexes, the Shevsky-Bell index, Warner’s index of status characteristics, the Lynds’ work in
+ The study referred to for the Council was funded by the United Givers Fund of Richmond, Henrico, Chesterfield, Inc., which in turn published a monograph [I]. This publication should be consulted for a more comprehensive picture of the way the techniques were originally employed.
187
f88 WILLIAM H. GU~LEY and CHAFUS H. NEWTON
Middletown and the Duncans’ work on residential distribution (Blaiock and Blalock [3]; Doby et al. 141; Shevsky and Bell [S]; Warner [6]; Lynd and Lynd [7]; Duncan and Duncan [8]). Upon completion and review of the research, it was felt that the methods were suf%cientIy different and etfective to warrant this explanatory summary, especially in light of the great number of community studies now being undertaken.
The first question revolved around whether reasonably homogeneous districts could be identified. The larger metropolitan area was already defined by the Council and this definition was shared by the city planners. The area was divided into twenty-five districts designated as social planning districts. As is frequently the case in larger communii~es of &his sort, the planning districts followed the census tracts, or vice versa. This is due to the classic ecological growth patterns. As cities grow, this pattern persists, so that sometimes one planning area might contain, or consist of, several census tracts. After examining the areas or districts in terms of physica boundaries, racial composition, economic levels and educational levels, it was decided that we could quite legitimately use the social planning districts for our purposes, which meant that we could make direct use of Census data. In several cases, particularly the county areas, homogeneity may have been sacrificed to some degree in order to retain census tract lines, This is the area served by the Council and is referred to hereafter as the “‘metropolitan area”.
In retrospect, and as has been suggested by others, the study could have been made more solid by the use of factor analysis to determine the districts and to establish levels of homogeneity. This could have been accomplished by working with census tract data only and ignoring the social planning districts as they had been estabhshed and used. In this particular situation this would have nat been practical for the Council, plus it would have involved additional investment of time. However, it is apparent that communities, and especially city planners and those who set tract lines, might well try to move in this direction in laying out their pianning districts. This would not only take them away from the re- strictive “growing Iike Topsy” ecoiogicai approach, but would make al1 future planning much easier. As for the particulars of factor analysis use in this situation, this will be discussed later in the section deaiing with the variables and the way we used them.
Following is a description of our methodoiogy in some detail. It is presented for two reasons. First, but less important, it is an useful and fast way to get at the distribution of socio-ecomonic conditions with a minimum of investment of time and money, and without computer use. It obviously is a compromise system. More important, by this presentation of what was done, one can more easily see the utility and benefit of employing factor analysis.
To establish the relative need for Ieisure-time services among the different districts, four sets of variables were identified and used. The four sets of variables are as follows:
(i) Popdation variables (a) population density: range of persons per net acre of reside&at land. (Excluding
area taken up by streets, rivers and other non-residential uses.) (b) Youth population: per cent of population between ages of 5 and 10 yr inclusive. (c) Aged population: per cent of population 65 yr of age and over.
(ii) Housing variabies (a) Substandard housing: per cent of housing units classified as being deteriorated or
dilapidated. (b) Housing density: per cent of occupied housing units containing 1.01 or more
persons per room.
Methods of Measuring the Distribution of Socio-Economic Conditions 189
(iii) So&-ecornonic variables (a) Income : median per capita income of famifies. (b) Education: median school years completed by persons 25 yr of age and older. (c) Occupation: median occupational rank of employed persons.
(iv) Socialprvblem z+ariables (a) ChiId dependency: number of children on the aid to dependent chiidren program
per IONI popuiation under age 18. (b) Delinquency: number of juvenile apprehensions per 1000 popuIation, ages 5-17.
Some of the measures described above were selected because they were readily available and closely approxilnat~d the so&-economic characteristics considered significant in measuring relative needs.
While it would have been possible to use other variables, the above were considered sufficient and avoided the problem of increasing duplication and overlapping in%.rence. For example, the proportion of Negro population was considered to be an important variable by some Council members, but an examination of this variable in relation to those included revealed that its effect was already represented. Statistical runs were completed which indicated that omission of this add~t~o~a~ variable did not add to the sensitivity of the analysis. Those areas which had a high proportion of Negro population revealed a large proportion of youth population, low income and educational level and a high proportion of officially documented social problems-ail of which were regarded as increasing the need for community supported leisure-time services.
One of the major problems encountered in dealing with the concept of relative need between districts was the weight to be given each variable. In order to compile a composite relative need index, each variable must receive no greater weight than its share of influence, The Comnl~tt~ felt two criteria were of utmost significance in this regard: the amount of influence a variable would have by itself; and the extent of which it correlated with other included variables, thus introducing a built in bias or overlapping influence.
A basic principle underlying the weighting system followed by the authors was that weights must be assigned to minimize overlapping infiuences. Tn evaluating other studies on the measurement of need for leisure-time services, it was felt that such studies failed to account for overlap or accounted for it only in summary remarks.
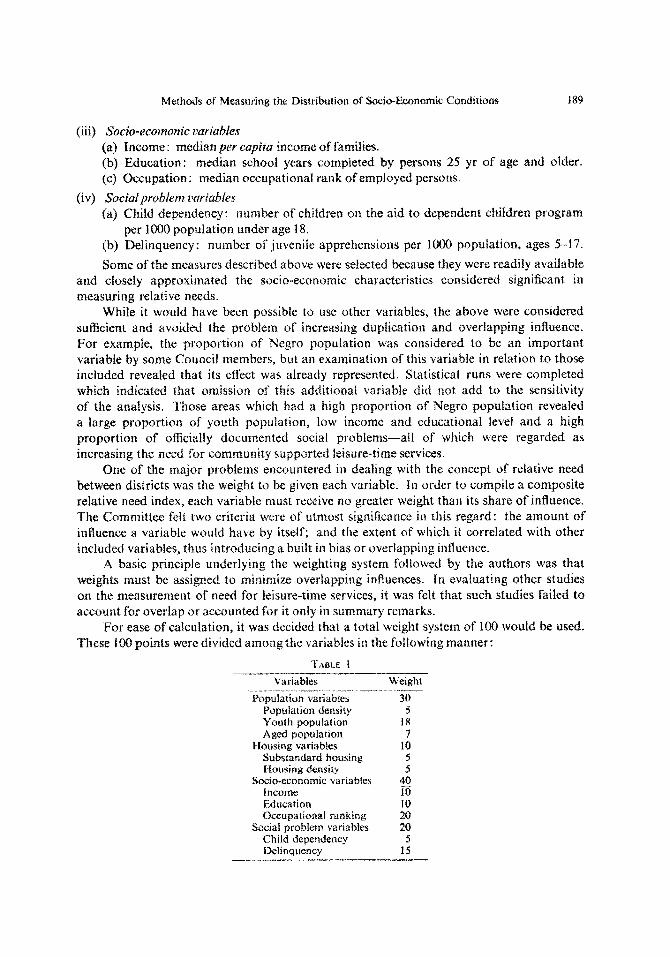
For ease of calculation, it was decided that a total weight system of 100 would be used. These to0 points were divided among the variables in the following manner:
TABLE 1
Variables Weight
Population variabks Population density Youth population Aged population
Housing variables Su~tandard housing Housing density
So&o-economic variables income Education Occupationat ranking
So&ii problem variables Child dependency Delinquency
30 5
18 7
ra 5 5
40 10 10 20 20
5 1.5
190 WIILWM H. GULLEY and CHARLES H. NEWTON
It might be pointed out that the weighting system (and ah3 the vari&es used) would be peculiar to the particular problem being studied, Each system would be to a large extent, and necessarily so, arbitrary except for the aforementioned guide in regard to overlapping influences, The rationale for the weighting system is explained as follows, Within the set of population variables, the authors felt that the youth pop~~at~o~ has the greater need for leisure-time services. Accordingly, this factor was assigned a weight of 18 out of a total of 30 for the population group. Since youth population and population density are generally positively correlated, density was given a weight of 5. The weight of 7 was assigned to the aged population because the needs of the aged were considered to be greater than those for other adults, hut Iess than those of the youth population, which is the larger population. Furthermore, there is not necessarily a close relationship betweeu proportion of aged in the population and population density.
Within the housing group, which was given a total weight of 10, the authors fett that there was little difference between the two variables in terms of influence as welt as overlap. These were given equal weights.
The socio-economic variables were given the greatest influence with a total weight of 40. Studies in the areas of social class indicate that the three most important criteria for class position in American society are occupation, income and education. Of these three variables, occupation has consistently been found to be of greatest predictive value (Kahl [9& It, therefore, was assigned a weight of 20. Education and income, each of which correlates highly with occupation, were assigned equal weights af tO each.
The social problem group with a total weight of 20 was divided between two variables- child dependency with a weight of 5 and juvenife deliquency with a weight of 15. The reason for this weight assignment is that chitd dependency correlates highly with socio- economic factors, while juvenile de~iquen~y (official and hidden dehquencies being con- ceptually combined) operates more independent of so&o-economic level (Nye and Short),
The next step in establishing the index was the ranking of districts for each of the ten characteristics. This was necessary because the variations in the measurement of char- acteristics tended to alter the inRuenee of the weighting system. in the actual assignment of rank for each district, the highest rank (the lowest number) was given to that condition which indicated the greatest recreational need. For example, a rank of 1 was given to that area which had the highest proportion of youth population and a rank of 25 to the fowest. A rank of 1, again indicating high need, was assigned to the lowest education.al level. This procedure was folIowed throughout.
Having decided on the assigned weights, and ranks it was necessary to adopt some means for comparing one district to another. After trying several systems it was decided to transform each district’s rank to a standardized score. The variations between the highest and lowest district were numerically 25 : 1, using the raw ranks. This was believed too wide a variation to present a realistic pitcure for measuring realtive needs.
Since the data were ranked, available techniques were Limited. One such technique, however, was found. This method, while requiring the assumption of a normally distributed population, allows one to normallize ranked data directly from ranked sources-e.g. the normalized T-score. This procedure is described by Edwards [11]. While the assumption of normatcy is believed to be required for the use of the procedure, it was not felt that the distributions varied significantly from normalcy to negate the utility of the technique.
The procedure used in obtaining a total weighted recreational need score for each of the planning segments was accomplished in the following manner. First, the proportion in
Methods of Measuring the Distribution of Socio-Economic Conditions 191
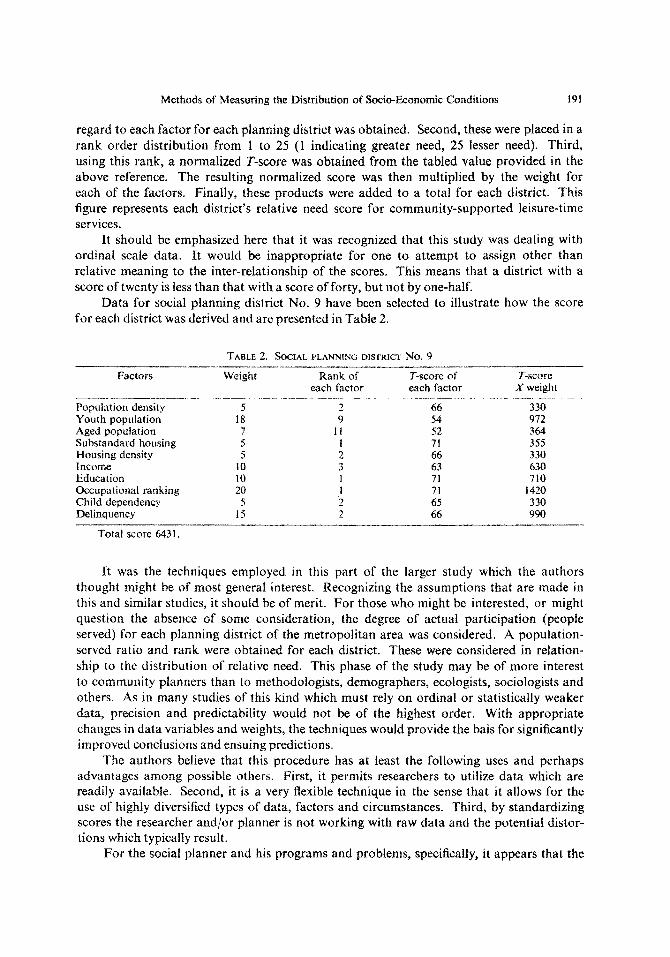
regard to each factor for each planning district was obtained. Second, these were placed in a rank order distribution from 1 to 25 (1 indicating greater need, 25 lesser need). Third, using this rank, a normalized T-score was obtained from the tabled value provided in the above reference. The resulting normalized score was then multiplied by the weight for each of the factors. Finally, these products were added to a total for each district. This figure represents each district’s relative need score for community-supported leisure-time services.
It should be emphasized here that it was recognized that this study was dealing with ordinal scale data. It would be inappropriate for one to attempt to assign other than relative meaning to the inter-relationship of the scores. This means that a district with a score of twenty is less than that with a score of forty, but not by one-half.
Data for social planning district No. 9 have been selected to illustrate how the score for each district was derived and are presented in Table 2.
Factors
~~~~~-_~~~~~~~_. _ Population density Youth population Aged population Substandard housing Housing density Income Education Occupational ranking Child dependency Delinquency
Total score 6431,
TABLE 2. SOCIAL PLANNINC~ DISTRICT No. 9
Weight Rank of T-score of T-score each factor each factor X weight
_.__~_ _._.._.~_._.. ____.. _~ .._ 5 2 66 330
18 9 54 972 7 11 52 364 5 1 71 35.5 5 2 66 330
IO 3 63 630 10 1 71 710 20 1 71 1420
5 2 65 330 15 2 66 990
It was the techniques employed in this part of the larger study which the authors thought might be of most general interest. Recognizing the assumptions that are made in this and similar studies, it should be of merit. For those who might be interested, or might question the absence of some consideration, the degree of actual participation (people served) for each planning district of the metropolitan area was considered. A population- served ratio and rank were obtained for each district. These were considered in relation- ship to the distribution of relative need. This phase of the study may be of more interest to community planners than to methodologists, demographers, ecologists, sociologists and others. As in many studies of this kind which must rely on ordinal or statistically weaker data, precision and predictability would not be of the highest order. With appropriate changes in data variables and weights, the techniques would provide the bais for significantly improved conclusions and ensuing predictions.
The authors believe that this procedure has at least the following uses and perhaps advantages among possible others. First, it permits researchers to utilize data which are readily available. Second, it is a very flexible technique in the sense that it allows for the use of highly diversified types of data, factors and circumstances. Third, by standardizing scores the researcher and/or planner is not working with raw data and the potential distor- tions which typically result.
For the social pianner and his programs and problems, specifically, it appears that the

t92 WILLMM H. GULLEY and CE+ARLES K-f. NEWTON
technique would have at least the following advantages. First, it could be used to determine the distribution of types of educational programs. Second, needed programs for the mentally and otherwise handicapped segments of the ~rnm~~ity might be facilitated. Third, the use of this technique {as well as some others) can result in a more equitable and meaningful distribution of available resources (e.g. community chest and other monies). Fourth, the techniques decribed does not require the use of complex computer technology when such facilities are not available with given resources. Fifth, the technique might be used For d~terrnjna~ion and distribution of free and/or subsidized medical are (including physician charges, hospital care, phsyciatric treatment by private physicians, etc.). Sixth, it allows measures of longitudinal change when using comparable procedures. Seventh, comparisons between similar communities might also be possible if such comparisons are based on like dimensions. Eighth, this procedure should provide a basis for evaluating programs within a community as well as di~er~nt types of programs between similar communities. Now for a Iook at factor analysis.
Needless to say, this effort will be able to spell out all the technicat details for the factor analysis. Included in the bibliography are three most helpful references for this method (Fruchter [IL?]; Worst [13]; Rummel [14]), What will he attempted is to indicate the more important points of decision and general operations with which one would have to be concerned. if one is already familiar with factor analysis, he would know of its merits; it not, if is hoped that this description of this alternate method will be useful, Factor analysis was considered as an alternate in the original study, but the cost, lack of access to a computer and the time element dictated the method we employed. We would have had to consider more variables for each district. Though more will be said of this point later, with only ten variables, one may have ended up with o&y one factor or maybe with all ten variables being precipitated as factors. Further, understanding and accepting factor analysis for the policy makers would have been more dit%cuit. Despite this particular case, herewith is a description of how we could have proceeded, along with judgements about the merits of this approach.
Among the first de&ions in the recreation study was the selection of variables. There was a degree of arbitrariness in this selection, though the literature was consulted for general substantiation, This problem would not have existed if factor analysis had been used. About twenty-five or thirty variables for each district would have been selected. With this number of variables, you would have some which woufd be reIated to levels of recreational need within each district. You would not have to say initially which ones nor would you have to weight them. This will be explained later.
After data are cohected for your variabies, a data matrix is made. This would consist of a “table” with your districts (entities) as rows and your variables as columns. In some cases it is possible to work from your raw data, but where disparate measures are involved, it is necessary to scale or ‘“standardize” your raw data, In factor analysis, the more frequent- ly employed means for doing this is to convert the data to product moment correlations. In the case of the recreation study, this would result in a correlation matrix similar to the one illustrated. Though the actual coefficients of correlation in this matrix were created for illustrative purposes rather than being worked out from the actual recreation study data, they will serve the purpose of this article.
This correlation matrix would serve as the starting point and “data” for the factor analysis. Most cummonly, the centroid method of factoring is used. This is the point in the method whereby one reduces the number of variables to a smaller number of factors.
Methods of Measuring the Distribution of Socio-Economic Conditions 193
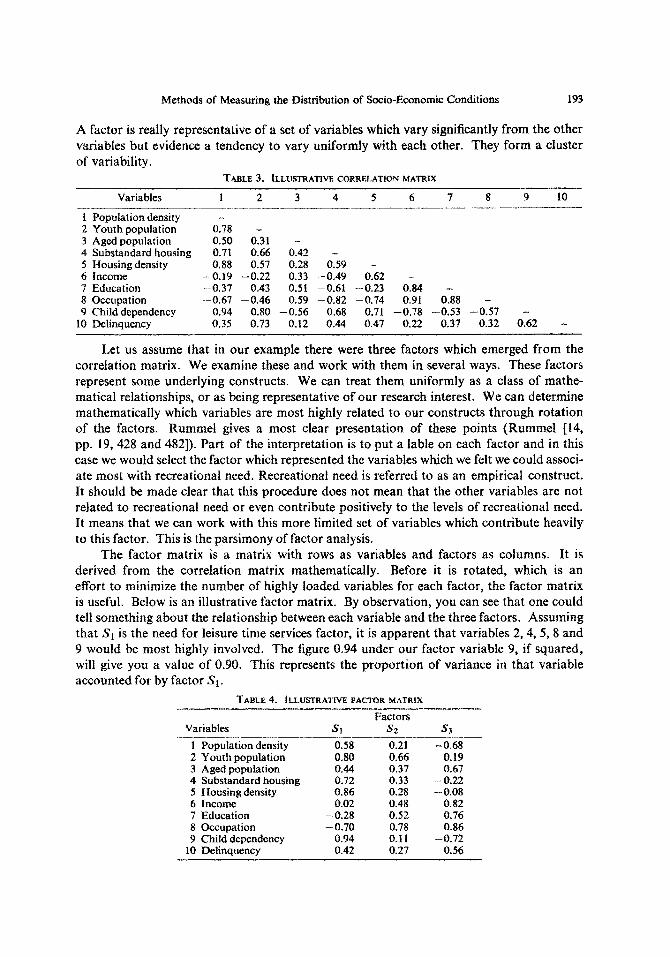
A factor is really representative of a set of variables which vary significantly from the other variables but evidence a tendency to vary uniformfy with each other. They form a cluster of variability.
Variables
TABLE 3. IL~XJSTRATWE CORRELATION MATRXX
I 2 3 4 5 6 7 8 9 10
1 Population density 2 Youth population 3 Aged population 4 Substandard housing 5 Housing density 6 Income 7 Education 8 Occupation 9 Child dependency
10 ~IiRque~cy
0.78 - OS0 0.31 - 0.71 0.66 0.42 0.88 0.57 0.28 OS9 -
-0.19 -0.22 0.33 -0.49 0.62 -m0.37 0.43 0.51 -0.61 -0.23 Ok - --0.67 -0.46 0.59 -0.82 -0.74 0.91 0.88 -
0.94 0.80 -0.56 0.68 0.71 -0.78 -0.53 -0.57 - 0.35 0.73 0.12 0.44 0.47 0.22 0.37 0.32 0.62 -
Let us assume that in our example there were three factors which emerged from the correlation matrix. We examine these and work with them in several ways. These factors represent some underlying constructs. We can treat them uniformly as a class of mathe- matical relationships, or as being representative of our research interest. We can determine mathematically which variables are most highly related to our constructs through rotation of the factors. Rummel gives a most clear presentation of these points (Rummel [i4,
pp. 19,428 and 4821). Part of the interpretation is to put a labie on each factor and in this case we would select the factor which represented the variables which we felt we could associ- ate most with recreational need. Recreational need is referred to as an empirical construct. It should be made clear that this procedure does not mean that the other variables are not related to recreational need or even contribute positively to the levels of recreational need. It means that we can work with this more limited set of variables which contribute heavily to this factor. This is the parsimony of factor analysis.
The factor matrix is a matrix with rows as variables and factors as columns. It is derived from the correlation matrix mathematically. Before it is rotated, which is an effort to minimize the number of highly loaded variables for each factor, the factor matrix is useful. Below is an illustrative factor matrix. By observation, you can see that one could tel1 something about the relationship between each variable and the three factors. Assuming that S1 is the need for leisure time services factor, it is apparent that variables 2,4,5,8 and 9 would be most highly involved. The figure 0.94 under our factor variable 9, if squared, will give you a value of 0.90. This represents the proportion of variance in that variable accounted for by factor SI .
TABLE 4. ILLUSTRATIVE FAVOR MATRIX
Factors Variables Sl 52 $3 ..~-.-.-- ---.-_____--
1 Population density --OS8 0.21 -0.68 2 Youth population 0.80 0.66 0.19 3 Aged population 0.44 0.37 0.67 4 Substandard housing 0.72 0.33 -0.22 5 Housing density 0.86 0.28 - 0.08 6 Income 0.02 0.48 0.82 7 Education -0.28 0.52 0.76 8 Occupation -0.70 0.78 0.86 9 Child dependency 0.94 0.11 --0.72
10 Delinquency 0.42 0.27 0.56
194 WILLIAM H. CULLEY and CHARLES H. NEWTON
Earlier in the paper it was indicated that more would be said about weighting and loading. In the original study, the variables were weighted by decisions based on certain studies. The factor matrix makes it possible for us to derive factor loadings. Borrowing Rummel’s definition, “a loading is a weight for each factor dimension measuring the variance contribution the factor makes to the data vector” (Rummel [14, p. 1081). The loadings are arrived by at correlating variables and factors. “The square of the Ioading times 100 equals the percent variation that a variable has in common with an unrotated common factor” (Rummel (14, p. 1371). This relieves the researcher from an arbitrary decision.
At this point, there will be a shift in focus. So far attention had been directly primarily toward the variables. This is an important concern, but we are also interested in the social planning districts which are our entities. In most of the earlier factor analysis, the entities were greatly ignored. Researchers were primarily interested in locating the factors involved, estimating their importance and attempting to reduce the number of variables to work with. More recently, researchers are becoming specifically interested in the entities; blocs of voting power, sections of cities, whole communities, etc. Frequently the interest may revolve around prediction, but description and comparison are primarily the interests in the leisure time study. How much more is this factor operating in planning section number 5 than in planning Section 6, etc ? In the original study in Richmond, ranking the districts from I to 25 as described on p. 190 of this paper was attempted. The actual ranking in terms of the variables was easy, but of course it did not indicate the distance between the districts. We compensated for this with the method of standardizing the ranking scores. This was an improvement.
In factor analysis, there is something basic that one must understand, and this is the concept of vector and factor space. Needless to say, this cannot be fully treated in this paper. Simply, the idea is that entities can be represented g~phically, and mathematically, as vectors in terms of the measures of their variables. * The vector would have a certain direction and a certain magnitude (represented by length). There would be a degree of difference for each planning district for the variables both in direction and in space and magnitude. These distances could be calculated between our 25 planning districts. When this is done, they could be ranked, but more important, the magnitude of the distance will be a quantity, within the range of the variability. For both an explanation of this technique, and a graphic presentation of it, again one can turn to Rummel ([ 141, chapter 22).
SUMMARY AND CONCLUSIONS
Initially, a technique has been described and discussed which the authors think allows persons interested in certain social problems and social action programs to readily find some of the solutions they need. At the same time, it was felt that this method could be improved by the use of factor analysis. This would be particularly true for sociological research as opposed to problem and planning programs. The merits and demerits of the methods have been indicated as the paper developed. It might be well to add that factor analysis is becoming increasingly attractive as more large computers become available to more communities. Local console computer units, tied into computer centers, rent for modest sums. Further, most of the larger computer centers are already programmed to handle factor analysis. Except for the gathering of the data and some preparation of it,
+ Appreciation is extended to Dr. Philip Perricone who gave me access to his doctoral dissertation [is] and advised me in this area.

Methods of Measuring the Distribution of So&-Economic Conditions I95
the mathematical processing only takes a matter of minutes for the bulk of the studies. It may be fair to say that one could save both time and money by going to the latter method described in this paper.
Further testing of the technique should demonstrate whether our beliefs are well founded. Herein lies a part of the heuristic value of this exercise.
Acicnowledgeme/~fs-A revision of a paper presented at the Southern Sociological Meeting in Atlanta, April 1970. The authors are indebted to Professors Allen, Blair, Grigg, Schoenfeld and many others for their comments and suggestions. The comments of the editorial staff of the journal for Socio-Economic Plaiming Sciences were especially helpful.
1.
2.
3.
4. 5.
6. 7.
8.
9.
10.
Il.
12. 13.
f4.
15.
REFERENCES
Richmond Area Community Council, Recreation in Metropolitan Richmond: An Analysis of Area Differences (1963). E. B. &ELTON and W. E. MOORE, indicarors of Social Charzge. RusselI Sage Foundation, New York (1968). HERBERT BLALOCK and ANN BLALOCK (editors) Methodology in Social Research. McGraw- Hill (1968). JOHN T. DOBY et al., An introduction to Social Research. Meredith (1967). ESHREF SHEVSKY and WENDELL BELL, Sociul Area Analysis. Stanford University Press, Stanford (1955). W. LLOYD WARNER, (editor), 1949 DenrocrucJ* in Jonesville. Harper, New York (1949). ROVERT S. LYND and HELEN M. LYND. Middletown in Transition. Harcourt and Brace, New York(1937). OTIS DUDLEY DUNCAN and BEVERLY DUNCAN, Residential distribution and occupational stratification, Anr. J. Sociology 60,493-503 (1955). JOSEPB A. KAHI., The American Ciuss Strrrcfure, p. 43. Halt, Rinehart and Winston, New York (1961). F. IVAN NYE and JAMES F. %ORT, JR., Socio-economic status and delinquent behavior, Aln.J. SuciologyS4, 381-389 (1958). ALLEN L. EDWARDS, Statistical Methods for the Behavior& Sciences. pp. 113-l 14. Rinehart, New York (1956). BE?UA~MIN FKUCIITER, inirodaction of Factor Analysis. \ian Nostrand, New Jersey (1968). PAUL HORST, Factor Analvsis of Data hktrices. Holt, Rinehart and Winston, New York (1965). R. J. RUMMEL, Applied Fuctor Analysis. Northwestern University Press, Evanston (1970). PHILIP J. PERRICONE, Attitudinal Correlates of intergenerational Mobility, University of Kentucky, Lexington, unpublished dissertation (1971).