methods of measuring rainfall
TRANSCRIPT

Cairo UniversityFaculty of Engineering
4th Year Mechanical Power Engineering DepartmentHydraulic Power Station
Submitted to:Dr\ Mahmoud khalifa
Prepared byWael Kamal Mohamed Mahmoud
SEC:6 B.N:25

CONTENTS
PART1 Rainfall Measurement.......................................................................... 3Introduction ...................................................................................................... 3Methods of Measuring Rainfall......................................................................... 3Methods of Measuring Rainfall (Manual) ........................................................ 3Methods of Measuring Rainfall (Remote) ........................................................ 3Rain gauges ...................................................................................................... 4Principles.......................................................................................................... 4Types of rain gauges ....................................................................................... 5
1-Ordinary (Standard rain gauge) rain gauge............................................... 52-The weighing rain gauge.......................................................................... 53-Optical rain gauge.................................................................................... 64-Tipping bucket rain gauge........................................................................ 7
Number and Distribution of Gauges.................................................................. 7Distribution of Gauges...................................................................................... 7Number of Gauges............................................................................................ 8Site Specific Rainfall Information..................................................................... 8The weather station........................................................................................... 9Ground-based radar equipment ....................................................................... 10
PART 2 Methods OF Measuring Runoff........................................................ 11Runoff ............................................................................................................ 11Measurement and mathematical modeling ...................................................... 12Runoff curve number...................................................................................... 13Infiltration and surface runoff simulating extreme precipitation ...................... 14Surface runoff with natural precipitation......................................................... 15Runoff (flowthrough) in catchment areas used for farming ............................. 15References ......................................................................................................... 16
Rainfall Measurement
IntroductionAt climatological and synoptic stations worldwide, it is standard procedure to measure
rainfall at each scheduled hour, then calculate the total rainfall during the previous
six-hour and twelve-hour period.
Regular rainfall measurement is also an essential requirement in many aspects of
agriculture, forestry, industry, education and other activities. Rainfall is rarely
uniform in intensity or duration across a wide area, so continuous data on local
conditions is of particular importance to farmers and those concerned with irrigation,
scientists researching into crop performance and soil erosion, and to water and river
authorities in respect of reservoir supplies and ground water feeding into rivers.
Accurate measurement is also essential for calculating evaporation.
The rain gauge is the standard method of collection. This has to be sited in a location,
which is representative of the rainfall area to be measured. Often a
network of sites will be integrated to cover average rainfall over a large area.Rainfall
at any one place against time is expressed in terms of the depth to which it would
cover the surface locally, assuming there was no loss by evaporation or run-off. The
rain gauge is often used in conjunction with other instruments for a full picture of
local climatic conditions.
Methods of Measuring RainfallA. Manual
B. Remote
Methods of Measuring Rainfall (Manual)Often have a funnel opening into a cylinder gaugeCome in a variety of shapes
and sizes
Calculate the rainfall (in mm) by dividing the volume of water collected by the
area of the opening of the cup.
Methods of Measuring Rainfall (Remote)Tipping bucket rain gauge -The bucket tips when precipitation of 0.2 mm, 0.5
mm, 1.0 mm has been collected. Each tip is recorded by a data logger.

Weather Station - Records rainfall, but also evaporation, air pressure, air
temperature, wind speed and wind direction (so can be used to estimate evapo-
transpiration)
Radar - Ground-based radar equipment can be used to determine how much
rain is falling and where it is the heaviest.
Rain gauges
A rain gauge (also known as a udometer or a pluviometer [Pluviograph ] or a cup) is a
type of instrument used by meteorologists and hydrologists to gather and measure the
amount of liquid precipitation (as opposed to solid precipitation that is measured by a
snow gauge) over a set period of time.
Principles
Most rain gauges generally measure the precipitation in millimeters. The level of
rainfall is sometimes reported as inches or centimeters.
Rain gauge amounts are read either manually or by AWS (Automatic Weather
Station). The frequency of readings will depend on the requirements of the collection
agency. Some countries will supplement the paid weather observer with a network of
volunteers to obtain precipitation data (and other types of weather) for sparsely
populated areas.
In most cases the precipitation is not retained, however some stations do submit
rainfall (and snowfall) for testing, which is done to obtain levels of pollutants.
Rain gauges have their limitations. Attempting to collect rain data in a hurricane can
be nearly impossible and unreliable (even if the equipment survives) due to wind
extremes. Also, rain gauges only indicate rainfall in a localized area. For virtually any
gauge, drops will stick to the sides or funnel of the collecting device, such that
amounts are very slightly underestimated, and those of .01 inches or .25 mm may be
recorded as a trace.
Another problem encountered is when the temperature is close to or below freezing.
Rain may fall on the funnel and freeze or snow may collect in the gauge and not
permit any subsequent rain to pass through.
Rain gauges, like most meteorological instruments, should be placed far enough away
from structures and trees to ensure that any effects caused are minimised.
Types of rain gauges
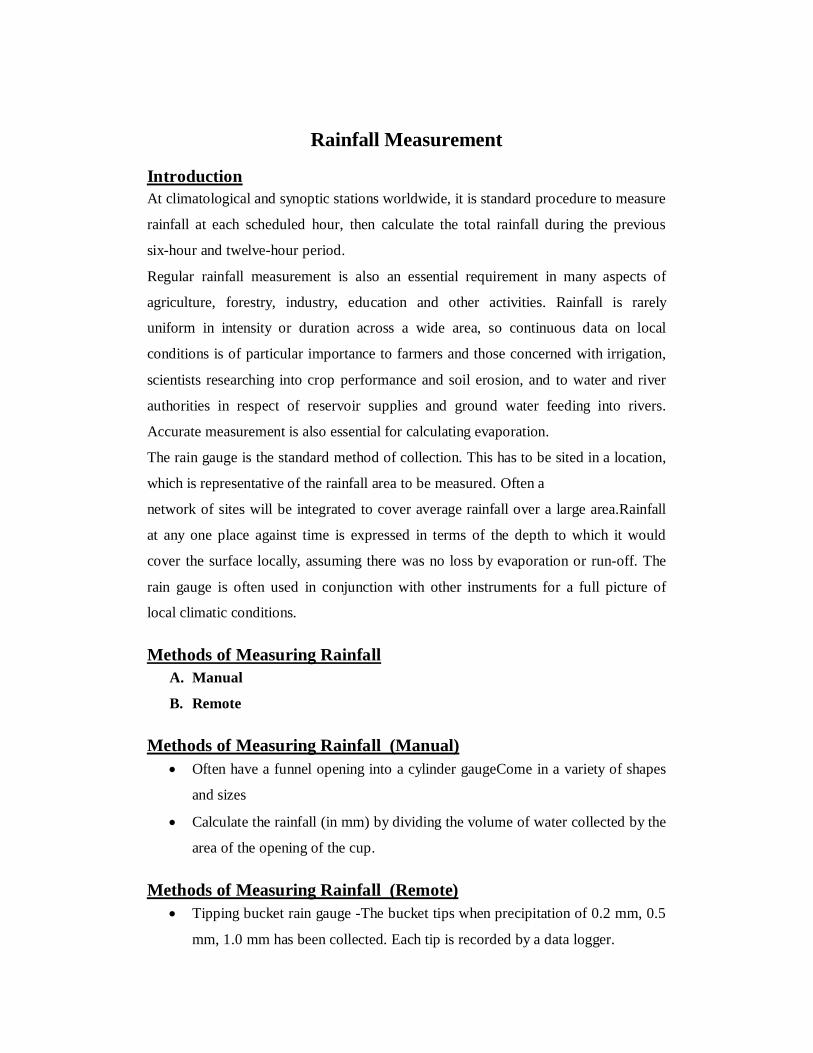
1-Ordinary (Standard rain gauge) rain gauge
The most common rain gauge is the ordinary rain gauge, which simply consists of a
collector place above a funnel that leads into measuring cylinder, where the rainwater
is stored between observations. The measuring cylinder is specially graded to give the
rainfall measurement in mm. Alternatively, where rainfall can be particularly heavy, a
large container is used to collect the rainwater. Readings are made by pouring the
rainwater out of the container into measuring cylinder so that the rainfall could be
measured.
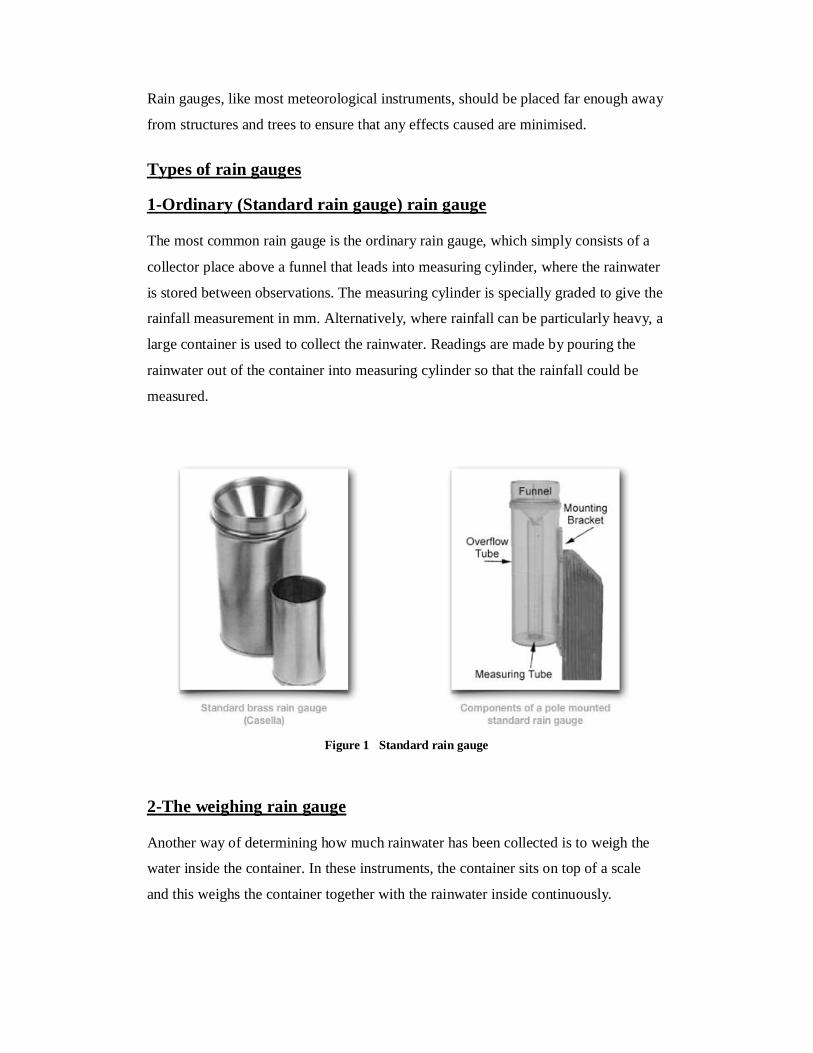
2-The weighing rain gauge
Another way of determining how much rainwater has been collected is to weigh the
water inside the container. In these instruments, the container sits on top of a scale
and this weighs the container together with the rainwater inside continuously.
Figure 1 Standard rain gauge
The scales may be adjusted for the container making the reading to be only the
collected rainwater. The measurements are usually recorded onto charts by pen and
ink but later systems uses digital scales that could record the measurements
electronically. Typically, this type of rain gauge does not empty itself and requires
routine attention.
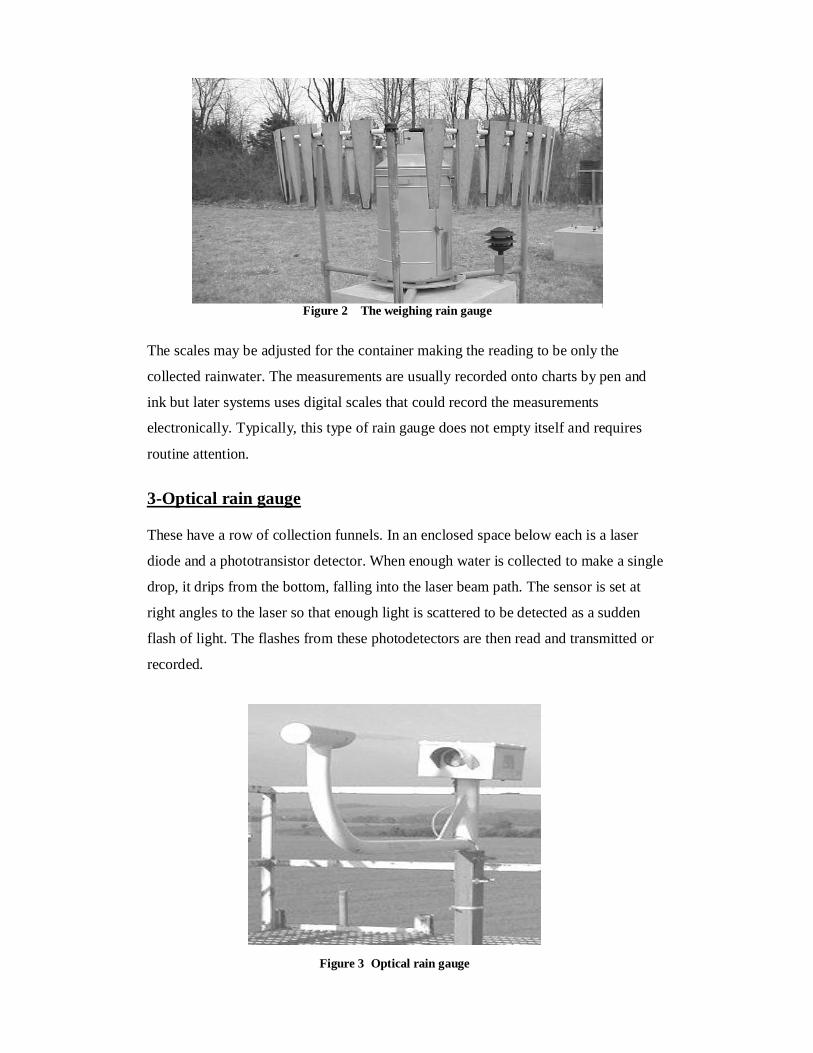
3-Optical rain gauge
These have a row of collection funnels. In an enclosed space below each is a laser
diode and a phototransistor detector. When enough water is collected to make a single
drop, it drips from the bottom, falling into the laser beam path. The sensor is set at
right angles to the laser so that enough light is scattered to be detected as a sudden
flash of light. The flashes from these photodetectors are then read and transmitted or
recorded.
Figure 2 The weighing rain gauge
Figure 3 Optical rain gauge

4-Tipping bucket rain gaugeA known volume of water collects in a calibrated bucket, which tips on its pivot
whenever it becomes full. Each tipping motion of the bucket closes a switch. The
number of times the switch is closed in a given period provides a measure of
rainfall rate.
Number and Distribution of Gaugeso Need to consider:
size of area
prevailing storm type
form of precipitation
topography
aspect
season
Distribution of GaugesThe distribution of gauges should not be random.
Figure 4 Tipping bucket rain gauge

o only fixed characteristics of areas can be sampled randomly. Random
events must be sampled by a systematic arrangement of sampling points
Practical considerations of access and exposure mean that some pragmatism is
required in designing a network.
o It is useful to locate gauges so that isohyetal maps can be drawn. Some
gauges need to be near, or outside the catchment boundary in order to
cover the catchment completely.
Number of GaugesBased ONLY on area considerations the following tabulation has been suggested:
Site Specific Rainfall Information Wagin – annual rainfall distribution
Size of area Number of gauges
2 16 hectares3 40 hectares
10 8 km2
15 16 km2
50 160 km2
300 1600 km2
1000+ 16,000 km2
Figure 5 Wagin – annual rainfall distribution
The weather stationA weather station is a facility with instruments and equipment to make observations
of atmospheric conditions in order to provide information to make weather forecasts
and to study the weather and climate. The measurements taken include temperature,
barometric pressure, humidity, wind speed, wind direction, and precipitation amounts.
Wind measurements are taken as free of other obstructions as possible, while
temperature and humidity measurements are kept free from direct solar radiation, or
insolation. Manual observations are taken at least once daily, while automated
observations are taken at least once an hour
Figure 7 weather station
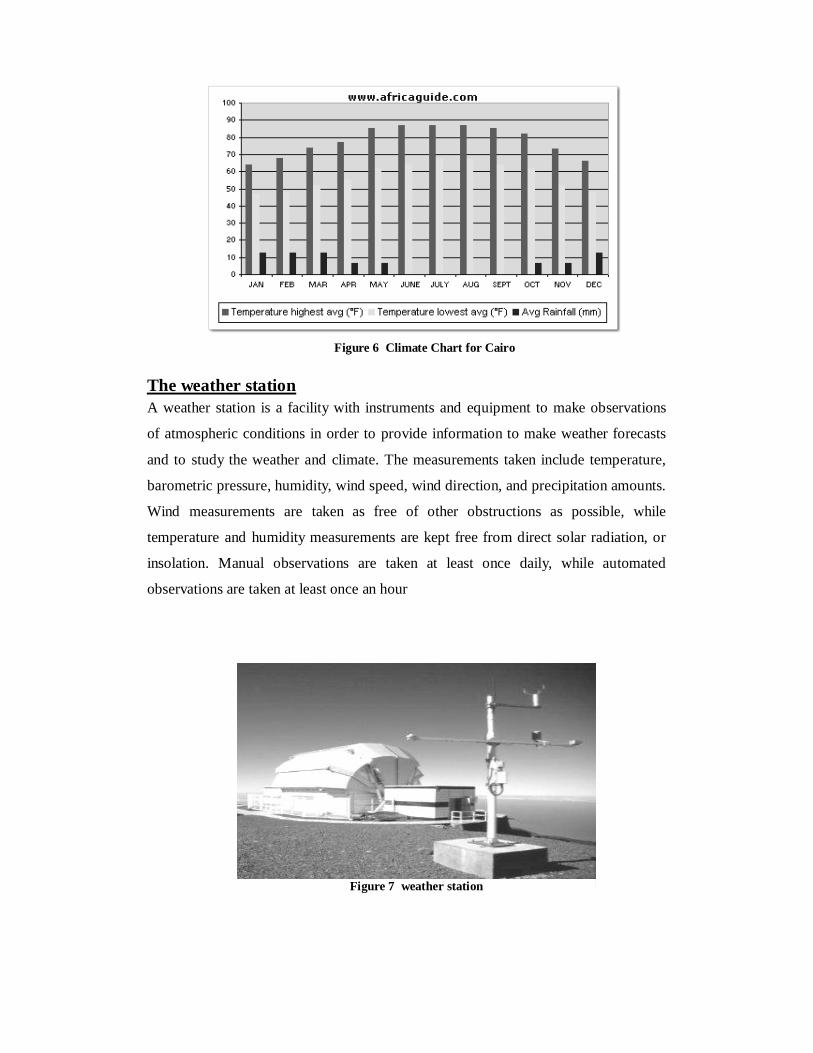
Figure 6 Climate Chart for Cairo

Ground-based radar equipment can be used to determine how much rain is falling and where it is the heaviest
Figure 8 ground based radar

Part 2
Methods OF Measuring Runoff
Runoff
Rainfall that is not absorbed directly into the soil, through the roots and leaves of
plants, or accumulated into existing bodies of water such as lakes or rivers is called
runoff. In areas where the underlying geologic formation is impervious to water, as in
the case of clay, runoff is a natural process, directing water in sheet flow, into lakes,
rivers, wetlands, and the ocean.
The design of the measuring instruments is important in order to get accurate
measurement results. Our experience with run-off measurements in torrents suggests
as follows:
The measuring profile should be trapezoid in torrents. This design allows for
an accurate measurement of low water level recording at the same time peak
Figure 1

floods many times over this value. The non-structured transverse profile
allows for a simple determination of the gauge key as the velocity distribution
in the channel is balanced which does not apply to structure transverse profiles
(low flow channel....).
A stilling basin should be upstream in order to reduce the influence of the
washing of the vagues.
At the end of the measuring channel should be a transverse dike with complete
overfall.
The establishment and calibration of the gauge key curve (which is used for
the conversion of the measured water levels in terms of flow quantities)
should, if possible, foresee continued measuring of the rate of flow. The usual
random sample measurement of the rate of flow is often impossible in torrents.
High water levels during floods which are of short duration consist a problem
as nobody can foresee them to pick the right moment.
The mesurement of the flow velocity should take place by radar as in case of a
flood episode bedload and wooden logs cause measurement errors and may
even destroy the instruments.
Measurement and mathematical modeling
Runoff is analyzed by using mathematical models in combination with various water
quality sampling methods. Measurements can be made using continuous automated
water quality analysis instruments targeted on pollutants such as specific organic or
inorganic chemicals, pH, turbidity etc. or targeted on secondary indicators such as
dissolved oxygen. Measurements can also be made in batch form by extracting a
single water sample and conducting any number of chemical or physical tests on that
sample.
In the 1950s or earlier hydrology transport models appeared to calculate quantities of
runoff, primarily for flood forecasting. Beginning in the early 1970s computer models
were developed to analyze the transport of runoff carrying water pollutants, which
considered dissolution rates of various chemicals, infiltration into soils and ultimate
pollutant load delivered to receiving waters. One of the earliest models addressing
chemical dissolution in runoff and resulting transport was developed in the early
1970s under contract to the United States Environmental Protection Agency. This

computer model formed the basis of much of the mitigation study that led to strategies
for land use and chemical handling controls.
Other computer models have been developed (such as the DSSAM Model) that allow
surface runoff to be tracked through a river course as reactive water pollutants. In this
case the surface runoff may be considered to be a line source of water pollution to the
receiving waters.
Runoff curve number
The runoff curve number (also called a curve number or simply CN) is an
empirical parameter used in hydrology for predicting direct runoff or infiltration from
rainfall excess.[1] The curve number method was developed by the USDA Natural
Resources Conservation Service, which was formerly called the Soil Conservation
Service or SCS — the number is still popularly known as a "SCS runoff curve
number" in the literature. The runoff curve number was developed from an empirical
analysis of runoff from small catchments and hillslope plots monitored by the USDA.
It is widely used and efficient method for determining the approximate amount of
direct runoff from a rainfall event in a particular area.
The runoff curve number is based on the area's hydrologic soil group, land use,
treatment and hydrologic condition. References, such as from USDA[1] indicate the
runoff curve numbers for characteristic land cover descriptions and a hydrologic soil
group.
The runoff equation is
where
Q is runoff ([L]; in)
P is rainfall ([L]; in)
S is the potential maximum soil moisture retention after runoff begins ([L]; in)
Ia is the initial abstraction ([L]; in), or the amount of water before runoff, such
as infiltration, or rainfall interception by vegetation; and Ia = 0.2S

The runoff curve number, CN, is then related
CN has a range from 30 to 100; lower numbers indicate low
runoff potential while larger numbers are for increasing
runoff potential.
Infiltration and surface runoff simulating extreme precipitation
A portable precipitation simulator that is equipped with a flat swivelling jet nozzle
(2.5 m above the sloping soil surface) is used for measuring infiltration. It simulates
almost natural precipitation in terms of distribution, the drop spectrum and the kinetic
energy of the droplet when impacting the soil surface. This device can track water
infiltration or surface runoff and the soil erosion it causes in relation to soil sealing
and macropore flow on arable land. This means that this equipment (Figure 2) can
simulate extreme precipitation events. It records the surface runoff from an area of 1
m2 and the soil material eroded during irrigation.
Prior measurements were made with this simulator to study the infiltration and soil
erosion on slopes with different types of tillage. The results generated form the basis
for recommendations for cultivation methods to reduce erosion and promote water
retention (such as conservation tillage). In addition, the readings provide the
foundations for the EROSION 2D/3D model used in Saxony for modelling erosion
and precipitation runoff on farming water catchment areas (also refer to the findings
of "Preventative Flood Protection with Conservation Soil Cultivation in the
Catchment Area of the Pließnitz River").
Figure 2 Small irrigator

Surface runoff with natural precipitation
It was not only extreme precipitation that was simulated with an irrigator on a
relatively small area. Surface runoff and erosion was also recorded for natural
precipitation and snow melt while testing the test irrigator presented in Figure 3. A
runoff and sediment catching trough catches the surface runoff and eroded soil
material from an area measuring 7 m2. They are conducted to a collecting tank
through a runoff pipe (also refer to "The Impact that Agricultural Usage has on the
Soil Water Reservoir"). Precipitation and temperature were also measured.
Runoff (flowthrough) in catchment areas used for farmingThe flow-through of a stream that drains a mesoscaled catchment area is recorded on
a continual basis. This not only measures flow-through, but also calculates qualitative
water parameters at the measuring channel (refer to Figure 4). This measuring station
is being operated together with the Saxon State Office for the Environment and
Geology. Since the catchment area is primarily used for agricultural purposes and the
soils consist of loess, these measurements should prove, among other things, that the
greater the area cultivated with techniques for conserving soil and water, the less
flood runoff there is (also refer to "The Impact that Agricultural Usage has on the Soil
Water Reservoir").
Figure 3 Device for recording surface runoff and erosion due to natural precipitation

Referenceshttp://www courses.nres.uiuc.edu/nres401/rainfall_measurements.ppthttp://www.africaguide.com/country/egypt/info.htmhttp://ccc.atmos.colostate.edu/~hail/index.phphttp://www en.wikipedia.org/wiki/Rainfallhttp://www.landwirtschaft.sachsen.de/de/wu/Landwirtschaft/lfl/inhalt/10182_10194.htm
Figure 4 Defined channel for a continuous flow-through measurement