methods of characterizing neural networks - ucla 2008/nord...methods of characterizing neural...
TRANSCRIPT

Methods of Characterizing Neural Networks
Ashley Nord University of Minnesota Minneapolis, MN 55414
Advisors: Katsushi Arisaka, Adrian Cheng
University of California Los Angeles Los Angeles, CA 90024
September 2, 2008
Abstract
The UCLA biophysics neuroimaging laboratory was created to develop new
methods to approach systems neuroscience. Currently, the lab is endeavoring to
understand how neural networks develop and process information. The organism of
focus is the zebrafish, and methods of imaging are confocal and two-photon imaging.
The primary goal is to use calcium imaging to create a three dimensional image of the
neural network. This map of the network will be combined with electrophysiology to
better understand the propogation of action potentials throughout the network. Further
work aims to characterize the excitatory and inhibitory components of the network.
Introduction
The characteristics and processes of individual neurons have been studied
extensively by biologists. Yet, understanding single neurons on this level does not
provide all the information necessary to characterize the behavior of the larger network
they compose. Many neuroimaging techniques have been developed in order to
investigate the processes of neural networks, such as fMRI and PET. But, these
imaging methods are only an indirect measure of neural activity and have poor temporal
or spatial resolution. In order to investigate how the neural network of the brain
develops and how it processes information, biologists and physicists must combine
microscopy imaging with techniques such as calcium imaging.
Background
The Model Organism
There are many factors that must be considered when choosing what organism
to image microscopically. Danio Rerio, the zebrafish, provides many advantages over
other organisms typically used. The zebrafish combines low cost with optical clarity. It
is a vertebrate that develops outside of the mother’s body, and its rapid development
combined with its transparency make for ideal imaging. The genes and organs have
been shown to be similar to those of humans, and the genes of the zebrafish have been
thoroughly studied. Thus, an understanding of the neural network of the zebrafish,
which contains only 104 neurons, would provide an excellent basis upon which to study
more complicated organisms.
Neurons
The core and fundamental unit of these networks are single neurons. Neurons
are electrically excitable cells capable of producing and transmitting signals. These
signals are propogated by chemical ions, and the propagation is observed as an action
potential. The cell body of a neuron, or the soma, may vary greatly in size, but is
usually on the order of 30nm. Connected to the cell body are multiple dendrites, by
which the cell receives signals from other neurons.
As the signal propagates, it travels from the soma down the axon, and to the
multiple axon terminals. As the membrane axon becomes depolarized, the flux of
chemical ions entering and exiting the cell causes the membrane potential to change
from about -70mV to about 40mV. At the end of the axon terminals lies a synapse, the
gap between the terminals and the dendrites of the next neuron. This gap is typically on
the order of 50 µm. As the signal reaches the tip of the axon terminals, it releases a
bundle of neurotransmitters, which are produced by the neuron and remain at the tip of
the terminals until released by an action potential.
The neurotransmitters cross the synapse and are absorbed by receptors on the
dendrite. They then enter the dendrite, where their absorption creates a potential. This
potential may be either excitatory or inhibitory, depending on the type of
neurotransmitters. Usually neurons are characterized by a single neurotransmitter. A
common excitatory neurotransmitter in vertebrates is glutamine, and a common
inhibitory neurotransmitter is GABA. The excitatory neurotransmitters cause
polarization of the cell, where the inhibitory neurotransmitters cause hyperpolarization.
If the combination of the potentials from all of the dendrites exceeds a threshold (usually
around -55mV), the action potential will continue along this neuron.
Electrophysiology
Traditionally, the best method to observe the action potential of a single neuron is
through electrophysiology. Electrophysiology directly measures the potential near the
membrane, on the membrane, or within the cell. With millisecond or greater resolution,
the temporal resolution of this measurement is much better than typical neuroimaging
techniques. The electrode is produced from a glass pipette that is normally heated and
pulled with a micropipette puller. Typically, the tip diameter of the micropipette is less
than one micrometer, and it is thus characterized by megaohm resistance. The
electrode is filled with an intracellular or extracellular solution, and a chloride silver wire
electrically connects the solution to an amplifier and signal processing circuit.
Calcium Imaging
Since electrophysiology only measures the potential in a single localized area, in
order to observe the propagation of action potentials across multiple neurons, an
imaging technique must be used. One method in which to indirectly observe the
change in potential across the cell membrane is through calcium imaging. With this
method, Fluophore AM, a chemical indicator designed to show the abundance of
calcium ions within tissue, is injected into the sample. The neurons are made
permeable to the fluophore, and the chemical dye enters the cell.
When the axon membrane become permeable, calcium ions rush into the cell.
When the density of calcium ions become sufficiently high, the fluophore binds to the
calcium ions. As it does so, the spectral properties of the dye change, and it becomes
fluorescent. Thus, this fluorescent dye becomes an indirect indicator of an action
potential in a neuron. Due to the decay time of the fluophore, calcium imaging is unable
to resolve individual action potentials. However, compared with electrophysiology, it
provides a broader picture of the activity of the network.

Microscopy Techniques
One manner in which to image the fluophore within the sample is with a scanning
confocal microscope. An objective lens is used to focus laser light that is scanned
across the sample, and the photons excite the fluorescent dye. As the electrons of the
dye fall back to ground state, photons are emitted at a different wavelength than the
excitation photons. A dichroic mirror is used to reflect the emitted photons towards a
detector. A pinhole is placed immediately in front of the detector in order to ensure that
only photons coming from the focal plane are detected. This allows for optical
tomography, because the objective lens can be moved in order to change the focal
plane in the sample. In this way, sequential images of the sample at different planes
can be combined to create a three dimensional image.
Another microscopy method is two-photon microscopy. With this method, an
infrared laser is scanned across the sample in a similar manner. However, with two-
photon microscopy, two low energy photons are needed to excite the electrons in the
fluorescent dye. The reemitted photon has a higher energy than either of the absorbed
photons, and the emitted photons are reflected towards the detector via a dichroic
mirror. A pinhole is not used due the statistical improbability that a molecule outside
the focal plane will be simultaneously excited by two photons. Also due to this
probability, a high flux of photons is necessary to excite a sufficient number of fluophore
molecules. Hence, a mode-locked femtosecond laser is typically used.
Two-photon microscopy, though generally more expensive to purchase or
construct, holds advantages over confocal microscopy. Due to the longer wavelength of
photons used, deeper tissue penetration is possible. Also, the risk of phototoxitiy is less
than with confocal microscopy due to the use of lower energy photons.
Methods and Results
Confocal Microscope
Often it was desirable to optically view the sample under the confocal microscope
before starting to scan in order to ensure that the sample is near a focus plane and the
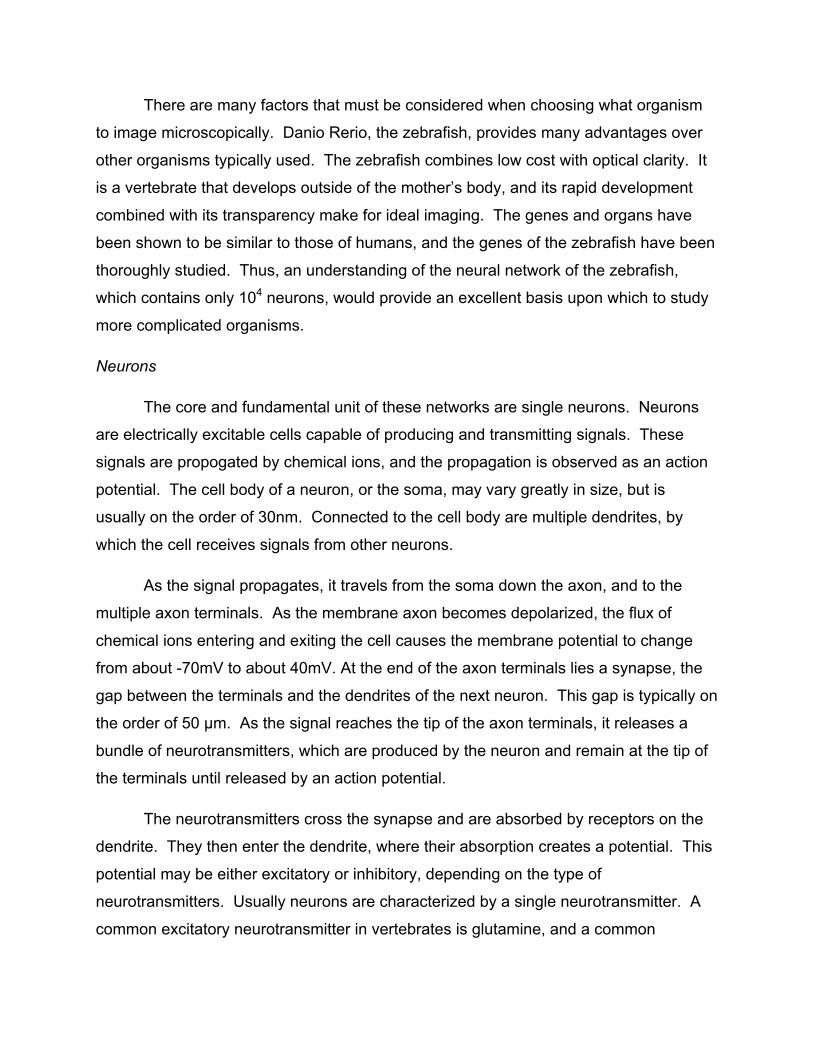
area of interest is within the field of view. In order to do this quickly and easily, a sliding
mirror box was designed using Solid Works. The mirror box positioned a dichroic mirror
at a 45 degree angle to the optical plane and reflected optical light towards a digital
camera. The mirror box was able to be slid in and out of the optical path in order to
easily switch between viewing the sample with the digital camera and scanning the
sample with the confocal microscope. Labview was used to send a TTL signal to turn
the laser off when the mirror box was in place. A picture of the sliding mirror box is
shown in Figure 1.
Figure 1: The siding mirror box attached to the confocal microscope. In this picture, the mirror box has been slid into the optical path, redirecting the optical light to the digital camera seen on the left of the box.
Labview software was created to control all aspects of the operation of the
confocal microscope. The software offers three separate modes: viewing the sample
with the digital camera, scanning the sample without moving the objective lens, and
taking sequential images of the sample while stepping the objective lens in the z plane.
The third option allows the user to combine the images to create a three dimensional
image of the object. The program allows the user to input the desired amplitude and
resolution.
The laser was aligned, an enclosure was created to minimize outside light noise,
and the labview program was implemented. The confocal laser is ready to begin
making three dimensional images of samples.

Electrophysiology
A Kopf vertical needle/pipette puller, model 720, was used to produce pipettes.
A voltage follower was built and inserted between the electrode and amplifier in order to
interface impedances. An amplifying circuit was then created which allowed for a gain
of either 100 or 1000, depending upon the type of electrophysiology being done. This
setup was mounted adjacent to the microscope stage to allow electrophysiology and
confocal microscopy to be done simultaneously. Figure 2 shows this setup.
Figure 2: The electrophysiology set up, adjacent to the confocal microscope. The electrode points to the sample and is attached directly to the voltage follower. The reference electrode is on the left of the stage.
Lab Preparations
Deionized water with a salt solution specified by Nusslein-Volhard and Dahm
was created for the zebrafish. The temperature and filtration of the water was also set
according to Nusslein-Bolhard and Dahm. The fish were bred in a plastic container that
allowed the eggs to fall to a level inaccessible to the adult fish. The eggs were then

removed and kept in a separate container. Small containers of agar were prepared for
dissection.
Future Work
A small container is currently being constructed to allow in-vivo imaging of an
adult zebrafish. The next step in the process is to inject the fluophore into the zebrafish,
and image the fish with the confocal and two-photon microscopes. It will also be
possible to simultaneously perform electrophysiology on the zebrafish. The immediate
goal is to create a three dimensional map of the neural network of the zebrafish.
A further exploration involves using immunohistochemistry to differentiate
between the excitatory and inhibitory neurons. This involves subjecting the sample to a
primary antibody designed to attach itself to the neurotransmitter of interest, then
subjecting the sample to a secondary antibody designed to attach itself to the first and
bonded to a fluorescent molecule. In this way, confocal and two-photon microscopy can
be used to create a three dimensional map of the network, differentiating the excitatory
and inhibitory componenets.
Acknowledgements
I’d like to thank Dr. Katsushi Arisaka, Adrian Cheng, and Dr. Luis Beltran for their
generous support and guidance. I’d also like to thank the National Science Foundation
for their support of the UCLA REU program.
References
Brustein, E., Marandi, N., Kovalchuk, Y., Drapeau, P., Konnerth, A., 2003. “In Vivo” monitoring of neural network activity in zebrafish by two photon Ca2+ imaging.
Pflugers Arch - Eur J Physiol. 446:766–773 Hale, M., Ritter, D., and Fetcho, D., 2001. A confocal study of spinal interneurons in living larval zebrafish. Journal of Comparative Neurology. 437: 1-16. Hamill, O., Marty, A., Neher, E., Sakmann, B., Sigworth, F., 1981. Improved patch clamp techniques for high resolution current recording from cells and cell-free membrane patches. Pflugers Arch: 391: 85-100.

Lewis, K., Eisen, J., 2003. From cells to circuits: development of the zebrafish spinal cord. Progress in Neurobiology. 69: 419-449. Nusslein-Volhard, Christiane, Dahm, Ralf, 2002. Zebrafish: A Practical Approach. Zygogen, LLC, 2008. Zebrafish as a modal organism – overview. <http://www.zygogen.com/zebrafish.asp>.