methods for assessment of the costs of droughts · methods for assessment of the costs of droughts...
TRANSCRIPT
Methods for Assessment of the Costs of Droughts
Ivana Logar Jeroen C.J.M. van den Bergh
Institute of Environmental Science and Technology Universitat Autònoma de Barcelona Spain
Date September 2011 Report Number WP5 Final Report
Location ICTA, UAB
Deliverable Number D 5.1
Due date for deliverable September 2011
Note Public
CONHAZ REPORT WP05_1 2
Document information
Title Methods for Assessment of the Costs of Droughts
Lead Author Ivana Logar, Jeroen C.J.M. van den Bergh
Distribution Public
Document Reference WP05_1
Document history
Date Revision Prepared by Organisation Approved by Notes
15/12/10 Draft Ivana Logar, Jeroen C.J.M. van den Bergh
ICTA, UAB
14/01/11 Feedback from project partners
Ivana Logar, Jeroen C.J.M. van den Bergh
ICTA, UAB
10/09/11 Final Ivana Logar, Jeroen C.J.M. van den Bergh
ICTA, UAB UFZ
Acknowledgement
The work described in this publication was supported by the European Community’s Seventh
Framework Programme through a grant to the Integrated Project CONHAZ, Contract
244159. The authors are grateful to all ConHaz partners and workshop participants for
suggestions and useful comments.
Disclaimer
This document reflects only the authors’ views and not those of the European Community. This
work may rely on data from sources external to the CONHAZ project Consortium. Members of
the Consortium do not accept liability for loss or damage suffered by any third party as a result of
errors or inaccuracies in such data.
© CONHAZ Consortium
Contact persons for WP5 Ivana Logar – [email protected]
Jeroen C.J.M. van den Bergh – [email protected]

CONHAZ REPORT WP05_1 3
The ConHaz EU project Cost assessments of damages of, prevention of, and responses to natural hazards provide
crucial information for decision support and policy development in the fields of natural hazard
management and planning for adaptation to climate change. There is a considerable diversity of
methodological approaches and terminology being used in costs assessments of different
natural hazards. This complicates the assessment of comprehensive, robust and reliable costs
figures, as well as comparison of costs across hazards and impacted sectors. This report is part
of the EU project ConHaz. The first objective of ConHaz is to compile state-of-the-art methods
and terminology as used in European case studies. This compilation will consider droughts,
floods, storms, and alpine hazards, as well as various impacted sectors, such as agriculture,
health and nature. It will consider direct, indirect and intangible costs. ConHaz further examines
the costs and benefits of risk-prevention and emergency response policies. The second
objective of ConHaz is to evaluate the compiled methods by considering theoretical assumptions
underlying cost assessment methods and issues appearing in application of the methods, such
as availability and quality of data. ConHaz will also assess the reliability of the end results by
considering the accuracy of cost predictions and best-practice methods of validation, and will
identify relevant gaps in assessment methods. The third objective of ConHaz is to compare
available assessment methods with end-user needs and practices, so as to better identify best
practice and knowledge gaps in relation to policy-making. A final objective of ConHaz is to give
recommendations about best practices and to identify resulting research needs.

CONHAZ REPORT WP05_1 4
Abstract Drought is a natural hazard which causes many economic, social and environmental problems in
different parts of the world. It is expected that the intensity and frequency of droughts are going
to increase in the future due to climate change. In Europe, a warmer and dryer climate is
expected in many countries, particularly in the Mediterranean region. It is predicted that there will
be a considerable enhancement in inter-annual variability in the summer climate, associated with
higher risks of heat waves and droughts, already experienced in recent years. The existing
literature on the costs of drought is scarce, fragmented and heterogeneous and there is a need
for comprehensive costs estimations to help designing effective policy responses. For these
reasons, it is becoming increasingly important to identify and evaluate different approaches for
estimating the costs of droughts in order to provide recommendations on best practices.
This report explains the terminology and classifications which are used in the literature to
describe the impacts and costs of droughts. Furthermore, it describes and compares the main
methods for assessing all types of drought costs, i.e. direct, indirect and intangible costs. To
acquire all relevant information, the study has combined a review of the relevant literature and
an expert and stakeholder workshop held on 3-4 February 2011 at Universitat Autònoma de
Barcelona. The report considers the suitability of existing drought cost assessment methods for
estimating costs in different economic sectors, their underlying theoretical assumptions, and
application issues, such as their precision, reliability, data needs (and availability), and financial
and human resources required. In addition to reviewing the methods for assessing drought
costs, the report briefly examines potential policies for drought mitigation and adaptation. The
latter covers discussions of drought risk assessment (including drought indicators), predicted
future changes concerning droughts in the light of expected climate change, drought
preparedness, mitigation and adaptation measures, the costs of such measures, legislation
related to drought in the European Union, and international cooperation on drought mitigation.
Finally, recommendations for good practices and main disadvantages of the methods for
assessment of drought costs are discussed. The report also provides a set of recommendations
for drought mitigation and adaptation measures. It concludes with identifying knowledge gaps
and further research needs.

CONHAZ REPORT WP05_1 5
Structure
The ConHaz EU project............................................................................................................. 3
Abstract ..................................................................................................................................... 4
1 Introduction ....................................................................................................................... 7
2 Costs of Droughts ............................................................................................................. 8 2.1 Drought impacts and costs: Terminology and classifications ................................................ 9
2.2 Overview of drought costs ................................................................................................. 12
2.2.1 Direct costs and costs caused by the disruption of production
processes .......................................................................................................................... 12
2.2.2 Indirect costs ............................................................................................................ 13
2.2.3 Intangible (environmental and health) costs .............................................................. 14
3 Overview of methods for drought cost assessment ..................................................... 14 3.1 Market valuation techniques .............................................................................................. 15 3.2 Assessing effects on GDP and agricultural production ...................................................... 17 3.3 Input-output analysis ......................................................................................................... 19
3.4 Computable general equilibrium analysis .......................................................................... 20
3.5 Biophysical-agroeconomic modeling ................................................................................. 22
3.6 Coupled hydrological-economic modeling ......................................................................... 24
3.7 Ricardian hedonic price modeling ...................................................................................... 25
3.8 Contingent valuation .......................................................................................................... 27
3.9 Choice experiments ........................................................................................................... 28
3.10 Life satisfaction analysis .................................................................................................. 30
3.11 Benefit or value transfer ................................................................................................... 32
4 Drought mitigation and adaptation policies .................................................................. 36 4.1 Risk assessment of droughts ............................................................................................. 36
4.2 Climate change and droughts ............................................................................................ 38
4.3 Drought prevention, mitigation and adaptation measures .................................................. 40
4.4 Costs of drought prevention, mitigation and adaptation measures ..................................... 42
4.5 Drought legislation in the EU ............................................................................................. 43
4.6 Cooperation in coping with droughts .................................................................................. 44
5 Recommendations and knowledge gaps ....................................................................... 45 5.1 Recommendations and best practices regarding methods for cost
assessment of droughts .................................................................................................... 45
5.1.1 Direct costs ............................................................................................................... 45
5.1.2 Indirect costs ............................................................................................................ 46
5.1.3 Intangible costs ......................................................................................................... 46
5.2 Recommendations and best practices with respect to drought mitigation
and adaptation policies ...................................................................................................... 47

CONHAZ REPORT WP05_1 6
5.3 Knowledge gaps ................................................................................................................ 49
References............................................................................................................................... 51
Appendix: Previous and current European projects related to drought ............................. 57
CONHAZ REPORT WP05_1 7
1. Introduction When studying the economic consequences of droughts, it is useful to have a clear definition
and thus a common understanding of what is a drought. Drought can in a broad sense be
defined as a temporary lack of water caused by abnormal climate which is damaging to an
activity, group of people or the environment (Kallis, 2008). However, a variety of definitions of
“drought” have been proposed by different disciplines. Most frequently, a distinction is made
between meteorological, hydrological, agricultural, and socio-economic droughts (Wilhite and
Glantz, 1985). Meteorological (or climatological) drought is defined as a reduction in rainfall
supply compared with a specified average condition over some specified period of time (Hulme,
1995). Thus, intensity and the duration of the dry period are the key characteristics of this
definition. Meteorological drought definitions usually relate actual precipitation departures to
average amounts on monthly, seasonal, “water year”, or annual time scales. Hydrological
drought is associated with the impacts of a reduction in precipitation on surface or subsurface
water supply (i.e., streamflows, reservoir levels, lakes, groundwater) rather than with
precipitation shortfall itself. When the actual flow for a selected time period falls below a certain
threshold, then hydrological drought is considered to be occurring (Wilhite, 2000). However,
defining the threshold and the time period is somewhat arbitrary and will vary between streams
and river basins. Agricultural drought is defined as a reduction in moisture availability below the
optimum level required by a crop during different stages of its growth cycle, resulting in impaired
growth and reduced yield (Benson and Clay, 1998). Finally, socio-economic drought relates the
supply and demand of an economic good or service with the elements of meteorological,
hydrological or agricultural drought. For example, according to this definition drought occurs
when the demand for a good exceeds its supply as a result of a weather-related supply shortage
(Wilhite, 2000).
It is important to distinguish drought from the concepts of water scarcity and aridity. Water
stress or scarcity is an excess of water demand over available supply. Unlike meteorological
drought, it need not have a climatic origin or be temporary. It can result from human-driven
factors such as overuse or misallocation of the water resource as well as from altered climatic
conditions (i.e. climate change). Aridity, unlike drought, is not abnormal or temporary but is a
permanent feature of certain regional climates, such as desert environments (Kallis, 2008).
Moreover, drought is considered by many to be the most complex and least understood of all
natural hazards. In addition, according to Wilhite et al. (2007) drought affects more people than
any other hazard.
The Working Group on Water Scarcity of the European Union reports that over the past 20
years there have been four significant large-scale droughts, which covered more than 800.000
km2 of EU territory (equal to 37%), affecting more than 100 million people (EU, 2006). A study of
the European Commission (2007a) estimates the costs of droughts in Europe over the last 30
years to be at least 100 billion €. Moreover, the European Environmental Agency reported that
the annual average economic impact from water scarcity and droughts doubled from 1976-1990
and 1991-2006 periods, rising to 6.2 billion € per year in recent years (EEA, 2010). The drought
which occurred in Central and Western Europe in 2003 has caused an estimated economic
damage of more than 13 billion USD (Munich Re, 2004). To provide another indication, Martin-
Ortega and Markandya (2009) appraised the total losses of the drought which affected the
Spanish region of Catalonia during 2007 and 2008 at 1.661 billion € for a one-year period. This
corresponds to almost 1% of the Catalonian GDP. In addition, the World Meteorological

CONHAZ REPORT WP05_1 8
Organization reports that from 1991 to 2000 alone, droughts have caused over 280.000 deaths
(WMO, 2011).
The Intergovernmental Panel on Climate Change (IPCC, 2007a) projects with a high
degree of confidence that a warmer climate, with its increased precipitation variability, will
increase the risk of a drought in many areas. It provides evidence for a climate-related trend of
intensified droughts in certain drier regions since the 1970s and further anticipates that the
frequency and intensity of drought events will increase, particularly in semi-arid, snow or glacier
areas and coastal basins. It has been projected that the number of extreme drought events per
100 years and mean drought duration are likely to increase by factors of two and six,
respectively, by the 2090s (Burke et al., 2006). IPCC (2007a) further predicts with a very high
confidence that many semi-arid areas (e.g., the Mediterranean basin, the western USA,
southern Africa and north-eastern Brazil) will suffer a decrease in water resources due to climate
change. It foresees that there will likely be an overall increase of drought-affected areas by the
end of the century.
The total area and population affected by water scarcity and drought in EU countries
doubled from 6% to 13% from 1976-1990 to 1991-2006. In general, water is relatively abundant
in Europe, with only 13% of the available resource abstracted each year (EEA, 2009), but water
availability and population are unevenly distributed. Annual precipitation trends in the 20th
century showed an increase in northern Europe (10-40%) and a decrease in some parts of
southern Europe (up to 20%) (EEA-JRC-WHO, 2008). It is projected that water availability will
generally further increase in northern parts of Europe, while Southern and south-eastern regions
will be particularly exposed to reductions in water availability and experience an increase in the
frequency and intensity of droughts (EEA, 2010).
This will certainly raise the importance of estimating drought damages. Thus, we first need
to understand better various drought impacts in order to develop new as well as improve the
existing methods for reliable drought cost assessment. Apart from this, establishing effective
drought preparedness measures, mitigation and adaptation policies will become crucial in
diminishing drought damages. Preparation and good implementation of such policies require
information about the physical as well as monetary-economic consequences of droughts. A list of
past and ongoing projects related to drought issues in Europe is provided in the Appendix. They
serve as a useful source of information regarding various aspects of drought.
2. Costs of droughts Compared to other natural hazards, such as floods or storms, droughts are harder to identify and
more complex to measure because they entail particular, unique features. First of all, drought is
a relative concept, because it depends on deviations from a historical record for a specific area.
This means that droughts are not uniformly defined over space and time. For example, an
annual rainfall of 500 mm may indicate drought for one region but not for another. In addition,
there is no one-to-one relationship between amount of rainfall and drought, that is, depending on
how annual precipitation is distributed over different seasons, an area may experience a drought
or not. Moreover, drought develops at a much slower pace and lasts longer than other natural
hazards (while its duration can vary considerably), making it particularly difficult to identify an
onset or end of a drought. One should further realize that droughts usually cause fewer visible
infrastructural damages (except for damages from subsidence and fires) and have more indirect
and diffuse impacts (scattered in space and across activities rather than concentrated) in

CONHAZ REPORT WP05_1 9
comparison with other natural hazards. For this reason, drought damages are more difficult to
identify. The impacts of droughts are the result of an interplay between a natural event (e.g.,
precipitation deficiencies because of natural climatic variability) and the demand placed on water
and other natural resources by human-use systems (Wilhite and Vanyarkho, 2000). The impacts
of droughts of equal intensity can differ greatly depending on the hydro-environmental and socio-
economic factors of the area affected by a drought. Hydro-environmental factors that determine
the severity of drought impacts include, for instance, river flows, groundwater and dam reserves,
and soil moisture, which are influenced by water management, water withdrawals, and land uses
in an area. Examples of socio-economic factors are demography, production patterns,
agriculture system (rain fed versus irrigated), dominant type of dwelling (e.g., with large
gardens), and income. Vulnerability mediates hazard and impacts. It is defined as the state of
susceptibility to harm from exposure to stresses associated with environmental and social
change and from the absence of capacity to adapt (Adger, 2006). The vulnerability and costs of
droughts depend largely on all these factors and consequently vary substantially among different
regions and groups of the population.
2.1. Drought impacts and costs: Terminology and classifications Impacts from droughts are commonly classified as direct versus indirect (Wilhite, 2000; Wilhite et
al., 2007). Direct (also referred to as primary) impacts are usually of a biophysical nature, while
the consequences of these impacts represent indirect or secondary impacts. For example,
reduced crop productivity is a direct impact of drought, which leads to several indirect impacts,
such as lower revenues in agriculture, job losses, increase in crop prices, and food shortages.
Benson and Clay (1998) talk about the direct or physical impacts of droughts on the productive
sectors (agricultural and livestock sectors, hydroelectric power generation, and other water-
intensive activities), which are similar regardless of the economy, although their magnitude
depends on specific country characteristics. They also identify a range of second round and
subsequent impacts of a drought shock, including constrained productivity of related sectors and
subsectors, loss of earnings, increased unemployment, reduced demand in the economy,
inflation due to food and electricity shortages, and deteriorated budgetary and external trade
balances. Another frequently used classification of drought impacts includes economic,
environmental, and social categories (Wilhite, 1992; Wilhite, 1997; Cooley, 2006; Wilhite et al.,
2007). The workshop participants mentioned that there might be an additional, separate
category called luxury impacts, which may embrace impacts from tourism and golf courses, for
example. Wilhite and Wood (1994) and the National Drought Mitigation Centre of the University
of Nebraska – Lincoln (http://drought.unl.edu/risk/impacts.htm) present comprehensive lists of
impacts associated with droughts according to this classification.
A classification of the costs related to droughts can distinguish between preparedness
costs, which are fixed and occur now and drought costs which are uncertain and will occur later
(Wilhite, 1996). Heathcote (1969) refers to these two categories as spasmodic and incessant
effects of droughts. Some authors refer to direct and indirect losses from droughts stemming
from their direct and indirect impacts. For example, Holden and Shifer (2004) and Horridge et al.
(2005) refer to the losses from reduced production in agricultural and livestock industries as
direct impacts from drought, while losses that occur in other economic sectors due to a multiplier
effect, job losses, and impacts on household welfare are considered as indirect impacts of
droughts. Mysiak and Markandya (2009) distinguish several categories of economic losses due

CONHAZ REPORT WP05_1 10
to droughts, such as structural versus non-structural losses, direct versus indirect (or higher-
order) losses, and intangible losses. Direct and indirect losses are further divided into stock
losses (e.g. land, machinery or inventories) and flows losses (e.g. annual crop yield or energy
produced). Another distinction is between output (interruption) and capital losses (destruction).
Apart from this, the existing literature does not explicitly define or classify the costs stemming
from droughts, as opposed to classifications of drought impacts.
It should be noted, however, that this is inconsistent with the classification of direct and
indirect impacts of droughts explained in the first paragraph of this subsection, in which direct
impacts are mainly biophysical, while indirect impacts cover economic losses due to such
physical impacts. For this reason, trying to define direct versus indirect costs of this natural
hazard is problematic. There are, nevertheless, many criteria that could be used for making a
distinction between direct and indirect costs. For example, a classification could be based on
causality (initial effects in the cause-effect chain leading to secondary effects), time scale
(immediate versus later costs), or spatial distribution (where direct would indicate effects in the
region affected by the drought and indirect outside the region). This raises the question which
criterion is the most appropriate one? Possibly, some of these criteria are highly correlated in
many drought cases, which would mean that the precise choice of a criterion would matter less.
In addition, as noted earlier, droughts differ considerably from other natural hazards
because they develop at a much slower pace and last considerably longer. Therefore, regardless
of the precise definition of costs, droughts generally may cause higher indirect and intangible
costs than other natural hazards. However, as such costs may occur months or years after the
event has started, they are difficult to be completely assessed and thus likely to be
underestimated. Direct costs of droughts are associated with direct physical damages to
buildings, infrastructure, and other assets, which stem mainly from subsidence and fires
(droughts do not cause fires directly, but they increase the risk of fire by decreasing air humidity
and increasing plant flammability). Even though such costs may be substantial, they hardly
receive any attention in the literature. Such costs may vary considerably depending on the
region where a drought takes place, although one might expect that for Europe they could be
rather high. Losses (i.e. costs) associated with the disruption of production processes due to
droughts are numerous and relatively well documented (e.g. withered crops and dead livestock,
problems with cooling of electricity producing equipment and hydropower, and diminished
opportunities for water transport because of low water levels in rivers and other flows).
Distinguishing between direct and indirect costs of droughts is sometimes not very
straightforward (e.g. in the case of tourism). On the other hand, intangible costs refer to non-
market costs and are easily distinguished as different methods are used for their assessment.
The term intangible might be somewhat confusing as it suggests that such impacts are invisible,
which is not necessarily the case. Intangible costs may in fact be associated with impacts that
are rather tangible or visible and which can therefore be considered as a sub-category of both
direct and indirect costs. Immediate mortality due to, for instance, a flood suggests that certain
intangible costs can be seen as a sub-category of direct costs. However, this type of direct effect
is not very relevant for droughts. Here intangible costs will be mostly indirect costs. Even though
the terms intangible and non-market costs are according to the workshop participants not
completely the same, they consider that it is clear which kind of costs are embraced by these
terms. Policy makers often use the term social costs instead. Some participants stated that
intangible costs are actually external costs of droughts, but we feel that one should be careful

CONHAZ REPORT WP05_1 11
here as the definitions of these are quite different. Note further that the term intangible costs
captures well that often these costs are neglected when assessing the costs of droughts.
The ConHaz project distinguished in its original proposal between direct costs, losses due to
disruption of production processes, indirect cost, and intangible costs. We had extensive
debates about what is the best approach to classify damage costs of droughts (or hazards
more generally). For example, the term intangible cost or impact is not used in the literature
on droughts or in the literature on monetary valuation. In both, the term non-market
value/cost is more common. Our suggestion would be to use a two-dimensional (matrix)
categorization of drought costs, with direct and indirect costs in one dimension, where direct
costs include impacts on resource-based sectors (possibly in some cases like floods also on
infrastructure) and indirect costs include impacts on the rest of the economy. Market
(tangible) and non-market (intangible) costs would then make up the second dimension of
classification (see Table 1). Finally, losses due to disruption of production processes would in
this case form part of either direct or indirect costs (and mainly tangible costs), rather than
representing a separate cost category (or a third dimension?). More discussion is needed on
this issue.
Table 1. Illustrative classification of the costs of droughts
Measurement
Market (tangible) Non-market (intangible)
Form of damage
Direct
- Losses in resource-based sectors like agriculture, such as reduced crop production and reduced livestock production
- Losses of water-providing companies, hydroelectric production and water transport
- Subsidence of buildings and infrastructure
- etc.
- Damage to wildlife and fish habitat - Loss of biodiversity - Loss of wetlands - Deteriorated water and air quality - Losses due to restrictions of water
supply in households - etc.
Indirect
- Increased unemployment - Changes in prices of food and
timber - Trade losses - Reduced tax revenues - Losses in economic sectors
indirectly related to droughts (e.g. food industry)
- etc.
- Animal diseases - Reduced quality or loss of
recreational sites, aesthetic impacts
- Increased human health costs (diseases, malnutrition)
- Loss of human lives - etc.
Source: Adapted from Penning-Rowsell et al. (2003) and Smith and Ward (1998)
In addition to the costs of drought impacts, one can identify the costs of mitigation to avoid
or reduce the risk of, and adaptation to, droughts. Such costs can also be classified into direct,
indirect and intangible cost categories. Many of mitigation and adaptation costs are direct costs
which have market values (e.g. new infrastructure or the costs of making infrastructure resilient
to droughts) and are hence easy to estimate. Assessing the costs related to water demand

CONHAZ REPORT WP05_1 12
management and other drought mitigation and adaptation measures is somewhat less
straightforward and requires applying less straightforward cost assessment methods. The most
difficult part is estimating emergency costs, as they can vary significantly depending on the
adopted baseline for comparison. Namely, emergency costs may include investments in
infrastructure that will serve for the next several decades; so it is important to set a baseline
which will determine the share of these costs corresponding to the drought event. Assessment of
the overall drought costs should include a category of the costs of emergency measures as they
also form part of the costs stemming from drought (e.g. during the 2007-2008 drought in
Catalonia boats were bringing water to Barcelona, the costs of which also represent part of the
costs of this drought event). Finally, when developing drought management plans one should
also take into account the transaction costs of implementing a new policy.
2.2. Overview of drought costs 2.2.1. Direct costs and costs caused by the disruption of production processes The most significant direct costs of droughts are related to their biophysical impacts. They
include reduced crop production in agriculture; reduced range land and forest productivity; lower
income for farmers and agricultural businesses; losses in livestock production; increased
livestock and wildlife mortality; higher risks of fire hazard (in combination with high
temperatures); reduced surface and groundwater levels; lower crop quality; insect infestation
(invasion); tree and plant diseases; and wildlife damage to crops. Furthermore, due to
diminished water availability, droughts generate losses for (drinking) water-providing companies,
hydroelectric production (because of low reservoir levels), cooling of the power-producing
equipment (because of high water temperatures for cooling), water transport because of
impaired navigation possibilities through rivers and canals (Jonkeren et al., 2007), irrigation,
fishing industry, tourism industry (resource-based), gardening and flower production companies,
and swimming pool companies. For instance, the cost of low hydroelectric production due to
drought in Portugal in 2005 was estimated at 883 million € (Demuth, 2009), while France
reported losses of 144 million € in tourism during the winter 2006-2007 in the Alps-Savoie (EEA,
2010). Lower water levels are also likely to induce emergency costs of securing water availability
through water transport or transfer. An example is the drought in Barcelona in 2008 which forced
the local government to bring water to the city with tankers (boats). The costs of these shipments
are estimated at 18 million € (EEA, 2010). Regarding direct impacts on buildings and
infrastructure (e.g. roads), droughts can cause subsidence of the ground, although this impact
seems not to have been discussed much or at all in the existing literature. A reason may be the
lack of data on the damage from subsidence. For example, in the UK there is an insurance
against subsidence, as a result of which data on these damages exists. However, in most
countries such insurance does not exists and hence no such data is available. Dlugolecki (2007)
reports that subsidence of buildings during droughts has costed insurers in UK and France many
billions of dollars in recent decades. Figure 1 clearly shows a negative correlation between the
amount of precipitation and subsidence damage of household buildings in the UK between 1988
and 2006. Corti et al. (2009) estimated building damages from soil subsidence in France for the
period 1989-2002 at 237 million € per year. Their results also revealed a doubling of damages in
this period compared to 1961-1990, when damages totaled 115 million € per year. The difference
between the two periods is mainly a consequence of increasing temperatures, indicating a
causal relationship with climate change. Based on these results, the authors conclude that the

CONHAZ REPORT WP05_1 13
costs of damages to buildings due to droughts can be as large as for floods in some regions. So
while subsidence damages from droughts might actually be substantial, they are being
overlooked due to a lack of information on it. Subsidence-related costs of droughts are likely to
differ both between and within regions as they depend on meteorological factors, soil type and
even building features (e.g. the age of buildings and foundation depth. More generally, the multi-
causality of damages makes cost assessment of droughts a more difficult exercise than of many
other natural hazards.
Figure 1. Correlation between UK household buildings subsidence damage and drought (1988-
2006)
Legend: Subsidence damage measured in 2003 million £. Data supplied by the Association of British
Insurers. Drought intensity measured in accumulated precipitation over the 18 months prior to September
of the corresponding year (in mm).
Source: Dlugolecki (2007)
2.2.2. Indirect costs Indirect costs from droughts occur as a consequence of the physical-ecological impacts on the
economy as a whole, that is, through changes in resource-based activities on the rest of the
economy (and hence often occur later than direct costs). For example, reduced crop, range land
and forest productivity, and associated lower income for farmers and agricultural businesses,
leads to increased unemployment, changes in the prices of food and timber, diminished trade
(e.g., due to decreased export of agricultural products or increased import of such products at
higher costs), reduced national, regional or local government tax revenues (lower tax base),
increased pressure on financial institutions (higher credit risks, capital deficits), losses of farmers
through bankruptcy due to foreclosures, and losses of industries related to the agricultural sector
(e.g. food and timber industries, producers and distributors of fertilizers and machinery used in
agriculture). A reduction in water levels may cause decreased revenues of tourism and
recreation industries (non-resource based) and an increase in the price of electricity. Finally,
droughts can lead to higher costs of health care (e.g., respiratory problems due to a higher
concentration of dust particles in the air). One of the main concerns with respect to indirect costs
of droughts is that they might often be underestimated because they can continue or appear long
after a drought has ended.

CONHAZ REPORT WP05_1 14
2.2.3. Intangible (environmental and health) costs In the ConHaz project it was decided to include the category of intangible costs which denotes
non-market costs associated with environmental and health impacts of droughts, or natural
hazards in general. Environmental impacts from droughts embrace damage to wildlife and fish
habitat, animal disease, loss of biodiversity, loss of wetlands, deteriorated water and air quality
(e.g. salt concentration, pH, dissolved oxygen, dust, pollutants), soil erosion, intrusion of
saltwater, reduced quality or loss of recreational sites, and aesthetic impacts. Health impacts
from droughts primarily refer to an increased risk of diseases as well as malnutrition and famine
due to food shortages. Droughts also have other intangible costs, such as a loss of human lives,
migration (usually from rural to urban areas), social conflicts, increased crime rates, changes in
income distribution, social welfare losses due to restrictions of water supply in households (e.g.
prohibition of water use for swimming pools, gardens or car washing), and other kinds of social
welfare loss (e.g. in rural areas in India, households affected by droughts stop sending children
to school; Chatterjee et al., 2005). Even though droughts might cause serious food shortage
problems and there are currently hardly any public food reserves, this issue has received
surprisingly little attention in the literature. Note that some of the above-mentioned intangible
costs are more likely to occur in developing than developed countries (e.g. loss of human lives
or food shortage). The main feature of intangible costs is that they relate to effects, goods and
services outside markets for which no price can be observed. In the literature on economic-
monetary valuation the term for this category is non-market value, associated with non-market
valuation methods which try to capture such non-market effects (discussed in the next section).
The terms tangible and intangible might hence be preferable for classifying drought impacts,
while market and non-market could be used for classifying drought costs. 3. Overview of methods for drought cost assessment Traditionally, more emphasis has been placed on identifying and estimating the economic than
environmental or social impacts of droughts. This particularly holds true for the agricultural
sector, which usually is the sector that is the first and most affected by droughts. Hence, the
impacts of drought in a resource-based sector like agriculture are direct and consequently better
understood and quantified more easily than (indirect) impacts on other, non-resource-based
sectors of the economy. Impacts on resource-based sectors like water supply and hydropower
have received less attention. The effects of droughts on other sectors, such as tourism, transport
and energy, have steadily begun to gain more attention in the literature. Social and
environmental drought impacts are still not very well understood and are difficult to quantify.
Nevertheless, there is nowadays more awareness of the importance of social and environmental
drought impacts and their inclusion as part of the total drought costs. Several approaches for
their assessment exist and many studies have already applied them in order to assess the
intangible costs of droughts. In this section we provide an overview of methods for assessing
different types of drought costs – direct, indirect and intangible costs. Some of the methods
serve for estimating only one cost type (e.g., only intangible costs), while others may be used to
asses two or even all three types of drought costs. Table 2 provides a theoretical overview of
available methods for estimating different types of costs and values. It is worthwhile noting that
some of these methods can assess drought costs only once a drought has occurred (ex post
costs), while others allow cost assessment of both a historical and a hypothetical drought (ex
post and ex ante costs, respectively). Hence, ex ante and ex post costs are distinguished on the

CONHAZ REPORT WP05_1 15
basis of the timing of the cost assessment. Uncertainty about estimate precision is evidently
larger in the former case. Even though the travel cost method and the cost of illness approach
could theoretically be used to estimate some of the intangible drought costs, such as reduced
quality or loss of a recreational site in the former case, and costs of treating illness or lost
income due to illness caused by a drought in latter case, we have not found studies which have
actually applied these methods in the context of drought damage cost estimation. For this
reason, these two methods do not receive detailed attention in this report. Birol et al. (2008)
presents an overview of appropriate economic valuation methods for different components of the
total economic value of water resources (many of which are relevant to droughts).
Table 2. Available assessment methods according to the types of costs and values
Market valuation techniques
(Mainly tangible/market costs,
both direct and indirect)
System approaches (Mainly indirect
tangible/market costs)
Non-market valuation techniques (Mainly intangible/non-market costs, both
direct and indirect)
(Mainly use values) (Use and non-use values)
Revealed preference / surrogate markets
(Use values)
Stated preference (Use and non-use values)
Market prices Assessing effects on GDP and agricultural production
Hedonic pricing (including Ricardian modeling)
Contingent valuation method
Production function (also for nonuse values)
Input-output analysis Travel cost method Choice experiments
Avoided cost (also for nonuse values)
Computable general equilibrium analysis
Cost of illness approach
Life satisfaction analysis
Replacement and repair cost (also for nonuse values)
Biophysical-agroeconomic modeling
Coupled hydrological-economic modeling
Benefit or value transfer
3.1. Market valuation techniques Economists generally prefer to use direct, observable market interactions for placing a monetary
value on goods and services (NOAA, 2011). Various specific methods are consistent with this
market valuation approach. These include using the prices of goods and services which are
being traded in markets, a production function approach, assessing costs of avoided damages,
and determining replacement or repair costs of damages.
The market price method estimates the economic value of any product or service that is
bought and sold in commercial markets. It can be used to value changes in the quantity or
quality of a good or service. The estimation starts with assessing the quantity people purchase
at different prices and the quantity supplied at different prices. In the case of quality change, one
observes a change in market demand function for a good or service and a change in benefits or
losses of producers. This information is then used to estimate consumer and producer
surpluses. The sum of these represents the total net economic benefit of a good or service in a

CONHAZ REPORT WP05_1 16
market. For example, the direct costs of a drought in agriculture can be assessed by observing
the quantity of crops lost due to a drought and their prices (or a shift in demand because of
deteriorated quality). Based on this information, one can estimate consumer and producer
surpluses before and after the event. The difference represents the crop production costs due to
drought.
A production function approach estimates a function that specifies the output of a company,
an industry or the whole economy based on the combination of inputs, i.e. the factors of
production. It takes the form Q = f(L,K,E), where L denotes labour, K capital and E an
environmental indicator. As factors of production, raw materials and environmental inputs are
used in the production of other goods. Assuming that we know the algebraic form of the
production function and the parameter values, we can introduce a change of the environmental
input (e.g. a deterioration of water quality) and estimate its effect on the output in monetary
terms (e.g. a decline in the production of a fishing industry or higher costs of its production).
However, to obtain a monetary value it is not sufficient to simply multiply a change in the output
by unit price, but one should also take into account damage costs and the elasticity of the
demand function so as to arrive to a correct estimate (this is also known as a dose-response
valuation technique). An important limitation of this approach is that production functions are
often not known as precisely as needed for applying this technique and it is limited to those
resources that are used in the production of goods and services sold in markets.
The avoided cost approach is a closely related technique (can in fact be seen as a special
case of a production function approach). Here the production function has the form Q =
f(L,K,E,A), where A stands for some ‘averting’ input. In the case of a reduced environmental
quality (e.g. air quality), expenditures can be made to mitigate these negative effects (i.e. by
implementing air filters, or irrigating rain-fed agricultural land which is being subject to a
drought). The value of the reduced air quality or less water available to agriculture due to a
drought can then be valued in terms of expenditure on compensating air filters or irrigation (A).
A replacement or repair cost approach assumes that the costs of replacing or repairing an
ecosystem good or service represents a reasonable estimate of its value. Nevertheless, it is best
seen as a lower bound to the real value of the good or service, certainly in the case of
replacement. An example is assessing the cost of soil erosion due to a drought by estimating the
costs of physically recovering and replacing lost soil, nutrients and water.
Studies that have used market valuation techniques (by estimating consumer surplus) for
assessing losses caused by rationing policies during drought include Woo (1994), Garcia-
Valiñas (2006) and Grafton and Ward (2008).
Example:
Grafton, R.Q., Ward, M.B. (2008). Prices versus rationing: Marshallian surplus and mandatory water
restrictions. The Economic Record, 84: S57-S65.
• Explanation: The study estimates an aggregate per capita water demand for Sydney for the period
1994-2005. The estimated demand function is used to calculate the difference in Marshallian
(consumer) surplus between using the metered price of household water versus mandatory water
restrictions to regulate total water consumption for the drought period 2004/2005. The total cost is
estimated at AUD $235 million for a 12-month period, which equates to AUD $55 per person or AUD
$150 per household.

CONHAZ REPORT WP05_1 17
• Cost types addressed: Direct non-market costs (social welfare losses due to mandatory water
restrictions).
• Objective of the approach: The results of the study provide insight into welfare losses caused by
implementing a drought adaptation policy (mandatory water restriction) instead of a policy that raises
the price of water charged to households that would ensure achieving the same level of consumption
as with restriction.
• Impacted sectors: Households.
• Countries of application: Sydney, Australia.
• Scale: Local (city) level; Time scale: short-term (1 June 2004 – 1 June 2005).
• Effort and resources required: Medium.
• Expected precision: Good. Precision depends largely on the parameters included in the analysis, the
type of model applied, and the quality of the (gu)estimate of choke and market-clearing prices. If the
approach is applied correctly, the estimate precision is expected to be quite good.
• Parameters used for determining costs: Estimated water demand for banned water uses is based on
real volumetric water prices, daily maximum water temperatures (current and lagged), daily rainfall
data (current and lagged), water restriction dummy variable; choke price (a price at which banned
water use becomes zero); and market-clearing price (a price that would ensure the same total
consumption as restrictions).
• Results: Cost (welfare loss) due to the introduction of mandatory water restrictions, benefit (welfare
increase) due to hypothetical reallocation of water uses through lifting restrictions and increasing the
water price, and net cost (the difference of the previous two), all in monetary values.
• Result precision: One figure for the total welfare loss.
• Is the method able to deal with the dynamics of risk? Yes.
• Skills required: Econometric modeling (regression analysis).
• Types of data needed: Water consumption, water prices, water temperature, rainfall data, all before
and after restrictions.
• Data sources: Water-providing companies; the meteorological office; the statistics office; researcher’s
own estimates; previous scientific research.
• Who collects the data: Water-providing companies; the meteorological office; the statistics office;
scientists.
• How is the data collected: Measurements (temperature, rainfall, water consumption); previous
scientific studies; researcher’s own estimates.
• Is data derived ex ante or ex post: Ex post (empirical historical observations).
• Data quality: The meteorological data, water consumption and water prices are usually standardized.
Estimation of the price elasticity of water demand is more problematic.
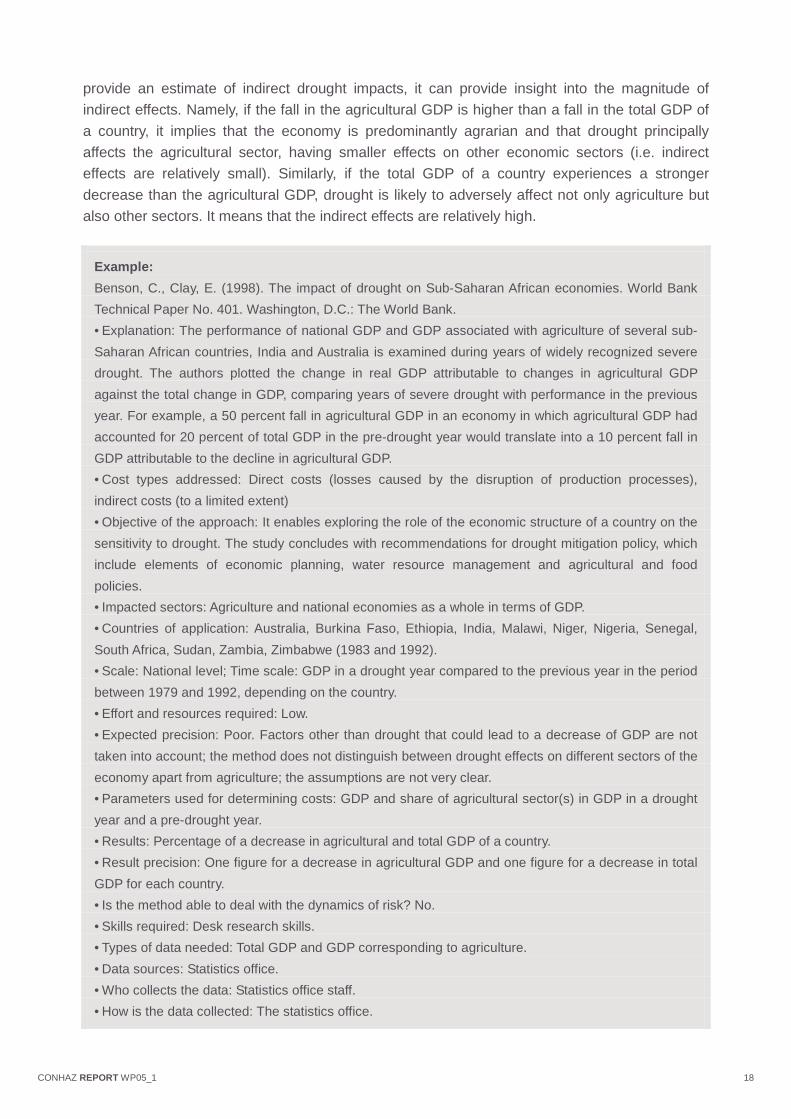
3.2. Assessing effects on GDP and agricultural production This approach explores the relationship between a drought and the economic performance of a
country. It compares a change in real GDP (Gross Domestic Product) of the agricultural sector
and a change in the total GDP of a country, for a year in which a severe drought occurred with a
year prior to drought. It has been used by the World Bank to study the role of the economic
structure of a country on the sensitivity to drought in order to enable incorporating drought
shocks into economic and development planning and to suggest structural adjustments
programs to reduce drought vulnerability. Even though it is not clear the method will generally
CONHAZ REPORT WP05_1 18
provide an estimate of indirect drought impacts, it can provide insight into the magnitude of
indirect effects. Namely, if the fall in the agricultural GDP is higher than a fall in the total GDP of
a country, it implies that the economy is predominantly agrarian and that drought principally
affects the agricultural sector, having smaller effects on other economic sectors (i.e. indirect
effects are relatively small). Similarly, if the total GDP of a country experiences a stronger
decrease than the agricultural GDP, drought is likely to adversely affect not only agriculture but
also other sectors. It means that the indirect effects are relatively high.
Example:
Benson, C., Clay, E. (1998). The impact of drought on Sub-Saharan African economies. World Bank
Technical Paper No. 401. Washington, D.C.: The World Bank.
• Explanation: The performance of national GDP and GDP associated with agriculture of several sub-
Saharan African countries, India and Australia is examined during years of widely recognized severe
drought. The authors plotted the change in real GDP attributable to changes in agricultural GDP
against the total change in GDP, comparing years of severe drought with performance in the previous
year. For example, a 50 percent fall in agricultural GDP in an economy in which agricultural GDP had
accounted for 20 percent of total GDP in the pre-drought year would translate into a 10 percent fall in
GDP attributable to the decline in agricultural GDP.
• Cost types addressed: Direct costs (losses caused by the disruption of production processes),
indirect costs (to a limited extent)
• Objective of the approach: It enables exploring the role of the economic structure of a country on the
sensitivity to drought. The study concludes with recommendations for drought mitigation policy, which
include elements of economic planning, water resource management and agricultural and food
policies.
• Impacted sectors: Agriculture and national economies as a whole in terms of GDP.
• Countries of application: Australia, Burkina Faso, Ethiopia, India, Malawi, Niger, Nigeria, Senegal,
South Africa, Sudan, Zambia, Zimbabwe (1983 and 1992).
• Scale: National level; Time scale: GDP in a drought year compared to the previous year in the period
between 1979 and 1992, depending on the country.
• Effort and resources required: Low.
• Expected precision: Poor. Factors other than drought that could lead to a decrease of GDP are not
taken into account; the method does not distinguish between drought effects on different sectors of the
economy apart from agriculture; the assumptions are not very clear.
• Parameters used for determining costs: GDP and share of agricultural sector(s) in GDP in a drought
year and a pre-drought year.
• Results: Percentage of a decrease in agricultural and total GDP of a country.
• Result precision: One figure for a decrease in agricultural GDP and one figure for a decrease in total
GDP for each country.
• Is the method able to deal with the dynamics of risk? No.
• Skills required: Desk research skills.
• Types of data needed: Total GDP and GDP corresponding to agriculture.
• Data sources: Statistics office.
• Who collects the data: Statistics office staff.
• How is the data collected: The statistics office.

CONHAZ REPORT WP05_1 19
• Is data derived ex ante or ex post: Ex post (empirical historical observations).
• Data quality: The book System of National Accounts (1993), which was prepared by representatives
of the International Monetary Fund, European Union, Organization for Economic Co-operation and
Development, United Nations and World Bank provides an international set of rules and procedures
for the measurement of national accounts, including GDP.
3.3. Input-output analysis The basic input-output model is generally constructed from observed economic data for a
specific country or region (Miller and Blair, 2009). It describes the flows of products from each
industry to each industry, final demand (such as production for personal consumption, sales to
the government, and export), and value added. The latter comprises expenditures to labor and
capital, taxes, and imports for a particular period of time (usually a year). Based on this
information, it is possible to analyze the effects of a change in a price or output of one or several
economic sector(s), a change in the final demand, or a change in one of the value added
elements on the rest of the economy. In the context of droughts, this approach is particularly
useful for assessing the indirect costs of droughts, i.e. the spillover effect of the losses in
agriculture and water-providing sector on the quantities produced by the rest of the economic
sectors, and their employment. Input-output analysis can be seen as a substitute approach for
the computable general equilibrium analysis, discussed in Section 3.4. The advantage of the
input-output model is that it is easier to apply and can include a very disaggregate sector
structure, but it also implies more restrictive assumptions regarding substitution mechanisms
and technology, and lacks price mechanisms. The studies that have assessed indirect costs of
droughts by using input-output analysis involve Martin-Ortega and Markandya (2009) and Pérez
y Pérez and Barreiro-Hurlé (2009). Input-output analysis has also seen some application in
effect studies of different water policies. For instance, Llop (2008) used the method for
evaluating the impact of alternative water policy scenarios on production and consumption
prices, intermediate water consumption and private real income. Analyzed policies include the
introduction of a tax on water used by sectors, improvement in the technical efficiency of water
use, and a combination of the two measures. Velázquez (2006) applied the input-output model
to determine which economic sectors in Andalusia consume the greatest quantities of water. The
model also allows simulation of effects of different policies on water consumption and distribution
among sectors.
Example:
Pérez y Pérez, L., Barreiro-Hurlé, J. (2009). Assessing the socio-economic impacts of drought in the
Ebro River Basin. Spanish Journal of Agricultural Research, 7: 269-280.

CONHAZ REPORT WP05_1 20
• Explanation: The study estimates direct and indirect economic impacts of the drought in the Ebro
River Basin that occurred in 2005. It uses regional input-output tables of four regions in Spain that
comprise the Ebro River Basin. First, direct impacts are assessed for the two main sectors affected by
the drought, agriculture and energy production, in terms of their contribution to the gross added value
(GAV). These effects are then introduced into the Ghosh’s supply-driven input-output model in order to
estimate indirect impacts on the overall economy. The study found that drought induced the loss of
direct gross added value of 482 million € in the two sectors and additional 377 million € of the indirect
loss of production. The drought also caused a loss of 11.275 jobs.
• Cost types addressed: Direct costs (losses caused by the disruption of production processes),
indirect costs (secondary-effects in all economic sectors and employment).
• Objective of this approach: The input-output analysis allows estimating economy-wide impacts in
terms of production and employment loss of either historical or hypothetical drought, based on the
economic structure of a region or a country.
• Impacted sectors: Sectors with production loss of over 15 million €: agrofood industry; agriculture,
forestry and fishing; catering business; energy sector, distribution of energy, gas and water; motor
vehicle sales and repair; and chemistry industries.
• Scale: Ebro River Basin region, Spain; the analysis embraces four regions (Navarra, La Rioja,
Aragón and Cataluña); Time scale: short-term effects (only for the year 2005).
• Effort and resources required: Medium (data is easily available and modeling is not too complex).
• Expected precision: Good, although depends on the level of disaggregation of both sectors and
regions.
• Parameters used for determining costs: Contribution of directly impacted economic sectors on gross
added value (GAV) for the studied region (reduced by the potion of intermediate consumption in the
decline of production due to drought); input-output tables.
• Results and result precision: Direct effects on GAV for the selected (most impacted) economic
sectors and indirect effects on production of all sectors of the economy in monetary values, the
number of jobs lost in all sectors.
• Is the method able to deal with the dynamics of risk? Yes.
• Skills required: Good skills in economic modeling.
• Types of data needed: National or regional input-output tables, and additional data sometimes (e.g.
accounts for agricultural production).
• Data sources: The statistics office, although regional input-output tables are sometimes unavailable,
so a researcher can try to estimate his/her own database using national input-output table and certain
regional data, such as the distribution of industry outputs and of final demand aggregates between
regions.
• Who collects the data: The statistics office staff.
• How is the data collected: The statistics office (for the EU countries).
• Is data derived ex ante or ex post: The approach allows deriving data both ex ante and ex post.
• Data quality: The System of National Accounts (1993) provides rules and procedures for the
measurement and data collection for the input-output tables. In the EU the elaboration of the input-
output tables is also established in the European Parliament and Council Regulation (EC) No.
1392/2007 which modifies the previous Regulation No. 2223/96.

CONHAZ REPORT WP05_1 21
3.4. Computable general equilibrium analysis A computable general equilibrium (CGE) model represent one of the most sophisticated types of
economic model, which is applied with the aim of examining the economy-wide impacts of a
change in a policy (e.g. a tax reform, a change in trade, energy or agricultural policies),
technology, exports, or other exogenous factors. CGE models are based on the core
assumptions of optimizing behavior of consumers and producers and market clearing. In
particular, consumers are assumed to maximize their utility or satisfaction, and producers to
maximize profits (or minimize costs). Moreover, product and factor markets are assumed to be
competitive and relative prices flexible and reflective of relative (demand-supply) scarcity. These
attempt to represent the circular flow of goods and services and money in the economy,
enabling an analysis of factors and mechanisms that determine relative prices as well as
resource allocation and income distribution issues in market economies. CGE models use
benchmark data on price elasticity, products and inputs substitution elasticity, household income
elasticity, and sometimes also input-output relationships between industries (intermediate
deliveries). In this way, they explore interactions between a large number of economic agents.
This method can simulate the effects of a drought on the outputs and employment in different
sectors of the economy at the regional or national level. The advantage of a CGE approach in
comparison with other approaches is that it incorporates economy-wide feedbacks (including
interaction between markets, income formation and spending effects, and input and output
substitution) in examining different impacts on various sectors, and thus allows for an
assessment of total effects. Studies that applied CGE models with the aim of estimating drought
costs include Islam (2003), Horridge et al. (2005), Berritella et al. (2007), Boyd and Ibarrarán
(2009), Pauw et al. (2010), and Wittwer and Griffith (2010). Salami et al. (2009) apply a slightly
different systems approach (integrated linear programming and macroeconometric modeling),
which obtained results very similar to those derived from the CGE models. Namely, they
estimated a change in the value added of all economic sectors in Iran due to drought and its
effects on investment, GDP, trade flows and inflation.
Example:
Horridge, M., Madden, J., Wittwer, G. (2005). The impact of the 2002-2003 drought on Australia.
Journal of Policy Modeling, 27: 285-308.
• Explanation: The study uses a “bottom-up” CGE model called TERM (The Enormous Regional
Model) for simulating the regional impacts of the Australian drought in 2002-2003. The database for
the model incorporates a national input-output table together with regional data on output (for
agriculture) and employment (in other sectors). The results show a decrease in outputs for 38 sectors
in 45 regions, a reduction of the real GDP due to agriculture sectors (1%) and due to the rest of the
economy (0.6%), and the effects on employment, real household consumption, real investment, real
Gross Regional Product, and the real wage rate in different regions of a country.
• Cost types addressed: Direct costs (losses caused by the disruption of production processes),
indirect costs.
• Objective of this approach: The method provides a sophisticated modeling framework in which
welfare effects can be estimated. It can serve as a useful tool for policy making and planning by
assessing drought vulnerability of various economic sectors and geographical regions.

CONHAZ REPORT WP05_1 22
• Impacted sectors: Various agricultural and livestock sectors (sheep, barley, wheat, other broadacre,
beef cattle, dairy cattle, rice, cotton, fruit and nuts, grapes, multi-grape, sugar cane, pasture irrigation,
vegetables, etc.), trade, transport, and construction industry.
• Scale: Australia; analysis at the regional level (45 regions); Time scale: short-term effects (one year,
2002-2003).
• Effort and resources required: High effort due to data collection and modeling skills required; medium
resource requirements in financial terms.
• Expected precision: Good, although depending primarily on the level of sectoral and regional
disaggregation.
• Parameters used for determining costs: Input-output tables (delivered value of demand for each good
in each destination region for each user – industries, households, investment, government, and
exports), trade flows, values of margin for each good, revenue and production taxes, values of input
factors, changes in stocks, price elasticities of demand for different commodities (own-price
elasticities), and elasticities of substitution between different commodities and between input factors
(cross-price elasticities).
• Results and result precision: Percentage of a change in output of each industry in each region in a
drought year compared to a pre-drought year, percentage of a change the real in GDP and other
macroeconomic indicators in each region (real consumption, real investment, export and import
volumes, export prices, employment, and the average wage rate).
• Is the method able to deal with the dynamics of risk? Yes.
• Skills required: Good skills in economic modeling and programming.
• Types of data needed: National or regional input-output tables, trade matrices, matrix of the value of
margin good required to facilitate trade flows, tax matrix of commodity tax revenues, the value of input
factors (wages, capital rentals, land rentals), production tax, stock changes of domestic output and of
imports.
• Data sources: The statistics office; researcher’s estimates; estimates from the literature.
• Who collects the data: The statistics office staff; scientists.
• How is the data collected: The statistics office, other administrative institutions, previous scientific
studies.
• Is data derived ex ante or ex post: The approach is able to derive data both ex ante and ex post.
• Data quality: As mentioned in Section 3.3, there is an established procedure for elaborating input-
output tables. A number of parameters of CGE models are calibrated to benchmark data from input-
output tables in a certain year. Besides this, to calibrate free parameters to benchmark data, CGE
models include estimates of all sorts of elasticities that are simply borrowed from other studies.
3.5. Biophysical-agroeconomic modeling Biophysical-agroeconomic models integrate crop biophysical models with agro-economic
models, providing a comprehensive insight on the feedback effects between human activities
and natural resources. In biophysical-agroeconomic models crop physiology models are forced
with climate scenarios (temperature-precipitation inputs) from hypothetical or historical droughts.
They provide biophysical estimates (yield, water and nutrient use) of crop responses to climate
events. This approach hence serves to predict how drought conditions affect crop yields and
water use. Often, spatially explicit models are used. These can be applied to different
geographical scales, depending on the (dis)aggregation level of the data used. The simulated

CONHAZ REPORT WP05_1 23
yield estimates are then incorporated into socio-economic models, usually first for predicting
farm-level decisions, which are then aggregated to market levels to predict changes in supply,
prices, and consequently also economic welfare. It is also referred to as a “bottom-up” approach
because it starts at the finest level of interactions of climate and biophysical or hydrological
processes and then aggregates up to larger-scale socio-economic processes. Applications of
this method can be found in Kulshreshtha and Klein (1989), Rosenberg (1993), Holden and
Shiferaw (2004), and Fischer et al. (2005).
Example:
Holden, S., Shiferaw, B. (2004). Land degradation, drought and food security in a less-favored area in
the Ethiopian highlands: a bio-economic model with market imperfections. Agricultural Economics, 30:
31-49.
• Explanation: The biophysical-agroeconomic model in this study analyzes the combined effects of
land degradation, population growth, market imperfections and increased risk of drought on household
production, income, welfare, and food security. It estimates direct production effects of drought and
indirect effects on household welfare due to price changes for crops and livestock.
• Cost types addressed: Direct costs (losses caused by the disruption of production processes),
indirect costs.
• Objective of the approach: The approach uses biophysical models for crop growth simulation and
introduces meteorological and landscape data in order to estimate crop yields. These results are then
aggregated for larger areas and used in economic models dealing with both farmer income
optimization and agricultural market equilibrium. The approach can therefore have an important role in
decision making for both farmers and policy makers. For example, Holden and Shiferaw (2004)
consider the effects of provision and adoption of credit for fertilizer on grain production, household
welfare and food security, which can serve as an input for designing future credit policies.
• Impacted sectors: Agriculture sector (including livestock).
• Scale: Ethiopia; the analysis includes a local case study in Anit Tid at the household level; Time
scale: mid-term (predictions for a 5-year period).
• Effort and resources required: High (detailed biophysical and socio-economic data needed on the
plot and household levels, respectively; measurements, observations, experiments and surveys
required).
• Expected precision (validity): Good. The detailed disaggregation level makes its estimates precise,
but on the other hand modeling interactions between crop physiology, climate conditions and
economic factors is too complex to be very precise.
• Parameters used for determining costs: For determining crop yield: soil erosion (soil type, soil depth
and slope, rainfall, crop choice), nutrient depletion (nitrogen and phosphorus), and use of conservation
technology. For determining livestock production: productivity of the livestock, birth rates, mortality,
feed requirements, milk production, ploughing capacity, manure production, culling rates, labor and
other input costs. Parameters for market characteristics: credit demand, labor (wage rate and time
worked), land rental, oxen rental, fodder, seed and output prices.
• Results and result precision:
– Predicted changes in cropped areas for three different household groups, 6 different crop types, with
and without credit constraints for each year over a 5-year period.

CONHAZ REPORT WP05_1 24
– Yield estimates of barley in two different seasons, on four different land classes, with and without
conservation technologies and with and without fertilizer or manure for each year over a 5-year period.
– Household utility, income per capita, crop sale, drought risk premium, total labor on farm (man days),
formal credit demand, all for both 10% and 20% risk of drought, for constrained and unconstrained
access to credit for fertilizer, and for each year over a 5-year period.
• Is the method able to deal with the dynamics of risk? Yes, to some extent. The method is able to take
into account the probability of drought as well as a wide range of biophysical, climatic and socio-
economic factors determining the severity of a drought.
• Skills required: Both natural and social science skills required (good understanding of the biophysical,
climatic and economic systems necessary for modeling feedback effects between human activity and
natural resources).
• Types of data needed: Biophysical data (soil physical and chemical data, erosion data for different
crops, crop yield data on different soils, climatic data) and socio-economic data.
• Data sources: Previous scientific research (if available), FAO, the meteorological office, the statistics
office.
• Who collects the data: Scientists, FAO, the meteorological office, the statistics office.
• How is the data collected: Biophysical data in the field through measurements, observations and
experiments (managed by both researchers and farmers) over a certain period of time or from
previous scientific studies and projects; socio-economic data from surveys.
• Is data derived ex ante or ex post: Data can be derived both ex ante and ex post in this approach.
• Data quality: Not standardized/assured to our knowledge.
3.6. Coupled hydrological-economic modeling A coupled hydrologic–economic model consists of a hydrological model and an economic
optimization model. It allows an analysis of the impacts of water allocation and use by different
sectors under alternative policy scenarios. The model usually has three components: (1)
economic factors, including the cost of water and the profits generated by its use, (2)
hydrological factors, and (3) institutional factors that affect hydrologic and economic
components. For the same reasons mentioned in Section 3.5, hydrological-economic models
often have an explicit spatial structure. Hydrological-economic models serve as a particularly
useful decision-support tool for local, regional, or national authorities and agricultural
stakeholders. They are considered “bottom-up” approaches for the same reasons as
biophysical-agroeconomic models. Examples of studies that applied such models for assessing
drought costs are Booker (1995), Booker et al. (2005), and Ward et al. (2006).
Example:
Booker, J.F. (1995). Hydrologic and economic impacts of drought under alternative policy responses.
Water Resources Bulletin, 31: 889-906.
• Explanation: An integrated hydrological-economic-institutional model for Colorado River basin has
been developed in order to 1) estimate the economic damages of a hypothetical drought on
consumptive and non-consumptive users of basin water resources under the existing rules and policy,
and to 2) investigate potential benefits of eight alternative policy responses to drought.
• Cost types addressed: Direct costs, indirect costs, intangible costs.

CONHAZ REPORT WP05_1 25
• Objective of the approach: To estimate economic impacts of alternative water allocations, taking into
account a set of institutional choices. Therefore, the approach is developed for assessing the
economic impacts of policy responses to droughts. It provides important insights and policy
recommendations for decision makers.
• Impacted sectors: Consumptive (agricultural and municipal) water use, hydropower production,
recreation (flatwater boating, rafting, and fishing), damages of increased salinity levels in drinking and
irrigation water.
• Scale: Colorado River Basin, USA; the study used requests for consumptive use for 32 basin
locations, drought inflows to 14 locations and historic salt levels at 20 locations in the model; Time
scale: long-term (simulation of a 38-year drought sequence), divided into 4 periods: baseline (years 1
to 9), early drought (years 10 to 16), critical drought (years 17 to 22), and recovery (years 23 to 38).
• Parameters used for determining costs: Annual water allocation, annual economic benefits of
different water uses, average annual flow (based on reservoir water and salt levels, reservoir storage
capacity, annual evaporation, salt inflows), average hydropower heads.
• Results and result precision: Percentage of changes in water available for consumptive uses, for
hydropower production, losses from recreation water use, and from increased salinity concentrations
is provided for four stages of a simulated 35-year drought. More rough results (either in terms of
change in average annual flow or only qualitative analysis) are presented for eight alternative policy
responses to drought.
• Effort and resources required: High (collecting and modeling detailed hydrological data with
economic data under different water management policies).
• Expected precision (validity): Good. The hydrological model most likely simulates hydrological
impacts of drought rather precisely. Translating a percentage decrease in annual flow at different
locations in the basin to a percentage loss of annual benefits under typical river conditions should
provide good rough estimates of the damages, although they might not take into account the marginal
values of water availability.
• Is the method able to deal with the dynamics of risk? Yes, to some extent. The approach is able to
estimate the effects of hypothetical droughts under various hydrological and policy settings.
• Skills required: Excellent knowledge of hydrology and hydrology modeling skills.
• Types of data needed: Hydrologic data (e.g. reservoir water and salt levels, reservoir storage
capacity, annual evaporation, average hydropower heads, water and salt inflows, water demand and
water use); economic data (benefits derived from different water uses).
• Data sources: Previous scientific research (e.g. simulation models), water providing companies,
water resource management/commission, the statistics office.
• Who collects the data: Scientists, experts in hydrology, water providing companies.
• How is the data collected: In the field, simulation modeling based on historical observations and
predictions.
• Is data derived ex ante or ex post: Ex ante (simulation models).
• Data quality: Not standardized/assured to our knowledge.
3.7. Ricardian hedonic price modeling Unlike the bottom-up approaches, the Ricardian hedonic price analysis represents a top-down
approach as it directly measures the effect of climate on economic welfare. Building on the
Ricardian model of land value, this approach links variations in land values across space with
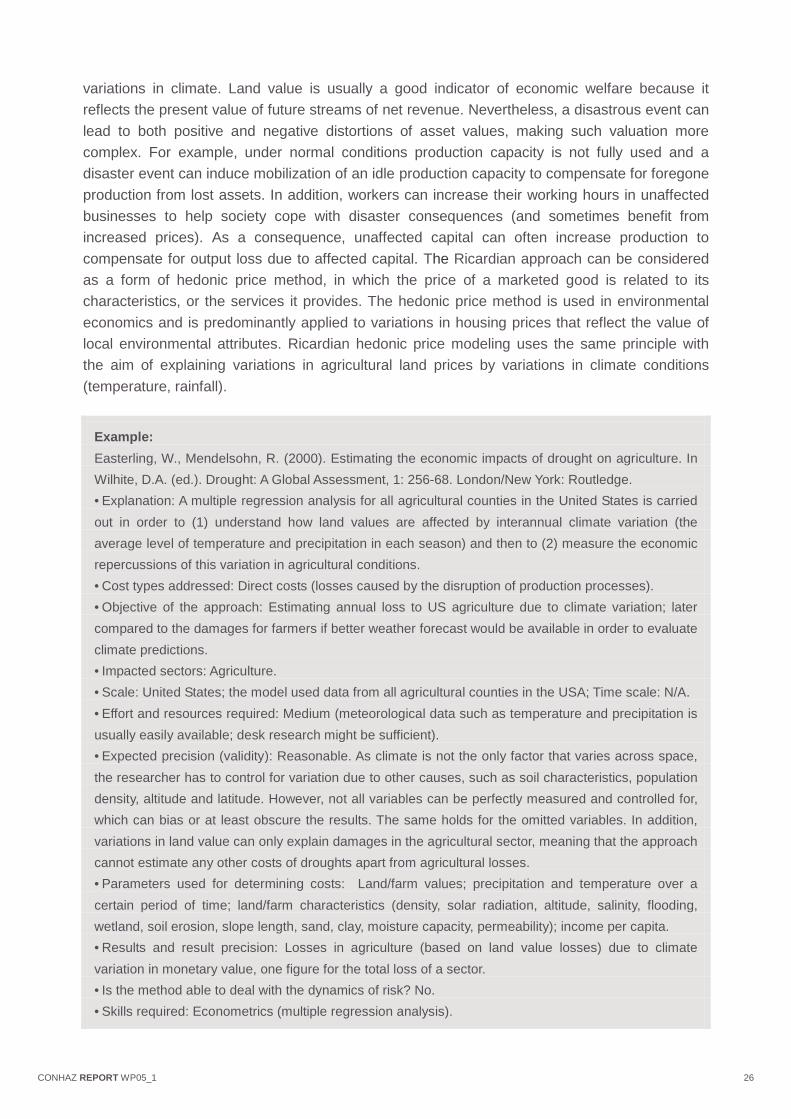
CONHAZ REPORT WP05_1 26
variations in climate. Land value is usually a good indicator of economic welfare because it
reflects the present value of future streams of net revenue. Nevertheless, a disastrous event can
lead to both positive and negative distortions of asset values, making such valuation more
complex. For example, under normal conditions production capacity is not fully used and a
disaster event can induce mobilization of an idle production capacity to compensate for foregone
production from lost assets. In addition, workers can increase their working hours in unaffected
businesses to help society cope with disaster consequences (and sometimes benefit from
increased prices). As a consequence, unaffected capital can often increase production to
compensate for output loss due to affected capital. The Ricardian approach can be considered
as a form of hedonic price method, in which the price of a marketed good is related to its
characteristics, or the services it provides. The hedonic price method is used in environmental
economics and is predominantly applied to variations in housing prices that reflect the value of
local environmental attributes. Ricardian hedonic price modeling uses the same principle with
the aim of explaining variations in agricultural land prices by variations in climate conditions
(temperature, rainfall).
Example:
Easterling, W., Mendelsohn, R. (2000). Estimating the economic impacts of drought on agriculture. In
Wilhite, D.A. (ed.). Drought: A Global Assessment, 1: 256-68. London/New York: Routledge.
• Explanation: A multiple regression analysis for all agricultural counties in the United States is carried
out in order to (1) understand how land values are affected by interannual climate variation (the
average level of temperature and precipitation in each season) and then to (2) measure the economic
repercussions of this variation in agricultural conditions.
• Cost types addressed: Direct costs (losses caused by the disruption of production processes).
• Objective of the approach: Estimating annual loss to US agriculture due to climate variation; later
compared to the damages for farmers if better weather forecast would be available in order to evaluate
climate predictions.
• Impacted sectors: Agriculture.
• Scale: United States; the model used data from all agricultural counties in the USA; Time scale: N/A.
• Effort and resources required: Medium (meteorological data such as temperature and precipitation is
usually easily available; desk research might be sufficient).
• Expected precision (validity): Reasonable. As climate is not the only factor that varies across space,
the researcher has to control for variation due to other causes, such as soil characteristics, population
density, altitude and latitude. However, not all variables can be perfectly measured and controlled for,
which can bias or at least obscure the results. The same holds for the omitted variables. In addition,
variations in land value can only explain damages in the agricultural sector, meaning that the approach
cannot estimate any other costs of droughts apart from agricultural losses.
• Parameters used for determining costs: Land/farm values; precipitation and temperature over a
certain period of time; land/farm characteristics (density, solar radiation, altitude, salinity, flooding,
wetland, soil erosion, slope length, sand, clay, moisture capacity, permeability); income per capita.
• Results and result precision: Losses in agriculture (based on land value losses) due to climate
variation in monetary value, one figure for the total loss of a sector.
• Is the method able to deal with the dynamics of risk? No.
• Skills required: Econometrics (multiple regression analysis).

CONHAZ REPORT WP05_1 27
• Types of data needed: Meteorological data (precipitation and temperature); land/farm values;
land/farm characteristics (e.g. density, solar radiation, altitude, salinity, flooding, wetland, soil erosion,
slope length, sand, clay, moisture capacity, permeability); economic data.
• Data sources: E.g. in the case of USA - National Climate Data Centre (meteorological data); US
Census of Agriculture, National Resource Inventory and US Department of Agriculture surveys (farm
characteristics); County and City Data Book (social, demographic, and economic data).
• Who collects the data: Experts of the field; administrative staff.
• How is the data collected: In the field; census; surveys.
• Is data derived ex ante or ex post: Ex post (based on the empirical historical data).
• Data quality: Apart from meteorological data, not standardized/assured to our knowledge.
3.8. Contingent valuation Contingent valuation is a widely used method for estimating economic values for all kinds of
ecosystem services and environmental goods which are not traded in the market and hence
have no market price. Hence, it can be applied for estimating intangible costs of drought.
Contingent valuation method is typically used to estimate the benefits (or costs) of a change in
the level of provision (or in the level of quality) of a public good. It is also referred to as a stated
preference method because it asks people in a survey to state how much they would be willing
to pay for a (change in) specific environmental service. It is further possible to ask people what is
the amount of compensation they would be willing to accept to give up an environmental service,
although the first approach is more recommendable. A contingent valuation survey should
include (1) a detailed description of a good being valued and the hypothetical change regarding
the good, (2) questions about willingness to pay for a good being valued, and (3) questions
about respondents’ characteristics (age, income, education) and preferably also their
preferences concerning the good. An advantage of contingent valuation (and other stated
preference techniques, like choice experiments; see Section 3.9) over revealed preference
techniques (like hedonic price, travel cost, Ricardian modeling methods and cost of illness
approach) is that it can address hypothetical changes in policy, that is, policy changes which are
considered but have not (yet) been implemented. The main disadvantage is that data generated
by contingent valuation (and other stated preference techniques) are hypothetical, and because
of this most economists tend to assign more credibility to revealed preference techniques which
use data about actual, past choices by individuals in markets. The contingent valuation method
has mainly been applied to estimate the value of avoiding water use restrictions or increasing
the security of water supply (Bakarat and Chamberlin, Inc., 1994; Howe et al., 1994; Griffin and
Mjelde, 2000; Koss and Khawaja, 2001). Pattanayak and Kramer (2001a) estimated the value of
drought mitigation provided by tropical forest watersheds. More generally, contingent valuation
can be used to assess the costs of drought damage, mitigation or adaptation. We provide an
example of mitigation below.
Example:
Pattanayak, S.K., Kramer, R.A. (2001a). Pricing ecological services: Willingness to pay for drought
mitigation from watershed protection in eastern Indonesia. Water Resources Research, 37: 771-78.

CONHAZ REPORT WP05_1 28
• Explanation: A survey conducted in eastern Indonesia (500 face-to-face interviews with local farmers)
to estimate the economic value of an ecosystem service of drought mitigation provided by tropical
forest watersheds in Ruteng Park protected area to local agrarian communities. The mean (median)
annual stated WTP through an annual fee is USD $2.79 ($1.64) per household, which aggregates to a
total annual value of USD $27.000.
• Cost types addressed: Intangible costs - loss of local farmers’ welfare (well-being) due to decreased
agricultural production.
• Objective of the approach: The survey is part of a larger project on the economic analysis of
protected areas. The study intends to provide signals to watershed managers and policy makers
regarding the economic magnitude and spatial distribution of the local economic value of watershed
protection.
• Impacted sectors: Agriculture (services provided by protected watershed primarily contribute as
inputs to agricultural production).
• Scale: Ruteng Park, Indonesia; survey on the household level; Time scale: N/A.
• Effort and resources required: High (design and administration of a survey).
• Expected precision: Reasonable. Applying the CV method to an ecological service in a developing
country setting includes a high risk of commodity and context misspecification despite a good practice
in survey design and administration. The authors themselves point out that because of the imprecision
in their economic data, indices of ecological attributes, and household opinions they do not
recommend using the estimates to predict precise values of drought mitigation services. However, in
other contexts the approach may provide rather reasonable estimates.
• Validity: The main problem in assessing the validity of the WTP estimates is the absence of actual
values against which to compare the results. However, validity of the WTP can be tested by comparing
the result with those from other valuation studies using other methods, the findings of cross-study
analyses (e.g. meta-analyses or benefits transfer exercises), or simulated markets. Such comparisons
often showed that CVM is likely to slightly overestimate the actual value due to its hypothetical nature.
Validity can also be evaluated by examining consistency of CVM estimates with theoretical
expectations derived from economic theory. For example, when the price of a good increases,
consumption of that good should fall. Moreover, a positive relationship between stated values and the
respondent’s disposable income is expected.
• Is the method able to deal with the dynamics of risk? Yes.
• Skills required: Empirical methods of social science - focus groups (optionally), questionnaire design
and econometric analysis, particularly regarding the WTP questions.
• Types of data needed: Stated willingness to pay about the good/service being valued; individual or
household characteristics (demographic and socio-economic data) and preferences, environmental
conditions.
• Data sources: Questionnaire; statistics/meteorological office (environmental conditions).
• Who collects the data: Scientists; the statistics/meteorological office (environmental conditions).
• How is the data collected: Survey; in the field (environmental conditions).
• Is data derived ex ante or ex post: Data is usually derived ex ante, based on a hypothetical scenario
regarding the good/service being valued, which is described in the questionnaire and followed by WTP
questions.

CONHAZ REPORT WP05_1 29
• Data quality: A guidance document published by NOAA – National Oceanic and Atmospheric
Administration (1993) “Report of the NOAA Panel on Contingent Valuation”, Federal Register, Vol. 58,
no. 10, US, 4601-4614 sets out recommendations concerning the design and implementation of the
CV survey as well as result analysis and reporting.
3.9. Choice experiments Choice experiments (CE) are, along with the contingent valuation method (CVM), important tools
for valuing non-market goods, i.e. intangible costs of drought. They are a newer approach and
offer several advantages over CVM. For example, respondents are more familiar – through
participating on an almost daily basis in market transactions – with making a choice for a good
that has a range of characteristics of which price is one, rather than stating a price they would be
willing to pay for that good. Moreover, CE enables estimating the value of the individual
attributes that make up an environmental good, and they avoid some of the biases associated
with CVM. In a choice experiment, individuals are given a hypothetical setting and asked to
choose their preferred alternative among several alternatives in a choice set, and they are
usually requested to perform a sequence of such choices. Each alternative is described by a
number of attributes or characteristics. A monetary value is included as one of the attributes,
which enables estimation of the willingness to pay. CE is, however, generally more difficult to
execute than CVM, especially if the number of attributes is large. Like contingent valuation, it
suffers from hypothetical bias and its precision depends mainly on the design of the experiment,
which involves the definition of attributes and their levels, the context of the experiment, and
questionnaire development. The choice sets selected for an experiment further have an
important impact on the results. In addition, the questions in a CE study are often conceptually
difficult to handle for respondents and require considerable cognitive efforts. As a result,
responses may be biased (McFadden et al., 2005). Despite its advantages over CVM, there
seems to be only one CE application related to drought cost estimation (Hensher et al., 2005
and Hensher et al., 2006). Like CVM, CE can be used to assess the costs of drought damage,
mitigation or adaptation. The example below is about adaptation costs.
Example:
Hensher, D., Shore, N., Train, K. (2006). Water supply security and willingness to pay to avoid drought
restrictions. The Economic Record, 82: 56-66.
• Explanation: Stated choice experiments were applied in Canberra, Australia in order to estimate
households’ and businesses’ willingness to pay (WTP) to avoid drought water restrictions. A total of
211 residential respondents and 205 business respondents completed the choice experiments.
Respondents seem to be unwilling to pay to avoid low-level restrictions that are not in place every day,
and all year. They are willing to adjust their watering schedules or tolerate high-level restrictions for
limited periods each year, compared with paying higher water bills. Household are on average willing
to pay AUD $239 to move from a situation with continuous restrictions on level 3 (medium restriction
measures) or above every day all year every year to a situation with virtually no risk of restrictions. An
average WTP of business customers for the same change in conditions equals AUD $1.104 and the
median is AUD $239.
• Cost types addressed: Intangible costs (social welfare loss due to restrictions on water supply).

CONHAZ REPORT WP05_1 30
• Objective of the approach: The study was commissioned by the region’s water service provider in
response to a request by the Independent Competition and Regulatory Commission for information on
customers’ valuation of service attributes in order to assess whether the existing service levels
provided by the water company were appropriate.
• Impacted sectors: Water supply service.
• Scale: Canberra, Australia; survey on the household level (residential respondents) and company
level (business respondents); Time scale: the method is able to estimate short, mid, and long-term
effects (long-term effects refer to a period of 20-30 years).
• Effort and resources required: High (focus groups and survey).
• Expected precision (validity): Good. Most of analyses of CE validity (although there are relatively few)
show results in favor of external validity of the choice experiments method.
• Is the method able to deal with the dynamics of risk? Yes. It is, for example, able to estimate the
approximate costs of water supply restrictions due to drought based on various simulated water
restriction levels and frequencies.
• Skills required: Social science skills (focus groups; questionnaire design, especially concerning
choice experiments; econometric analysis).
• Types of data needed: Water users’ preferences of service options with different attributes and
varying prices; demographic and socio-economic data.
• Data sources: Questionnaire involving choice experiments; the statistics office.
• Who collects the data: Scientists.
• How is the data collected: Survey.
• Is data derived ex ante or ex post: Ex ante (estimations are based on different hypothetical
combination of frequency, duration, and intensity of drought/water restrictions at varying prices).
• Data quality: Choice experiment is a standardized method. Survey and experimental design is
performed according to established practices and are crucial for assuring data quality. Furthermore,
the econometric analysis of choice data should follow well-established rules.
3.10. Life satisfaction analysis Life satisfaction (also referred to as happiness or subjective well-being) research is emerging as
an important approach within many disciplines, such as psychology, sociology, economics, and
medicine. Asking people to assess their current level of happiness has become a regular feature
of public surveys. These data can then be used jointly with data on per capita income, other
socio-economic indicators, and environmental conditions, for example, to examine how self-
reported well-being varies with prosperity, life stages, life styles and environmental quality.
Econometric modeling such as techniques of regression analysis are applied to analyze
subjective well-being data. So far there seems to be only one study that relates life satisfaction
data with rainfall data for Australia. Nevertheless, we do not see obstacles for a more
widespread use of this approach in estimating intangible costs of droughts.
Example:
Carroll, N., Frijters, P., Shields, M.A. (2009). Quantifying the costs of drought: new evidence from life
satisfaction data. Journal of Population Economics, 22: 445-61.
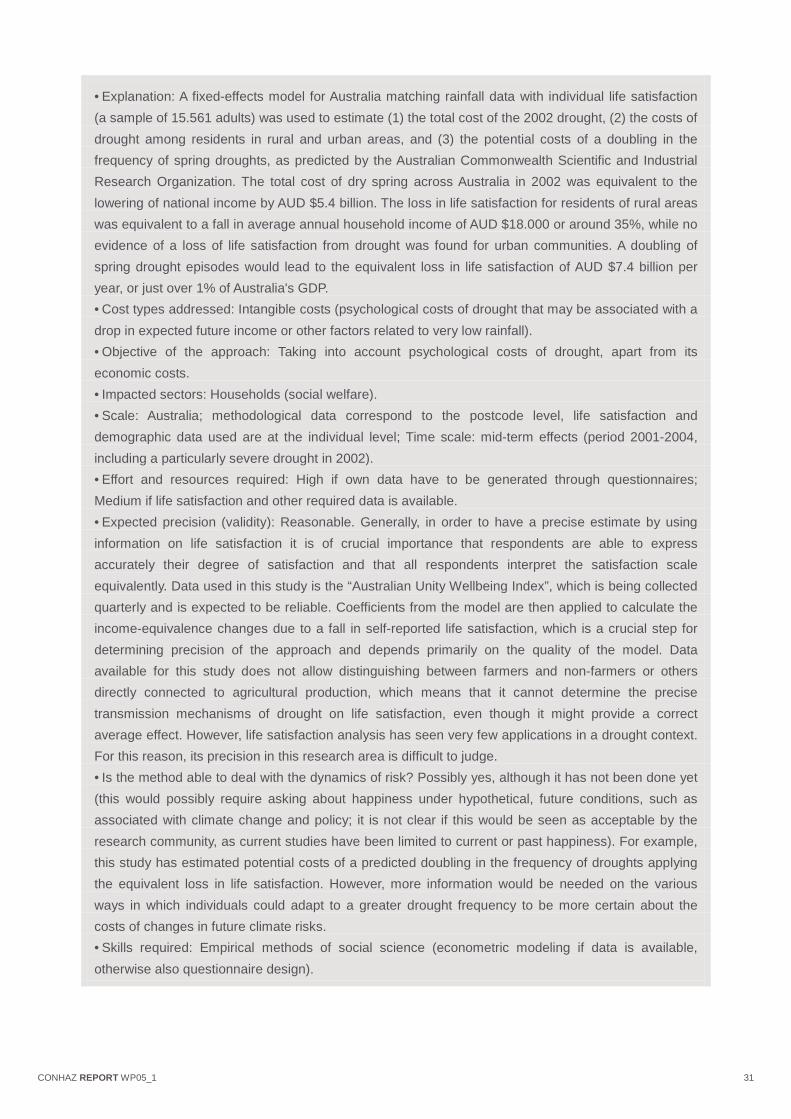
CONHAZ REPORT WP05_1 31
• Explanation: A fixed-effects model for Australia matching rainfall data with individual life satisfaction
(a sample of 15.561 adults) was used to estimate (1) the total cost of the 2002 drought, (2) the costs of
drought among residents in rural and urban areas, and (3) the potential costs of a doubling in the
frequency of spring droughts, as predicted by the Australian Commonwealth Scientific and Industrial
Research Organization. The total cost of dry spring across Australia in 2002 was equivalent to the
lowering of national income by AUD $5.4 billion. The loss in life satisfaction for residents of rural areas
was equivalent to a fall in average annual household income of AUD $18.000 or around 35%, while no
evidence of a loss of life satisfaction from drought was found for urban communities. A doubling of
spring drought episodes would lead to the equivalent loss in life satisfaction of AUD $7.4 billion per
year, or just over 1% of Australia's GDP.
• Cost types addressed: Intangible costs (psychological costs of drought that may be associated with a
drop in expected future income or other factors related to very low rainfall).
• Objective of the approach: Taking into account psychological costs of drought, apart from its
economic costs.
• Impacted sectors: Households (social welfare).
• Scale: Australia; methodological data correspond to the postcode level, life satisfaction and
demographic data used are at the individual level; Time scale: mid-term effects (period 2001-2004,
including a particularly severe drought in 2002).
• Effort and resources required: High if own data have to be generated through questionnaires;
Medium if life satisfaction and other required data is available.
• Expected precision (validity): Reasonable. Generally, in order to have a precise estimate by using
information on life satisfaction it is of crucial importance that respondents are able to express
accurately their degree of satisfaction and that all respondents interpret the satisfaction scale
equivalently. Data used in this study is the “Australian Unity Wellbeing Index”, which is being collected
quarterly and is expected to be reliable. Coefficients from the model are then applied to calculate the
income-equivalence changes due to a fall in self-reported life satisfaction, which is a crucial step for
determining precision of the approach and depends primarily on the quality of the model. Data
available for this study does not allow distinguishing between farmers and non-farmers or others
directly connected to agricultural production, which means that it cannot determine the precise
transmission mechanisms of drought on life satisfaction, even though it might provide a correct
average effect. However, life satisfaction analysis has seen very few applications in a drought context.
For this reason, its precision in this research area is difficult to judge.
• Is the method able to deal with the dynamics of risk? Possibly yes, although it has not been done yet
(this would possibly require asking about happiness under hypothetical, future conditions, such as
associated with climate change and policy; it is not clear if this would be seen as acceptable by the
research community, as current studies have been limited to current or past happiness). For example,
this study has estimated potential costs of a predicted doubling in the frequency of droughts applying
the equivalent loss in life satisfaction. However, more information would be needed on the various
ways in which individuals could adapt to a greater drought frequency to be more certain about the
costs of changes in future climate risks.
• Skills required: Empirical methods of social science (econometric modeling if data is available,
otherwise also questionnaire design).

CONHAZ REPORT WP05_1 32
• Reliability: Depends largely on the quality of the data used. The authors have conducted a series of
robustness checks using several different definitions of drought and found that the results are quite
robust.
• Types of data needed: Meteorological data (e.g. rainfall and temperature); individual life satisfaction
and demographic data.
• Data sources: The meteorological office; existing scientific research/surveys on life satisfaction,
wellbeing or quality of life.
• Who collects the data: The meteorological office; scientists.
• How is the data collected: Meteorological data in the field (at weather stations which are measuring
rainfall and temperature); life satisfaction and demographic data by (telephone) interviews.
• Is data derived ex ante or ex post: Ex post (empirical historical observations of both meteorological
and life satisfaction data).
• Data quality: Good; the meteorological data is likely to be standardized; the life satisfaction data is
based on a widely-used scale measure of well-being (Australian Unity Wellbeing Index).
3.11. Benefit or value transfer Conducting valuation methods require a survey, which can be costly and time-consuming.
Hence, the benefit transfer method was developed for situations in which the funds and/or time
available for data collection are constrained. With this method, monetary environmental values
estimated at one site (study site) are spatially and/or temporally transferred to another (policy)
site. The study site(s) refers to the place(s) where the original study/ies took place, while the
policy site is a new site where information is needed about the monetary value of similar
benefits. The transfer can be done by simply applying a benefit estimate obtained from a similar
study to the current case study (benefit estimate transfer), by inserting characteristics of the
current case study into the econometric model instead of the characteristics used in the original
study (benefit function transfer), and by constructing a dataset based on a larger number of
previous studies and regressing environmental benefit measures against study characteristics
(meta-analysis). The latter approach has the advantage that it can extend the number of
variables in the primary studies with moderator variables which differ in value between the
primary studies in the meta-analysis (but not within each primary study). Examples are
aggregate variables like GDP/capita, population size or surface area. These moderator variables
can then help to better predict for the policy site. Brouwer (2000) provides an overview of the
environmental value transfer approach, discusses its potential role in cost-benefit analysis as a
decision-support tool and develops guidelines for its proper application. He argues that this
method often results in substantial transfer errors, which could be diminished if one would follow
strict guidelines for quantitative adjustment mechanisms, especially taking into account
differences in the very nature of the values elicited (such as, the diversity of motivations
underpinning valuations or the historical-cultural and policy context in which they are elicited).
Example:
Martin-Ortega J. and A. Markandya (2009), “The costs of drought: the exceptional 2007-2008 case of
Barcelona”, BC3 Working Paper Series 2009:09.

CONHAZ REPORT WP05_1 33
• Explanation: This study is part of the 7th EU Framework Program Project XEROCHORE: An Exercise
to Assess Research Needs and Policy Choices in Areas of Drought, a support action to the European
Union aimed at contributing to the design of a road map towards a European Drought Policy by
identifying research gaps. The information on which this study is based comes from different available
sources and is analyzed and interpreted in the context of the socio-economic costs of drought in
Europe. Direct, indirect and intangible costs of the 2007-2008 droughts in Barcelona are being valued.
In this context, a benefit transfer approach has been applied, based on public’s willingness to pay for
the estimation of the environmental costs of the drought event, through a value transfer exercise. The
value estimates of the droughts’ environmental costs in this case were transferred from a choice
experiment that was applied by the AquaMoney project in the Serpis river basin (Jucar river basin
district) in Spain. The research came up with the aggregate estimates of environmental costs of the
drought in Barcelona of 127.89 - 207.61 million € per year and of costs due to restrictions of water
supply in households of 594.19 million € per year. This adds up to the total non-market costs due to
drought of 722.09 – 801.81 million € per year. Summing up direct, indirect, and non-market costs, the
total estimated cost of drought event in Catalonia was 1,661 billion € on a yearly basis.1
• Cost types addressed: Intangible costs (welfare losses due to the worsening of the environmental
quality and water supply restrictions for households).
• Objective of the approach: The aim of this study is to contribute to further research on the estimation
of the costs of drought (especially at the European level) that needs to be embedded into the
assessment of the costs of adaptation to climate changes.
• Impacted sectors: The non-market welfare losses occurred as a consequence of the drought,
including: a) those related to the decrease of the ecological status of the river basin due to the
lowering of water flows (reduction of the provisioning of ecosystem services) and b) those related to
the social welfare losses due to the restrictions of water supply in the households for secondary uses
(outdoor use, use of washing machines, etc.).
• Scale: Region of Catalonia in Spain; Time scale: 20 months, from April 2007 to January 2009.
• Effort and resources required: Medium as no surveys are needed, but high if done using meta-
analysis of primary studies (coding primary studies is difficult, requires experience and expert
judgment, and is very laborious).
• Expected precision (validity): Reasonable.
• Is the method able to deal with the dynamics of risk? Yes, to a limited extent. It primarily depends on
the range of primary study/ies. If cost-assessment of future risks using benefit transfer means that one
can remain in the range spanned by primary studies the results will be more reliable (a kind of
interpolation) than when one has to move outside this range (a kind of extrapolation).
• Skills required: Social science skills (familiarity with environmental valuation techniques).
• Types of data needed: Values of the same environmental good or service conducted by previous
studies in a similar context.
• Data sources: Previous studies using valuation techniques for the same environmental good or
service.
• Who collects the data: Scientists.
• How is the data collected: Reviewing the existing studies.
1 Note that the estimates correspond to a one-year period, although the drought lasted for 20 months. Hence, the total costs of
drought are actually much higher.

CONHAZ REPORT WP05_1 34
• Is data derived ex ante or ex post: Depends on the original valuation study from which the data is
taken.
• Data quality: Depends primarily on the quality of the original survey and its econometric analysis. If
the original study is conducted properly, data quality should be rather good.
Table 3 presents a comparative overview of some key characteristics of different methods
for assessing drought costs.

CONHAZ REPORT WP05_1 35
Table 3. Overview of the main characteristics of drought cost assessment methods
Characteristics Method
Type of method
Complementarity between methods
Type of drought cost addressed
Expected precision
Ability to incorporate future climate change risks
Is data derived ex ante or ex post?
Types of data needed Data sources Effort and resources required
1. Market prices, production function, avoided costs, replacement or repair costs
Market valuation techniques
Market valuation methods are often substitutes for one another
Direct and indirect
Good Yes Ex post Prices and quantities of goods and services sold and bought in markets; production function (output and parameters of production factors); avoided cost (difference between actual cost and potential cost without improvements); cost of replacing or repairing a good or service
Markets for a good or service; private companies; statistics office; government agencies; researcher’s estimates
Medium
2. Assessing effects on GDP and agricultural production
No clear category
Can use results of methods 5, 6 & 7 as inputs
Direct and indirect (very limited) costs
Poor Unclear Ex post Share of agriculture in GDP and fall in agricultural GDP due to drought
Statistics office Low
3. Input-output analysis
Systems approach
Substitute for method 4
Especially useful for indirect costs
Good (depending, among others, on sector disaggregation)
Yes Both Input-output tables Statistics office Medium
4. Computable general equilibrium analysis
Systems approach based on a market(s) model
Substitute for method 3. Can use results of methods 5, 6 & 7 as inputs
Especially useful for indirect costs
Good (depending, among others, on disaggregation level)
Yes Both Input-output tables, matrices of trade, taxes, input factors, stock changes, various elasticities, etc.
Statistics office; researcher’s estimates; estimates from the literature
High
5. Biophysical-agro-economic modeling
Integration of physical and economic models
Substitute for methods 6 & 7
Direct and (some) indirect costs
Good Yes Both Biophysical (soil, erosion, crop yield, climatic) and socio-economic data
Previous research; FAO; meteorological office; statistics office
High
6. Coupled hydrological-economic modeling
Integration of physical and economic models
Substitute for methods 5 & 7
Direct, (some) indirect and (some) intangible costs
Good Yes Ex ante Hydrologic and economic data
Previous research; water providing companies; water resource management; statistics office
High
7. Ricardian hedonic price modeling
Revealed preference method
Substitute for methods 5 & 6
Direct costs Reasonable No Ex post Meteorological data, land/farm values and characteristics. economic data
Meteorological office; census or survey; statistics office
Medium
8. Contingent valuation
Stated preference method
Substitute for methods 9 & 10
Intangible costs
Reasonable Yes Ex ante Stated willingness to pay, demographic and socio-economic data, preferences, environmental conditions
Questionnaire; statistics office; meteorological office
High

CONHAZ REPORT WP05_1 36
9. Choice experiments
Stated preference method
Substitute for methods 8 & 10
Intangible costs
Good (although difficult to execute well)
Yes Ex ante Goods/services with different attributes and prices, demographic and socio-economic data
Questionnaire; statistics office
High
10. Life satisfaction analysis
A sort of stated preference method (eliciting subjective well-being)
Substitute for methods 8 & 9
Intangible costs
Reasonable (little experience so far and therefore also difficult to judge)
Possibly yes, but hypothetical situations not addressed yet with this method
Ex post Meteorological data, individual life satisfaction and demographic data
Meteorological office; surveys on life satisfaction, wellbeing or quality of life
High if data have to be generated through questionnaires; Medium if data already exists
11. Benefit or value transfer
An aggregation or transfer of previous primary studies
Substitute for stated or revealed preference methods 7, 8 & 9, and possibly also 10
Intangible costs
Reasonable (depends partly on availability of good similar previous studies)
Yes, to a limited extent (depending on the range of primary studies)
Depends on the original study
Values of a similar environmental good or service obtained by previous studies in a similar context
Previous studies using valuation techniques for the same environmental good or service
Medium (High if done using meta-analysis of primary studies)

CONHAZ REPORT WP05_1 37
4. Drought mitigation and adaptation policies2 4.1. Risk assessment of droughts We are not aware of the existence of official guidelines for the assessment of drought risks
(including its costs and benefits). However, there are data and information systems that can help
policy- and decision-makers to assess the risks of droughts, including early warning systems.
Several metrics have been developed to assess severity of drought, although no universal
measures can be adopted since drought is a relative concept and depends on the local climate
characteristics and socio-environmental conditions. The indices are mainly based on
precipitation, soil moisture, and hydrological data (streamflow, groundwater, reservoir or lake
levels). An overview of the commonly used indicators of drought is offered in Kallis (2008),
Hayes (2006), Redmond (2000), and Heim (2000). In line with the earlier noted diversity of
drought definitions, it is not possible to come up with a single, universal drought metric because
it is problem, context and user specific. This explains why one can find precipitation-based,
hydrological and water supply drought indicators. Precipitation indicators have the advantage of
not being influenced by human or environmental factors. The main precipitation indicators
include days of rain, percent of average rainfall (runoff or streamflow), and Standard Precipitation
Index. Other commonly used indicators are Vegetation Condition Index, total water deficit, and
days of water supply remaining. Probably the most widely used drought indicator is Palmer
Drought Severity Index, which combines data on rainfall, temperature, evapotranspiration, soil
moisture, and runoff.
Most countries are monitoring rainfall, reservoir levels and volume, flow data, and quantity
and quality of both surface and groundwater. Safety levels of hydrological drought are usually
based on the reservoir levels. To illustrate, for Spain these include pre-alert stage, exceptional
status 1 (when reservoir levels drop to 40%), exceptional status 2 (reservoir levels at 23%), and
emergency stage (reservoir levels at 20% or below), as reported in Martin-Ortega and
Markandya (2009). Desalinization capacity can also serve as an indicator of resilience to
hydrological drought.
Rainfall data is usually collected by meteorological services. In Catalonia, the rest of the
above-mentioned data is collected mainly by the Catalan Water Agency, with the exception of
hydrological data and the state of reservoirs in the Ebro River Basin, which is provided by the
Hydrographical Confederation of the Ebro. On a European scale, a European Drought Observatory with the aim of drought
forecasting, assessment and monitoring is currently being developed by the Joint Research
Centre's Action DESERT edo.jrc.ec.europa.eu/php/index.php?action=view&id=36 and
EuroGEOSS www.eurogeoss.eu/default.aspx.
In the United States the U.S. Drought Monitor, www.drought.unl.edu/dm/monitor.html, and
National Integrated Drought Information System,
www.drought.gov/portal/server.pt/community/drought_gov/202, have developed an early warning
2 Even though the terms mitigation and adaptation to climate change are often used jointly, they denote different issues. Mitigation
can be defined as a risk reduction, while adaptation refers to the adjustments made to a given risk. The former conists of actions
taken ex ante, while the latter can include both ext ante and ex post measures. IPCC (2001a) provides its own definitions of
mitigation and adaptation to climate change. Differences and similarities between these two terms are discussed in Section 18 of
IPCC (2007b) . A third notion that is frequently used when referring to climate change is coping. Sometimes it is used in the context
of coping capacity or coping mechanism/strategies and sometimes the term is used as a synonim for adaptation.
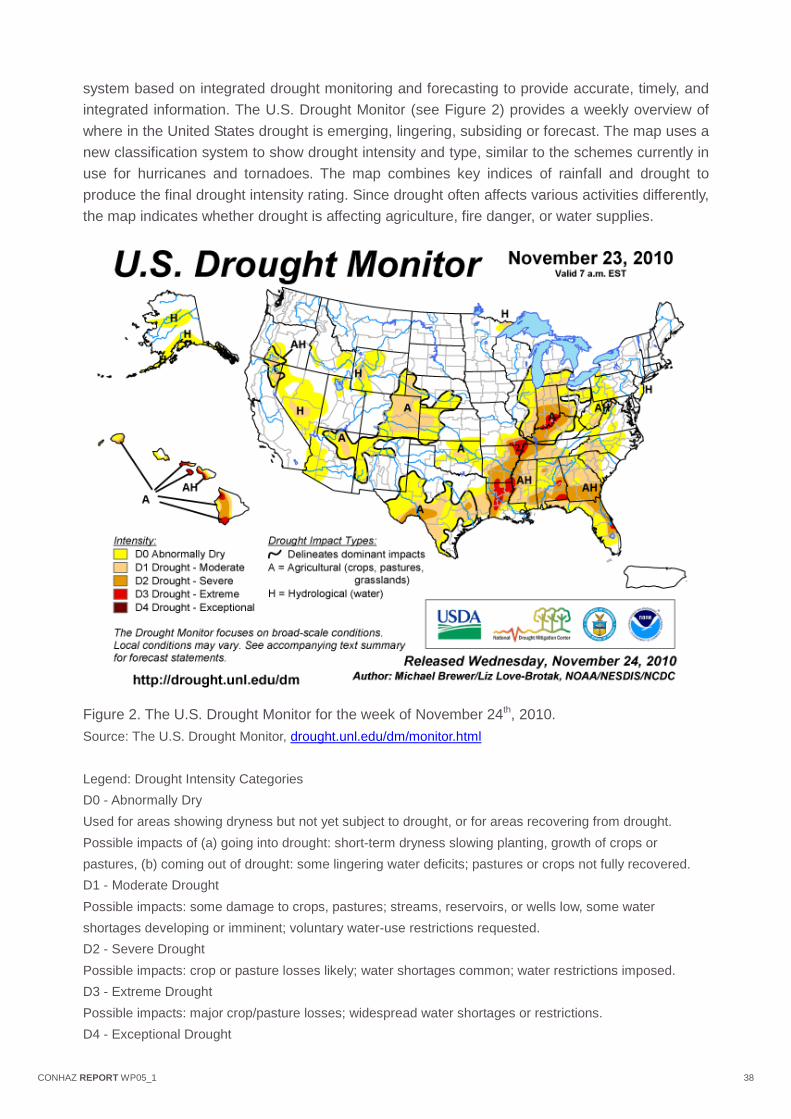
CONHAZ REPORT WP05_1 38
system based on integrated drought monitoring and forecasting to provide accurate, timely, and
integrated information. The U.S. Drought Monitor (see Figure 2) provides a weekly overview of
where in the United States drought is emerging, lingering, subsiding or forecast. The map uses a
new classification system to show drought intensity and type, similar to the schemes currently in
use for hurricanes and tornadoes. The map combines key indices of rainfall and drought to
produce the final drought intensity rating. Since drought often affects various activities differently,
the map indicates whether drought is affecting agriculture, fire danger, or water supplies.
Figure 2. The U.S. Drought Monitor for the week of November 24th, 2010.
Source: The U.S. Drought Monitor, drought.unl.edu/dm/monitor.html
Legend: Drought Intensity Categories
D0 - Abnormally Dry
Used for areas showing dryness but not yet subject to drought, or for areas recovering from drought.
Possible impacts of (a) going into drought: short-term dryness slowing planting, growth of crops or
pastures, (b) coming out of drought: some lingering water deficits; pastures or crops not fully recovered.
D1 - Moderate Drought
Possible impacts: some damage to crops, pastures; streams, reservoirs, or wells low, some water
shortages developing or imminent; voluntary water-use restrictions requested.
D2 - Severe Drought
Possible impacts: crop or pasture losses likely; water shortages common; water restrictions imposed.
D3 - Extreme Drought
Possible impacts: major crop/pasture losses; widespread water shortages or restrictions.
D4 - Exceptional Drought

CONHAZ REPORT WP05_1 39
Possible impacts: exceptional and widespread crop/pasture losses; shortages of water in reservoirs,
streams, and wells creating water emergencies.
Drought or Dryness Types
A ... Agricultural (crops, pasture, grasslands)
H ... Hydrological (water)
Drought intensity categories are based on five key indicators (see Table 4) and numerous
supplementary indicators. The accompanying drought severity classification table shows the
ranges for each indicator for each dryness level. Because the ranges of the various indicators
often do not coincide, the final drought category tends to be based on what the majority of the
indicators show.
Table 4. Drought Severity Classification used by the U.S. Drought Monitor
Drought Severity Classification
RANGES Category Description Palmer
Drought Index
CPC Soil Moisture Model (Percentiles)
USGS Weekly Streamflow (Percentiles)
Standardized Precipitation Index (SPI)
Objective Short and Long-term Drought Indicator Blends (Percentiles)
D0 Abnormally
Dry
-1.0 to -
1.9 21-30 21-30 -0.5 to -0.7 21-30
D1 Moderate
Drought
-2.0 to -
2.9 11-20 11-20 -0.8 to -1.2 11-20
D2 Severe
Drought
-3.0 to -
3.9 6-10 6-10 -1.3 to -1.5 6-10
D3 Extreme
Drought
-4.0 to -
4.9 3-5 3-5 -1.6 to -1.9 3-5
D4 Exceptional
Drought
-5.0 or
less 0-2 0-2 -2.0 or less 0-2
Source: The U.S. Drought Monitor, www.drought.unl.edu/dm/classify.htm
4.2. Climate change and droughts Future climate change will strongly affect drought-related events and impacts. For this reason, in
this section we provide an overview of the studies which predict climate change and its impact
on droughts.
The IPCC assessments from 2001 and 2007 discuss expected future climate changes
which are relevant to droughts. First, there is high confidence that precipitation variability and
associated drought risk will increase in many areas (IPCC, 2007b). Moreover, there is a very
high confidence about the world regions that will experience increasingly drier conditions. Runoff
in the Mediterranean, southern Africa, western United States/northern Mexico, and north-eastern
Brazil will decrease 10% to 30% by the end of the century (IPCC, 2007b). Freshwater availability
in coastal areas that depend on groundwater or estuary water will decrease, which will increase
the likelihood of water supply shortages. The IPCC’s (2001b) climate change scenarios suggest
significant summer drying across many parts of Europe, particularly in the Mediterranean basin,

CONHAZ REPORT WP05_1 40
with increased number of hot days. It also predicts lower rainfall in some areas in spring and
autumn, higher variability in winter rainfall, an increase in the average summer temperature
between 2 and 6˚C, and more intense evaporation. Based on the combination of factors, the
IPCC (2001b) concludes that over the next 100 years Europe is likely to suffer more frequent
meteorological droughts, especially in the south.
The European Commission (2009) recognizes in the White Paper on climate change
adaptation that climate change will cause significant changes in the quality and availability of
water resources, affecting many sectors including food production. Namely, more than 80% of
the agricultural land is rain-fed, while the rest also depends on available water resources for
irrigation. This White Paper further states that limited water availability already poses a problem
in many parts of Europe and that it is likely to deteriorate in the future due to climate change.
Europe’s high water stress areas are expected to increase from 19% today to 35% of total area
by 2070. This in turn could cause large scale migration.
The UK’s Met Office Hadley centre projects a doubling of global increase in land area
under drought by 2100, or 25% by 2030 (Dlugolecki, 2007). Based on this information,
Dlugolecki (2007) estimates losses due to climate change in 2030 according to hazards and
regions, and scales them to the GDP change by that date. Hazard typology used in this report
include storms, floods and other, which comprise wild-fire, drought and heat- and cold-wave
events. For Europe, he predicts that water stress will increase from 19 to 35% of land area in 70
years, giving an increase of (25/70)x(35/19) by 2030. Applying this figure to half of the losses
results with a loss increase of 33%. Accordingly, the projected annual losses in Europe due to
'other' extreme events, including droughts, are estimated at 4.31 billion USD (in 2006 values) in
2030.
OTA (1993) reports the result of Global Climate Models, which indicate that global
precipitation could increase 7–15%. Meanwhile, global evapotranspiration could increase 5–
10%. Thus, the combined impacts of increased temperature, precipitation, and
evapotranspiration will affect snowmelt, runoff, and soil moisture conditions. The models
generally show that precipitation will increase at high latitudes and decrease at low and mid-
latitudes. Therefore, in mid-continent regions, evapotranspiration will be greater than
precipitation so that these areas may suffer from more severe, longer-lasting droughts. In
addition, the increased temperatures alone will cause the water in the oceans to expand,
causing an estimated sea level rise of 20 cm (8 in) by 2030 (OTA, 1993).
Whetton et al. (1993) assess the implications of climate change for drought occurrence in
Australia. This is undertaken using an off-line soil water balance model driven by observed time
series of rainfall and potential evaporation to determine the sensitivity of the soil water regime to
changes in rainfall and temperature, and hence potential evaporation. Potential impacts are
assessed at nine sites, representing a range of climate regimes and possible climate futures, by
linking this sensitivity analysis with scenarios of regional climate change. The latter are derived
from five general circulation models which perform an enhanced greenhouse experiment
(doubled concentration of CO2 in the atmosphere). The results indicate that significant drying
may be limited to the south of Australia. However, because the direction of change in terms of
the soil water regime is uncertain at all sites and for all seasons, there is no basis for statements
about how drought potential may change. A more recent study on Australia (IPCC, 2007b)
shows that a tendency for decreased annual rainfall is likely for most of southern and sub-
tropical Australia, while a tendency for increases is more likely in Tasmania, central Northern

CONHAZ REPORT WP05_1 41
Territory and northern NSW. Projected changes in rainfall and evaporation have been applied to
water-balance models, indicating that reduced soil moisture and runoff are very likely for most of
Australia (IPCC, 2007a). Up to 20% more droughts (defined as the 1-in-10 year soil moisture
deficit from 1974 to 2003) are simulated over most of Australia by 2030 and up to 80% more
droughts by 2070 in south-western Australia (Mpelasoka et al., 2007).
The study of Sheffield and Wood (2008) uses soil moisture data for three different future
climate scenarios. Under the future projections, the models show decreases in soil moisture
globally for all scenarios with a corresponding doubling of the spatial extent of severe soil
moisture deficits and frequency of short-term (4–6-month duration) droughts from the mid-
twentieth to the end of the twenty-first century. Long-term droughts become three times more
common. Regionally, the Mediterranean, west African, central Asian and central American
regions show large increases most notably for long-term frequencies as do mid-latitude North
American regions but with larger variation between scenarios.
Le Houérou (1996) provides a review of historical fluctuations and trends in rainfall and
temperature in desert, arid, semi-arid and dry sub-humid lands of the world, analyses the
impacts of possible warming, and discusses mitigation strategies through improved land-use and
management practices.
4.3. Drought prevention, mitigation and adaptation measures Two main types of government responses to drought can be distinguished: pre-impact
interventions for drought impact reduction and post-impact government interventions. The former
set of measures represents risk management because the undertaken measures are proactive,
being aimed at mitigating the future effects of drought, increasing coping capacity and building
resilience. The examples of such measures include development of an early warning system,
preparedness plans, increased water supply, demand reduction (such as water conservation
programs), and crop insurance. The latter, post-impact government interventions, exhibit crisis
management. Namely, such programs are reactive since measures are implemented after a
drought occurs and focus on treating the symptoms, but not the causes of the natural hazard.
These include drought relief funds, low-interest loans, transportation subsidies for livestock and
livestock feed, provision of food, water transport, and drilling wells for irrigation and public water
supplies (Wilhite, 2000). The latter drought management approach has been criticized by
scientists, government officials, and many relief recipients as inefficient, ineffective and untimely
(Wilhite, 1993). In addition, the provision of emergency relief has been criticized as being a
disincentive to the sustainable use of natural resources because it does not foster self-reliance
(Bruwer, 1993; White et al., 1993). Such measures can actually increase vulnerability to
droughts as well as other natural hazards. For this reason, it is more recommendable to put an
emphasis on proactive mitigation programs aimed at reducing vulnerability to and thus the future
impacts of droughts. In addition, cost-benefit analysis of risk and crisis management (measures)
in the context of droughts may be useful.
The following list presents an overview of the most commonly used measures for drought
prevention, mitigation and adaptation. The first six measures are considered proactive as they
reduce risks or enhance preparedness, while the last three measures are reactive since they are
implemented in response to drought.
CONHAZ REPORT WP05_1 42
• Developing and improving drought prediction, monitoring and early warning systems -
continuous observation of rainfall levels and comparisons with current usage levels, improving
data collection and availability
• Augmenting water supply and developing new water supply infrastructure – rehabilitating
reservoirs, dams and transfers, desalination, lowering water pressure of the water supply
system, conservation demand management, leakage control, wastewater reclamation,
improved supply efficiency, water recycling and reuse
• Water demand reduction or conservation programs – establishing drought stage triggers and
defining the measures to be implemented during each stage (e.g. rationing, use of lower-
quality water, water transfers), putting the right price tag on water
• Improving land-use by agriculture – e.g. crop diversification and crop rotation can allow
farmers to plan less water-dependent crops in drier years
• Raising public awareness and education programs – keeping the public aware of the severity
of the situation through mass media campaigns; distribution of pamphlets to individuals,
businesses and municipalities on water conservation techniques; school education programs
• Developing drought contingency plans – establishing a response framework including a
drought risk management and mitigation plan
• Emergency response programs – defining alert procedures, developing drought relief and
technical assistance programs, establishing funds for recovery programs
• Rainwater storage - collection of rainwater from roofs
• Weather control – seeding clouds with chemicals to induce rainfall
Workshop participants pointed out that more attention should be given to developing measures
that ensure (the recovery of) good environmental conditions (e.g. wetlands, aquifers) and more
flexible water concession systems (such as exchanging centers and assignment contracts in
Spain, which enable buying water rights from the agricultural sector for urban uses). In addition,
establishing an insurance system against droughts and increasing water recycling were
considered potentially important mitigation measures.
Insurance against droughts Insurance against droughts also represents a proactive and desirable measure for drought
adaptation. However, in most countries worldwide, there are no insurance policies against
damage resulting from drought. Although a crop insurance against adverse weather conditions
exists, crop losses as a result of heat waves and drought are still largely uncovered by insurance
in the European Union, implying that these costs are born by the agricultural sector. According to
Dlugolecki (2007), the problem is that the traditional crop insurance is not commercially viable
anywhere. Farmers understand their risks so well that only high-risk ones insure (anti-selection),
and the costs of monitoring crops at field level is high. Hence, a pure private market insurance
may be difficult to establish due to problems with covariate risks, affordable insurance, moral
hazard, and ambiguity of risk, as in the case of floods (Freeman and Kunreuther, 2003). An
involvement of the government in providing reinsurance capital is likely to be a necessary
condition to implement flood insurance (Botzen, 2010). The same holds for droughts. However,
there are few pilot programs, limited to the USA, several African countries, and India.
In the USA a three-year pilot program involves rangeland insurance, which is currently
available in nine states: Oklahoma, Colorado, North Dakota, South Dakota, Pennsylvania, South

CONHAZ REPORT WP05_1 43
Carolina, Idaho, Oregon and Texas. There are 16 private insurance companies which offer
voluntary rangeland insurance to ranchers in case they don't get enough rain.
The World Food Programme (WFP) signed a contract in March 2006 with Axa Re for a
payout of 7 million USD in the event of a severe drought in the subsequent year to Ethiopian
farmers. Insurers were prepared to take on the risks because advances in technology meant it
was easier to predict factors like rainfall. The premium for one year is 930,000 USD and has
been met by a small group of donors, including the United States, together with the Ethiopian
government (Dlugolecki, 2007).
In 2007 Swiss Re (a private re-insurance company) launched derivative contracts
protecting three village clusters situated in Sauri (Kenya), Tiby (Mali), and Koraro (Ethiopia).
Under the agreement Swiss Re would provide up to 2 million USD of financial protection in the
case of extreme drought. The contracts protect smallholder farmers against drought-related
livelihood shocks such as food shortages and famines.
In addition, since 2003, rainfall insurance policy was launched in rural India and offered to
smallholder farmers. Since then, there have been many improvements. A key development was
the partnership between BASIX, an Indian micro-finance institution, The World Bank’s
Commodity Risk Management Group, and private insurers. The pilot insurances in 2003 and
2004 were on a small scale and a major expansion took place in 2005. The product was then no
longer crop-specific, but focused on district as the risk factor. Over 7,000 policies were sold, and
other insurance companies and agents followed suit. However, the growth may be limited by the
availability of weather data. Insurance for non-farming activities could also take off. The premium
rates are not low, at between 5 and 12% of the sum insured, but experience shows that insurers
will not participate unless the scheme is viable, and clients are willing to pay if the claim
settlement process is fast and fair. The insurer identified three barriers: better weather data will
reduce basis risk for clients and encourage improved reinsurance rates; automatic reinsurance
is needed to permit greater flexibility in writing new contracts and portfolios; and the government
should revise its subsidy policy for yield-insurance products, as the current policy undermines
the weather insurance market (Dlugolecki, 2007).
It might be also worth mentioning that Munich Re (another private re-insurance company)
has proposed a crop insurance system called SystemAgro, which would secure farmers
regardless of the exposure they face and would be based on a public private partnership. This
insurance system would take into account a predicted increase in extreme weather conditions
due to climate change, including droughts. The proposal can be found at
http://www.munichre.com/app_pages/www/@res/pdf/reinsurance/business/non-
life/systemagro/sustainable_crop_insurance_en.pdf.
4.4. Costs of drought prevention, mitigation and adaptation measures Costs related to monitoring and early warning systems mainly include research and
development, engineering, investment and maintenance costs. These types of (direct) costs
usually relate to physical impacts that are associated with market prices, which makes their
assessment rather easy and straightforward. Land-use planning often involves costs because it
can distort land market values, in two ways - when authorities do not acquire land at its
equilibrium market price, and when sudden shortages in the supply of land are created which
disrupt a well-functioning market. Construction of new infrastructure for increasing water supply
not only goes along with direct market costs, but also can have detrimental impacts on social
CONHAZ REPORT WP05_1 44
welfare due to their impacts on land fragmentation and aesthetics. As a counterpart, they are
also a potential source of benefits by allowing for additional recreational activities or tourism. All
these non-market costs and benefits can be captured by both stated and revealed preference
techniques, as explained in Section 3.
It is generally agreed that mitigation and preparedness are key to reducing future drought
risks. However, government officials are often reluctant to allocate money and resources to
mitigation because of limited information on the costs and benefits of drought mitigation
programmes (Ding et al., 2010). There are very few studies that try to assess the costs of
drought prevention, mitigation or adaptation measures. Some of them include Michelsen and
Young (1993), Woo (1994), Fisher et al. (1995), Pattanayak and Kramer (2001a; 2001b), Morton
et al. (2005), and Grafton and Ward (2008).
It is considered useful to compare the costs of drought mitigation and adaptation measures
with both the costs of drought prevention and the costs of potential or historical drought. The
former should also include transaction costs of enforcing a new policy. This kind of analysis can
shed light on the existing practices (e.g. in agriculture) and their cost-effectiveness. For example,
it might prove to be less costly to invest into an irrigation system than to subsidize farmers or
offer them a drought relief programme. The US Federal Emergency Management Agency
(FEMA) estimated that the country will save at least two dollars on future disaster costs from
every dollar spent on mitigation (Natural Hazards Observer, 1996). 4.5. Drought legislation in the EU Even though there is still no European Drought Policy, the European Commission (2007b)
adopted a “Communication on Water scarcity & droughts” in 2007. Moreover, Member States
had to prepare the River Management Plans and some of them also developed Drought
Management Plans based on national requirements. The Water Framework Directive (WFD) is
the most relevant existing European policy related to droughts issues. It emphasizes river basin
integrated water resource management and string involvement of stakeholders.
Apart from this, a Support Action project XEROCHORE is aimed at assisting in the
development of a European Drought Policy in accordance with the EU-Water Framework
Directive, http://www.feem-project.net/xerochore/. This illustrates that drought policy is not yet
very much developed, especially in comparison with other hazard types. A book of Correia
(1998) is a result of a research project EUROWATER, which aimed at contributing to a better
understanding of the institutional framework of water management in Europe. The analysis
covers a limited set of countries, namely France, Germany, the Netherlands, Portugal and the
United Kingdom.
All this provides a good basis for European drought mitigation, but there is still much more
left to be done. For example, the report of European’s Network of Freshwater Research
Organisations EurAqua (2004) suggests that at European scale the EU lags behind other
industrialized countries with respect to drought policies and planning, for three reasons. The first
one is the lack of the European Drought Policy. Secondly, it indicates that the WFD supports
more sustainable water abstraction regimes, but some of its provisions are not fully consistent
with good drought mitigation practices. It also noted that in some respects the WFD treats
droughts as a crisis which triggers exemptions, rather than a risk to be managed and mitigated.
The third reason is that drought receives scant attention in many areas of European policy.
Namely, it is argued in the report that in agricultural policy, drought is rarely mentioned despite

CONHAZ REPORT WP05_1 45
haying major direct impacts. In fact, the Common Agricultural Policy supports water intensive
practices in regions with high water stress and vulnerability to future droughts. The European
forest policy, energy policies, transport policy, or tourism policy do not mention droughts or their
impacts within these specific areas, even though they are likely to be affected by droughts. It is
therefore necessary not only to have a European drought policy in the near future, but also to
incorporate drought-specific issues in a wider set of European policies. 4.6. Cooperation in coping with droughts Cooperation at various scales is needed as water flows, hydrological systems and drought
problems are not limited to local, regional or political boundaries. Hence, cooperation between
different countries, agencies, and stakeholders is important in coping effectively with droughts.
Cooperative actions will be much more effective if agreed upon before any crisis. There is a lot
of reporting on specific regional or national drought planning initiatives, but very little on the
operation and effectiveness of existing plans. Only a few studies show that drought planning is
not as effective when detached from other development and environment decision-making
processes, which is unfortunately often the case (Kallis, 2008). Cooperation mechanisms for
drought risk reduction between countries include the following international organizations:
• European Drought Centre, http://www.geo.uio.no/edc/, is a virtual centre of European drought
research and drought management organizations to promote collaboration and capacity
building between scientists and the user community. The long term objective of the centre is to
enhance European co-operation in order to mitigate the impacts of droughts on society,
economy and the environment.
• UNCCD (United Nations Convention to Combat Desertification) entered into force in 1996
and 183 countries were parties by 2009. The convention is fostering international cooperation
through the collection, analysis and exchange of information, research, technology transfer,
capacity and awareness building, and providing financial assistance, especially from developed
to the affected countries. In addition, country parties affected by desertification in Africa, Asia,
Latin America, Caribbean and Northern Mediterranean have to prepare national action
programmes and cooperate at the regional and sub-regional levels.
• WMO (World Meteorological Organization) established a Disaster Risk Reduction Programme
with the aim of observing, detecting, monitoring, predicting and early warning of weather,
climate and water-related hazards. It was founded in 2003 and has 188 members.
• NEMEDCA is a Network on drought management whose main objective is the international
cooperation on drought management plans in the Near East, Mediterranean and Central Asia.
It is supported by the International Center for Agricultural Research in the Dry Areas (ICARDA),
the Food and Agriculture Organization of the United Nations (FAO) and the International
Centre for Advanced Mediterranean Agronomic Studies (CIHEAM).
• CILSS - Comité Inter-Etate pour la Lutte contre la Sécheresse au Sahel (Permanent Inter-
State Committee for Drought Control in the Sahel).
• IGADD. The Intergovernmental Authority on Development (IGAD) in Eastern Africa was
created in 1996 to supersede the Intergovernmental Authority on Drought and Development
(IGADD) which was founded in 1986 by six countries in the Horn of Africa - Djibouti, Ethiopia,
Kenya, Somalia, Sudan and Uganda. The State of Eritrea became the seventh member after
attaining independence in 1993.

CONHAZ REPORT WP05_1 46
• SADC – South African Development Community. Among many other fields of cooperation,
this organization covers the area of environment and land management. It has established
drought monitoring centre for South African countries.
Apart from these, cooperation between countries to deal with drought issues can also be
established through (existing) international river basin commissions, e.g. for the Mekong River
see Hundertmark (2008).
5. Recommendations and knowledge gaps 5.1. Recommendations and best practices regarding methods for cost assessment of droughts 5.1.1. Direct costs Which are good practice approaches and why? In our opinion, the most suitable methods for assessing direct tangible costs of droughts include
market valuation techniques, namely market prices, production function, avoided costs,
replacement or repair costs. They can be applied to any economic sectors, are relatively easy to
apply and yield rather precise estimates. Computable general equilibrium (CGE) analysis and
the input-output analysis can also serve for estimating direct costs, although they are more
demanding than the market valuation techniques and are more frequently applied to estimate
indirect and direct costs jointly rather than direct costs alone. Biophysical-agroeconomic
modeling is a quite complex method and provides an in-depth analysis of agricultural markets,
but its drawback is that it is limited to the agricultural sector. The same holds for Ricardian
hedonic price modeling, which focuses on agriculture. Nevertheless, usually the largest share of
the direct costs caused by droughts is experienced in the agricultural sector. In such cases,
these approaches represent a good practice. Coupled hydrological-economic modeling is limited
to assessing drought costs which are directly related to water use. The different methods could
hence function in a complementary way, where the biophysical-agroeconomic and Ricardian
hedonic price modeling approaches would provide more detail and possibly an input to CGE
analysis, meaning that the first two focus more on direct and the latter on indirect costs. What are the disadvantages of approaches for estimating direct drought costs? In our opinion, the approach that assesses the costs of droughts by observing a decline in GDP
and agricultural production in a drought year is not a very clear method. In particular, the
assumptions underlying this approach are not well explained, i.e. they remain implicit. This
means that it is difficult if not impossible to say something specific about the advantages or
disadvantages of this approach. It may in fact be based on different methods, including simple
extrapolation based on past correlations, macroeconomic or CGE modeling, a very simple
conceptual model (like the study of Benson and Clay, 1998, discussed in Section 3.2), or even
“intuitive guestimation”. In the first and last cases, when explaining a change in GDP and in
agricultural production only by drought, relevant factors and complex interactions within the
economy are likely omitted, in which case this approach provides an unreliable estimate of
drought costs. On the other hand, if based on a good model, this approach can yield solid
estimates. In any case, without providing sufficient details about the particular method used,
results of studies in this vein should be treated with care.

CONHAZ REPORT WP05_1 47
5.1.2. Indirect costs Which are good practice approaches and why? Of all the approaches for assessing indirect costs of droughts presented in this report, we
consider computable general equilibrium (CGE) analysis as the most complete method because
it takes all sectors and markets of the economy into account. This approach actually may use
some direct impacts as an input for estimating indirect costs. Thus, it is particularly useful for
estimating indirect costs. Its development and application to drought issues requires possibly
adaptation for, i.e. particular attention given to, sectors that directly feel the impacts of a drought,
such as agriculture, forestry and health. General-purpose CGE models may be unsuitable to
assess the costs of drought without such adaptation. As indirect costs might as well be estimated
using a less demanding approach, a tradeoff between the advantages and the effort required to
apply this method should be carefully considered. For example, the input-output analysis is
simpler, although somewhat less precise as it does not take into account the substitution effects
of production factors, market effects (price elasticities), and demand-supply interactions. It also
enables assessment of economy-wide effects and is expected to yield rather good estimates of
the order of magnitude of indirect effects. Both types of approaches will be more precise and
reliable if resource-based (water-using) sectors like agriculture, hydro-electricity, water transport
and (drinking) water provision are well demarcated and disaggregated, and the interactions of
these activities with the other activities are accurately captured in the I/O table. Other
approaches are not as complete because they are limited to specific aspects of droughts, and
are hence only able to assess part of the drought costs. For example, biophysical-agroeconomic
modeling focuses on the agricultural sector, while coupled hydrological-economic modeling
deals with costs which are directly related to water use. Some of these methods could hence be
considered as complementary, with CGE analysis offering the most comprehensive approach in
estimating indirect costs of droughts. What are the disadvantages of approaches for estimating indirect drought costs? As said in Section 3.2, assessing indirect costs of droughts by observing a change in GDP and
agricultural production of a country can be used only for indicative purposes, but is unlikely to
provide a reliable cost estimate. Regarding the other methods for estimating indirect drought
costs, such as secondary effects on the production of various economic sectors and on the
employment, their main disadvantage is that all of them demand a lot of data and good formal
(and applied) modeling skills.
5.1.3. Intangible costs Which are good practice approaches and why? A choice between the methods for estimating intangible costs of droughts is less clear.
Contingent valuation (CV) and choice experiments (CE) can be used as alternative, substitute
methods for eliciting individuals’ willingness to pay and are expected to arrive to similar
estimates. Recently, CE has become more popular due to several advantages over CV. These
include less bias because of more similarity to real market situations (notably, price as one of
many attributes of a good), the ease of estimating values of single attributes of an environmental
resource, avoidance of part-whole bias problem since different levels of the good can be easily
built into the experimental design, and avoidance of yea-saying in the case of double-bounded
dichotomous choice in CV. However, there are also some drawbacks to CE. The technique is

CONHAZ REPORT WP05_1 48
much more demanding for respondents to answer, preferences may be inconsistent in the
experiment, the design of a CE is a non-trivial task, and its incentive properties are unclear.
Life satisfaction analysis can be regarded as a substitute approach to both CV and CE.
Nevertheless, CV and CE are often used for calculating hypothetical or future changes, while life
satisfaction analysis has not yet been applied to a hypothetical situation – only to current or
historical situations. However, there seems to be no fundamental obstacle against using life
satisfaction analysis in a hypothetical setting as well (even though it is not sure to receive an
enthusiastic response from the happiness research community). This approach thus resembles
stated preference methods in the sense that happiness scores have to be stated by
respondents, while it shares with revealed preference methods a focus on actual, realized
(policy) changes.
What are the disadvantages of approaches for estimating intangible drought costs? We do not consider any of the approaches presented for estimating the intangible costs of
droughts as an example of a bad practice. 5.2. Recommendations and best practices with respect to drought mitigation and adaptation policies An important measure pointed out by policy makers is the recovery of good environmental
conditions (e.g. recovery of wetlands and aquifers), which enables resilience of the system to
droughts. This implies that environmental policy plays a substantial role in the mitigation of
droughts. Another recommended approach for drought mitigation is the establishment of
exchanging centers and assignment contracts for water use rights. These two market options
were recently introduced in Spain inspired by the Water Bank experiences in the US. Through
exchanging centers the water authorities can make takeover bids of concession rights to water
in order to reallocate them or to recover a sustainable rate of use. So, in the case of anticipated
or increasing water shortages water authorities can buy concession rights on water for irrigation
from farmers and reallocate it to urban users. In this way, agriculture can serve as a buffer when
a drought occurs, absorbing a great part of the drought risk. Nevertheless, in order for such
centers to operate efficiently it is necessary to estimate correctly the sacrificed profits, including
environmental and opportunity costs. Also, it is important to do this well in advance of a drought,
as otherwise the negotiating power of the government is small. Stakeholders have also
mentioned that it is desirable to establish good drought mitigation through insurance (primarily
crop insurance), because it is otherwise too expensive to guarantee water supply or compensate
for the losses cause by droughts. They further see a substantial potential in water recycling and
reuse. Here, there should be a shift in paradigm, meaning that different water qualities would be
provided for different uses. In general, it is of crucial importance to have a legal framework that
is strong enough to ensure the implementation of relevant, required mitigation and adaptation
measures.
Most of the approaches for reducing drought risks and impacts represent good practices.
These include improving drought prediction, monitoring and early warning systems, water
demand reduction and conservation programs (e.g. though rationing or water pricing policy),
improving crop water use through crop selection and diversification, raising public awareness,
and developing drought contingency and emergency response plans. These are all
complementary measures, so each one helps in reducing different risk types and are important

CONHAZ REPORT WP05_1 49
at different stages of drought evolution. Hence, it is recommendable to use a combination (set)
of measures instead of focusing on one of them. Combining different measures ensures better
risk distribution and has a synergetic value. Furthermore, drought mitigation and adaptation
measures should be based on modularity, i.e. they should be adapted to the particular region or
territory, implying that there is no unique solution or recommendation that would be valid
everywhere. For this reason, it is recommendable to conduct a vulnerability assessment, which
tends to discover where the roots of vulnerabilities are so that mitigation and adaptation policies
can be designed to cope with these.
When choosing between different policy options, multi-criteria analysis can serve as useful
decision-making tool because it allows analyzing the impacts of alternative policies. Rossi et al.
(2005) used this method for selecting the preferable mix of drought mitigation measures related
to a water supply system in eastern Sicily, Italy. They first applied a simulation model to evaluate
the effects of several drought mitigation alternatives consisting of a mix of long- and short-term
measures. Next, multi-criteria analysis was applied to rank different alternatives on the basis of
economic, environmental, and social criteria, taking into account preferences of the various
stakeholders involved. Their results confirm the applicability of multi-criteria analysis for a
transparent comparison of drought mitigation measures and its relevance as a support tool for
the decision making process.
Augmenting water supply and developing new water supply infrastructure are important
measures for ensuring sufficient water supply. Desalination, for instance, increases flexibility of
water supply and can be seen as an insurance strategy against water supply shortages. Water
transfer is another option, although in Catalonia the plan of transferring water from the Ebro
River was finally rejected because it was considered that it would not work well in drought years,
However, such measures might lead to reverse effects of increased water consumption and a
diminished public awareness of a water scarcity problem. Weather control, i.e. cloud seeding
with the aim of enhancing precipitation might be the most controversial of all drought risk-
reduction approaches. Unlike the rest of approaches, it does not provide an incentive for a
change in attitude or undertaking efforts for drought preparedness. More importantly perhaps, its
effectiveness and safety (unintended effects) are not very clear.
With respect to the reduction of water demand, it would be recommendable to reconsider
some of the existing (unsustainable) practices of water use or at least to set stricter standards
for their water consumption, particularly in arid areas. Examples include numerous golf courses,
swimming pools and aqua parks for tourism purposes in Mediterranean regions and intensive
agriculture based on irrigation, such as in Almeria, Spain. In addition, it is important to determine
priorities of water uses for periods of water shortages. In Cyprus, for instance, water availability
for tourism has priority over that for agriculture during the summer months. Again, multi-criteria
can be useful for these purposes.
In general, drought policy should be based on good planning. It is strongly recommendable
that planners conduct a cost-benefit analysis in which damage costs of a (potential) drought are
compared to the costs of mitigation and adaptation measures. When planning for a drought, one
should define the goals to be achieved during a drought period. For example, guaranteeing
water supply at 100% during a drought is possible, but comes at a certain cost. This means that
there is a tradeoff between the level of water security and the corresponding costs and that the
desirable levels should be decided upon beforehand.

CONHAZ REPORT WP05_1 50
A distinction should be made between short and long-term measures. Drought mitigation
and adaptation policies should be set for a longer term (at least 20 years in the future) than they
are at the moment. In this way, impacts of infrequent drought events are taken into account, and
additionally one can incorporate the projected impacts of climate change more easily. Otherwise,
no effects of climate change are ‘observable’ within the time frame of a plan and thus there is no
incentive to invest in its prevention, mitigation or adaptation. For example, the plan for Catalonia
embraces the period until 2015, but until then no serious climate change effects are expected
and hence no investment is planned. Surveillance by the European Commission is considered
as an effective measure in ensuring implementation of relevant plans and legislation.
In addition, it is considered important to ensure participation of local communities in
decision-making and water planning, since access to water represents a basic human right and
should thus not be driven by market rules. In this way, a feeling of co-responsibility may also
develop, as everyone bears part of the responsibility for mitigating drought impacts, that is, not
only the government. For example, the social impacts of droughts partly depend on people’s
tolerance, i.e. capacity to live with less water during a drought period and to change their habits.
Workshop participants identified the following criteria as the most important ones when
deciding about the implementation of a drought policy: reliability, efficiency, environmental
quality, equity, and risk distribution. The timing of a policy is yet another relevant factor to be
taken into consideration (e.g. when to switch from supply- to demand-side policy measures). It
was further noted that water planning and policies have similarities with planning and policies in
transport and energy, which suggests that useful lessons may be learned from those policy
areas.
5.3. Knowledge gaps
In general, there seems to be a consensus within the drought expert community on the lack of
information on, and studies dealing with, the impacts of droughts, the economic assessment of
drought damages, and cost estimation of drought mitigation and adaptation measures. This
suggests the need for more research on these themes, particularly as some end users pointed
out that economic information is crucial for good policy making.
More specifically, for assessing the costs of droughts, identified user needs include data on
the opportunity costs of water, on water productivity in different sectors, on the intensity of water
production of different crop types in agriculture, on damage due to drought on different crop
types, on the economic value of ecosystem services, and on damage caused by subsidence of
buildings. Workshop participants also reported the need for data on water consumption in
agriculture, soil parameters (e.g. water-storage capacity of soil), indicators of economic damage,
and establishing thresholds for different parameters and indicators. Further identified problems
regarding available data for estimating drought costs comprise too general data and indicators
provided by meteorological offices, agricultural or other agencies (e.g. they often use averages)
while there is need for more specific and precise data at the regional or local level (e.g. crop
yield estimates); international data is often not additional but merely reflects already gathered or
aggregated national data; dispersion of data among various departments and institutions; lack of
data comaparability between and within different departments, institutions, regions and
countries; different data gathered by different agencies; and the fact that data is not always
publicly available or free of charge. There is an impression by the end users that data availability
and quality is inferior for eastern European countries. Finally, once the data is available, the

CONHAZ REPORT WP05_1 51
major obstacle for cost assessment of droughts is the advanced level of expertise needed and
the interdisciplinary character of the knowledge required for its execution (hydrology, agriculture,
forestry, economics, etc.). Moreover, different methods and associated expertise are needed for
estimating different types of drought costs, adding to the complexity of estimating the costs of
droughts.
Better acquaintance with the costs would enable a more optimal pricing of water.
Otherwise, if prices are not set appropriately, someone is bearing the costs unjustifiably, which
could be either certain private agents or the government (and indirectly tax payers). In Barcelona
there are three different pricing blocks based on water consumption. The price of the third block
is approximately three times that of the first one. However, the prices are not determined on the
basis of a thorough economic analysis; the price of the first block was set at the level that covers
the costs of water provision, while the other blocks serve as a fines for higher than average
water consumption. More insight into relevant costs could increase the optimization of water
resources and their pricing. In order to achieve this, setting appropriate thresholds is quite
important. It is also recommendable to enable block pricing thresholds to vary during drought
periods. This means that water pricing schemes could include a ‘scarcity’ component, which
would enable flexible reaction to hydro-meteorological conditions, with a predetermined cap
agreed beforehand (Xerochore project, 2010).
It is often difficult to distinguish whether the costs of a drought are stemming from drought
severity (i.e. bad weather conditions) or bad management practice (in agriculture, for instance).
Hence, there is a need to investigate this issue further. Moreover, potential food shortage
problems due to droughts and related mitigation and adaptation policies do not seem to have
received much attention in the literature so far. There is also a need for a comprehensive cost-
benefit analysis of various drought mitigation and adaptation policies.
A significant knowledge gap identified concerns the distribution of drought costs (and to a
lesser extent benefits) among different economic sectors and social actors. UN (2011) indicates
that social and economic impacts of droughts disproportionally fall upon poor rural households.
Therefore, apart from the level of the costs of droughts themselves, it is equally (if not more)
important to understand how these costs are distributed within society in order to ensure both
effective and equitable drought policies – in terms of emergency, mitigation and adaptation
measures.

CONHAZ REPORT WP05_1 52
References Adger, W.N. (2006). Vulnerability. Global Environmental Change, 16: 268-281.
Alston, M., Kent, J. (2004). Social impacts of drought: a report to NSW agriculture. Wagga
Wagga NSW: Centre for Rural Social research, Charles Sturt University.
Bakarat and Chamberlin, Inc. (1994). The value of water supply reliability: Results of a
contingent valuation survey of residential customers. California Urban Water Agencies.
http://www.cuwa.org/library/TheValueofWaterSupplyReliability.pdf
Benson, C., Clay, E. (1998). The impact of drought on Sub-Saharan African economies: a
preliminary examination. World Bank Technical Paper no. 401. Washington, DC: The World
Bank.
Berrittella, M., Hoekstra, Y.A., Rehdanz, K., Roson, R., Tol, R.S.J. (2007). The economic impact
of restricted water supply: A computable general equilibrium analysis. Water Research, 41:
1799-1813.
Birol, E., Koundouri, P., Kountouris, Y. (2008). Using economic valuation techniques to inform
water resources management in the southern European, Mediterranean and developing
countries: A survey and critical appraisal of available techniques. In P. Koundouri (ed.),
Coping with water deficiency. New York: Springer.
Booker, J.F. (1995). Hydrologic and economic impacts of drought under alternative policy
responses. Water Resources Bulletin, 31: 889-906.
Booker, J.F., Michelsen, A.M., Ward, F.A. (2005). Economic impact of alternative policy
responses to prolonged and severe drought in the Rio Grande Basin. Water Resources
Research, 41: W02026, doi:10.1029/2004WR003486.
Botzen, W.J.W. (2010). Economics of insurance against climate change. PhD thesis. Institute for
Environmental Studies, VU University Amsterdam.
Boyd, R., Ibarrarán, M.E. (2009). Extreme climate events and adaptation: an exploratory
analysis of drought in Mexico. Environment and Development Economics, 14: 371-395.
Brouwer, R. (2000). Environmental value transfer: state of the art and future prospects.
Ecological Economics, 32: 137-152.
Bruwer, J.J. (1993). Drought policy in the Republic of South Africa. In D.A. Wilhite (ed.), Drought
Assessment, Management, and Planning: Theory and Case Studies. Boston, MA: Kluwer
Academic Press.
Burke, E.J., Brown, S.J., Christidis, N. (2006). Modeling the recent evolution of global drought
and projections for the twenty-first century with the Hadley Centre climate model. Journal
of Hydrometeorology, 7: 1113-1125.
Carroll, N., Frijters, P., Shields, M.A. (2009). Quantifying the costs of drought: new evidence from
life satisfaction data. Journal of Population Economics, 22: 445-461.
Chatterjee, K., Chatterjee, A., Das, S. (2005). Case study 2: India community adaptation to
drought in Rajasthan. Institute of Development Studies (IDS) Bulletin, 36: 33–52.
Cooley, H. (2006). Floods and droughts. In P.H. Gleick (ed.), The world’s water 2006-2007. The
Biennial Report on Freshwater resources. Washington, DC: Island Press.
Correia, F. N. (1998). Institutions for water resources management in Europe. Volume 1.
Rotterdam: Balkema. Corti, T., Muccione, V., Köllner-Heck, P., Bresch, D., Seneviratne, S.I. (2009). Simulating past
droughts and associated building damages in France. Hydrology and Earth System
Sciences, 13: 1739-1747.

CONHAZ REPORT WP05_1 53
Demuth, S. (2009). Living with drought in Europe. A World of Science, 7: 18-20.
Ding, Y., Hayes, M.J., Widhalm, M. (2010). Measuring economic impacts of drought: A review
and discussion. Papers in Natural Resources, University of Nebraska – Lincoln.
http://digitalcommons.unl.edu/cgi/viewcontent.cgi?article=1198&context=natrespapers
Dlugolecki, A. (2007). The cost of extreme events in 2030. A report for United Nations
Framework Convention on Climate Change.
http://unfccc.int/files/cooperation_and_support/financial_mechanism/application/pdf/dlugole
cki.pdf
Easterling, W., Mendelsohn, R. (2000). Estimating the economic impacts of drought on
agriculture. In Wilhite, D.A. (ed.). Drought: A Global Assessment, 1: 256-68. London/New
York: Routledge.
EurAqua (2004). Towards a European Drought Policy. Discussion document.
http://www.geo.uio.no/edc/downloads/EurAqua_Towards_a_Europen_Drought_Policy_200
4.pdf
European Commission (2007a). Addressing the challenge of water scarcity and droughts in the
European Union: Impact Assessment. Second Interim Report.
http://ec.europa.eu/environment/water/quantity/pdf/comm_droughts/impact_assessment.pd
f
European Commission (2007b). Communication on water scarcity and droughts. http://eur-
lex.europa.eu/LexUriServ/LexUriServ.do?uri=COM:2007:0414:FIN:EN:PDF
European Commission (2009). White paper. Adapting to climate change; Towards a European
framework for action. http://ec.europa.eu/environment/water/adaptation/index_en.htm
European Environmental Agency – Joint Research Centre – World Health Organization (2008).
Impacts of Europe’s changing climate – 2008 indicator-based assessment. Joint EEA-JRC-
WHO Report: EEA Report No. 4/2008, JRC Reference Report No. JRC47756.
European Environmental Agency (2009). Water resources across Europe – confronting water
scarcity and droughts. EEA Report No. 2/2009.
European Environmental Agency (2010). Mapping the impacts of natural hazards and
technological accidents in Europe. An overview of the last decade. EEA Technical Report
No. 12/2010.
European Union Working Group on Water Scarcity and Drought (2006). Water scarcity
management in the context of WFD. SCG agenda point 8b, WGB/15160506/25d.
http://www.sogesid.it/allegati/convegni_eventi/water_city_7_2006/WS_Management.pdf
Fischer, G., Shah, M., Tubiello, F.N., van Velhuizen, H. (2005). Socio-economic and climate
change impacts on agriculture: an integrated assessment, 1990-2080. Philosophical
transactions of the Royal Society of London, Series B Biological Sciences, 360: 2067-
2083.
Fisher, A., Fullerton, D., Hatch, N., Reinelt, P. (1995). Alternatives for managing drought: a
comparative cost analysis. Journal of Environmental Economics and Management, 29:
304-320.
Freeman, P.K., Kunreuther, H. (2003). Managing environmental risk through insurance. The
International Yearbook of Environmental and Resource Economics 2003/2004. In H.
Folmer, T. Tietenberg (eds). Northampton: Edward Elgar Publishing.
Garcia-Valiñas, M.A. (2006). Analysing rationing policies: drought and its effects on urban users’
welfare (Analysing rationing policies during drought. Applied Economics, 38: 955-965.

CONHAZ REPORT WP05_1 54
Grafton, R. Q., Ward, M.B. (2008). Prices versus rationing: Marshallian surplus and mandatory
water restrictions. The Economic Record, 84: S57-S65.
Griffin, R. C., Mjelde, J.W. (2000). Valuing Water Supply Reliability. American Journal of
Agricultural Economics 82: 414-426.
Hayes, M.J. (2006). What is drought? Drought indices. Lincoln, NE: National Drought Mitigation
Center, University of Nebraska – Lincoln, http://www.drought.unl.edu/whatis/indices.htm.
Heathcote, R.L. (1969). Drought in Australia: a problem of perception. Geographical Review, 59:
175-194.
Heim, R.R., Jr. (2000). Drought indices: a review. In Wilhite, D.A. (ed.). Drought: A Global
Assessment, 1: 245-255. London/New York: Routledge.
Hensher, D., Shore, N., Train, K. (2005). Households’ willingness to pay for water service
attributes. Environmental and Resource Economics, 32: 509-531.
Hensher, D., Shore, N., Train, K. (2006). Water supply security and willingness to pay to avoid
drought restrictions. The Economic Record, 82: 56-66.
Holden, S., Shiferaw, B. (2004). Land degradation, drought and food security in a less-favoured
area in the Ethiopian highlands: a bio-economic model with market imperfections.
Agricultural Economics, 30: 31-49.
Horridge, M., Madden, J., Wittwer, G. (2005). The impact of the 2002-2003 drought on Australia.
Journal of Policy Modeling, 27: 285-308.
Howe, C.W., Smith, M.G., Bennett, L., Brendecke, C.M., Flack, J.E., Hamm, R.M., Mann, R.,
Rozaklis, L., Wunderlich, K. (1994). The value of water supply reliability in urban water
systems. Journal of Environmental Economics and Management, 26: 19-30.
Hulme, M. (1995). Climatic trends and drought risk analysis in sub-Saharan Africa. Norwich:
University of East Anglia, Climatic Research Unit.
Hundertmark, W. (2008). Building drought management capacity in the Mekong River basin.
Irrigation and Drainage, 57:279-87.
IPCC (2001a). Climate Change 2001: Synthesis Report. A contribution of Working Groups I, II, III
to the Third Assessment Report of the Intergovernmental Panel on Climate Change. R.T
Watson and the Core Team (eds). Cambridge and New York: Cambridge University Press.
IPCC (2001b). Climate Change 2001: The Scientific Basis. Contribution of Working Group I to
the Third Assessment Report of the Intergovernmental Panel on Climate Change. J.T
Houghton, J. Ding, D.J. Griggs, M. Nouger, P.J. van der Linden, X. Dai, K. Maskell, C.A.
Johnson (eds). Cambridge and New York: Cambridge University Press.
IPCC (2007a). Climate Change 2007: The Physical Science Basis. Contribution of Working
Group I to the Fourth Assessment Report of the Intergovernmental Panel on Climate
Change. S. Solomon, D. Qin, M. Manning, Z. Chen, M. Marquis, K. Averyt, M.M.B. Tignor,
H.L. Miller (eds). Cambridge and New York: Cambridge University Press.
IPCC (2007b). Climate change 2007: Impacts, Adaptation and Vulnerability. Contribution of
Working Group II to the Fourth Assessment Report of the Intergovernmental Panel on
Climate Change. M. Parry, O.F. Canziani, J. Palutikof, P.J. van den Linden, C. Hanson
(eds). Cambridge and New York: Cambridge University Press.
Islam, N. (2003). What does a dry season mean to the Western Australian economy? A CGE
investigation. Paper presented to the 47th Annual Conference of the Australian Agricultural
and Resource Economics Society, Western Australia, 11 – 14 February, 2003.
http://www.aares.info/files/2003_islam.pdf

CONHAZ REPORT WP05_1 55
Jonkeren, O., P. Rietveld, J. van Ommeren, (2007), Climate change and inland waterway
transport: welfare effects of low water levels on the river Rhine, Journal of Transport
Economics and Policy, 41: 387-411.
Kallis, G. (2008). Droughts. Annual Review of Environment and Resources, 33:85-118.
Koss, P., Khawaja, M.S. (2001). The Value of Water Supply Reliability in California: A
Contingent Valuation Study. Water Policy, 3: 165-174.
Kulshreshtha, S.N., Klein, K.K. (1989). Agricultural drought impact evaluation model: a systems
approach. Agricultural Systems, 30: 81-96.
Le Houérou, H.N. (1996). Climate change, drought and desertification. Journal of Arid
Environments, 34: 133-85.
Llop, M. (2008). Economic impact of alternative water policy scenarios in the Spanish production
system: An input-output analysis. Ecological Economics, 68: 288-294.
Martin-Ortega, J., Markandya, A. (2009). The cost of drought: the exceptional 2007-2008 case of
Barcelona. Basque Centre for Climate Change Working Paper Series,
www.bc3research.org/working_papers/downpubli_9.html
McFadden, D.L., Bemmaor, A.C., Caro, F.G., Dominitz, J., Jun, B., Lewbel, A., Matzkin, R.L.,
Molinari, F., Schwarz, N., Willis, R.J., Winter, J.K. (2005). Statistical analysis of choice
experiments and surveys. Marketing Letters, 16: 183-196.
Michelsen, M.A., Young, R.A. (1993). Optioning agricultural water rights for urban water supplies
during drought. American Journal of Agricultural Economics, 75: 1010-1020.
Miller, R.E., Blair, P.D. (2009). Input-output analysis: Foundations and extensions. Cambridge:
Cambridge University Press.
Morton, J., Barton, D., Collinson, C., Heath, B. (2005). Comparing Drought Mitigation
Interventions in the Pastoral Livestock Sector. Natural Resources Institute report.
Greenwich: NRI.
Mpelasoka, F., Hennessy, K., Jones, R., Bates, B. (2007). Comparison of suitable drought
indices for climate change impacts assessment over Australia towards resource
management. International Journal of Climatology, 28: 1283-1292.
Munich Re (2004). Annual review: natural catastrophes 2003. Munich: Munich Re.
Mysiak, J., Markandya, A. (2009). Economic costs of droughts. Xerochore WP2 brief.
http://www.feem.it/userfiles/attach/2009111010573362009.07.23_mysiak%20jaroslav_pap
er.pdf
National Drought Mitigation Centre, University of Nebraska – Lincoln, Impacts of drought,
http://drought.unl.edu/risk/impacts.htm
National Oceanic and Atmospheric Administration, Coastal Services Center (2011). Restoration
Economics. Environmental Valuation: Principles, Techniques, and Applications.
http://www.csc.noaa.gov/coastal/economics/envvaluation.htm
Natural Hazards Observer (1996). Witt Announces FEMA Mitigation Plan, Natural Hazards
Observer, 20: 10. Boulder, Colorado: Natural Hazards Information and Applications Center,
University of Colorado.
OTA (Office of Technology Assessment). 1993. Preparing for an Uncertain Climate, Vol. I. OTA–
O–567. Washington, DC: U.S. Government Printing Office.
Pattanayak, S.K., Kramer, R.A. (2001a). Pricing ecological services: Willingness to pay for
drought mitigation from watershed protection in eastern Indonesia. Water Resources
Research, 37: 771-78.

CONHAZ REPORT WP05_1 56
Pattanayak, S.K., Kramer, R.A. (2001b). Worth of watersheds: a producer surplus approach for
valuing drought mitigation in Eastern Indonesia. Environment and Development
Economics, 6: 123-146.
Pauw, K., Thurlow, J., van Seventer, D. (2010). Droughts and floods in Malawi: assessing the
economywide effects. IFPRI Discussion paper 00962. Washington, DC: International Food
Policy Research Institute. http://www.preventionweb.net/files/13792_ifpridp009621.pdf
Penning-Rowsell, E.C., Johnson, C., Tunstall, S., Tapsell, S., Morris, J., Chatterton, J., Coker, A.,
Green, C. (2003). The Benefits of flood and coastal defence: techniques and data for 2003.
Flood Hazard Research Centre, Middlesex University.
Pérez y Pérez, L., Barreiro-Hurlé, J. (2009). Assessing the socio-economic impacts of drought in
the Ebro River Basin. Spanish Journal of Agricultural Research, 7: 269-280.
Redmond, K.T. (2000). Integrated climate monitoring for drought detection. In Wilhite, D.A. (ed.).
Drought: A Global Assessment, 1: 245-55. London/New York: Routledge.
Rosenberg, N.J. (1993). A methodology called ‘mink’ for study of climate change impacts and
responses on the regional scale: an introductory editorial. Climatic Change, 24: 1-6.
Rossi, G., Cancelliere, A., Giuliano, G. (2005). Case study: Multicriteria assessment of drought
mitigation measures. Journal of Water Resources Planning and Management, 131: 449-
458.
Salami, H., Shahnooshi, N., Thomson, K.J. (2009). The economic impacts of drought on the
economy of Iran: an integration of linear programming and macroeconometric modeling
approaches. Ecological Economics, 68: 1032-1039.
Sheffield, J., Wood, E.F. (2008). Projected changes in drought occurence under future global
warming from multi-model, multi-scenario, IPCC AR4 simulations. Climate Dynamics, 31:
79-105.
Smith, K., Ward, R. (1998). Floods: Physical processes and human impacts. Chichester: John
Wiley and Sons.
United Nations (2011). Global assessment report on disaster risk reduction.
http://www.preventionweb.net/english/hyogo/gar/2011/en/home/download.html
Velázquez, E. (2006). An input-output model of water consumption: analyzing intersectoral water
relationships in Andalusia. Ecological Economics, 56: 226-240.
Vogt, J.V., Somma, F. (eds.) (2000). Drought and drought mitigation in Europe. New York:
Springer.
Ward, F.A., Booker, J.F., Michelsen, A.M. (2006). Integrated economic, hydrologic, and
institutional analysis of policy responses to mitigate drought impacts in Rio Grande Basin.
Journal of Water Resources Planning and Management, 132: 488-502.
Whetton, P.H., Fowler, A.M., Haylock, M.R., Pittock, A.B. (1993). Implications of climate change
due to the enhanced greenhouse effect on floods and droughts in Australia. Climatic
Change, 25: 289-317.
White, D., Collins, D., Howden, M. (1993). Drought in Australia: prediction, monitoring,
management, and policy. In D.A. Wilhite (ed.), Drought Assessment, Management, and
Planning: Theory and Case Studies. Boston, MA: Kluwer Academic Press.
Wilhite, D.A. (1992). Drought. Encyclopedia of Earth System Science, Vol. 2. San Diego:
Academic Press.
Wilhite, D.A. (1996). A methodology for drought preparedness. Natural Hazards, 13: 229-52.

CONHAZ REPORT WP05_1 57
Wilhite, D.A. (1997). Improving drought management in the West: the role of mitigation and
preparedness. Report to the Western Water Policy Review Advisory Commission.
http://drought.unl.edu/pubs/wwprcwp.pdf
Wilhite, D.A. (ed.) (1993). Drought Assessment, Management, and Planning: Theory and Case
Studies. Boston, MA: Kluwer Academic Press.
Wilhite, D.A. (ed.) (2000). Drought: A Global Assessment. Volume I and II. London/New York:
Routledge.
Wilhite, D.A., Glantz, M.H. (1985). Understanding the drought phenomenon: the role of
definitions. Water International, 10: 111-20.
Wilhite, D.A., Svoboda, M.D., Hayes, M.J. (2007). Understanding the complex impacts of
drought: a key to enhancing drought mitigation and preparedness. Water Resources
Management, 21: 763-74.
Wilhite, D.A., Vanyarkho, O. (2000). Pervasive impacts of a creeping phenomenon. In Wilhite,
D.A. (ed.). Drought: A Global Assessment, 1: 245-55. London/New York: Routledge.
Wilhite, D.A., Wood, D.A. (eds.) (1994). Drought management in a changing west: new
directions for water policy, IDIC Technical Report Series 94-1, International Drought
Information Centre, University of Nebraska-Lincoln, USA.
Wittwer, G., Griffith, M. (2010). Closing the factory doors until better times: CGE modeling of
drought using a theory of excess capacity. Paper presented at the GTAP 13th annual
conference, Penang, Malaysia, June 9-11, 2010.
https://www.gtap.agecon.purdue.edu/resources/download/5019.pdf
Woo, C. (1994). Managing water supply shortage: interruption versus pricing. Journal of Public
Economics, 54: 145-160.
World Meteorological Organization (2011). Droughts. www.wmo.int
Xerochore project (2010). Science policy brief no. 3: Recovery of costs to water services (Article
9). http://www.feem-project.net/xerochore/files/PB3.pdf

CONHAZ REPORT WP05_1 58
Appendix: Previous and current European projects related to drought AquaMoney (Assessment of environmental and resource costs and benefits in the European
Water Framework Directive), http://www.aquamoney.ecologic-events.de
AquaStress (Mitigation of Water Stress through new Approaches to Integrating Management,
Technical, Economic and Institutional Instruments), http://www.aquastress.net
ARIDE (Assessment of the Regional Impacts of Droughts in Europe), http://www.hydrology.uni-
freiburg.de/forsch/aride
ASTHyDA (Analysis, Synthesis and Transfer of Knowledge and Tools on Hydrological Drought
Assessment through a European Network),
http://www.geo.uio.no/english/research/projects/old/asthyda
AVEC (Integrated Assessment of Vulnerable Ecosystems under Global Change), http://www.pik-
potsdam.de/avec
DESERT (Desertification, Land Degradation, and Drought – Monitoring, Mitigation, and Early
Warning), http://desert.jrc.ec.europa.eu/action/php/index.php?action=view&id=-1
EuroGEOSS (European environment Earth observation system supporting INSPIRE Directive
2007/2/EC and compatible with the Global Earth Observation System of Systems in the
areas of Drought, Forestry and Biodiversity), http://www.eurogeoss.eu
EUROWATER, http://www.aprh.pt/congressoagua98/files/com/ew4.pdf MEDDMAN (Integrated water resources management, development and comparison of common
transnational methodologies to combat drought in the MEDOCC regions),
http://www.meddman.org MEDROPLAN (Mediterranean Drought Preparedness and Mitigation Planning),
http://www.iamz.ciheam.org/medroplan
WATCH (Water and Global Change), http://www.eu-watch.org/
XEROCHORE SA (An Exercise to Assess Research Needs and Policy Choices in Areas of
Drought), http://www.feem-project.net/xerochore