method for predicting the perceived quality of service for
TRANSCRIPT

Method for Predicting the Perceived Quality of Service for Digital Video as a Function of the En-
coding Bit Rate and the Content Dynamics
Harilaos G. Koumaras
National and Kapodistrian University of AthensDepartment of Informatics and Telecommunications
Abstract. This paper presents a novel method for fast and quantified esti-mation of the Perceived Quality of Service (PQoS) for MPEG-4 video con-tent, encoded at constant bit-rates. Taking into account the instant PQoS var-iation due to the Spatial and Temporal (S-T) activity within a given MPEG-4 encoded content, this paper introduces the Mean PQoS (MPQoS) as a func-tion of the video encoding rate and the picture resolution, and exploits it as a metric for objective video quality assessment. The validity of this metric is assessed by comparing PQoS experimental curves to the theoretical benefit functions vs. allocated resources. Based on the proposed metric, and taking into account the qualitative similarity between theoretical and experimental curves, the paper presents a prototype method for pre-encoding PQoS as-sessment based on the fast estimation of the S-T activity level of a video sig-nal.
Keywords: Perceived Quality of Service (PQoS), Mean Perceived Quality of Service (MPQoS), Benefit function, Objective measurement of PQoS
1 Introduction
Multimedia applications that distribute audiovisual content over 3G/4G (3rd/4th gen-eration) networks (such as video on demand (VOD) and real time entertainment streaming services) will be based on digital encoding techniques (e.g. MPEG-4 stan-dard [6]), which achieve high compression ratios, by exploiting the spatial and tempo-ral redundancy in video sequences. However, digital encoding causes image artifacts, which result in perceived quality degradation. Due to the fact that the parameters with strong influence on the video quality are normally those, set at the encoder (with most important the bit rate, the frame rate and the resolution), the issue of the user satisfac-tion in correlation with the encoding parameters has been raised.
Dissertation Advisor: Dimitris Martakos, Assoc. Professor
One of the 3G/4G visions is the provision of audiovisual content at various quali-ty and price levels [17]. There are many approaches to this issue, one being the Per-ceived Quality of Service (PQoS) concept. The evaluation of the PQoS for audiovi-sual content will provide a user with a range of potential choices, covering the possi-bilities of low, medium or high quality levels. Moreover the PQoS evaluation gives the service provider and network operator the capability to minimize the storage and network resources by allocating only the resources that are sufficient to maintain a specific level of user satisfaction.
The evaluation of the PQoS is a matter of objective and subjective evaluation procedures, each time taking place after the encoding process (post-encoding evalua-tion). Subjective quality evaluation processes of video streams (PQoS evaluation) require large amount of human resources, establishing it as a time-consuming process (e.g. large audiences evaluating video/audio sequences) [14]. Objective evaluation methods, on the other hand, can provide PQoS evaluation results faster, but require large amount of machine resources and sophisticated apparatus configurations. To-wards this, objective evaluation methods are based and make use of multiple metrics [18], which are related to the content’s artifacts (i.e. tilling, blurriness, error blocks, etc.) resulting from the encoding process [19].
This paper presents a quantified PQoS assessment method for MPEG-4 video en-coded sources, which provides pre-encoding PQoS estimation based on a single me-tric experimentally derived from the Spatial and Temporal (S-T) activity level of a given video content. The pre-encoding nature of the proposed method alleviates both the machine resource requirements and the time consumption of the already existing post encoding methods, making PQoS evaluation quick, easy and economically af-fordable for 3G/4G commercial implementations.
Towards this, a quality meter tool was used [9], providing objective PQoS results (based on multiple metrics) for each frame within a video clip. Initially, such objective PQoS results were obtained for a short homogeneous MPEG-4 video of specific en-coding parameters (i.e. encoding bit-rate, resolution). The graphical representation of these results vs. time, demonstrated the instant PQoS of each frame within the video clip, besides indicating the Mean PQoS (MPQoS) of the entire video (for the whole clip duration). Similar experiments were conducted for the MPQoS calculation of the same video content, each time applying different encoding parameters. The results of these experiments were used to draw-up experimental curves of the MPQoS of the given video content, as a function of the encoding parameters. The same procedure was applied for a set of video sequences, each one with different S-T activity level. Comparison of these experimental curves with those resulting from the theoretical algebraic benefit functions [10], [16] indicated a qualitative similarity among them, proving therefore the validity of the MPQoS as a metric for objective quality evalua-tion. A generalized approach to the above theoretical model is given in [10], where the algebraic benefit function is used to represent the user satisfaction in correlation with the allocated resources of competitive multimedia services. The term benefit function was introduced in [16] and represents the grade of the user satisfaction resulting from the use of a specific set of QoS and resource parameters.
Furthermore, this paper shows that the experimental MPQoS vs. bit rate curves can be successfully approximated by a group of exponential functions, which confine

the QoS characteristics of each individual video test sequence to three parameters that form the Quality Vector (QV) of the specific clip. Showing that these parameters are correlated, it can be concluded that the experimental measurement of just one of them, for a given short video clip, is sufficient for the determination of the other two. In this way, a single measurement of the MPQoS is sufficient for the analytical determination of the MPQoS vs. Bit rate curve for a given video clip. As a result, the proposed me-tric can be also used as a criterion for pre-encoding decisions, concerning the encod-ing parameters to be set for satisfying a certain PQoS, in respect to a given S-T activi-ty level of a video sequence.
Following this introductory section, the rest of the paper is organised as follows: In section II the bibliographic background of the PQoS evaluation is presented. In section III the Perceived Quality Meter tool is presented, while Section IV describes the variation of the MPQoS (obtained by the quality meter tool) as a function of the encoding bit rate. Section V presents the exponential approximation of the MPQoS vs. Bit rate curves, and Section VI describes the proposed method for objective PQoS evaluation based on a single metric. Section VII tests the proposed method on non-homogeneous media clips and finally, section VIII concludes the paper.
2 BACKGRROUND & RELATED WORK
Over the last years, with the increased popularity of multimedia applications (i.e. video on demand, streaming services, multimedia conference), emphasis has been put on developing methods and techniques for evaluating the perceived quality of video content.
The methods and techniques that have been proposed in the bibliography can be sorted into two groups:
- The assessment methods that their scope is the determination of the encod-ing settings (i.e. resolution, frame rate, bit rate), which are required in or-der to carry out successfully the communication task of a multimedia ap-plication (i.e. video conference). In other words, the scope of these me-thods is the estimation of the adequate video quality level for a particular multimedia communication task.
- The assessment methods that their aim is the evaluation of the quality level of a media clip based on the detection of artifacts on the signal caused by the encoding process. In contrast with the methods of the previous catego-ry, the scope of these methods is not the determination of the adequate lev-el, but the classification of a video content at a perceived quality scale.
The methods of the first group in order to determine the adequate quality level for a specific multimedia application, take under consideration a great number of parame-ters and metrics that depend on the task nature and the user emotional behavior [12]. For example the classification of the task as foreground or background in correlation with its complexity [3], is a parameter that differentiates the quality demands of a multimedia application. On the other hand, the emotional content of a multimedia
communication task alters the required quality level of the specific communication service [13]. Due to this, various parameters are measured in order to estimate the appropriate minimum quality level of a multimedia application. Such parameters are:
- The user characteristics (i.e. knowledge background, language back-ground, familiarity with the task, age)
- The situation characteristics (i.e. geographical remoteness, simultaneous number of users, distribution of users)
- The user cost (i.e. heart rate, blood volume pulse)- The user behavior (i.e. eye tracking, head movement) However, these methods have still some issues to solve on technical, theoretical
and practical level. A user that participates in such an assessment procedure is wired at so many points on the body (even on the head may wear the eye tracking equip-ment), which causes uncomfortable feelings and affects its behaviour. Technical is-sues, such as the eye tracking loss and the manual calibration/correction by a human operator, affect the reliability of the methods in real time environments [12].
The methods of the second group, which aim at ranking the video quality of a media clip based on the detection of visual artifacts caused by the encoding process, are mainly categorized into two classes: The subjective and objective ones.
The subjective test methods, which have mainly been proposed by International Telecommunications Union (ITU) and Video Quality Experts Group (VQEG), involve an audience of people, who watch a video sequence and score its quality as perceived by them, under specific and controlled watching conditions. Afterwards, the statistical analysis of the collected data is used for the evaluation of the perceived quality. The Mean Opinion Score (MOS) is regarded as the most reliable method of quality meas-urement and has been applied on the most known subjective techniques: The Single Stimulus Continue Quality Evaluation (SSCQE) and the Double Stimulus Continue Quality Evaluation (DSCQE) [7], [1], [14]. However the MOS method is inconvenient due to the fact that the preparation and execution of subjective tests is costly and time consuming and its implementation today is limited to scientific purposes, especially at VQEG experiments.
For this reason, a lot of effort has recently been focused on developing cheaper, faster and easier applicable objective evaluation methods. These techniques success-fully emulate the subjective quality assessment results, based on criteria and metrics that can be measured objectively. The objective methods are classified, according to the availability of the original video signal, which is considered to be in high quality.
The majority of the proposed objective methods in the literature requires the un-distorted source video sequence as a reference entity in the quality evaluation process, and due to this are characterized as Full Reference Methods [18], [26]. These methods are based on an Error Sensitivity framework with most widely used metrics the Peak Signal to Noise Ratio (PSNR) and the Mean Square Error (MSE).
PSNR =10log10 MSE
2L,
where L denotes the dynamic pixel value (i.e. equal to 255 for 8bits/pixel monotonic signal) (1)

MSE =
N
i
ii yxN 1
2)(1
,
where N denotes the number of pixels, and xi /yi the ith pixel value in the original/distorted signal (2)
However, these overused metrics have seriously been criticized that they do not provide reliable measurements of the perceived quality [21]. For this reason, a lot of effort has been focused on developing assessment methods that emulate characteristics of the Human Visual System (HVS) [25], [4], [2], [8] using Contrast Sensitivity Func-tions (CSF), Channel Decomposition, Error Normalization, Weighting and finally Minkowski error pooling for combining the error measurements into a single per-ceived quality estimation. An analytical description of the framework, which these methods use, can be found in [22].
However it has been reported [21], [20] that these complicated methods do not provide more accurate results than the simple mathematical measures (such as PSNR). Due to this some new full reference metrics that are based on the video structural distortion, and not on error measurement, have been proposed [23], [24].
On the other hand, the fact that these methods require the original video signal as reference deprives their use in commercial video service applications, where the initial undistorted clips are not accessible. Moreover, even if the reference clip is available, then synchronization predicaments between the undistorted and the distorted signal (which may have experienced frame loss) make the implementation of the Full Refer-ence Methods difficult and impractical.
Due to these reasons, the recent research has been focused on developing meth-ods that can evaluate the PQoS level based on metrics, which use only some extracted structural features from the original signal (Reduced Reference Methods) [5] or do not require any reference video signal (No Reference Methods) [11], [9].
However, due to the fact that the 3G/4G vision is the provision of audiovisual content at various quality and price levels [17], there is great need for developing methods and tools that will help service providers to predict quickly and easily the PQoS level of a media clip. These methods will enable the determination of the spe-cific encoding parameters that will satisfy a certain quality level. All the aforemen-tioned post-encoding methods may require repeating tests in order to determine the encoding parameters that satisfy a specific level of user satisfaction. This procedure is time consuming, complex and impractical for implementation on the 3G/4G multime-dia mobile applications.
In this context, this paper presents a novel objective evaluation method, which will enable the pre-encoding estimation of the PQoS level for MPEG-4 coded video clips, alleviating therefore the time and procedure requirements of the already existing methods.

3 PERCEIVED QUALITY METER TOOL
A software implementation, which is representative of the non-reference objective evaluation class, is the Quality Meter Software (QMS) that was used in this paper [9]. The QMS tool measures objectively the instant PQoS level (in a scale from 1 to 100) of digital video clips. Since it belongs to the non-reference class, its use is quick and easy. The evaluation algorithm of the QMS is based on vectors, which contain infor-mation about the averaged luminance differences of adjacent pixels.
The high compression during the MPEG-4 encoding process, results in loss of high frequency Discrete Cosine Transformation (DCT) coefficients. Within an MPEG-4 block (8x8 pixels), the luminance differences and discontinuities between any pair of adjacent pixels are reduced, by the encoding and compression process. On the contrary, for all the pairs of adjacent pixels, which are located across and on both edge sides of the border of adjacent DCT blocks, the luminance discontinuities are increased, by the encoding process.
More specifically, the average luminance differences of the previously referred pixel pairs depend on the encoding parameters (mainly on the bit rate). This means that low bit rate results in significant tiling of the video clip, which finally causes PQoS degradation. Based on this fact, the QMS tool uses these luminance differences as an objective metric.
The average luminance L(x, y) average of a pixel, having plane coordinates (x,y), can be computed by the surrounding K x K adjacent pixels [18] using the following equation (3):
L(x, y) average= KxK
1
2/
2/
K
Ki
2/
2/
),(K
Kj
jyixL (3)
In the case of QMS, the above equation is specialized setting K equal to 2, which results in taking in consideration the luminance values of the first neighbouring pixels only.
The validity of the specific QMS has been assessed by comparing quality evalua-tion results, derived from the QMS, to corresponding subjective quality assessment results, which were deduced by a Single Stimulus Continues Quality Evaluation (SSCQE) test procedure. This comparison [9] proved that the QMS tool, despite the fact that it is based on a simple algorithm, emulates successfully the corresponding subjective quality assessment test.

Figure 1. The instant PQoS of the Mobile & Calendar clip with CIF resolution derived from the Quality Meter Software
Figure 1 depicts an example measurement of the instant PQoS, derived from the specific QMS for the well known video clip Mobile & Calendar, which was encoded using the MPEG-4 standard (Simple Profile) at 800 Kbps (Constant Bit Rate) with Common Interface Format (CIF) resolution, key-frame period equal to 100 frames and 25 frames per second (fps). The instant PQoS vs. time curve (where time is represen-ted by the frame sequence) varies according to the S-T activity of each frame. For frames with high complexity the instant PQoS level drops, while for frames with low S-T activity the instant PQoS is higher. Such instant PQoS vs. time curves, derived by the above QMS, can be used to characterize and categorize a short video clip accor-ding to its content. Introducing the concept of the Mean PQoS (MPQoS), the average PQoS of the entire video sequence, over the whole duration of a short clip, can be used as a metric for ranking it into a perceived quality scale.
MPQoS =N
N
i
i1
PQoSInstant , where N denotes the total frames of the test signal
(4)
For example, considering three quality categories, defined as low, medium and high (the corresponding ranges can be set at 70-80, 80-90 and 90-100), the video clip with instant PQoS curve being that of figure 1, has MPQoS equal to 80.4 and can be ranked and categorized as a medium quality video clip. The limits of the quality cate-gories can be specified according to the needs of the service provider.

4 VARIATION OF MPQoS AS A FUNCTION OF THEENCODING BIT RATE.
In order to specify the variation of the MPQoS vs. the encoding bit rate and the Spa-tial and Temporal activity level (as is indicated by the graphical representation of the instant PQoS vs. time derived from the QMS software tool), four short in duration test sequences, which are representative of specific Spatial and Temporal activity levels, were used. These well known video clips are shown in table 1.
Table 1. The test video sequences
The Spatial and Temporal (S-T) activity level of a video clip is crucial for the en-coding efficiency and the achieved perceived quality, because video coding methods exploit both temporal and spatial redundancy in order to achieve compression of the video data. Due to the fact that temporally adjacent frames are quite similar and there-fore highly correlated (temporal correlation), the video encoder attempts to compress video data by exploiting this temporal redundancy. In the spatial domain, the encoder exploits the high correlation between neighbouring pixels (spatial correlation), and makes prediction of them based on neighbouring samples. [15]
Therefore, in this paper the term Spatial and Temporal Activity level is used in order to express the dynamics of the video content, which affect the correlation level on the Spatial and Temporal domain. Media clips with static content (i.e. talk shows, debates etc.) have low Spatial and Temporal activity level in contrast with media clips with active, quick and complex scenes (i.e. sport events, action scenes), which corre-spond to high Spatial and Temporal activity level. The test signals of Table 1 cover a wide range of the Spatial and Temporal activity scale.
For the experimental needs of this paper, each test video clip of Table 1, was transcoded from its original MPEG-2 format at 12 Mbps with PAL resolution and 25 fps to ISO MPEG-4 (Simple Profile) format, at different constant bit rates (spanning a range from 50kbps to 1.5Mbps for CIF (Common Intermediate Format) and 20kbps to 800kbps for QCIF (Quarter Common Intermediate Format), with key-frame period equal to 100 frames in both cases). For each corresponding bit rate, a different ISO MPEG-4 compliant file with CIF resolution (352x288) and QCIF resolution (176x144) respectively was created. The frame rate was set at 25 frames per second (fps) for the transcoding process in all test videos.
Clip 1Low
Spatial & TemporalActivity Level
|MediumSpatial &
TemporalActivity Level
|High
Spatial & TemporalActivity Level
Suzie
Clip 2 Cactus
Clip 3 Flower Garden
Clip 4Mobile & Ca-
lendar
Each ISO MPEG-4 video clip was then used as input in the QMS tool. From the resulting instant PQoS vs. time graph (like the one in figure 1), the MPQoS value of each clip was calculated. This experimental procedure was repeated for each video clip in CIF and QCIF resolution.
The results of these experiments for the test signals with CIF resolution are de-picted in figure 2, where PQL denotes the lowest acceptable MPQoS level (corres-ponding to 70 in the scale from 1 to 100 for CIF resolution) and PQH denotes the best MPQoS level that each video can reach. Respectively, figure 3 depicts the results for the test sequences with QCIF resolution, where PQL corresponds to 40 in the hundred scale (the PQL value in the QCIF case corresponds to approximately 40% quality degradation comparing to the PQL value of the CIF case, because of the lower resolu-tion). Comparing the curves of figures 2 and 3, it is deduced that lower resolution (QCIF) results in MPQoS curves that reach faster and at lower bit rates their PQH
values, which are degraded in comparison with the corresponding PQH values of high-er (CIF) resolution curves.
Referring to the curves of figure 2 (or 3), the following remarks can be made:
1. The minimum bit rate (BRL), which corresponds to the lowest acceptable MPQoS level (PQL), depends on the S-T activity level of the video clip.
2. The variation of the MPQoS vs. bit rate is an increasing function, but non lin-ear. Moreover, the quality improvement of an encoded video clip is not signifi-cant for bit rates higher than a specific threshold. This threshold depends on the S-T activity of the video content.
Comparing the experimental curves of figures 2 and 3 to those resulting from the theoretical algebraic benefit functions, described in [10], qualitative similarity among them is noticed. Thus, the experimental curves, which were derived from the QMS tool, are qualitatively very similar to the theoretically expected, proving therefore their validity. A quantitative comparison is not possible, because benefit function is very general and refers to a number of different parameters in both the horizontal and verti-cal axes. Mapping user satisfaction and allocated resources of the general algebraic benefit function model to MPQoS level and encoding bit rate respectively, the ex-perimental curves offer a quantitative approach of the theoretical ones, which can be useful in practical and commercial applications.
Moreover, it is of great importance (based on the above mapping) the fact that the algebraic benefit function is not identical for all the types of audiovisual (AV) content, but it comprises a set of curves that follow the same basic shape. This provides a mul-ti-dimensional characteristic to the benefit function. The differentiation among these curves comes from their slope and position on the benefit-resource plane, which de-pend on the S-T activity of the video content. Thus, the curve has low slope and trans-poses to the lower-right area of the benefit-resource plane, for AV content of high S-T activity. On the contrary, the curve has high slope and transposes to the upper-left area, for low S-T activity content.

Figure 2. The MPQoS vs. Bit rate curves for CIF resolution
Figure 3. The MPQoS vs. Bit rate curves for QCIF resolution
Practically, the transposition of the curve to the upper-left area means that content with low S-T activity (e.g. a talk show) reaches a better PQoS level at relatively lower bit rate in comparison with a video content with high S-T activity. In addition, when the encoding bit rate decreases below a threshold, which depends on the video con-tent, the PQoS practically “collapses”. On the other hand, the transposition of the curve to the lower-right area means that content with high S-T activity (e.g. a football match) requires higher bit rate in order to reach a satisfactory PQoS level. Neverthe-less, it reaches its maximum PQoS value more smoothly than in the low S-T activity case.
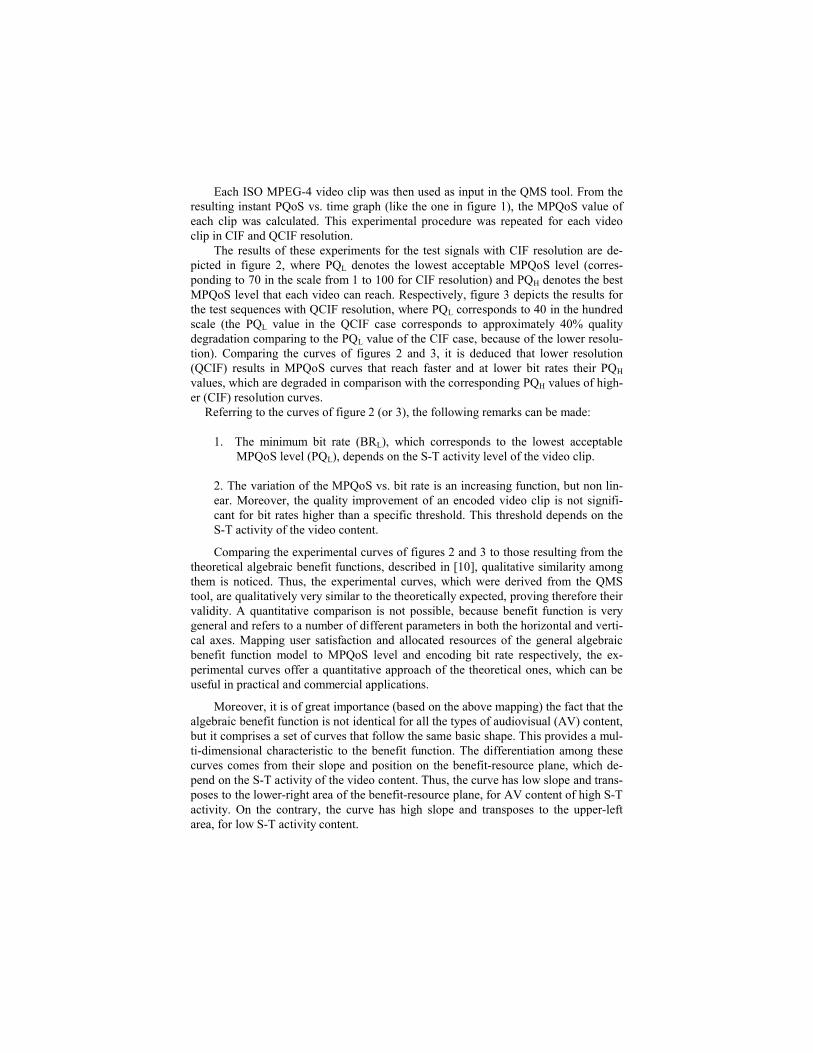
In this context, the MPQoS vs. Bit rate curves were also drawn for a set of media clips, which were captured from common television programs in DV (Digital Video) PAL format and encoded at CIF resolution following exactly the same encoding pro-cedure as described previously. The video clips had relatively homogeneous content (i.e. talk show, football, swimming, speech etc.) with duration spanning from 15
seconds up to 60 seconds. Performing numerous experiments, it was deduced that the shape of the derived MPQoS vs. Bit rate curves was similar for a specific content (independently of the clip duration), having maximum matching error in all casesbelow 3%.
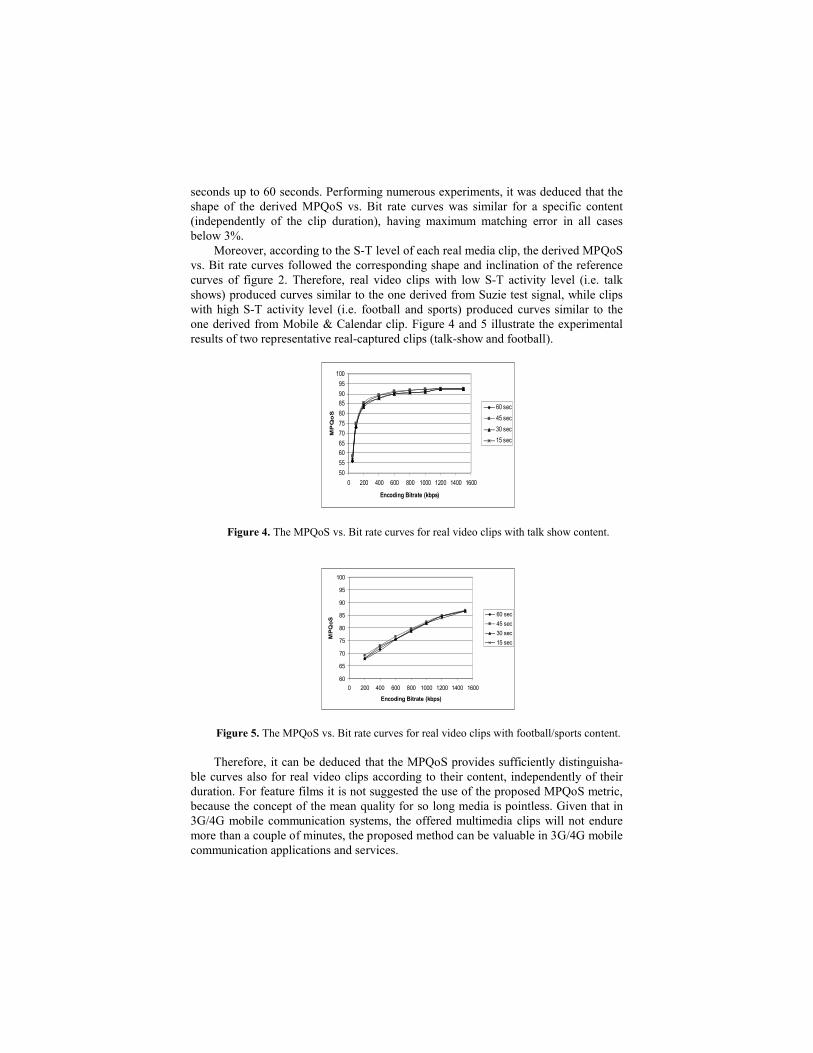
Moreover, according to the S-T level of each real media clip, the derived MPQoS vs. Bit rate curves followed the corresponding shape and inclination of the reference curves of figure 2. Therefore, real video clips with low S-T activity level (i.e. talk shows) produced curves similar to the one derived from Suzie test signal, while clips with high S-T activity level (i.e. football and sports) produced curves similar to the one derived from Mobile & Calendar clip. Figure 4 and 5 illustrate the experimental results of two representative real-captured clips (talk-show and football).
50
55
6065
70
75
80
8590
95
100
0 200 400 600 800 1000 1200 1400 1600
Encoding Bitrate (kbps)
MP
Qo
S
60 sec
45 sec
30 sec
15 sec
Figure 4. The MPQoS vs. Bit rate curves for real video clips with talk show content.
60
65
70
75
80
85
90
95
100
0 200 400 600 800 1000 1200 1400 1600
Encoding Bitrate (kbps)
MP
Qo
S
60 sec
45 sec
30 sec
15 sec
Figure 5. The MPQoS vs. Bit rate curves for real video clips with football/sports content.
Therefore, it can be deduced that the MPQoS provides sufficiently distinguisha-ble curves also for real video clips according to their content, independently of their duration. For feature films it is not suggested the use of the proposed MPQoS metric, because the concept of the mean quality for so long media is pointless. Given that in 3G/4G mobile communication systems, the offered multimedia clips will not endure more than a couple of minutes, the proposed method can be valuable in 3G/4G mobile communication applications and services.
5 EXPONENTIAL APPROXIMATION OF MPQoS vs. BIT RATE CURVES.
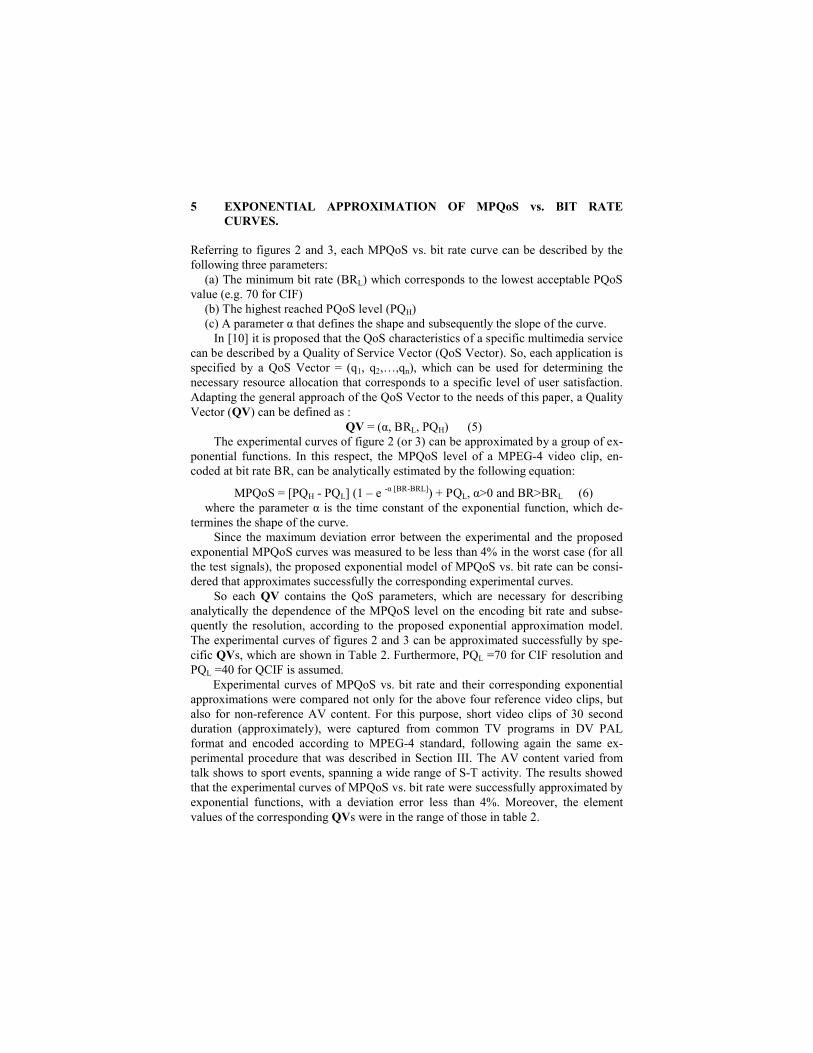
Referring to figures 2 and 3, each MPQoS vs. bit rate curve can be described by the following three parameters:
(a) The minimum bit rate (BRL) which corresponds to the lowest acceptable PQoS value (e.g. 70 for CIF)
(b) The highest reached PQoS level (PQH) (c) A parameter α that defines the shape and subsequently the slope of the curve.
In [10] it is proposed that the QoS characteristics of a specific multimedia service can be described by a Quality of Service Vector (QoS Vector). So, each application is specified by a QoS Vector = (q1, q2,…,qn), which can be used for determining the necessary resource allocation that corresponds to a specific level of user satisfaction. Adapting the general approach of the QoS Vector to the needs of this paper, a Quality Vector (QV) can be defined as :
QV = (α, BRL, PQH) (5)The experimental curves of figure 2 (or 3) can be approximated by a group of ex-
ponential functions. In this respect, the MPQoS level of a MPEG-4 video clip, en-coded at bit rate BR, can be analytically estimated by the following equation:
MPQoS = [PQH - PQL] (1 – e -α [BR-BRL]) + PQL, α>0 and BR>BRL (6)where the parameter α is the time constant of the exponential function, which de-
termines the shape of the curve.Since the maximum deviation error between the experimental and the proposed
exponential MPQoS curves was measured to be less than 4% in the worst case (for all the test signals), the proposed exponential model of MPQoS vs. bit rate can be consi-dered that approximates successfully the corresponding experimental curves.
So each QV contains the QoS parameters, which are necessary for describing analytically the dependence of the MPQoS level on the encoding bit rate and subse-quently the resolution, according to the proposed exponential approximation model. The experimental curves of figures 2 and 3 can be approximated successfully by spe-cific QVs, which are shown in Table 2. Furthermore, PQL =70 for CIF resolution and PQL =40 for QCIF is assumed.
Experimental curves of MPQoS vs. bit rate and their corresponding exponential approximations were compared not only for the above four reference video clips, but also for non-reference AV content. For this purpose, short video clips of 30 second duration (approximately), were captured from common TV programs in DV PAL format and encoded according to MPEG-4 standard, following again the same ex-perimental procedure that was described in Section III. The AV content varied from talk shows to sport events, spanning a wide range of S-T activity. The results showed that the experimental curves of MPQoS vs. bit rate were successfully approximated by exponential functions, with a deviation error less than 4%. Moreover, the element values of the corresponding QVs were in the range of those in table 2.

Table 2. Quality Vector elements that correspond to test sequences for CIF and QCIF cases
6 FAST EVALUATION OF THE QV ELEMENTS
The accurate determination of the bit rate that results in a desired MPQoS level enables the better utilization of the storage capacity and also of the bandwidth alloca-tion during the transmission of AV content. Due to the fact that the specified encodingbit rate is exactly the one that corresponds to a certain quality level, there is no waste in the storage or bandwidth resources. part from this, methods for estimating the varia-tion of MPQoS vs. bit rate are very important to the 3G/4G mobile communication systems, because they help towards the evolution of a consumer mass market, where the service provider will offer AV content at various quality levels, among which the consumer will be able to choose the one, at which he/she prefers to watch it.
Practically, in order to achieve this, and given a short video clip, first it must be categorized according to its content. Afterwards, it must be encoded at the appropriate bit rates that satisfy the diverse perceived quality levels and finally stored in a server. Today, the determination of the bit rates, which correspond to the various quality levels, can be achieved only by multiple repeating post-encoding measurements of the MPQoS at various bit rates. Since this is a complicated and time consuming process, an alternative simple and fast pre-encoding evaluation method is proposed, based on the use of the QV elements (BRL, PQH and α) of a specific video clip.
Furthermore, showing that these elements are correlated, the evalua-tion/determination of only one of them for a given video clip is sufficient to accurately determine the other two and ultimately deduce the corresponding exponentially ap-proximated PQoS vs. Bit rate curve. he correlation among the three QV elements can
Test Se-quence
αBRL
(Kbps)PQH (Quali-ty Units)
Suzie (MPEG-4 CIF)
0.0083
95 93.91
Cactus (MPEG-4 CIF)
0.0063
110 90.89
Flower (MPEG-4 CIF)
0.0056
200 87.62
Mobile (MPEG-4 CIF)
0.0045
400 86.20
Suzie (MPEG-4 QCIF)
0.013
22 93.50
Cactus (MPEG-4 QCIF)
0.007
55 71.04
Flower (MPEG-4 QCIF)
0.006
65 64.79
Mobile (MPEG-4 QCIF)
0.005
300 57.32

be derived experimentally. Considering the four test video clips of table 1, which cover a wide range of S-T activity level, the variation of their QV elements vs. the S-T activity level is depicted in figure 6, for the case of MPEG-4 (Simple Profile) and CIF resolution. Similar curves can be derived for the case of QCIF resolution. According to figure 6, it is obvious that there is interdependence between the elements, so if one out of the three QV elements is specified for a given video clip, then the other two can be accurately determined.
Among the three elements, PQH is the most convenient to be experimentally cal-culated, given that the variation of MPQoS vs. Bit rate is exponentially approximated. Using the QMS tool, which was described in Section III, one only measure-ment/estimation of the MPQoS at a high encoding bit rate is sufficient for the accurate determination of the PQH value for a given video clip. The consequent steps are sim-ple: Using the estimated PQH value and the reference curves of figure 6, the corres-ponding values of BRL and α can be graphically extrapolated. Thus, having defined the three QV elements, the analytical exponential expression of the MPQoS vs. Bit rate can be deduced using equation (6).
In order to succeed an analytical approach, the experimental dependence of Pa-rameter α, BRL and PQH on the S-T level (figure 6) can be successfully described by
power series of the polynomial form
0k
kk xb = b0 + b1x + b2x
2 + b3x3 +…, where b0,
b1,… are real number constants. For the purposes of this paper, only the first three terms of the power series are used, which provide a satisfying degree of accuracy for the approximation of the experimental data (bold curves of figure 6).
Figure 6. The variation of the QV elements
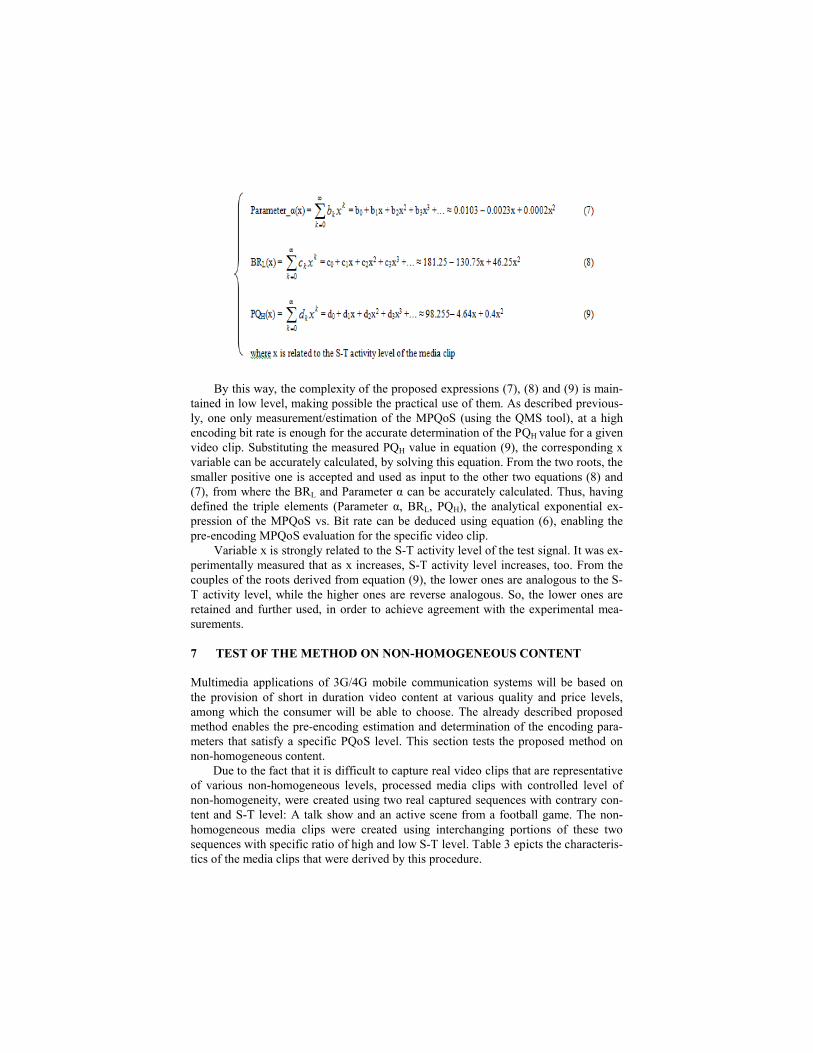
By this way, the complexity of the proposed expressions (7), (8) and (9) is main-tained in low level, making possible the practical use of them. As described previous-ly, one only measurement/estimation of the MPQoS (using the QMS tool), at a high encoding bit rate is enough for the accurate determination of the PQH value for a given video clip. Substituting the measured PQH value in equation (9), the corresponding x variable can be accurately calculated, by solving this equation. From the two roots, the smaller positive one is accepted and used as input to the other two equations (8) and (7), from where the BRL and Parameter α can be accurately calculated. Thus, having defined the triple elements (Parameter α, BRL, PQH), the analytical exponential ex-pression of the MPQoS vs. Bit rate can be deduced using equation (6), enabling the pre-encoding MPQoS evaluation for the specific video clip.
Variable x is strongly related to the S-T activity level of the test signal. It was ex-perimentally measured that as x increases, S-T activity level increases, too. From the couples of the roots derived from equation (9), the lower ones are analogous to the S-T activity level, while the higher ones are reverse analogous. So, the lower ones are retained and further used, in order to achieve agreement with the experimental mea-surements.
7 TEST OF THE METHOD ON NON-HOMOGENEOUS CONTENT
Multimedia applications of 3G/4G mobile communication systems will be based on the provision of short in duration video content at various quality and price levels, among which the consumer will be able to choose. The already described proposed method enables the pre-encoding estimation and determination of the encoding para-meters that satisfy a specific PQoS level. This section tests the proposed method on non-homogeneous content.
Due to the fact that it is difficult to capture real video clips that are representative of various non-homogeneous levels, processed media clips with controlled level of non-homogeneity, were created using two real captured sequences with contrary con-tent and S-T level: A talk show and an active scene from a football game. The non-homogeneous media clips were created using interchanging portions of these two sequences with specific ratio of high and low S-T level. Table 3 epicts the characteris-tics of the media clips that were derived by this procedure.

ClipsTotal Talk Show
Duration (sec)Total Football
Duration (sec)Ratio
Talk/FootballClip 1 120 0 ∞Clip 2 105 15 7.00Clip 3 90 30 3.00Clip 4 75 45 1.67Clip 5 60 60 1.00Clip 6 45 75 0.60Clip 7 30 90 0.33Clip 8 15 105 0.14Clip 9 0 120 0.00
Table 3 The characteristics of the non-homogeneous media clips
The two real captured sequences (talk show and football) were edited in their original format (DV PAL) in order to produce the final non-homogeneous clips of Table 4. Afterwards, the edited DV clips were encoded with ISO MPEG-4 (Simple Profile) format, at different constant bit rates (spanning a range from 200kbps to 1.5Mbps and key-frame period equal to 100 frames). For each corresponding bit rate, a different ISO MPEG-4 compliant file with CIF (Common Intermediate Format) resolution (352x288) was created. The frame rate was set at 25 frames per second (fps) for all the test signals.
Each ISO MPEG-4 video clip was then used as input in the QMS tool. From the resulting instant PQoS vs. time graph (like the one in figure 1), the MPQoS value of each clip was calculated, following exactly the same procedure, like the one that was described in section IV. The derived MPQoS vs. bit rate curves of this procedure are depicted on figure 7 and are very similar to the reference curves of figure 2, consider-ing similar level of S-T activity level.
6971737577798183858789919395
0 200 400 600 800 1000 1200 1400 1600
kbps
MP
Qo
S
Clip 1
Clip 2
Clip 3
Clip 4
Clip 5
Clip 6
Clip 7
Clip 8
Clip 9
Figure 7. The experimental MPQoS vs. Bit rate curves for non-homogeneous media clips

Table 4 Mean errors of the predicted MPQoS vs. Bit rate curves for non-homogeneous media clips
Afterwards for each clip of table 3 the proposed technique was applied. The de-rived estimated MPQoS vs. Bit rate curves were compared to the experimental ones of figure 7 and table 4contains the corresponding mean error for each clip.
According to Table 5, it is shown that the proposed method predicted successful-ly the MPQoS vs. bit rate curves, even for media clips with non-homogeneous video content with a worst case mean error equal to 4.364%. Therefore, the proposed me-thod is valid and provides reliable results also for video clips with non-homogeneous content.
Moreover, the proposed technique was also tested on a set of 20 real captured video clips, containing various non-homogeneous video contents, with duration span-ning from 2 minutes up to 10 minutes. These video clips were captured in DV PAL format from common TV programs. Following again the same encoding procedure as previously, ISO MPEG-4 compliant files were produced for each real captured DV test clip. Afterwards, the experimental and theoretical (according to the proposed method) MPQoS vs. Bit rate curves were derived for each media clip.
The worst case mean error between the experimentally and theoretically derived MPQoS curves for the twenty real captured videos was measured to be equal to 4.08%. This error is lower than the worst case error (4.364%) of the specially edited non-homogeneous media clips, proving that the proposed method can be also applied successfully on real video clips with non-homogeneous content.
Figure 8. The PDF of Instant PQoS for non-homogeneous clips

In order to examine the variation of the instant PQoS for non-homogeneous me-dia clips, the Probability Density Function (PDF) for all the non-homogeneous clips of Table 4 was drawn. Figure 8 illustrates the corresponding PDF, where it is observed that the values of instant PQoS are highly concentrated around the MPQoS (i.e. 86.93), with a Standard Deviation equal to 8.7. The probability of unacceptable quali-ty, i.e. instant PQoS values below 70 (grey area in figure 8), is approximately equal to 0.0375. Therefore, the fluctuation of instant PQoS around MPQoS does not signifi-cantly affect the accuracy of the MPQoS metric. However, it must be noted that in the proposed method the MPQoS is used for bit rates that generate relatively high/accepted PQoS levels (i.e. MPQoS>70). The case of lower encoding bit rates, which correspond to low/unaccepted MPQoS values, is not examined in this paper, because such low quality levels are not commercially worthy and are not expected to be offered in the upcoming 3G/4G services.
8 CONCLUSIONS
Existing hardware/software perceived quality meters provide post encoding measure-ments of instant PQoS vs. time variation for a video content. In this paper, the mean PQoS (MPQoS), for the whole duration of a video clip, is proposed as a metric that characterizes a video clip as a single entity. Experimental MPQoS vs. Bit rate curves (derived from experimental measurements of the instant PQoS) compared qualitative-ly to the theoretical curves of benefit function vs. allocated resources, showing simi-larity in their shape and therefore proving the validity of the experimental ones. Fur-thermore, a mapping of the user satisfaction and allocated resources of the theoretical benefit function model to MPQoS and bit rate respectively, reveals that the algebraic benefit function is not identical for all the types of AV content. Instead of this, the benefit function is a multi-dimensional entity, which can be analyzed in a set of curves, all following the same basic shape. This differentiation depends on the S-T activity level of the video content.
Moreover, the experimental MPQoS curves can be successfully approximated by a group of exponential functions, with a deviation error of less than 4%. This enables the analytical description of the MPQoS dependence on the encoding bit rate. Based on this, a method for fast pre-encoding estimation of the MPQoS level of a video clip is proposed, which allows the ranking of the clip according to the S-T activity of its content, enabling an optimized utilization in the corresponding storage and bandwidth resources.
References
[1] Th. Alpert and L. Contin, “DSCQE Experiment for the Evaluation of the MPEG-4 VM on Error Robustness Functionality”, ISO/IEC – JTC1/SC29/WG11, MPEG 97/M1604, 1997.[2] A. P. Bradley, “A Wavelet Difference Predictor”, IEEE Transactions on Image Processing. Vol. 5, pp. 717-730, 1999.

[3] W. Buxton, “Integrating the periphery and context: A new taxonomy of telematics”, in Proceedings of Graphics Interface 1995, pp. 239-246, 1995.[4] S. Daly, “The Visible Difference Predictor: An algorithm for the Assessment of Image Fidelity”, in Proceedings SPIE, Vol. 1616, pp. 2-15, 1992.[5] I. Pr. Guawan and M. Ghanbari, “Reduced-Reference Picture Quality Estimation by Using Local Harmonic Amplitude Information”, London Communications Symposium 2003.[6] ISO-IEC 14496 “MPEG-4 Coding of Audio Visual Objects” [7] ITU “Methology for the subjective assessment of the quality of television pictures”, Rec-ommendation ITU-R BT.500-10, 2000.[8] Y. K. Lai and J. Kuo, “A Haar Wavelet Approach to Compressed Image Quality Measure-ment”, Journal of Visual Communication and Image Understanding, Vol. 11, pp. 81-84, 2000.[9] J. Lauterjung, “Picture Quality Measurement”, Proceedings of the International Broadcast-ing Convention (IBC), Amsterdam, 1998, pp. 413-417. [10] W. Lee and J. Srivastava, “An Algebraic QoS-Based Resource Allocation Model for Competitive Multimedia Applications”, International Journal of Multimedia Tools and Appli-cations, Kluwer Editions, Vol. 13, pp. 197-212, 2001.[11] L. Lu, Z. Wang, A. C. Bovik and J. Kouloheris, “Full-reference video quality assessment considering structural distortion and no-reference quality evaluation of MPEG video”, IEEE International Conference on Multimedia, 2002.[12] J. Mullin, L. Smallwood, A. Watson and G. Wilson, “New techniques for assessing audio and video quality in real-time interactive communications” Third International Workshop on Human Computer Interaction with Mobile Devices, Lille, France, 2001.[13] J. Olson, “In a framework about task-technology fit, what are the tasks features”, Proceed-ings of CSCW ’94: Workshop on video mediated communication: Testing, Evaluation & De-sign Implications, 1994.[14] F. Pereira and T. Alpert, “MPEG-4 Video Subjective Test Procedures and Results”, IEEE Transactions on Circuits and Systems for Video Technology. Vol. 7(1), pp. 32-51, 1997.[15] I. G. Richardson, H.264 and MPEG-4 Video Compression : Video Coding for Next Gen-eration Multimedia, Wiley, 2003. [16] B. Sabata, S. Chatterjee and J. Sydir, “Dynamic Adaptation of Video for Transmission under Resource Constraints”, International Conference of Image Processing, Chicago, October 1998.[17] P. Seeling, M. Reisslein and B. Kulapala, “Network Performance Evaluation Using Frame Size and Quality Traces of Single Layer and Two Layer Video: A Tutorial”, IEEE Communica-tions Surveys, Volume 6, No. 3, Third Quarter 2004.[18] K. T. Tan and M. Ghanbari, “A Multi-Metric Objective Picture Quality Measurements Model for MPEG Video”, IEEE Transactions on Circuits and Systems for Video Technology, Vol.10(7), pp. 1208-1213, 2000.[19] S. Voran and S. Wolf, “Objective Estimation of Video and Speech Quality to Support Network and QoS Efforts”, 2nd Quality of Service Workshop, Houston, Texas, February 2000. [20] VQEG. “Final Report From the Video Quality Experts Group on the Validation of Objec-tive Models of Video Quality Assessment”, http://www.vqeg.org. 2000.[21] Z. Wang, A. C. Bovik and L. Lu, “Why is Image Quality Assessment so Difficult”, Pro-ceedings IEEE International Conference in Accoustics, Speech and Signal Processing, Vol. 4, pp. 3313-3316, 2002. [22] Z. Wang, H. R. Sheikh and A. C. Bovik, Objective Video Quality Assessment. The Hand-book of Video Databases: Design and Applications, B. Furht and O. Marqure, CRC Press, pp. 1041-1078, 2003.[23] Z. Wang, L. Lu, A. C. Bovik, “Video Quality Assessment Based on Structural Distortion Measurement”, Signal Processing: Image Communication, special issue on Objective video quality metrics, Vol. 19(2), pp. 121-132, 2004.

[24] Z. Wang, A. C. Bovik, H. R. Sheikh and E. P. Simoncelli, “Image quality assessment: From error visibility to structural similarity”, IEEE Transactions on Image Processing, Vol. 13(4), pp. 1-14, 2004.[25] A. B. Watson, J. Hu and J. F. McGowan, “DVQ: A Digital Video Quality Metric Based on Human Vision”, Journal of Electronic Imaging, Vol. 10(1), pp. 20-29, 2001. [26] St. Wolf and M. H. Pinson, “Spatial – Temporal Distortion Metrics for in-service Quality Monitoring of any Digital Video System”, SPIE International Symposium on Voice, Video, and Data Communications, Boston, 1999 pp. 11-22