method development for serial-extraction of contaminants...
TRANSCRIPT

Method development for serial-extraction
of contaminants in fish followed by
species comparison of PCB 153 levels in
Tench and Roach from Källby waste
water treatment pond
Julia Grönholdt Palm
2013
Supervisor: PhD student Marja Boström, Unit of Aquatic Ecology, Lund University, Sweden Co-Supervisor: Senior Lecturer Olof Berglund, Unit of Aquatic Ecology, Dept. of Biology, Lund University, Sweden
Environmental Science
Lund University
Sweden

1
Abstract
Two studies were performed in this paper. The first study was a method development examining the
possibilities to do a serial extraction of lipids, PCB 153, NSAIDs (non-steroidal anti-inflammatory
drugs) and selective serotonin reuptake inhibitors (SSRIs) from a single sample. Five different
treatments were tested with three replicates from each individual fish. All samples were first freeze-
dried and then the following treatments were executed: First sample series were only cut and PCB-
extracted, second sample series were cut, lipid-extracted and PCB-extracted, third sample series
were homogenized, filtered, lipid-extracted and PCB-extracted, forth sample series were
homogenized, freeze-dried, lipid-extracted and PCB-extracted and the fifth sample series were
homogenized, membrane-extracted, freeze-dried, lipid-extracted and PCB-extracted. The treatments
were assessed using an analysis of variance (ANOVA) with Tukey-Kramer post hoc tests. Results
showed that there was a significant effect of type of treatment (p=0.008) to the amount of extracted
lipids. Filtering treatment had a high standard deviation and low mean lipid yield implying that the
method is inappropriate for analytical studies. Freeze-drying was the best treatment after cutting
with almost as high lipid yields as the cutting treatment. The full membrane extraction treatment
however had a low lipid yield. A possible explanation is that the lipids were hydrolyzed from the acid
HP-LPME-treatment and therefore partly dissolved in the water phase. However this demands
further research and modeling.
The second study was a species comparison of PCB 153 concentrations in roach and tench from
Källby sewage treatment pond. The study’s main aim was to assess two species with different feed
and foraging behaviour’s tendency to accumulate PCBs. Lipids and PCB were extracted using the
cutting treatment (as above) and the results were then analysed for difference using a Mann-
Whitney test. The stable isotopes ∂13C and ∂15N were also measured and analysed using two sample,
unpaired, t-tests. Result showed that both ∂13C and ∂15N were higher in the tench. The species
comparison showed no significant results although after lipid normalization the roach indicated
higher concentrations of PCB 153 with a p-value of 0.072. The higher concentration of PCB in roach
could not be explained although one study in Poland assessing mercury had found similar results
(Misztal-Szkudlinska, 2008). Therefore the results are believed to be an effect of either inter- and
intra-species variations or possibly experimental flaws such as failure in assessing PCB yield from
tench or insufficient amount of replicates.

2
Table of Contents Abstract ................................................................................................................................................... 1
1. Introduction .................................................................................................................................... 3
1.1. Problem and aim ..................................................................................................................... 3
1.2. Method development for serial extraction .............................................................................. 3
1.3. Species comparison of PCB-levels in Roach and Tench ........................................................... 4
1.3.1. PCB .................................................................................................................................. 4
1.3.2. PCB-levels in Källby sewage treatment ponds ............................................................... 5
1.3.3. PCB accumulation in fish ................................................................................................ 5
1.3.4. Measuring of stable isotopes ......................................................................................... 6
2. Method ............................................................................................................................................ 6
2.1. Chemicals ................................................................................................................................. 6
2.2. Sample preparation and analysis ............................................................................................ 7
2.2.1. Method development for serial-extraction ........................................................................ 7
2.1.1.1. Slurry ............................................................................................................................ 7
2.1.1.2. Membrane extraction .................................................................................................. 7
2.1.1.3. Filtration ...................................................................................................................... 8
2.1.1.4. Freeze-drying ............................................................................................................... 8
2.1.1.5. Lipid extraction ............................................................................................................ 8
2.1.1.6. PCB-extraction and analysis ........................................................................................ 8
2.2.2. Species Comparison ............................................................................................................ 9
2.3. Statistical methods .................................................................................................................. 9
3. Results ........................................................................................................................................... 10
3.1. Method development for serial extraction ............................................................................ 10
3.2. Species Comparison ............................................................................................................... 11
4. Discussion ...................................................................................................................................... 12
4.1. Method development for serial extraction ............................................................................ 12
4.2. Species Comparison ............................................................................................................... 13
5. Conclusion ..................................................................................................................................... 15
References............................................................................................................................................. 15

3
1. Introduction
1.1. Problem and aim
In toxicological studies there is often a desire to study more than one contaminant but the amount of
samples available can be a limiting factor. This study will examine the possibility to do serial
extractions from a single sample. The contaminants that will be assessed were selected based on a
current PhD study by Marja Boström; “Uptake and bioaccumulation of ionisable pharmaceuticals in
aquatic organisms”. Boström is among other things studying bioaccumulation of non-steroidal anti-
inflammatory drugs (NSAIDs) as well as selective serotonin reuptake inhibitors (SSRIs). These
compounds will be extracted from samples of fish and other aquatic organisms from a pond receiving
water from Källby waste water treatment plant (WWTP) through a membrane extraction method
(Boström, 2012). After the compounds have been extracted there is also a need to extract lipids and
analyse PCB-levels. This study is therefore aiming to examine if it is possible to do lipid and PCB
extractions in series with the membrane extraction method on a single sample.
The study also aims to examine PCB-levels in roach (Rutilus rutilus) and tench (Tinca tinca); two
species with different feed and foraging behaviours from Källby WWTP. The hypothesis is that tench
will have a higher PCB-level due to its preference for benthic feed. The results from the PCB-
measurements can also be used as reference substance for quantitative studies of biomagnification
in Boström’s project.
1.2. Method development for serial extraction Besides the pH depending toxicity Boström is also assessing possible bioaccumulation and
biomagnification of NSAIDs and SSRIs where an extraction method for ion-trapping with hollow fibre
liquid-phase microextraction (HP-LPME) is used (Boström, 2012). In Boström’s study the BMF
(biomagnification factor) for NSAIDs and SSRIs will be calculated using concentration measurements
from different organisms from Källby WWTP. The BMF will then be compared with the legacy
contaminant PCB 153 as a reference substance for quantitative studies of biomagnification. In this
study PCB levels will be measured in roach and tench. Since the samples are scarce there is a desire
to be able to do several extractions from the same samples which will be assessed in this study. To
make the HP-LPM method possible the sample needs to be homogenized with water (Sagrista et al.,
2012). Samples must then be dried to make lipid-extraction possible, using the bench mark method
of Bligh and Dyer (Bligh and Dyer, 1959). Finally PCBs will be extracted by removing all organic matter
with sulfuric acid (Jansson et al., 1991). Today there is no method for doing a serial extraction of
pharmaceuticals (using HP-LPME) and PCBs/lipids. The development of this method could
dramatically lessen the amount of samples needed and the time spent in similar projects where serial
extraction is required.
4
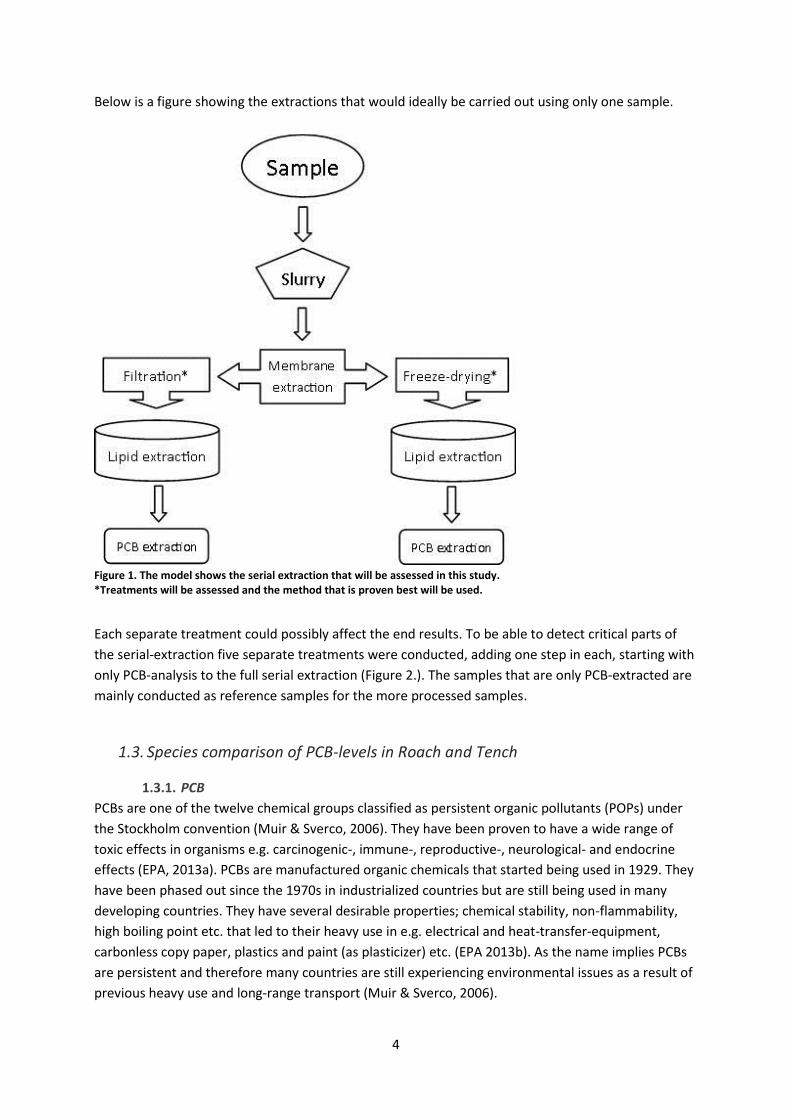
Below is a figure showing the extractions that would ideally be carried out using only one sample.
Figure 1. The model shows the serial extraction that will be assessed in this study. *Treatments will be assessed and the method that is proven best will be used.
Each separate treatment could possibly affect the end results. To be able to detect critical parts of
the serial-extraction five separate treatments were conducted, adding one step in each, starting with
only PCB-analysis to the full serial extraction (Figure 2.). The samples that are only PCB-extracted are
mainly conducted as reference samples for the more processed samples.
1.3. Species comparison of PCB-levels in Roach and Tench
1.3.1. PCB
PCBs are one of the twelve chemical groups classified as persistent organic pollutants (POPs) under
the Stockholm convention (Muir & Sverco, 2006). They have been proven to have a wide range of
toxic effects in organisms e.g. carcinogenic-, immune-, reproductive-, neurological- and endocrine
effects (EPA, 2013a). PCBs are manufactured organic chemicals that started being used in 1929. They
have been phased out since the 1970s in industrialized countries but are still being used in many
developing countries. They have several desirable properties; chemical stability, non-flammability,
high boiling point etc. that led to their heavy use in e.g. electrical and heat-transfer-equipment,
carbonless copy paper, plastics and paint (as plasticizer) etc. (EPA 2013b). As the name implies PCBs
are persistent and therefore many countries are still experiencing environmental issues as a result of
previous heavy use and long-range transport (Muir & Sverco, 2006).
5
PCBs are non-volatile organic compounds with a vapour pressure of 10-12-10-4 in 25°C (atm). They
have a high Kow ranging between 4,5 - 8 and low water solubility resulting in their tendency to absorb
to unpolar material like fatty tissues and sediments (UNEP, 2007). The concentration of PCBs in
sediment has been shown to be positively correlated with oil-concentration (Bedard, 1996). The
degree of chlorination and molecular position of chlorines in general determines the physiochemical
properties of the PCB. Henry’s constant is higher for less chlorinated PCBs (~0.8 atm L/mol) which
means they will mainly be found in gas phase. More chlorinated PCBs adsorbs to particulate matter
and can be removed from the atmosphere with wet or dry deposition and typically ends up in water
ways (UNEP, 2007). Biodegradation of PCB by microbes occurs through aerobic respiration, anaerobic
respiration or anaerobic fermentation and the rate and level of biodegradation is reduced with rising
degree of chlorination (Liu et al., 2006 and UNEP, 2007). In organisms PCBs are first hydroxylated to
make them polar and possible to excrete. The rate of transformation depends on chlorine content,
replacement pattern and amount of certain enzymes (UNEP, 2007). Half-life of different congeners
ranges between eight days to more than one year (R. Leschber, 2006). PCB 153 is a common type of
PCB frequently found in for instance adipose tissues, breast milk, human serum and fish and has a
half-life of approximately 6,8 years.(Sinkkonen and Paasivirta 2000, Venkatesha 2010). Studies of
diverse fish species in Sweden has shown that concentrations of PCB 153 correlates well with levels
of the regulation-relevant CB-congeners (28, 52, 101, 118, 138 and 180) with correlation coefficients
varying between 0.9752 – 0.9998 (Atuma et al. 1996). This makes PCB 153 a suitable CB-indicator and
it was thus chosen to represent overall PCB exposure in this study.
1.3.2. PCB-levels in Källby sewage treatment ponds
To study the accumulation of PCB a chronically exposed location was chosen. Källby sewage
treatment plant, operated by VA SYD, handles sewage water coming from Lund, Vallkärra, Stångby
and Stora Råby and totally 83 200 people are connected to the plant (VA SYD, 2010). The WWTP
treats about 30 000m3 daily (Saleh et al. 2011). The sewage is treated by screen raking, sand catch,
main sedimentation, biological treatment, anaerobic and aerobic denitrification and tertiary
treatment. Part of the sludge from secondary treatment is lead to the inlet and treated again and
some is mixed with tertiary and main sludge for additional treatment (Saleh et al. 2011).
The levels of PCB in sludge from Källby sewage treatment plant has been documented by VA SYD
since 2008 and mean values of 0,03-0,05mg/kg TS (total solids) and total amounts of 0,07-0,1kg/year
has been recorded (VASYD, 2013). The PCB-level in Källby is fairly low compared to the mean
concentrations in Swedish treatment plants 2005 measuring 0,1mg/kg (Thuresson and Haapaniemi,
2005). However, few external studies concerning PCBs in Källby’s sludge were found and no studies
were found regarding PCB levels in organisms living in the treatment ponds which made it a suitable
site to assess.
1.3.3. PCB accumulation in fish
Organic chemicals accumulate in fish through at least three different pathways; direct uptake
through the gills, absorption through the skin or intake via diet (Swartz and Lee, 1980). The level of
bioaccumulation is determined by lipid and protein content, age, size, purification rates, metabolic
processes, temperature, feeding tactics etc. (Mackay, D. 2000, Sharpe, S. 2000, van der Oost, R.
2003). PCBs and other POPs (persistent organic pollutants) have commonly been detected in
concentrations higher than what would be predicted from only bioconcentration factors (Fisk et al.,
2001). Since PCBs are hydrophobic, once it enters an organism, it dissolves in the fatty tissues.
Therefore the octanol-water partition coefficient (KOW) and lipid-water partition coefficient (KLW) of
6
the substance has been a main indicator used to predict level of bioconcentration of POPs (Mackay,
2001). Apart from bioconcentration, food-chain studies have shown that POPs can accumulate
through the diet and biomagnify along food chains i.e. trophic magnification. PCB has a food chain
magnification factor (FCMF) significantly >1 which implies that it will not only bioconcentrate in
organisms but also biomagnify along the food chain (Gobas et al. 1999, Nfon et al. 2008).
This was explained by Gobas et al. 1999 by an altered fugacity ratio in the gastrointestinal tract in
guppies. As the food is digested and lipids are removed from the tract in a higher rate than the
chemical, the fugacity capacity for the chemical drops and the fugacity raises in the GIT (above that in
the diet) which leads to passive diffusion into the organism where it is accumulated in fatty tissue
(Gobas et al. 1999). The bioaccumulation depends on predator-prey fugacity ratio. If the ratio is
larger than one biomagnification will most likely occur (Binelli and Provini, 2003).Substances with a
KOW higher than five and that are hard to metabolize has an elevated tendency to biomagnify in food
chains (Mackay, 2001). Since POPs are lipophilic, once a substance has been taken up by an organism
excretion is hindered (Nfon et al. 2008). This might also be the reason that organisms with higher
lipid content has been found to have a higher toxic load than organisms with lower lipid content
(Berglund et al., 2001).
1.3.4. Measuring of stable isotopes
To determine the trophic level of an organism a commonly used method is to assess the ratio of
nitrogen isotopes; 15N/14N, expressed as ∂15N (‰). For each tropic level ∂15N increases and the
highest values are found in top predators (Broman et al., 1992). A study of bioaccumulation of OCs
(organochlorines) in a freshwater food web in Canada found clear positive correlations between
∂15N and lipid–adjusted concentration (ng/g wet weight) of OCs (Kidd et al. 1998). In contrast, the
carbon isotope ∂13C does not seem to change along the food chain and are therefore frequently
used to determine carbon source in food webs (Nyström et al. 2003). The ∂13C signature differ in
benthic and pelagic primary producers and can be used to assess the diet of fish species where a high
∂13C indicates lager share of benthic feed (e.g. ephilitic algae) and a lower ∂13C indicate a larger
share of pelagic feed (e.g. zooplankton) (France, 1995, Kidd et al. 1998). Although both roach and
tench are omnivorous fish that feed on both zooplankton and benthos the tench in generally known
to live and obtain a larger part of its diet in benthic areas (Wanke, 2011). Based on this and PCBs
tendency to accumulate in sediments (UNEP, 2007) the hypothesis is that there will be a higher
concentration of PCB in tench than roach. Measures of ∂15N and ∂13C from sampled individuals will
in this study be used to represent the feed of roach and tench in Källby treatment pond.
2. Method
2.1. Chemicals
Dichloromethane was purchased from VWR International (Leuven, Belgium). N-Hexan was purchased
from Kebo lab (Spånga, Sweden). Sulfuric acid was obtained from Acros organics (Geel, Belgium).
Chloroform (pro analysis) and sodium sulphate was purchased from Merck (Darmstadt, Germany)
and methanol was obtained from Merck Schunchardt OHG (Hohenbrunn, Germany).

7
2.2. Sample preparation and analysis
Below is a model showing the different treatments that will be performed in this study;
Figure 2. The model illustrates the different treatments that will be performed. *Treatments will be assessed and the method that is proven best will be used for the membrane extraction treatment (#5).
2.2.1. Method development for serial-extraction
15 samples from three different roach individuals were cut in sizes equivalent to approximately 0,5g
wet weight. All samples and weighting boats were weighted three times and were freeze-dried
overnight covered with aluminium. Samples were then weighted three times together with the
weighting boats to retain dry weight. All pre used glass containers were burnt in an oven (350°C) for
at least 5h covered with aluminium.
2.1.1.1. Slurry (#3, 4, 5)
Samples for the filtering, freeze-drying and membrane-extraction treatment (# 3, 4, 5) were put
in separate 100ml bottles and each sample were homogenised with 30ml Milli-Q water using a
IKA Dispersing device T 25 Digital (Staufen, Germany) for 10 minutes. Residues of the sample on
the device were washed off with 20 ml Milli-Q water (totally 50ml/sample).
2.1.1.2. Membrane extraction (#5)
Weak acid pharmaceuticals were extracted from samples using a method for ion-trapping with
hollow fiber liquid-phase microextraction (HP-LPME) (Boström, unpublished work, Sagrista et. al.
2012).
Results from lipid-extraction and PCB-analysis of filtered (#3) and freeze-dried (#4) samples
were then awaited to determine which treatment is more appropriate to use for the membrane
extracted samples.
8
2.1.1.3. Filtration (#3)
Slurry samples were filtrated using Whatman No. 3 filter paper (5,5 cm) (Whatman International
Ltd., Maldstone, England). The original bottles and the funnel were washed with methanol and
Milli-Q water and passed through the filtering system before the filter was removed to minimize
the loss.
2.1.1.4. Freeze-drying (#4)
Slurry samples were freeze-dried.
The results from the lipid-extraction (below) showed a higher lipid yield from the samples that
were freeze-dried then from the samples that were filtered. Therefore it was assumed to be a
better method and used also for the membrane extracted samples.
2.1.1.5. Lipid extraction (#2, 3, 4, 5)
Lipids were extracted in accordance with the Bligh and Dyer method (Bligh and Dyer, 1959), with
some modifications.
Day one:
Cutting treatment (#2):
Samples were cut into small pieces and transferred to a 15ml Kimax tube. 7,5ml of Bligh and
Dyer-solution (B&D) was added to the tube.
Filtering treatment (#3):
Filters from samples were transferred to 15ml Kimax tubes and 7,5ml of B&D-solution was added
to the tube.
Freeze-dried treatment (#4):
The freeze-dried slurry was transferred to a 15ml Kimax tube. 2ml of B&D-solution was added to
the tube and 5,5ml was used to wash the bottle and transfer the remaining sample to the tube.
Membrane extraction treatment (#5):
Same process as for the freeze-dried treatment.
All samples were then sonicated for 10 minutes and left overnight in room temperature.
Day two:
2ml of hexane and 2ml Milli-Q water was added to each sample. The samples were vortexed for
10 sec and centrifuged for 2-4 minutes (1600rpm) until there was a clear phase separation. The
organic phase (bottom layer) was then extracted and transferred to a pre-weighted 15 Kimax
tube. The steps were then repeated two more times adding only 2ml of hexane each time (no
Milli Q). The hexan was then evaporated from the pre weighted tubes using nitrogen gas (35°C)
and the tubes were weighted again to retain lipid weights.
2.1.1.6. PCB-extraction and analysis (#1, 2, 3, 4, 5):
2ml hexane and 1-2ml of sulphuric acid was added to the tubes. Samples were shaken and left
for a couple of minutes until there was a clear phase separation and the sulphuric acid had
adopted a brown/yellow colour. The top layer (hexane) was then transferred to a new 15ml

9
Kimax tube and the steps were repeated until the sulphuric acid was clear. The hexane was then
transferred to a new 15ml Kimax tube and was dried with sodium sulphate. Approximately 1,5 ml
was transferred to a 2ml bottle. All samples were then analysed using a Bruker Scion TQ
GC/MS/MS system (Bruker Cooperation, Fremon, CA) with CP-8400 autosampler and VF-1MS
column (30m x 0;32mm i.d., 0;25µm film thickness). Chromatographic conditions were as
follows: The source temperature was held at 230°C. Injector and detector retained at a
temperature of 280°C and flow rate was set to 1.5ml/min. The column was set to 50°C for 2 min
then increasing (40°C/min) reaching 300°C at 6.75min and finally held at 300°C until totally 15min
had passed. PCB was identified based on mass and retention time and was then quantified using
standards of known concentrations.
The results showed that the samples might be contaminated with water and therefore they
were fully evaporated. 200µl of hexane was used to wash the bottles and were then transferred
to vials with 500 µl inserts. The PCB samples were then run again as above.
2.2.2. Species Comparison
Ten samples of same type as in previous test were collected from different individuals of tench and
seven from roach (since three individuals were already analysed in previous test by cutting treatment
#2). Three extra samples were taken from a random individual of roach to be used for measuring
standard yield of PCB from the employed method. 200µl of a 200ng/ L PCB/hexane solution was
applied to these samples before they were cut and transferred to the tubes. Lipids and PCBs were
then extracted from all samples using the same procedure as for samples #2 in previous test. A slight
change was made for the PCB extraction where instead of adding sodium sulphate and using only
1,5ml of the sample; all of the hexane was extracted and evaporated in 1,5ml Kimax bottles in two
sequences. Thereafter 200µl of hexane was used to extract the PCB from the bottle and was
transferred to vials with 500 µl inserts. This was done to avoid any contamination of water. Samples
were then analysed in GC/MS/MS as in section 2.1.1.6. ∂13C and ∂15N isotopes from 12 of the
sampled individuals were also measured.
2.3. Statistical methods
For the method development (sect. 2.1.) an analysis of variance (ANOVA) with Tukey-Kramer post
hoc tests were used to study the relationship between the lipid content (dependent variable) and the
different extraction methods.
For the species comparison (sect. 2.2.) a standard curve was plotted from peak areas of known PCB
concentrations and was used to derive unknown concentrations in the samples. The concentrations
were recalculated to ng/g dry weight and also lipid normalised to ng/g lipid. A Mann-Whitney test
was employed to test differences in PCB content between roach and tench. Both tests were
completed in IBM SPSS Statistics Standard program (21.0) for Windows (IBM, New York, United
States).
Two sample, unpaired, t-tests were conducted to assess the relationships of ∂13C and ∂15N isotopes
and the species.

10
3. Results
3.1. Method development for serial extraction
Despite that the PCB samples were fully evaporated and dissolved in a smaller volume it was not
possible to determine PCB-levels in the samples from the filtered, freeze-dried and membrane
extracted treatments. However, based on the strong correlation between lipids and PCB-levels in
organisms (Grafton 2006, Berglund 2005) the amounts of extracted lipids were used to determine
the success of the various treatments.
Both the cut and the freeze-dried samples showed high mean values; 12.14 and 11.88 (g lipids/ g
dry weight) compared to the filtered and membrane extracted samples with means of 5.02 and 5.93.
They also had a small standard deviation (SD=1.35 and SD=1.06) (Figure 3). The membrane extracted
samples had the lowest standard deviation (SD=0.60) and the filtered treatment had the highest
(SD=3.77).
The ANOVA conducted on the amount of extracted lipids showed a significant effect of type of
treatment to the amount of extracted lipids (F(3, 6) = 10.738, p =0.008). The Post hoc comparisons
(Tukey HSD test) implies that the cutting treatment is significantly different to both the filtered and
membrane-extraction treatment (p=0.016 resp. p=0.036). The freeze-drying treatment is only
significantly different to the filtering treatment (p=0.022) although the p-value is also low (p=0.054)
for membrane extraction treatment (Figure 3.).
Figure 3. The graph demonstrates extracted lipids normalized to dry weight (g lipids/ g dry weight) resulting from the different treatments. The bars represent the mean value of the three roach individuals (n=3) and the whiskers represents the standard deviations (Cut: M=0.120 SD=0.012, Filtered: M=0.050 SD=0.036, Freeze-dried: M=0.115 SD=0.006, Membrane extracted: M=0.062 SD=0.006). Letters above the bars represent the treatments that are significantly different.
b, d
a, c
b
a
0,00
0,02
0,04
0,06
0,08
0,10
0,12
0,14
a b c d
Extr
acte
d m
g lip
ids
/g d
ry w
eig
ht
Treatment
Cut
Filtered
Freeze-dried
Membr. Extract.

11
3.2. Species Comparison
Since the method for PCB extraction was slightly changed in the second study the three roach
samples from the method development was excluded from the species comparison. One sample of
tench was lost resulting in totally seven samples of roach and nine samples of tench. In two of the
roach samples PCB levels were not detectable and they were therefore excluded from the statistical
analysis. The PCB levels in the three samples with the known amount of applied PCBs showed a mean
yield of 91,6% PCB. This was accounted for in the calculations of mean and standard deviation.
The mean concentration of PCB in ng/ g dry weight for roach was 0,019±0,019 and for tench
0,014±0,018 (Figure 4.). The Mann-Whitney test showed no significant difference between PCB
content in dry mass of roach and tench (U=17.0, p=0.463, sig≤.05, 2-tailed, r=0.196).
Figure 4. The graph illustrates mean concentrations and standard deviation of PCB in Roach (N=5) and Tench (N=9) (dry weight). Roach: M=0.019 SD= 0.019, Tench: M=0.014 SD=0.018.
After lipid normalization mean concentration of PCB for roach was 0.259 ±0.139 and for tench
0.129±0.138 (Figure 5.). Results from Mann-Whitney test displayed a considerably lower p-value but
there were still no significant difference in PCB concentration between the two species (U=9.0,
p=0.072, sig≤.05, 2-tailed, r=0.48).
Figure 5. Lipid normalized data. The graph illustrates mean concentrations and standard deviation of PCB in Roach (N=5) and Tench (N=9) (ng/ g lipid). Roach: M=0.259 SD= 0.139, Tench: M=0.129 SD=0.138.

12
The t-tests demonstrated a clear significant difference between the mean ∂13C(‰) in roach
(-31.45±0.286) and in tench (-29.69±0.732); t(6)=-5.50, p=0.0015 (Figure 5.). There was also a
significant difference in mean ∂15N(‰) isotopes in roach (15.48±0.473) and tench (17.65±1,12); t(7)=-
4,40, p=0.0032 (Figure 6.).
Figure 6. Carbon and nitrogen isotope ratios in roach (n=6) and tench (n=6). The species were significantly different in both ∂
13C ratio (p=0.0015) and ∂
15N ratio (p=0.0032).
4. Discussion
4.1. Method development for serial extraction
The ANOVA showed that there is a significant effect of type of treatment (p=0.008) to the amount of
extracted lipids which confirms that there are critical steps in the serial extraction. The filtering
treatment and the membrane extraction treatment both gave a near 50% less mean lipid yield
compared to the cutting and freeze-drying treatments. The large standard deviation in the filtering
treatment was possibly a result from lipids being trapped in the filter. Overall the high standard
deviation and low mean yield implies that the method is defect and inappropriate for analytical
studies. Freeze-drying was the alternative treatment to filtering to be able to extract lipids after a
membrane extraction. The results from the freeze-drying treatment showed a mean yield of 0.115 (g
lipids/ g dry weight) which was only 0.005g less than the mean yield from the basic cutting
treatment. The standard deviation was also the lowest which suggest that it is an adequate method
to use. The lipid yield from the membrane extraction was low; 0.062(g / g dry weight). In this
treatment, during the lipid extraction after adding dichloromethane and Milli-Q water the second
day, a white sludge appeared above the organic phase. It also had a tendency to mix with the organic
phase which suggests that it contains organic substance. Hence, it is possible that a significant part of
the fat was dissolved in the sludge. A possible explanation is that the lipids have been hydrolyzed
from the acid HP-LPME-treatment and therefore partly dissolves in the water phase (Holliday et al.
1997). However this demands further research and modeling. The PCB in the samples from all five
treatments (including the samples that were only used for PCB extractions) was hard to detect.
Instead lipid yield was quantified since lipid:PCB relationship has been proven to be strongly
correlated (Grafton 2006, Berglund 2005). By these means these results can serve as an indication of
-31,5
-31,0
-30,5
-30,0
-29,5
-29,0
-28,5
-28,0
0 5 10 15 20 25
∂1
3 C (‰
)
∂15N (‰)
∂13C and ∂15N isotopes
Roach
Tench

13
the adequacy of the treatments. However for this method to be fully developed it should preferably
be repeated performing the full PCB-analysis.
The desired method includes the extraction of NSAIDs, SSRIs, lipids and PCBs and thus this study
does not answer the question if a serial-extraction is possible. Nonetheless, it shows that the freeze-
drying treatment most likely is applicable and may be used in other studies treating water based fish
slurries. Furthermore the filtration treatment has been proven inadequate unless it is modified. A
possible alternative is to dry the filters before the lipids are extracted in accordance with the Weibull-
Berntrop method (Schlechtriem, 2009).
4.2. Species Comparison
No significant difference (p<0.05) could be found in PCB concentration between roach and tench
neither before nor after lipid normalization. However the p-value after normalization was 0.072
which indicate a tendency of higher concentrations of PCB in roach than in tench.
Based on the plot of ∂13C (‰) and ∂15N (‰) isotopes tench have both a significantly higher ∂13C
(p=0.015) and ∂15N (p=0.032). The higher ∂13C supports the theory that its diet to a larger extent then
the roach’s consists of benthic feed (Wanke, 2011). The slightly higher ∂15N could imply that it is part
of a higher trophic level). However, there are several possible explanations to the contradictive
results. In a study by the Swedish Environmental protection agency, roach were considered to occupy
a lower trophic level (2,8) than the tench (3.5) (Söderberg, 2008). Yet, it is possible that the
differences in ∂15N (mean of roach: 15.48‰ tench:17.65‰) is not sufficient to represent a trophic
level. In vitro observations by Deniro and Epstein (1981) showed increases of ~3‰ for each trophic
level. This makes it questionable if the roach and tench from Källby resides different trophic levels
differentiating only 2.17‰. Deniro and Epstein also showed that species despite feeding on the same
diet can vary in ∂15N. Nfon et al. found, when assessing benthic and pelagic food webs in the Baltic
sea, that the benthic food chain inconsistently had a higher ∂15N. Similar results were found in a
study of fish’s and invertebrate’s dietary uptake from contaminated sediments in northeastern USA,
where the lobster and scup had significantly higher ∂15N than the butterfish and squid although they
were not occupying a higher trophic level (Morgan and Lohmann, 2010). According to Hoekstra (2003
a, b) this is due to a higher content of ∂15N in benthic feed. Using ∂15N for calculating trophic level in
the benthic food web has even given negative fractions (DeNiro and Epstein 1991). Kidd et al. found
that the ∂15N varied significantly in the lower parts of the food chain while the top of the food chain
had more consistent levels depending on length of the food chain. Trusting these findings it is highly
plausible that the roach and tench are in fact occupying the same trophy level. This is supported by
the fact that the tench also has a higher ∂13C which implies that it to a lager extent feed from benthic
sources then the roach (France, 1995, Kidd et al. 1998). Several studies have found correlation
between ∂15N and PCB levels which contradicts the results in this study (Burreau et al., 2006, Kidd et
al. 1998). However, also this relationship might be affected by dissimilarities in ∂15N between the
benthic and pelagic food web.
The high KOW and low water solubility of PCB 153 causes it to bind to unpolar material like fatty
tissue or sediments and therefore the concentration in the water column is low (UNEP, 2007). It has
also been shown that the main accumulation of POPs is caused by intake via diet (Nfon et l. 2008). In
a study of bioaccumulation of PCB congeners in western lake Erie in Canada more than 99% of the
accumulated PCB 153 in fish (Sander vitreus) were estimated due to consumption of contaminated
food (Morrison et al. 1997). Another study of dietary accumulation of PCBs from contaminated

14
sediments by demersal fish upheld a dietary contribution of 53 %. This experiment was conducted
during 20 days and the dietary contribution seemed to enlarge with time (Rubenstien et al., 1984).
Thus, possible differences in bioconcentration in roach and tench will be considered negligible when
assessing the results in this study.
Studies of biomagnification of mercury in Poland showed similar results to this study where
concentrations found in roach were more than twice of that found in the tench (Misztal-Szkudlinska,
2008). The cause was not assessed in the study but since mercury and PCB have similar
physiochemical properties it is possible that same environmental conditions trigger the same
distribution of PCB between the tench and roach in Källby STP (Powers, 2009). Conversely another
study from two polish rivers connected to the Baltic Sea (Vistula River and Dead Vistula River
channel) showed opposite results; 9 out of 9 metals (e.g. cadmium, mercury and lead) had higher
concentrations in tench. (Wyrzykowska, 2012).
Zooplankton’s diet in general consists primarily of phytoplankton and other zooplankton
(Wyrzykowska, 2012). Therefore, if the results in this study are accurate, assuming that roach in
Källby to a larger extent then tench feed from zooplankton then benthic invertebrates, it would imply
that the phytoplankton has a higher level of PCB 153 than the benthic feed. This theory seems
unlikely since PCB 153 accumulate in sediments (UNEP, 2007). Numerous of studies have shown that
benthic fauna at least in lower part of the food chain has higher PCB 153 concentrations than the
pelagic fauna, particularly the more chlorinated and hydrophobic PCB congeners like PCB 153 (e.g.
Campfens and Mackay, 1997, Morgan and Lohmann2010, Nfon et al., 2008). Therefore the results in
this study contradict most studies comparing PCB accumulation in benthic and pelagic food chains.
Studies have shown that roach feed almost exclusively of zooplankton during the ontogenetic
stages (Wanke, 2011). In later stages its diet like the tench’s is omnivore and both species can
therefore change their diet depending on supply and other environmental factors. Both species also
spend varying amounts of time in the different water zones and the results could thus reflect spatial
and temporal differences (Nfon et al. 2008). Hence, it is not implausible that the result is an outcome
of intra-species differences where also age and size influence outcome (Lána, 2008). Moreover it is
possible that there are inter-species disparities like protein content, purification rates and metabolic
processes which were not addressed in this study (Mackay, D. 2000, Sharpe, S. 2000, van der Oost, R.
2003). This would ideally be examined to be able to draw conclusions from this study
Even though the statistical analysis showed no significant result, the p-value (p=0.072 p<0.05) when
normalized to lipid content indicated that there might be higher concentrations in roach.
Experiment-wise it is possible that the yield of PCB from roach is higher than from tench. Therefore
to improve this study, standards for PCB extraction in tench should also be assessed. Inter-laboratory
surveys have shown that analytical errors are common in surveys of POP concentration in organisms
(Muir & Sverco, 2006). There might be methods for lipid- and PCB-extraction that give more accurate
results than the methods used in this study. Muir and Sverco (2006) suggested that examining the
samples in their original state, e.g. no freeze-drying, would give more accurate result in PCB/OC
analyzes.
Furthermore, to be able to draw strong conclusions a more extensive study is needed. Firstly, more
replicates could reduce the effect of intra-species variations. Secondly, assessing the feed, tentatively
by stomach contents analysis, could help to verify the diets (Hyslop, 2006). PCBs in the feed (e.g.
zooplankton and epilithic algae) should also be measured to further corroborate the results (Wanke,
2011).

15
Finally, it would be interesting to compare the results from Källby STP to other places where both
species reside and possibly assess larger, less contaminated areas to see how the species
differentiate in a more pristine environment.
5. Conclusion
For the method development there was a significant effect of type of treatment (p=0.008) to the
amount of extracted lipids. The filtering treatment showed both a low mean and high standard
deviation which suggests it is inappropriate for analytical studies. However, the freeze-drying showed
a mean of 0.120 g lipids/ g dry weight which was only 0.005g lower than the cutting treatment and
indicates that it is a valid treatment. The membrane extraction treatment showed consistent but low
mean lipid mass. This was probably due to lipids being hydrolysed in the HP-LPME-treatment and as
a result part of the lipids dissolved in the water phase. However this demands further research.
The species comparison showed no significant results although after lipid normalization the roach
indicated higher concentrations of PCB 153 with a probability of 0.072.
Both ∂15N and ∂13C were significantly higher for the tench (p=0.032 resp. p=0.015) indicating higher
trophic position and higher share of benthic feed. However, the higher ∂15N was in other studies
justified by larger share of benthic feed (similar to ∂13C) and therefore the assumption was neglected.
The higher concentration of PCB 153 in roach could not be explained although one study assessing
mercury had found similar results (Misztal-Szkudlinska, 2008). Therefore the results are believed to
be an effect of either inter- and intra-species variations or possibly experimental flaws such as failure
in assessing PCB yield from tench or insufficient amount of replicates.
References
Atuma, S. S., Linder, C. E., Andersson, O., Bergh, A., Hansson, L.,Wicklund-Glynn , A., CB153 as indicator for congener specific determination of PCBS in diverse fish species from Swedish waters, Chemosphere, Vol. 33, No. 8, pp. 1459-1464, 1996
Bedard, D. L., May, R. J., 1996, Characterization of the Polychlorinated Biphenyls in the Sediments of Woods Pond: Evidence for Microbial Dechlorination of Aroclor 1260 in Situ, Environmental Science & Technology, 1996, 30, 237-245
Berglund, O., Larsson, P., Ewald, G., Okla, L. 2001, The effect of lake trophy on lipid content and pcb concentrations in planktonic food webs, Ecology, 82(4):1078-1088
Berglund, O., Nyström, P., Larsson, P. 2005, Persistent organic pollutants in river food webs: influence
of trophic position and degree of heterotrophy, Canadian Journal of Fisheries and Aquatic Sciences,
September 2005, 62(9):2021-2032)
Bligh, E. G, and Dyer, W. J., 1959, A rapid method of total lipid extraction and purification. Can. J.
Biochem. Physiol. 37: 911-917
Boström, M. 2012, Uptake and bioaccumulation of ionisable pharmaceuticals in aquatic organisms,
Introductory paper, Unit of Aquatic Ecology, Department of biology, Lund University, Sweden
Broman, D.,Näf, C., Rolff, C., Zebühr, Y., Fry, B., Hobbie, J. 1992, Using ratios of stable nitrogen
isotopes to estimate bioaccumulation and flux of polychlorinated dibenzo-p-dioxins PCDDs and

16
dibenzofurans (PCDFS) in two food chains from the northern Baltic, Environ Toxicol Chem, 11 (1992),
pp. 331–345
Binelli. A. and Provini, a., The PCB pollution of Lake Iseo (N. Italy) and the role of biomagnification in the pelagic food web, Chemosphere, 53 (2003) 143–151
Burreau, S.; Zebühr, Y.; Broman, D.; Ishaq, R. 2006, Biomagnification of PBDEs and PCBs in food webs from the Baltic Sea and the northern Atlantic Ocean, Science of the Total Environment, 366(2-3):659-672
Campfens, J., Mackay, D., 1997, Fugacity-based model of PCB bioaccumulation in complex aquatic
food webs , Environmental Science and Technology, 31(2):577-583
Deniro, M. J.; Epstein, S., Influence of diet on the distribution of nitrogen isotopes in animals, Geochimica et Cosmochimica Acta, vol. 45, Issue 3, pp.341-351
EPA 2013a, Health effects of PCBs, US Environmental Protection agency, accessed 2013-05-11, <http://www.epa.gov/osw/hazard/tsd/pcbs/pubs/effects.htm>
EPA 2013b, Basic Information - Polychlorinated Biphenyl (PCB), US Environmental Protection agency, accessed 2013-05-10, <http://www.epa.gov/wastes/hazard/tsd/pcbs/about.htm>
Erickson, R., Nochols, J., Cook, P., Ankley, G., 2008, Bioavailability of Chemical Contaminants in aquatic ecosystems, In: Di Giulio, R. T., Hinton, D. E., (Eds.) The Toxicology of fishes. CRC Press, Boca Raton, FL, pp-9-54
France, R. L., 1995, Carbon-13 enrichment in benthic compared to planktonic algae: foodweb implications, Marine ecology progress series, Oldendorf 124.1 (1995): 307-312.
Gobas, F.A.P.C., Wicockson, J.B., Russell, R.W., and Haffner, G.D.1999. Mechanism of biomagnification in fish under laboratory and field conditions. Environ. Sci. Technol. 33: 133–141.
Grafton, A., Lee, D., Libero, D., Miller, J., and Rapko, K. 2006, Polychlorinated Biphenyls (PCBs) in fish roe, JYI, January 2006, accessed 2013-05-15, <http://www.jyi.org/issue/polychlorinated-biphenyls-pcbs-in-fish-roe/>
Hoekstra, P.F., O'Hara, T.M., Fisk, A.T., Borgå, K., Solomon, K.R., Muir, D.C.G., 2003a, Trophic transfer of persistent organochlorine contaminants (OCs) within an Arctic marine food web from the Southern Beaufort–Chukchi Seas, Environ Pollut;124:509–22.
Hoekstra, P.F., O'Hara, T.F., Karlsson, H., Solomon, K.R., Muir , D.C.G., 2003b, Enantiomer specific biomagnification of α-hexachlorocyclohexanes and selected chiral chlordane-related compounds within an arctic marine food web, Environ Toxicol Chem; 22:2482–91
Holliday, R.L., King, J.W., List, G.R. 1997, Hydrolysis of Vegetable Oils in Sub- And Supercritical Water, Industrial and Engineering Chemistry Research, 1997, 36(3):932-935
Holmström, C., and Pröjts, J., Höje å recipientskontroll 2012, Ekologgruppen, Höje Å Vattenråd, Landskrona, Sweden.

17
Jafvert, C.T.; Westall, J.C.; Grieder, E.; Schwarzenbach, R.P. 1990, Distribution of hydrophobic
ionogenic organic compounds between octanol and water: Organic acids. In: Environ. Sci. Technol.,
Vol. 24, Issue 12
Hyslop, E. J., 1980, Stomach contents analysis-a review of methods and their application, Journal of
Fish Biology, Vol. 17 Issue 4, p411-429, 19p
Jansson, B., Andersson, R., Asplund, L., Bergman, Å., Litzén, K., Nylund K., Reutergårdh, L., Sellström,
U., Uvemo, U-B., Wahlberg, C., Wideqvist, U., Multiresidue method for the gas-chromatographic
analysis of some polychlorinated and polybrominated pollutants in biological samples
Fresenius J Anal Chem, 340 (1991), pp. 439–445
Kannan, N., Reusch, T. B. H., Petrick, G., Duinker, Shultz-Bull, D. E. 1995, Chlorobiphenyls: Model
Compounds for Metabolism in Food Chain Organisms and Their Potential Use as Ecotoxicological
Stress Indicators by Application of the Metabolic Slope Concept, Environmental Science &
Technology, Volume: 29 Issue: 7 (1995-07-01) p. 1851-1859. ISSN: 0013-936X
Kidd, K.A.; Hesslein, R.H.; Ross, B.J.; Koczanski, K.; Stephens, G.R.; Muir, D.C.G. 1998, Bioaccumulation
of organochlorines through a remote freshwater food web in the Canadian Arctic, Environmental
Pollution, 102(1):91-103 Language: English. DOI: 10.1016/S0269-7491(98)00068-2
Lána, R., 2008, Persistant organic pollutants in the ev´nvironment of the Southern Moravia Region ,
PhD thesis, The Institute of Chemistry and Technology of Environmental Protection, Faculty of
Chemistry, Brno University of Technology, Brno
Leschber. R., 2006, Background values in European soils and sewage sludges, PART I, Evaluation of
the relevance of organic micro-pollutants in sewage sludge European Commision, Directorate-
General, Joint Research center, Luxembourg: Office for Official Publications of the European
Communities
Liu, L., Tindall, J. A., Friedel, M. J., 2007, Biodegradation of PAHs and PCBs in Soils and Sludges, Water,
Air, and Soil Pollution, May 2007, Volume 181, Issue 1-4, pp 281-296
Mackay, D.; Fraser 2000, A. Bioaccumulation of persistent organic chemicals: mechanisms and
models. Environ. Pollut., 110, 375–391.
Mackay, D. 2001, Multimedia environmental models: the fugacity approach (2nd Edition), Lewis
Publishers, Boca Raton (2001), p. 261
Morgan, E. J. and Lohmann, R., Dietary uptake from historically contaminated sediments as a source
of PCBs to migratory fish and invertebrates in an urban estuary, Environmental Science & Technology,
7/15/2010, Vol. 44 Issue 14, p5444-5449
Muir, D. and Sverko, E. 2006, Analytical methods for PCBs and organochlorine pesticides in
environmental monitoring and surveillance: a critical appraisal, Analytical and Bioanalytical
Chemistry, 2006 October; 386(4): 769–789.
18
Nfon, E., Cousins, I. T., Broman, D., Biomagnification of organic pollutants in benthic and pelagic
marine food chains from the Baltic Sea, Science of The Total Environment, Volume 407, Issue 21, 15
October 2009, Pages 5803-5804
Nyström, P., McIntosh, A.R., Winterbourn, M.J. 2003, Topdown and bottom-up processes in
grassland and forested streams. Oecologia, 136: 596–608.
Rubenstein, N. I., Gilliam, W. T., Gregory, N. R., 1984, Dietary accumulation of PCBs from a
contaminated sediment source by a demersal fish (Leiostomus xanthurus), Aquatic Toxicology,
Volume 5, Issue 4, November 1984, Pages 331–342
Sagristà, E., Cortés, J.M., Larsson, E., Salvadó, V.,Hidalgo, M.,Jönsson, J.Å., 2012, Comparison of two
extraction methods for the determination of selective serotonin reuptake inhibitors in sewage sludge
by hollow fiber liquid-phase microextraction. Department of Chemistry, University of Girona, Campus
Montilivi, Girona, Spain.
Saleh, A., Larsson, E., Yamini, Y., Jönsson, J. Å. 2011, Hollow fiber liquid phase microextraction as a
preconcentration and clean-up step after pressurized hot water extraction for the determination of
non-steroidal anti-inflammatory drugs in sewage sludge, Journal of Chromatography A, Volume 1218,
Issue 10, 11 March 2011, Pages 1331–1339
Sharpe, S.; Mackay, D. A framework for evaluating bioaccumulation in food webs. Environ. Sci.
Technol. 2000, 34 (12), 2373–2379.
Schlechtriem, C.; Fliedner, A.; Schäfers, C, 2009, Contributions to the Revision of TG OECD 305 Lipid
measurement, Fraunhofer Institute for Molecular Biology and Applied Ecology (IME), Schmallenberg,
Germany.
Sinkkonen, S. and Paasivirta, J., 2000, Degradation half-life times of PCDDs, PCDFs and PCBs for
environmental fate modelling, Chemosphere, Volume 40, Issues 9–11, May–June 2000, Pages 943–
949
Swartz, R.C. and H. Lee 11, 1980. Biological processes affecting the distribution of pollutants in
marine sediments, Part, I: accumulation, trophic transfer, biodegradation and migration,
Contaminants and sediments, Vol. I, pp. 553-555
Söderberg, K, 2008, Provfiske i Östersjöns kustområden - Djupstratifierat provfiske med Nordiska
kustöversiktsnät, Version 1:2, Fiskeriverkets Kustlaboratorium, Öregrund
The Sewage Sludge Directive 86/278/EEC, EC:Luxembourg,1986
UNEP 2007, Proceedings of the Subregional Awareness Raising Workshop on Persistent Organic
Pollutants (POPs), Bangkok, Thailand. United Nations Environment Programme (November 25–28th,
1997). Retrieved on 2007-12-11.

19
VASYD 2013, Källby avloppsreningsverk, accessed 2013-05-12,
<http://www.vasyd.se/VattenAvlopp/avloppsvatten/lund/kallbyAvloppsreningsverk/Pages/default.a
spx>
VA SYD 2012, Miljörapport 2010, Källby reningsverk – VA SYD, 2010 vers. 1, Lund, Sweden.
Van der Oost, R.; Beyer, J.; Vermeulen, N. P. E. Fish bioaccumulation and biomarkers in
environmental risk assessment: a review. Environmental Toxicology and Pharmacology 2003, 13, 57–
149
Venkatesha, V. A.,Kalen, A. L., Sarsour, E. H.and Goswam, P. C., PCB-153 exposure coordinates cell cycle progression and cellular metabolism in human mammary epithelial cells, Toxicology Letters, 2010 July 1; 196(2): 110–116.
Wanke, T., 2011, Community structure, diet and growth of fish in two shallow lakes of different
macrophyte colonization, Faculty of Biology at the University of Freiburg, Leibniz-Institute of
Freshwater Ecology and Inland Fisheries, Berlin, March 2011
Wyrzykowska, B., Falandysz, J.and Jarzyoska, G.,2012, Metals in edible fish from Vistula, River and
Dead Vistula River channel, Baltic Sea, Journal of Environmental Science and Health, Part B:
Pesticides, Food Contaminants, and Agricultural Wastes, 47:4, 296-305
Miljövetenskaplig utbildning
Centrum för klimat- och miljöforskning
Ekologihuset
22362 Lund