method 321.8 by ion chromatography ......321.8-1 method 321.8 determination of bromate in drinking...
TRANSCRIPT

321.8-1
METHOD 321.8
DETERMINATION OF BROMATE IN DRINKING WATERSBY ION CHROMATOGRAPHY
INDUCTIVELY COUPLED PLASMA - MASS SPECTROMETRY
Revision 1.0EMMC Version
John T. Creed, Carol A. Brockhoff and Theodore D. Martin Revision 1.0 December 1997.

321.8-2
NATIONAL EXPOSURE RESEARCH LABORATORYOFFICE OF RESEARCH AND DEVELOPMENT
U.S. ENVIRONMENTAL PROTECTION AGENCYCINCINNATI, OHIO 45268
METHOD 321.8
DETERMINATION OF BROMATE IN DRINKING WATERS BY ION CHROMATOGRAPHY
INDUCTIVELY COUPLED PLASMA - MASS SPECTROMETRY
1.0 SCOPE AND APPLICATION
1.1 This method provides a procedure for determination of bromate in drinking water.
Chemical Abstract ServicesAnalyte Registry Numbers (CASRN)__________________________________________________________
Bromate (BrO3-) 15541-45-4
1.2 For reference where this method is approved for use in compliance monitoring programs[e.g., Safe Drinking Water Act (SDWA)], consult both the appropriate sections of theCode of Federal Regulation (Part 141 § 141.23 for drinking water), and the latestFederal Register announcements.
1.3 This method should be used by analysts experienced in the use of inductively coupledplasma mass spectrometry (ICP-MS), and the interpretation of spectral and matrixinterferences. A minimum of six months experience with commercial instrumentation isrecommended. It is also recommended that the analyst have experience in liquidchromatography and the use of ICP-MS as a chromatographic detector.
1.4 Users of the method data should state the data-quality objectives prior to analysis. Usersof the method must document and have on file the required Initial Demonstration ofPerformance data described in Section 9.2 prior to using the method for analysis.
2.0 SUMMARY OF METHOD
2.1 An aliquot of a finished drinking water is passed through a preparatory cartridge capableof removing the trisubstituted haloacetic acids which interfere with the analysis ofbromate. The sample is then injected onto a column which separates the remainingbrominated haloacetic acids and bromide from the bromate. The ICP-MS is interfacedto the ion chromatograph and both mass 79 and mass 81 are monitored in time as

321.8-3
bromate elutes from the column. The resulting signal is integrated and a concentrationdetermined from a calibration curve. Mass 79 is used for quantitation while mass 81provides isotope ratio information which can be used to screen for potential polyatomicinterferences.
2.2 Chromatography: The chromatographic separation is based on an anion exchange resin.
The sample is injected on the column and the matrix and analyte partition themselvesbetween the mobile phase and the stationary phase as they move along the column.Early eluting analytes spend most of their time in the mobile phase while the late elutingcompounds spend a larger percentage of their time interacting with the stationary phase.The matrix anions can influence retention times by blocking the interaction of thestationary phase with the analytes producing a shift in the retention time.
Inductively Coupled Plasma Mass Spectrometer: The detection technique is based onthe use of an ICP-MS for the detection of trace elements[1-3]. The chromatographiceluent is introduced by pneumatic nebulization into a radio frequency plasma whereenergy transfer processes cause desolvation, atomization and ionization. The ions areextracted from the plasma through a differentially pumped vacuum interface andseparated on the basis of their mass-to-charge ratio by the mass spectrometer having aminimum resolution capability of 1 amu peak width at 5% peak height. The ionstransmitted through the mass spectrometer are detected by an electron multiplier orFaraday detector and the ion information is processed by the data system. Interferencesrelating to the technique (Sect. 4) must be recognized.
Although ICP-MS is typically used for multi-analyte determinations, it is used in 321.8for species specific quantification. In this mode the signal response is recorded viachromatographic or time resolved software. The use of ion chromatography incombination with ICP-MS detection has been reported for the detection of bromate [4-7].
DEFINITIONS
3.1 Calibration Blank - A volume of reagent water pH adjusted (to 10) with the same baseas in the calibration standards.
3.2 Calibration Standard (CAL) - A solution prepared from the dilution of stock standardsolutions. The CAL solutions are used to calibrate the instrument response with respectto analyte concentration. This solution is pH adjusted to 10.
3.3 Instrument Performance Check (IPC) Solution - A solution of method analytes, usedto evaluate the performance of the instrumental system with respect to defined set ofmethod criteria. Within this method, the IPC is identical to the laboratory fortifiedblank.

321.8-4
3.4 Drift Standard- A calibration standard added to a post column sample loop (via asecond valve) which is transported into the plasma when the sample is injected. Thisanalyte does not traverse the column and is used to compensate for instrumental (ICP-MS) drift during the analysis of a set of samples.
3.5 Laboratory Duplicates (LD1 and LD2) - Two aliquots of the same sample taken inthe laboratory and analyzed separately with identical procedures. Analyses of a numberof LD1 and LD2 indicates precision associated with laboratory procedures, but not withsample collection, preservation, or storage procedures.
3.6 Laboratory Fortified Blank (LFB) - An aliquot of LRB to which known quantities ofthe method analyte is added in the laboratory. The LFB is analyzed exactly like asample, and its purpose is to determine whether the methodology is in control andwhether the laboratory is capable of making accurate and precise measurements.
3.7 Laboratory Fortified Sample Matrix (LFM) - An aliquot of an environmental sampleto which known quantities of the method analyte is added in the laboratory. The LFMis analyzed exactly like a sample, and its purpose is to determine whether the samplematrix contributes bias to the analytical results. The background concentrations of theanalytes in the sample matrix must be determined in a separate aliquot and the measuredvalues in the LFM corrected for background concentrations.
3.8 Laboratory Reagent Blank (LRB) - An aliquot of reagent water or other blankmatrices that are treated exactly as a sample including exposure to all glassware,equipment, solvents, and reagents that are used with other samples. The LRB is usedto determine if method analyte or other interferences are present in the laboratoryenvironment, reagents, or apparatus.
3.9 Linear Dynamic Range (LDR) - The concentration range over which the instrumentresponse to an analyte is linear.
3.10 Method Detection Limit (MDL) - The minimum concentration of an analyte that canbe identified, measured, and reported with 99% confidence that the analyteconcentration is greater than zero.
3.11 Quality Control Sample (QCS) - A solution of the method analyte of knownconcentrations which is used to fortify an aliquot of LRB or sample matrix. The QCSis obtained from a source external to the laboratory and different from the source ofcalibration standards. It is used to check either laboratory or instrument performance.
3.12 Stock Standard Solution - A concentrated solution containing the method analytesprepared in the laboratory using assayed reference materials or purchased from areputable commercial source.
3.13 Tuning Solution - A solution which is used to determine acceptable instrument

321.8-5
performance prior to calibration and sample analyses.
3.14 Water Sample - For the purpose of this method, a sample taken from a finisheddrinking water supply.
4.0 INTERFERENCES
4.1 Several interference sources may cause inaccuracies or imprecisions in thedetermination of bromate by ICP-MS. These are:
4.1.2 Abundance sensitivity - This is a property defining the degree to which the
”wings” of a mass peak contribute to adjacent masses. The abundancesensitivity is affected by ion energy and operating pressure. “Wing” overlapinterferences may result when a small ion peak is being measured adjacent toa large one. The potential for these interferences should be recognized and themass spectrometer operating conditions adjusted to minimize the effect.
This interference is relevant in this method given the large 40Ar40Ar+ dimeradjacent to mass 79 which is present in conventional ICP-MS. The extent towhich the dimer contributes to the signal on mass 79 can be determined byscanning over masses 76-83 using 20 points per amu (skipping mass 80) usinga 5mM HNO3 solution(See Figure 1). The interference signal from the argondimer is apparent by examining the background signal at mass 79.4 relative to76.4, 77.4 and 78.4. With proper mass calibration and adequate abundancesensitivity, the signal on masses 76.4, 77.4, and 78.4 should be close to normalphoton background. The signal on 79.4 commonly is elevated relative to theabove masses. This elevated signal is caused by the mass spectrometersinsufficient abundance sensitivity.
The signal should decrease as the mass decreases from 79.5 to 79.3 etc. Todetermine if the instrument has adequate abundance sensitivity the decrease(79.5 to 79.3) in this signal should be extrapolated to mass 79.0 at which pointit should be no higher than twice the normal photon background(See Figure 1).The signal may increase as mass 79.0 is approached depending on the bromidecontamination in the 5mM HNO3. The resolution etc., should be adjusted tominimize the dimers contribution to mass 79.0.
Note: If the decrease in the signal from 79.5 to 79.0 does not havean inflection point, this may indicate that the abundance sensitivity isinsufficient to resolve 79Br+ from 40Ar40Ar+
4.1.3 Isobaric polyatomic ion interferences are caused by ions consisting of morethan one atom which have the same nominal mass-to-charge ratio as the isotopeof interest, and which cannot be resolved by the mass spectrometer in use[8].These ions are commonly formed in the plasma or interface system from

321.8-6
support gases or sample components. The two polyatomics which are inherentto conventional ICP-MS are the 40Ar38ArH and 40Ar40ArH. 40Ar40ArHcontributes to the background signal on mass 81. To minimize this, it isrecommended that the sample flow rate remain on between injections. This willproduce smoother baselines on mass 81 and thereby produce more reproducibleintegrations on mass 81 for the early eluting peaks.
The ICP-MS interferences which apply to the detection of bromate are listedin Table 1. These spectral interferences are common to the plasma orproduced by matrix anions eluting from the column. These interferences areoutside the retention window for bromate but may cause baseline shifts whichwill degrade integration precision.
4.1.4 Physical interferences are associated with the physical processes which governthe transport of sample into the plasma, sample conversion processes in theplasma, and the transmission of ions through the plasma-mass spectrometerinterface. These interferences may result in differences between instrumentresponses for the sample and the calibration standards. Samples containing highconcentration of chloride (which elutes immediately after bromate) may causechromatographic baseline shift possibly from a small change in the 40Ar40ArHproduction during the chloride elution. In addition, the removal of highconcentrations of sodium and potassium which may exist in the drinking waterare removed by using an anion self regenerating suppressor. This minimizestheir deposition on the sampling cone and thus improves long term stability.
Note: The mobile phase in this method was chosen based on itsability to produce a stable baseline and sensitivity over a multipleweek period. The long term stability of the instrument is monitoredby injecting a post column drift standard with each chromatogram.The analyte concentration in a sample is corrected by using this driftstandard in the same fashion that an internal standard is used inMethod 200.8[9].
4.1.5 Baseline Drift - This results when a constituent from the sample matrix is notquantitatively removed from the column leading to a slow column bleed of thestrongly retained species. If this is suspected, the column should be flushedaccording to the manufacturer’s recommendations. A slowly rising baselinecan be caused by trisubstituted brominated haloacetic acids.
4.1.6 Chromatographic Interferences - The known chromatographic interferences forthe determination of bromate in drinking water via ICP-MS detection are listedin Table 1 and their approximate retention characteristics are reported in Figure2. These known interferences have been chromatographically resolved usingthe procedure described in this method. Given the diversity of environmentalsamples, the possibility of unidentified interferences exist. The following

321.8-7
section is written to provide the analyst with some guidance if an interferenceis identified. The two possible interferences are chromatographic overlap witha bromine containing species or a co-eluting polyatomic. In the case of co-elution with a bromine containing anion it is recommended that the analyst trythe following method modifications in the order presented in an attempt toresolve the co-elution.
1.) Use weaker mobile phases (i.e. lower NH4NO3
concentrations).2.) Alternative columns.3.) Pretreatment cartridge which selectively removes the
interference.
This co-elution should be documented and the changes in the mobile andstationary phase should produce a method capable of meeting all requirementsin Section 9.
In the case of a co-elution with a polyatomic interference (on mass 79), therecommendation to the analyst is to try the following method modifications inthe order presented in an attempt to resolve the co-elution.
1.) Use mass 81 for quantitation.2.) Use weaker mobile phases.3.) Alternative columns4.) Pretreatment cartridge to selectively remove the interference.
This co-elution should be documented and the changes in the mobile andstationary phase should produce a method capable of meeting all requirementsin Section 9.
4.1.7 Samples that contain particles larger than 0.45 microns and reagent solutionsthat contain particles larger than 0.2 micron require filtration to prevent damageto instrument columns and HPLC pumping system.
4.1.8 The analyst should be aware of the potential for carryover peaks from oneanalysis which will effect the proper detection of bromate in the subsequentanalysis. Carryover was not observed in the analysis listed in Table 3 using thecolumn, mobile phase and flow rate reported in Table 2. However, the analystshould be aware of the potential for carryover peaks.
4.1.9 Retention time shifts in ion chromatography are possible do to weak eluentstrengths and high ionic strength matrices. These shifts are minimized by theeluent system reported in table 2. However, the analyst should be aware of thepotential for retention time shifts do to high ionic strength matrices. Theseeffects can be minimized by dilution of the sample matrix.

321.8-8
5.0 SAFETY
5.1 The toxicity or carcinogenicity of bromate and reagents used in this method have notbeen fully established. Each chemical should be regarded as a potential health hazardand exposure to these compounds should be as low as reasonably achievable. Eachlaboratory is responsible for maintaining a current awareness file of OSHA regulationsregarding the safe handling of the chemicals specified in this method [10,11]. A referencefile of material data handling sheets should also be available to all personnel involved inthe chemical analysis. Specifically, concentrated nitric presents various hazards as it ismoderately toxic and extremely irritating to skin and mucous membranes. Use thesereagents in a fume hood whenever possible and if eye or skin contact occurs, flush withlarge volumes of water. Always wear safety glasses or a shield for eye protection,protective clothing, and observe proper mixing when working with these reagents.
5.2 Analytical plasma sources emit radio frequency radiation, in addition to intense UVradiation. Suitable precautions should be taken to protect personnel from such hazards.The inductively coupled plasma should only be viewed with proper eye protection fromUV emissions.
5.3 It is the responsibility of the user of this method to comply with relevant disposal andwaste regulations. For guidance see Sections 14.0 and 15.0.
6.0 EQUIPMENT AND SUPPLIES
6.1 Inductively coupled plasma mass spectrometer. This instrument must meet the followingrequirements:
6.1.1 An instrument capable of scanning the mass range 5-250 amu with a minimumresolution capability of 0.75 amu peak width at 5% peak height is required.This instrument may be fitted with a conventional or extended dynamic rangedetection system. The abundance sensitivity must be greater than 1.0 x 10⁶ onthe low side of mass 80 or such that the dimer’s (40Ar40Ar+)low mass shoulderdoes not influence mass 79.
6.1.2 Radio-frequency generator compliant with FCC regulations.
6.1.3 Argon gas supply - High purity grade (99.99%). When analyses are conductedfrequently, liquid argon is more economical.
6.1.4 A variable-speed peristaltic pump may be used to pump the drain of the spraychamber to waste.
6.1.5 A mass-flow controller on the nebulizer gas supply is required. A water-cooledspray chamber may be of benefit in reducing the water vapor entering the

321.8-9
plasma and thereby minimizing the 40Ar40ArH+. A double-pass spray chamberis recommended to increase background stability on mass 81 if 40Ar40ArH+ ispresent in the spectrum generated while nebulizing the mobile phase.
6.1.6 If an electron multiplier detector is being used, precautions should be taken,where necessary, to prevent exposure to high ion flux. Otherwise, changes ininstrument response or damage to the multiplier may result. This may be truefor samples containing bromide in the parts per million range.
6.1.7 A nebulizer with a low dead volume is recommended.
6.2 Ion Chromatograph. This instrument must meet the following specifications:
6.2.1 Eluent Pump - Programmable flow high pressure pumping system capable ofdelivering pressures up to 3000 psi and flow rates up to 1.5 ml/min.
6.2.2 Control Valves - Inert double stacked pneumatic operated 4 way valves capableof withstanding 3000 psi.
6.2.3 Sample Loops- narrow bore, high pressure tefzel® tubing or equivalent.
6.2.4 Tubing- narrow bore high pressure tefzel® tubing or equivalent.
6.2.5 Guard and Analytical Column - Dionex PA-100 or equivalent.
6.2.6 Suppressor - Dionex (ASRS) anion self regenerating suppressor or equivalent.
6.2.7 Pretreatment Cartridges - Dionex On-Guard-RP or equivalent
6.3 Analytical balance, with capability to measure to 0.1 mg, for use in weighing samplesand preparing standards.
6.4 An air displacement pipette capable of delivering volumes ranging from 50 to 2500 µLwith an assortment of high quality disposable pipet tips. Calibration of the pipetteshould be verified frequently by weighing aliquots of distilled deionized water using theanalytical balance to assure precision and accuracy of the pipette.
6.5 Labware - For determination of bromate, plastic labware has been used exclusively and
measurable concentrations of bromate in the blank have not been observed.
6.5.1 Narrow-mouth storage bottles, FEP (fluorinated ethylene propylene) withETFE (ethylene tetrafluorethylene) screw closure, 125-mL to 250-mLcapacities.
6.5.2 One-piece stem FEP wash bottle with screw closure, 125-mL capacity.

321.8-10
6.5.3 Syringes- 10cc Becton-Dickinson plastic syringes or equivalent.
7.0 REAGENTS AND STANDARDS
7.1 Reagents may contain elemental impurities that might affect the integrity of analyticaldata. Due to the high sensitivity of ICP-MS, high-purity reagents should be usedwhenever possible. All acids used for this method must be of ultra high-purity grade.The acid used to prepare the 5mM HNO3 in the mobile phase does contain somebromide background. Care should be taken to minimize this background intensity.
7.1.1 Nitric acid, concentrated (sp.gr. 1.41).
7.1.2 Nitric acid (1+1) - Add 500 mL conc. nitric acid to 400 mL of reagent gradewater and dilute to 1L.
7.1.3 Ammonium Nitrate - Fisher ACS certified or equivalent.
7.1.4 Sodium Hydroxide - Fisher 50/50 liquid mixture or equivalent.
7.2 Reagent water - All references to reagent grade water in this method refer to ASTMtype I water (ASTM D1193)[12]. Suitable water may be prepared by passing distilledwater through a mixed bed of anion and cation exchange resins.
7.3 Standard Stock Solutions - Stock standards may be purchased from a reputablecommercial source or prepared from ultra high-purity grade chemicals. These standardshave extremely low ionic strengths and should be pH adjusted to 10 (with NaOH)inorder to minimize bromate interaction with the plastic sample loop tubing[6]. Replacestock standards when they can not be verified with QC standards.
7.3.1 Preparation of calibration standards - a fresh bromate standard should beprepared once a month or as needed. Dilute the stock bromate standard solu-tion to levels appropriate to the operating range of the instrument using reagentwater and adjust the pH to 10 using NaOH. The bromate concentrations in thestandards should be sufficiently high to produce good isotope ratio precision(<2%) and to accurately define the slope of the response curve. Depending onthe sensitivity of the instrument, concentrations ranging from 10 µg/L to 50µg/L are suggested.
Note: A blank and one calibration standard or multi-pointcalibration can be utilized to calibrate the response of the instrument.
7.4 Drift standard - The drift standard should be made such that its concentration is
approximately five times higher than the bromate calibration standard. (This willcompensate for the sample loop volume difference between the sample and the driftstandard.) The drift standard concentration should be chosen based on analytical

321.8-11
precision (< 5% rsd of replicate peak integration).
7.5 Blanks - The calibration blank is used to establish and verify the analytical calibration.
7.5.1 Calibration blank - Consists of reagent grade water which is pH adjusted to 10with sodium hydroxide.
7.6 Tuning Solution - This solution is used for instrument tuning (lens, argon flows etc.),mass calibration and abundance sensitivity prior to analysis. The tuning solution shouldbe approximately twice the bromate calibration standard concentration (producinggreater than 30,000cps) and should be delivered to the plasma using a peristaltic pumpat a flow rate of 1 mL/min. The instrument should be tuned for maximum signal-to-noise using mass 79. After tuning, the tuning solution should be analyzed by scanningover masses 76-84 using 20 points per amu (skipping mass 80). This data can be usedto verify the mass calibration (mass shifts of greater than 0.1 amu should be corrected)and check the instrument sensitivity (approximately 35,000cps/100ppb bromate giventhe instrument conditions outlined in Table 2). The calibration blank or a 5mM HNO3
solution should then be analyzed using the same scanning conditions to check the massanalyzer’s abundance sensitivity. This preanalysis routine should be performed daily(seefigure 1).
7.7 Quality Control Sample (QCS) - The QCS should be obtained from a source outside the
laboratory. The concentration of the QCS solution analyzed will depend on thesensitivity of the instrument. To prepare the QCS dilute an appropriate aliquot bromateto a concentration which is approximately 75% of the concentration of the highestcalibration standard. The QCS should be analyzed as needed to meet data-quality needsand a fresh solution should be prepared quarterly or more frequently as needed.
7.8 Laboratory Fortified Blank (LFB) - To an aliquot of Calibration Blank add an aliquotof the stock standard solution to prepare the LFB. The fortified concentration shouldproduce percent relative standard deviations of 4-7% on replicate determinations. TheLFB must be carried through the same entire preparation scheme as the samples. Thissolution should be pH adjusted to 10 with sodium hydroxide.
8.0 SAMPLE COLLECTION, PRESERVATION, AND STORAGE
8.1 The pH of all aqueous samples should be tested immediately prior to analysis to ensurethe sample has been properly preserved. If the sample requires a pH adjustmentthroughly mix the sample after the sodium hydroxide has been added. The pH of thesample must be adjusted to 10. This pH adjustment should be performed just prior toanalysis. This pH adjustment assures the solubility of bromate within the sampleloop[6].

321.8-12
loop[6].
8.2 If required by the data user, prepare a field blank using reagent water. Use the samesample containers (see section 6.5.1 for container recommendations)as used in samplecollection.
9.0 QUALITY CONTROL
9.1 Each laboratory using this method is required to operate a formal quality control (QC)program. The minimum requirements of this program consist of an initial demonstrationof laboratory capability, and the periodic analysis of laboratory calibration blanks,fortified blanks and calibration solutions as a continuing check on performance. Thelaboratory is required to maintain performance records that define the quality of the datagenerated.
NOTE: Because the sample preparation step of this method is limited to pHadjustment prior to analysis, the number of required solutions needed to verifydata quality has been reduced. In this method the calibration blank (Section 7.5and 9.3) is used to establish baseline calibration and is used to verify theabsence of contamination. The laboratory fortified blank (Sections 7.8 and 9.3)is used to assess both method accuracy and instrument performance.
9.2 Initial Demonstration of Performance (mandatory)
9.2.1 The initial demonstration of performance is used to characterize instrumentperformance (determination of linear calibration range and analysis of qualitycontrol sample) and laboratory performance (determination of methoddetection limit) prior to analyses conducted by this method.
9.2.2 Linear dynamic range - Linear dynamic range is detector or chromatographicresolution limited.
The useable linear range must be determined for the instrument configurationto be used.
Note: The linear dynamic range may be limited by the chromatographicresolution of bromate from bromoacetic acid or other interferences. In thissituation, the linear calibration range is limited to a concentration ofbromate which can be chromatographically resolved from bromoacetic acid.Given the experimental conditions in Table 2, the linear dynamic range waslimited to 50µg/L based on chromatographic resolution.
9.2.3 Quality control sample (QCS) - When beginning the use of this method, on aquarterly basis or as required to meet data-quality needs, verify the calibration

321.8-13
standards and acceptable instrument performance with the preparation andanalyses of a QCS. To verify the calibration standards, the determined meanconcentration from three analyses of the QCS must be within ± 10% of thestated QCS value. If the calibration standards cannot be verified, the source ofthe problem must be identified and corrected before either proceeding on withthe initial determination of method detection limits or continuing with on-goinganalyses.
9.2.4 Method detection limit (MDL)- This should be established using reagent water(blank) fortified at a concentration of two to five times the estimated detectionlimit[13]. To determine MDL values, take seven replicate aliquots of thefortified reagent water and process through the entire analytical method.Perform all calculations defined in the method and report the concentrationvalues in the appropriate units. Calculate the MDL as follows:
MDL = (t)(n-1,1-alpha = 0.99) x (S)where:
(t)(n-1,1-alpha = 0.99) = Student's t value for a 99% confidence level and astandard deviation estimate with n-1 degrees of freedom (t=3.14 forseven replicates].n = number of replicatesS = standard deviation of the replicate analyses.
The MDL should be determined annually, when a new operator begins workor whenever, in the judgement of the analyst, a change in analyticalperformance caused by either a change in instrument hardware or operatingconditions would dictate they be redetermined.
The MDL for bromate using the conditions listed in Table 2 is 0.3 Fg/L.
9.3 Assessing Laboratory Performance (mandatory)
9.3.1 Calibration blank - Within this method a calibration blank and thelaboratory reagent blank are operationally the same. The calibration blankwill be used as the LRB and a fresh calibration blank should be made daily toverify the lack of contamination.
Analysis of the calibration blank can be used to verify the calibration baselineand to assess chromatographic carryover interference or contamination. Thecalibration blank should be analyzed as a sample. If the calibration blankproduces an integrable signal for bromate, the laboratory should find the sourceof this problem prior to analyzing samples. The laboratory must complete theanalysis of one calibration blank with each batch of 20 samples.

321.8-14
9.3.2 Laboratory fortified blank (LFB) - Within this method the LFB is used toassess both laboratory and instrument performance. The laboratory mustanalyze at least one LFB (Sect. 7.8) immediately after calibration and after each10 samples. Calculate accuracy as percent recovery using the followingequation:
LFB - CB R = ))))))))) x 100
s
where: R = percent recovery.LFB = laboratory fortified blank concentration.CB = calibration blank concentration.S = concentration equivalent of analyte added
to fortify the CB solution.
If the recovery falls outside the required control limits of 85-115%, bromate isjudged out of control, and the source of the problem should be identified andresolved before continuing analyses.
9.3.3 The laboratory must use LFB analyses data to assess laboratory performanceagainst the required control limits of 85-115%. When sufficient internalperformance data become available (usually a minimum of twenty to thirtyanalyses), optional control limits can be developed from the mean percentrecovery (x) and the standard deviation (S) of the mean percent recovery.These data can be used to establish the upper and lower control limits asfollows:
UPPER CONTROL LIMIT = x + 3S LOWER CONTROL LIMIT = x - 3S
The optional control limits must be equal to or better than the required controllimits of 85-115%. After each five to ten new recovery measurements, newcontrol limits can be calculated using only the most recent twenty to thirty datapoints. Also, the standard deviation (S) data should be used to establish an on-going precision statement for the level of concentrations included in the LFB.These data must be kept on file and be available for review.
Note: Using the experimental conditions in Table 2, the average recoveryof the LFB was 99.8% with a three sigma control limit of 10.2%
9.3.4 Instrument performance - For all determinations the laboratory must checkinstrument performance and verify that the instrument is properly calibrated ona continuing basis. This is accomplished via the recovery on the LFB (85-115%,section 9.3.2) and monitoring the instrument drift standard injected with

321.8-15
115%,section 9.3.2) and monitoring the instrument drift standard injected witheach sample.
9.3.5 Instrument Drift Standard - The analyst is expected to monitor the response
from the instrument drift standard(in each sample) throughout the sample setbeing analyzed. The absolute response of any one drift standard must notdeviate more than 70-130% of the original response associated with thecalibration blank. If deviations greater than these are observed, the reason forthe drift should be investigated. Possible causes of drift may be a partiallyblocked sampling cone or a change in the tuning condition of the instrument.
9.4 Assessing Analyte Recovery and Data Quality
9.4.1 The chemical nature of the sample matrix can affect analyte recovery and thequality of the data. Taking separate aliquots from the sample for replicate andfortified analyses can in some cases assess the effect. Unless otherwisespecified by the data user, laboratory or program, the following laboratoryfortified matrix (LFM) procedure is required.
9.4.2 The laboratory must add a known amount of analyte to a minimum of 10% ofthe routine samples. In each case the LFM aliquot must be a duplicate of thealiquot used for sample analysis. The added bromate concentration must be thesame as that used in the laboratory fortified blank. Over time all routine samplesources should be fortified.
9.4.3 Calculate the percent recovery for bromate, corrected for backgroundconcentrations measured in the unfortified sample, and compare these valuesto the designated LFM recovery range of 70-130%. Percent recovery may becalculated using the following equation:
Cs - CR = )))))) x 100
s
where: R = percent recovery.Cs = fortified sample concentration.C = sample background concentration. s = concentration equivalent of bromate added to fortify the
sample.
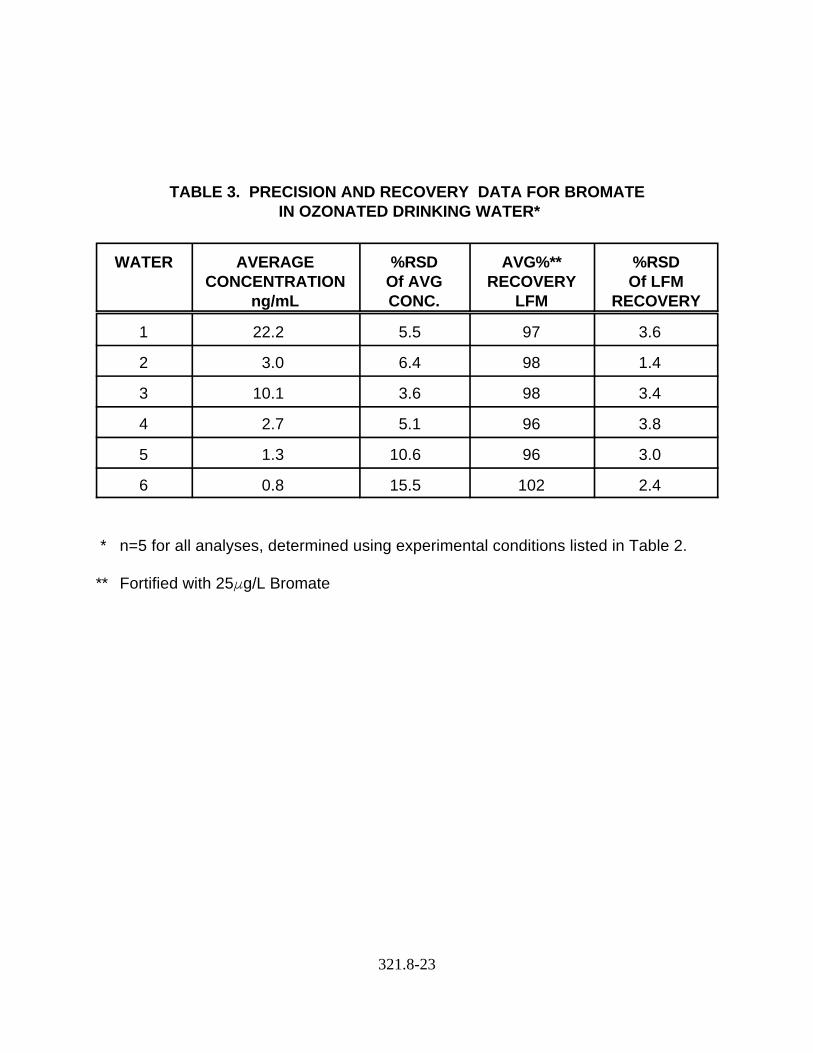
Note: The precision and recovery in six drinking water matrices arereported in Table 3.
9.4.4 If recovery falls outside the designated range and laboratory performance is

321.8-16
shown to be in control, the recovery problem encountered with the fortified sample isjudged to be matrix related, not system related. The data user should be informed thatthe result for the unfortified sample is suspect due to an uncorrected matrix effect.
10.0 CALIBRATION AND STANDARDIZATION
10.1 Operating conditions - Because of the diversity of instrument hardware, no detailedinstrument operating conditions are provided. The analyst is advised to follow therecommended operating conditions provided by the manufacturer. It is the responsibilityof the analyst to verify that the instrument configuration and operating conditions satisfythe analytical requirements of this method and to maintain quality control data verifyinginstrument performance and analytical results. Instrument operating conditions whichwere used to generate precision and recovery data for this method are included in Table2.
10.2 Precalibration routine - The following precalibration routine must be completed prior tocalibrating the instrument.
10.2.1 Initiate proper operating configuration of instrument and data system. Allowa period of not less than 30 min for the instrument to warm up. Conduct masscalibration and resolution checks using the tuning solution. The tuning solutionshould be analyzed by scanning over masses 76-83 using 20 points per amu(skipping mass 80). For good performance, adjust spectrometer resolution toproduce a peak width of approximately 0.75 amu at 5% peak height. Adjustmass calibration if it has shifted by more than 0.1 amu from unit mass. Theabundance sensitivity must be checked by analyzing the calibration blank(SeeFigure 1).
10.3 Instrument drift - An instrument drift solution must be injected into the column effluentat the same time a sample is injected onto the column to verify instrument driftthroughout the analysis of a set of samples. This solution does not traverse the column.The correction factor is calculated by ratioing the drift standard response in thecalibration solution to the drift standard response in the current sample. This correctionfactor is then multiplied by the sample concentration. This is similar to an internalstandard correction used in EPA Method 200.8[9].
Note: The stability of the baseline on mass 81 is strongly influenced by the ICpump being turned on and off. Therefore it is recommended that this pumpremain on throughout an analysis set.
10.4 Calibration - Prior to initial calibration, set up proper instrument software routines forthe collection of time resolved data. (See Table 2 for the experimental parameters usedto collect the data within the method.) The instrument must be calibrated using thecalibration blank and a calibration standard prepared at one or more concentration levels.
321.8-17
calibration blank and a calibration standard prepared at one or more concentration levels.If single point calibration is used, the standard concentration should be near thedetermined upper linear range.
10.5 The rinse blank should be used to flush the IC injection loop and by-pass loops. Thisprocedure is recommended between injections.
11.0 PROCEDURE
11.1 Aqueous Sample Preparation - The sample must be adjusted to pH 10 prior to analysis.The sample must be room temperature and pretreated with an on-guard RP cartridgeprior to analysis. The RP cartridges were used according to the manufacturer’srecommendations. Trisubstituted haloacetic acids (removed by the RP cartridge) cancause a slowly rising baseline because these trisubstituted haloacetic acids are stronglyretained on the column.
11.2 The sample is injected onto the column at the same time the instrument drift standard isinjected into the post column mobile phase. For sample and drift standard sample loopvolumes see table 2.
11.3 Samples having concentrations higher than the established linear dynamic range shouldbe diluted into range and reanalyzed.
12.0 DATA ANALYSIS AND CALCULATIONS
12.1 Sample data should be reported in units of µg/L for aqueous samples. Do not reportbromate concentrations below the determined MDL. Drift standard correction shouldbe applied to all sample concentrations.
12.2 For data values less than ten, two significant figures should be used for reportingelement concentrations. For data values greater than or equal to ten, three significantfigures should be used.
12.3 If additional dilutions were made to any samples, the appropriate dilution factor shouldbe applied.
12.4 The primary quantitative isotope should be 79 because it has the most stable backgroundand is less prone to the known interferences. Mass 81 should be monitored to verifythat the bromide isotope ratio within the retention window is near unity. A ratio of thetwo isotopes can provide useful information for the analyst in detecting a possiblespectral interference.
12.5 The QC data obtained during the analyses provide an indication of the quality of the
sample data and should be provided with the sample results.

321.8-18
13.0 METHOD PERFORMANCE
13.1 Instrument operating conditions used for single laboratory testing of the method aresummarized in Table 2.
13.2 Data obtained from single laboratory testing of the method are summarized in Table 3for six drinking water samples. The average concentrations reported in the secondcolumn are the native bromate concentrations. The percent relative standard deviationsassociated with the native concentrations are reported in the second column. Thesamples were then fortified with 25Fg/L bromate. The average recovery and precisionof this recovery is reported in the 4th and 5th columns respectively.
14.0 POLLUTION PREVENTION
14.1 Pollution prevention encompasses any technique that reduces or eliminates the quantityor toxicity of waste at the point of generation. Numerous opportunities for pollutionprevention exist in laboratory operation. The EPA has established a preferred hierarchyof environmental management techniques that places pollution prevention as themanagement option of first choice. Whenever feasible, laboratory personnel should usepollution prevention techniques to address their waste generation. When wastes cannotbe feasibly reduced at the source, the Agency recommends recycling as the next bestoption.
14.2 For information about pollution prevention that may be applicable to laboratories andresearch institutions, consult “Less is Better: Laboratory Chemical Management forWaste Reduction”, available from the American Chemical Society's Department ofGovernment Relations and Science Policy, 1155 16th Street N.W., Washington D.C.20036, (202)872-4477.
15.0 WASTE MANAGEMENT
15.1 The Environmental Protection Agency requires that laboratory waste managementpractices be conducted consistent with all applicable rules and regulations. The Agencyurges laboratories to protect the air, water, and land by minimizing and controlling allreleases from hoods and bench operations, complying with the letter and spirit of anysewer discharge permits and regulations, and by complying with all solid and hazardouswaste regulations, particularly the hazardous waste identification rules and land disposalrestrictions. For further information on waste management consult “The WasteManagement Manual for Laboratory Personnel”, available from the American ChemicalSociety at the address listed in the Section 14.2.

321.8-19
16. References
1. Gray A.L. and A. R. Date. Inductively Coupled Plasma Source Mass SpectrometryUsing Continuum Flow Ion Extraction. Analyst 108, 1033-1050, 1983.
2. Houk R.S., V.A. Fassel, G.D. Flesch, H.J. Svec, A.L. Gray, C.E. Taylor. InductivelyCoupled Argon Plasma as an Ion Source for Mass Spectrometric Determination of TraceElements. Anal. Chem. 52, 2283-2289, 1980.
3. Houk R.S.. Mass Spectrometry of Inductively Coupled Plasmas. Anal. Chem. 58, 97A-105A, 1986.
4. Heitkemper D.T., L.A. Kaine, D.S. Jackson, K.A. Wolnik. Practical Applications ofElement-Specific Detection by Inductively Coupled Plasma Atomic EmissionSpectroscopy and Inductively Coupled Plasma Mass Spectrometry to IonChromatography of Food. J. Chrom. A. 671, 101-108, 1994.
5. Creed J.T., M.L. Magnuson, J.D. Pfaff, C.A. Brockhoff. Determination of Bromate inDrinking Waters by Ion Chromatography With Inductively Coupled Plasma MassSpectrometric Detection. J. Chrom. A. 753, 261-67, 1996.
6. Creed J.T., M.L. Magnuson, C.A. Brockhoff. Determination Of Bromate in the Presenceof Brominated Haloacetic Acids by Ion Chromatography With Inductively CoupledPlasma Mass Spectrometric Detection. ES&T 31, 2059-2063, 1997.
7. Diemer J., K.G. Heumann. Bromide / Bromate Speciation by NTI-IDMS and ICP-MSCoupled With Ion Exchange Chromatography. Fres. J. Anal. Chem. 357, 74-79, 1997.
8. Inductively Coupled Plasmas in Analytical Atomic Spectrometry, Second Edition,copyright 1992 VCH Publishers, edited by Akbar Montaser and D.W. Golightly,Chapter 12.
9. US EPA Method 200.8, Determination of Trace Elements in Waters and Wastes byInductively Coupled Plasma - Mass Spectrometry, Revision 5.4, 1994. Available fromthe National Technical Information Service (NTIS) as PB-94-184942.
10. Carcinogens - Working With Carcinogens, Department of Health, Education, andWelfare, Public Health Service, Center for Disease Control, National Institute forOccupational Safety and Health, Publication No. 77-206, Aug. 1977. Available fromthe National Technical Information Service (NTIS) as PB-277256.
11. Safety in Academic Chemistry Laboratories, American Chemical Society Publication,Committee on Chemical Safety, 3rd Edition, 1979.
12. American Society for Testing and Materials. Standard Specification for Reagent Water,

321.8-20
D1193-77. Annual Book of ASTM Standards, Vol. 11.01. Philadelphia, PA, 1991.
13. Code of Federal Regulations 40, Ch. 1, Pt. 136 Appendix B.

321.8-21
TABLE 1. SPECTRAL AND CHROMATOGRAPHIC INTERFERENCES
Spectral Interferences
InterferentSource
MASS79
MASS81
Plasma 40Ar38ArH+ 40Ar40ArH+
Sulfate* SO3H+
Phosphate** PO3+ PO3H2
+
Potassium 40Ar39K+
* Determined in 300 Fg/mL sulfate.** Determined in 100 Fg/mL phosphate.
Potential Chromatographic or Coelution Interferences
Retention Time*
Bromate 230Bromoacetic Acid 170Dibromoacetic Acid 460Bromochloroacetic Acid 400Bromide 570Phosphate Matrix (PO3
+) 180Sulfate Matrix (SO3H
+) 400
*Based on experimental conditions listed in Table 2. Reported in seconds to theleading edge of the peak using the drift standard as t = 0.

321.8-22
TABLE 2. EXPERIMENTAL CONDITIONS FOR THE DETECTION OF BROMATE VIA ICP-MS
ICP-MS Experimental Condition and Detection LimitInstrument Upgraded VG Elemental PQ1
Power 1.4 KW
Cool Gas 12.0 L/min
Aux Gas 1.2 L/min
Nebulizer Gas 0.957 L/min (Concentric)
m/z Monitored 79 and 81
Analysis Mode Time Resolved or Chromatographic
Time Slice 0.4 seconds
Spray Chamber 5EC
Sensitivity (100Fg/L BrO3 -) 35,000cps m/z 79
Background (5mM HNO3 + 25mM NH4NO3 ) 100 cps m/z=79; 2500cps m/z=81
Detection Limit 0.3Fg/L
Chromatographic Experimental ConditionsChromatograph Dionex Gradient GPM-2Column PA100 Guard and Analytical
Flowrate 1 mL/min.
Pretreatment Cartridge On-Guard RP
Mobile Phase 5mM HNO3 + 25mM NH4NO3 (Isocratic)
Sample Loop 580 FL (based on i.d. and length)
Drift Standard Loop 170 FL
321.8-23
TABLE 3. PRECISION AND RECOVERY DATA FOR BROMATE IN OZONATED DRINKING WATER*
WATER AVERAGECONCENTRATION
ng/mL
%RSDOf AVGCONC.
AVG%**RECOVERY
LFM
%RSDOf LFM
RECOVERY
1 22.2 5.5 97 3.6
2 3.0 6.4 98 1.4
3 10.1 3.6 98 3.4
4 2.7 5.1 96 3.8
5 1.3 10.6 96 3.0
6 0.8 15.5 102 2.4
* n=5 for all analyses, determined using experimental conditions listed in Table 2.
** Fortified with 25Fg/L Bromate

321.8-24
Abundance Sensitivity Considerationsfor Bromate Analysis
Figure 1:
75 76 77 78 79 80 81 82 830
100
200
300
400A) Borderline abundance sensitivity
ExtrapolationLine
75 76 77 78 79 80 81 82 830
50
100
150
200
250
300B) Good abundance sensitivity
ExtrapolationLine

321.8-25