method 1657a: organo-halide pesticides in wastewater, soil
TRANSCRIPT

Office of Water www.epa.gov September 2000
Method 1657, Revision A: Organo-Phosphorus Pesticides in Wastewater, Soil, Sludge, Sediment, and Tissue by GC/FPD

EPA-821-R-00-018 September 2000
METHOD 1657
ORGANO-PHOSPHORUS PESTICIDES IN WASTEWATER, SOIL, SLUDGE, SEDIMENT, AND TISSUE BY GC/FPD
Revision A
September 2000
Method 1657, Revision A
Acknowledgments
This method was developed under the direction of William A. Telliard of the Engineering and Analysis Division (EAD) within the U.S. Environmental Protection Agency's (EPA's) Office of Science and Technology (OST).
Disclaimers
This Method has been reviewed and approved for publication by the Analytical Methods Staff within EPA’s Engineering and Analysis Division. Mention of trade names or commercial products does not constitute endorsement or recommendation for use.
Introduction
Method 1657 was developed by the U.S. Environmental Protection Agency's (EPA's) Office of Science and Technology for measurement of organo-phosphorus (O-P) pesticides in wastewater, soil, sludge, and sediment. EPA Method 1657 has been expanded through revision A to include measurement of O-P pesticides in fish to support EPA's National Fish Survey.
Further Information
Questions concerning this Method or its application should be addressed to:
W.A. Telliard, Director Analytical Methods Staff (4303) Office of Science and Technology U.S. Environmental Protection Agency Ariel Rios Building 1200 Pennsylvania Avenue, N.W. Washington, D.C. 20460 Phone: 202/260–7134 Fax: 202/260–7185
Requests for copies of this Method should be addressed to:
EPA Sample Control Center c/o DynCorp Environmental 6101 Stevenson Avenue Alexandria, VA 22314 Phone: 703-461-2100 Fax: 703-461-8056 E-mail: [email protected]
September 2000 ii
Method 1657, Revision A
Note: This method is performance based. The laboratory is permitted to omit any step or modify any procedure provided that all performance requirements in this Method are met. The laboratory may not omit any quality control analyses. The terms "shall," "must," and “may not” define procedures required for producing reliable results. The terms "should" and "may" indicate optional steps that may be modified or omitted if the laboratory can demonstrate that the modified method produces results equivalent or superior to results produced by this Method.
September 2000 iii
Method 1657, Revision A
Method 1657, Revision A Organo-Phosphorus Pesticides in Wastewater, Soil, Sludge,
Sediment, and Tissue by GC/FPD
1.0 Scope and Application
1.1 Method 1657, Revision A (Method 1657A, the “Method”) is for determination of organo-phosphorus pesticides and other analytes amenable to extraction and analysis by wide-bore capillary column gas chromatography combined with a flame photometric detector (GC/FPD). The Method is for use in EPA's data gathering and monitoring programs associated with the Clean Water Act, the Resource Conservation and Recovery Act, the Comprehensive Environmental Response, Compensation and Liability Act, and the Safe Drinking Water Act.
1.2 The analytes listed in Table 1 may be determined in wastewater, soil, sediment, sludge, and tissue by this Method. In addition, Method 1657A may be applicable to other phosphorus containing pesticides. The quality control (QC) requirements in this Method give the steps necessary to determine this applicability. Not all analytes listed in Table 1 have corresponding calibration data in Table 3 or QC acceptance criteria in Table 4. Calibration data for such analytes may be found in other EPA methods (References 1 and 2).
1.3 This Method is applicable to a large number of analytes. Calibrating the GC systems for all analytes is time-consuming. If only a single analyte or small number of analytes are to be tested for, it is only necessary to calibrate the GC systems and meet the performance specifications detailed in this Method for the analyte(s) of interest. In addition, the GC conditions can be optimized for these analytes provided that all performance specifications in this Method are met.
1.4 When this Method is applied to analysis of unfamiliar samples, analyte identity must be supported by at least one additional qualitative technique. This Method describes analytical conditions for a second gas chromatographic column that can be used to confirm measurements made with the primary column. Gas chromatography/mass spectrometry (GC/MS) can be used to confirm analytes in extracts produced by this Method when analyte levels are sufficient.
1.5 The detection limits of this Method are usually dependent on the level of interferences rather than instrumental limitations. The method detection limits (MDLs; 40 CFR 136, Appendix B) in Table 2 typify the minimum quantities that can be detected with no interferences present.
1.6 This Method is for use by or under the supervision of analysts experienced in the use of a gas chromatography and in the interpretation of gas chromatographic data. Each laboratory that uses this Method must demonstrate the ability to generate acceptable results using the procedure in Section 9.2.
2.0 Summary of Method
2.1 Extraction—The extraction technique depends on the nature and solids content of the sample.
2.1.1 Aqueous samples containing less than 1% solids.
September 2000 11

Method 1657, Revision A
2.1.1.1 Samples containing water-insoluble analytes—A 1-L sample is extracted with methylene chloride using continuous extraction techniques.
2.1.1.2 Samples containing highly water-soluble analytes such as methamidophos—Salt is added to a 1-L sample and the sample is extracted with an azeotropic mixture of chloroform:acetone using continuous extraction techniques.
2.1.2 Samples containing greater than 1% solids.
2.1.2.1 Non-sludge samples—If the solids content is 1 to 30%, the sample is diluted to 1% solids with reagent water, homogenized ultrasonically, and extracted as an aqueous sample. If the solids content is greater than 30%, the sample is extracted with methylene chloride:acetone using ultrasonic techniques.
2.1.2.2 Sewage sludge samples and other intractable sample types—If the solids content is less than 30%, the sample is diluted to 1% solids and extracted as an aqueous sample. If the solids content is greater than 30%, the sample is extracted with acetonitrile and then methylene chloride using ultrasonic techniques. The extract is back-extracted with 2% (w/v) sodium sulfate in reagent water to remove water-soluble interferences and residual acetonitrile.
2.1.3 Fish and other tissue samples are homogenized, dried with sodium sulfate, and extracted with 1:1 methylene chloride:hexane using Soxhlet extraction (Section 12.3).
2.2 Concentration—Each extract is dried over sodium sulfate and concentrated using a Kuderna-Danish evaporator.
2.3 Cleanup—Cleanup procedures include gel permeation chromatography (GPC) and/or solid-phase extraction. After cleanup, the extract is concentrated (Section 13).
2.4 Gas chromatography—A 1-FL aliquot of the concentrated extract is injected into the gas chromatography (GC). The analytes are separated on a wide-bore, fused-silica capillary column and detected using a flame photometric detector. For analyte confirmation, a 1-FL aliquot of the extract is injected into a column containing a dissimilar stationary phase.
2.5 Identification of a pollutant (qualitative analysis) is performed by comparing the GC retention times of the analyte on two dissimilar columns with the respective retention times of an authentic standard. Analyte identity is confirmed when the retention times agree within their respective windows.
2.6 Quantitative analysis is performed by using an authentic standard to produce a calibration factor or calibration curve, and using the calibration data to determine the concentration of a pollutant in the extract. The concentration in the sample is calculated using the sample weight or volume and the extract volume.
2.7 Quality is assured through reproducible calibration and testing of the extraction and GC systems.
September 2000 22

Method 1657, Revision A
3.0 Definitions
Definitions are given in the glossary at the end of this Method.
4.0 Contamination and Interferences
4.1 Solvents, reagents, glassware, and other sample-processing hardware may yield artifacts and/or elevated baselines causing misinterpretation of chromatograms. All materials used in the analysis shall be demonstrated to be free from interferences under the conditions of analysis by running Method blanks as described in Section 9.5.
4.2 Glassware and, where possible, reagents are cleaned by rinsing with solvent and baking at 450 EC for a minimum of 1 hour in a muffle furnace or kiln. Some thermally stable materials, such as PCBs, may not be eliminated by this treatment and thorough rinsing with acetone and pesticide-quality hexane may be required.
4.3 Specific selection of reagents and purification of solvents by distillation in all-glass systems may be required.
4.4 Interferences co-extracted from samples will vary considerably from source to source, depending on the diversity of the site being sampled. The cleanup procedures given in this Method can be used to overcome many of these interferences, but unique samples may require additional cleanup to achieve the minimum levels given in Table 2.
4.5 Cleanup of tissue—The natural lipid content of tissue can interfere in the analysis of tissue samples. The lipid contents of different species and portions of tissue can vary widely. Lipids are soluble to varying degrees in various organic solvents and may be present in sufficient quantity to overwhelm the column chromatographic purification procedures used for sample extracts. Lipids are removed by the cleanup procedures in Section 13.
5.0 Safety
5.1 The toxicity or carcinogenicity of each analyte or reagent used in this Method has not been precisely determined; however, each analyte or reagent should be treated as a potential health hazard. Exposure to these analytes should be reduced to the lowest possible level.
5.2 This Method does not address all safety issues associated with its use. The laboratory is responsible for maintaining a current awareness file of OSHA regulations for the safe handling of the chemicals specified in this Method. OSHA rules require that a reference file of material safety data sheets (MSDSs) must be made available to all personnel involved in these analyses (29 CFR 1917.28, appendix E). It is also suggested that the laboratory perform personal hygiene monitoring of each analyst who uses this Method and that the results of this monitoring be made available to the analyst. Personnel hygiene monitoring should be performed using OSHA or NIOSH approved personal hygiene monitoring methods. Additional information on laboratory safety can be found in References 3-5.
5.3 Unknown samples may contain high concentrations of volatile toxic analytes. Sample containers should be opened in a hood and handled with gloves that will prevent exposure. The oven used for sample
September 2000 33

Method 1657, Revision A
drying to determine percent moisture should be located in a hood so that vapors from samples do not create a health hazard in the laboratory.
6.0 Apparatus and Materials
NOTE: Brand names, suppliers, and part numbers are for illustrative purposes only. No endorsement is implied. Equivalent performance may be achieved using apparatus and materials other than those specified here, but demonstration of equivalent performance meeting the requirements of this Method is the responsibility of the laboratory.
6.1 Sampling equipment for discrete or composite sampling.
6.1.1 Sample bottles and caps.
6.1.1.1 Liquid samples (waters, sludges and similar materials that contain less than 5% solids)—Sample bottle, amber glass, 1-L or 1-quart, with screw-cap.
6.1.1.2 Solid samples (soils, sediments, sludges, filter cake, compost, and similar materials that contain greater than 5% solids)—Sample bottle, wide-mouth, amber glass, 500-mL minimum.
6.1.1.3 If amber bottles are not available, samples shall be protected from light.
6.1.1.4 Bottle caps—Threaded to fit sample bottles. Caps shall be lined with fluoropolymer.
6.1.1.5 Cleaning.
6.1.1.5.1 Bottles are detergent-water washed, then rinsed with solvent or baked at 450 EC for a minimum of 1 hour before use.
6.1.1.5.2 Liners are detergent water washed, then rinsed with reagent water and solvent, and baked at approximately 200EC for a minimum of 1 hour prior to use.
6.1.2 Compositing equipment—Automatic or manual compositing system incorporating glass containers cleaned per bottle cleaning procedure above. Sample containers are kept at 0 to 4 EC during sampling. Glass or fluoropolymer tubing only shall be used. If the sampler uses a peristaltic pump, a minimum length of compressible silicone rubber tubing may be used in the pump only. Before use, the tubing shall be thoroughly rinsed with methanol, followed by repeated rinsings with reagent water to minimize sample contamination. An integrating flow meter is used to collect proportional composite samples.
6.2 Equipment for glassware cleaning - Laboratory sink with overhead fume hood.
6.3 Equipment for sample preparation.
6.3.1 Laboratory fume hood of sufficient size to contain the sample preparation equipment listed below.
September 2000 44

Method 1657, Revision A
6.3.2 Glove box (optional).
6.3.3 Equipment for tissue grinding and homogenization
6.3.3.1 Tissue homogenizer—VirTis Model 45 Macro homogenizer (American Scientific Products H-3515, or equivalent) with stainless steel Macro-shaft and Turbo-shear blade.
6.3.3.2 Meat grinder—Hobart, or equivalent, with 3-5 mm holes in inner plate.
6.3.4 Equipment for determining percent moisture.
6.3.4.1 Oven, capable of maintaining a temperature of 110EC (±5EC).
6.3.4.2 Desiccator.
6.3.4.3 Crucibles, porcelain.
6.3.4.4 Weighing pans, aluminum.
6.3.5 Balances.
6.3.5.1 Analytical—Capable of weighing 0.1 mg.
6.3.5.2 Top loading—Capable of weighing 10 mg.
6.4 Extraction equipment.
6.4.1 Equipment for ultrasonic extraction.
6.4.1.1 Sonic disrupter—375-watt with pulsing capability and ½” or ¾” disrupter horn (Ultrasonics, Inc, Model 375C, or equivalent).
6.4.1.2 Sonabox (or equivalent)—For use with disrupter.
6.4.2 Equipment for liquid-liquid extraction.
6.4.2.1 Continuous liquid-liquid extractor—Fluoropolymer or glass connecting joints and stopcocks without lubrication, 1.5- to 2-L capacity (Hershberg-Wolf Extractor, Cal-Glass, Costa Mesa, California, 1000- to 2000-mL continuous extractor, or equivalent).
6.4.2.2 Round-bottom flask—500-mL, with heating mantle.
6.4.2.3 Condenser—Graham, to fit extractor.
6.4.2.4 pH meter—With combination glass electrode.
6.4.2.5 pH paper—Wide-range (Hydrion Papers, or equivalent).
September 2000 55
Method 1657, Revision A
6.4.3 Separatory funnels—250-, 500-, 1000-, and 2000-mL, with fluoropolymer stopcocks.
6.4.4 Filtration apparatus.
6.4.4.1 Glass powder funnels—125- to 250-mL.
6.4.4.2 Filter paper for above (Whatman 41, or equivalent).
6.4.5 Beakers.
6.4.5.1 1.5- to 2-L, calibrated to 1 L.
6.4.5.2 400- to 500-mL.
6.4.6 Spatulas—Stainless steel or fluoropolymer.
6.4.7 Drying column—400 mm long x 15 to 20 mm ID Pyrex chromatographic column equipped with coarse glass frit or glass wool plug.
6.4.7.1 Pyrex glass wool—Extracted with solvent or baked at 450EC for a minimum of 1 hour.
6.4.8 Evaporation/concentration apparatus.
6.4.8.1 Kuderna-Danish (K-D) apparatus.
6.4.8.1.1 Evaporation flask—500-mL (Kontes K-570001-0500, or equivalent), attached to concentrator tube with springs (Kontes K-662750-0012).
6.4.8.1.2 Concentrator tube—10-mL, graduated (Kontes K-570050-1025, or equivalent) with calibration verified. Ground-glass stopper (size 19/22 joint) is used to prevent evaporation of extracts.
6.4.8.1.3 Snyder column—Three-ball macro (Kontes K-503000-0232, or equivalent).
6.4.8.1.4 Snyder column—Two-ball micro (Kontes K-469002-0219, or equivalent).
6.4.8.1.5 Boiling chips.
6.4.8.1.5.1 Glass or silicon carbide—Approximately 10/40 mesh, extracted with methylene chloride and baked at 450EC for a minimum of 1 hour.
6.4.8.1.5.2 Fluoropolymer (optional)—Extracted with methylene chloride.
6.4.8.2 Water bath—Heated, with concentric ring cover, capable of temperature control (±2EC), installed in a fume hood.
September 2000 66
Method 1657, Revision A
6.4.8.3 Nitrogen-evaporation device—Equipped with heated bath that can be maintained at 35 to 60EC (N-Evap, Organomation Associates, Inc., or equivalent).
6.4.8.4 Sample vials—Amber glass, 1- to 5-mL with fluoropolymer-lined screw- or crimp-cap, to fit GC auto sampler.
6.4.9 Equipment for Soxhlet extraction.
6.4.9.1 Soxhlet—50-mm ID, 200-mL capacity with 500-mL flask (Cal-Glass LG-6900, or equivalent, except substitute 500-mL round-bottom flask for 300-mL flat-bottom flask).
6.4.9.2 Thimble—43 × 123 to fit Soxhlet (Cal-Glass LG-6901-122, or equivalent).
6.4.9.3 Moisture trap—Dean Stark or Barret with fluoropolymer stopcock, to fit Soxhlet.
6.4.9.4 Heating mantle—Hemispherical, to fit 500-mL round-bottom flask (Cal-Glass LG-8801112, or equivalent).
6.4.9.5 Variable transformer—Powerstat (or equivalent), 110-volt, 10-amp.
6.5 Apparatus for extract cleanup.
6.5.1 Automated gel permeation chromatography (Analytical Biochemical Labs, Inc, Columbia, MO, Model GPC Autoprep 1002, or equivalent).
6.5.1.1 Column—600 to 700 mm long x 25 mm ID, packed with 70 g of SX-3 Bio-beads (Bio-Rad Laboratories, Richmond, CA, or equivalent).
6.5.1.2 Syringe—10-mL, with Luer fitting.
6.5.1.3 Syringe-filter holder—Stainless steel with glass fiber or fluoropolymer filters (Gelman Acrodisc-CR, 1 to 5 µ, or equivalent).
6.5.1.4 UV detectors—254 nm, preparative or semi-prep flow cell (Isco, Inc., Type 6; Schmadzu, 5 mm path length; Beckman-Altex 152W, 8 µL micro-prep flow cell, 2 mm path; Pharmacia UV-1, 3 mm flow cell; LDC Milton-Roy UV-3, monitor #1203; or equivalent).
6.5.2 Oven-For baking and storage of absorbents, capable of maintaining a constant temperature (±5 EC) in the range of 105-250 EC.
6.5.3 Vacuum system and cartridges for solid-phase extraction (SPE).
6.5.3.1 Vacuum system—Capable of achieving 0.1 bar (house vacuum, vacuum pump, or water aspirator), with vacuum gauge.
6.5.3.2 VacElute Manifold (Analytichem International, or equivalent).
September 2000 77
Method 1657, Revision A
6.5.3.3 Vacuum trap—Made from 500-mL sidearm flask fitted with single-hole rubber stopper and glass tubing.
6.5.3.4 Rack—For holding 50-mL volumetric flasks in the manifold.
6.5.3.5 Column—Mega Bond Elut, Non-polar, C18 Octadecyl, 10 g/60 mL (Analytichem International Cat. No. 607H060, or equivalent).
6.5.4 Chromatographic column—400 mm long x 22 mm ID, with fluoropolymer stopcock and coarse frit (Kontes K-42054, or equivalent).
6.6 Centrifuge apparatus.
6.6.1 Centrifuge—Capable of rotating 500-mL centrifuge bottles or 15-mL centrifuge tubes at 5,000 rpm minimum.
6.6.2 Centrifuge bottles—500-mL, with screw-caps, to fit centrifuge.
6.6.3 Centrifuge tubes—12- to 15-mL, with screw-caps, to fit centrifuge.
6.6.4 Funnel—Buchner, 15 cm.
6.6.4.1 Flask—Filter, for use with Buchner funnel.
6.6.4.2 Filter paper—15 cm (Whatman #41, or equivalent).
6.7 Miscellaneous glassware.
6.7.1 Pipettes—Glass, volumetric, 1-, 5-, and 10-mL.
6.7.2 Syringes—Glass, with Luerlok tip, 0.1-, 1- and 5-mL. Needles for syringes, 2", 22-gauge.
6.7.3 Volumetric flasks—10-, 25-, and 50-mL.
6.7.4 Scintillation vials—Glass, 20- to 50-mL, with fluoropolymer-lined screw-caps.
6.7.5 Glass funnel-125-250mL.
6.7.6 Glass-fiber filter paper-Whatman GF/D (or equivalent), to fit glass funnel in Section 6.7.5.
6.8 Gas chromatography —Shall have splitless or on-column simultaneous automated injection into separate capillary columns with a flame photometric detector at the end of each column, temperature program with isothermal holds, data system capable of recording simultaneous signals from the two detectors, and shall meet all of the performance specifications in Section 14.
6.8.1 GC columns—Bonded-phase fused-silica capillary.
September 2000 88
Method 1657, Revision A
6.8.1.1 Primary—30 m (±3 m) long x 0.5 mm (±0.05 mm) ID DB-1, or equivalent.
6.8.1.2 Confirmatory—DB-1701, or equivalent, with same dimensions as primary column.
6.8.2 Data system—Shall collect and record GC data, store GC runs on magnetic disk or tape, process GC data, compute peak areas, store calibration data including retention times and calibration factors, identify GC peaks through retention times, compute concentrations, and generate reports.
6.8.2.1 Data acquisition—GC data shall be collected continuously throughout the analysis and stored on a mass storage device.
6.8.2.2 Calibration factors and calibration curves—The data system shall be used to record and maintain lists of calibration factors and multipoint calibration curves (Section 10). Computations of relative standard deviation (RSD; coefficient of variation) are used for testing calibration linearity. Statistics on initial (Section 9.2) and ongoing (Section 15.5) performance shall be computed and maintained.
6.8.2.3 Data processing—The data system shall be used to search, locate, identify, and quantify the analytes of interest in each GC analysis. Software routines shall be employed to compute and record retention times and peak areas. Displays of chromatograms and library comparisons are required to verify results.
6.8.2.4 Flame photometric detector—Capable of detecting 11 pg of malathion under the analysis conditions given in Table 2.
7.0 Reagents and Standards
7.1 Sample preservation—Sodium thiosulfate (ACS), granular.
7.2 pH adjustment.
7.2.1 Sodium hydroxide—Reagent grade.
7.2.1.1 Concentrated solution (10N)—Dissolve 40 g NaOH in 100-mL reagent water.
7.2.1.2 Dilute solution (0.1M)—Dissolve 4 g NaOH in 1 L of reagent water.
7.2.2 Sulfuric acid (1+1)—Reagent grade, 6N in reagent water. Slowly add 50 mL H2SO4 (specific gravity 1.84) to 50 mL reagent water.
7.2.3 Potassium hydroxide—37% (w/v); dissolve 37 g KOH in 100 mL reagent water.
7.3 Solution drying and back-extraction.
September 2000 99
Method 1657, Revision A
7.3.1 Sodium sulfate—Reagent grade, granular anhydrous (Baker 3375, or equivalent), rinsed with methylene chloride (20 mL/g), baked at 450 EC for a minimum of 1 hour, cooled in a desiccator, and stored in a pre-cleaned glass bottle with screw-cap which prevents moisture from entering.
7.3.2 Sodium sulfate solution—2% (w/v) in reagent water, pH adjusted to 8.5 to 9.0 with KOH or H2SO4.
7.3.3 Sodium sulfate, reagent grade, powdered, treated as in Section 7.3.1 - Used for drying solids and tissue samples.
7.3.4 Activated silica gel—100-200 mesh, Supelco 1-3651 (or equivalent), rinsed with methylene chloride, baked at 180EC for a minimum of 1 hour, cooled in a desiccator, and stored in a precleaned glass bottle with screw-cap that will prevent moisture from entering.
7.4 Solvents—Methylene chloride, hexane, acetone, acetonitrile, isooctane, and methanol; pesticide-quality; lot-certified to be free of interferences.
7.5 GPC calibration solution—Solution containing 300 mg/mL corn oil, 15 mg/mL bis(2ethylhexyl)phthalate, 1.4 mg/mL pentachlorophenol, 0.1 mg/mL perylene, and 0.5 mg/mL sulfur.
7.6 Sample cleanup.
7.6.1 Solid-phase extraction.
7.6.1.1 SPE cartridge calibration solution—2,4,6-trichlorophenol, 0.1 µg/mL in acetone.
7.6.1.2 SPE elution solvent—methylene chloride:acetonitrile:hexane (50:3:47).
7.6.2 GPC column packing-Bio-beads, SX-3, (Bio-Rad Laboratories, Richmond, CA, or equivalent).
7.7 Reference matrices.
7.7.1 Reagent water—Water in which the analytes of interest and interfering analytes are not detected by this Method.
7.7.2 High-solids reference matrix—Playground sand or similar material in which the analytes of interest and interfering analytes are not detected by this Method. Maybe prepared by extraction with methylene chloride and/or baking at 450 EC for 4 hours minimum.
7.7.3 Tissue reference matrix—Corn or other vegetable oil, prepared by extraction with methylene chloride.
7.8 Standard solutions—Purchased as solutions or mixtures with certification to their purity, concentration, and authenticity, or prepared from materials of known purity and composition. If analyte purity is 96% or greater, the weight may be used without correction to compute the concentration of the standard. When not being used, standards are stored in the dark at -20 to -10 EC in screw-capped vials with fluoropolymer-lined lids. A mark is placed on the vial at the level of the solution so that solvent
September 2000 1010
Method 1657, Revision A
evaporation loss can be detected. The vials are brought to room temperature prior to use. Any precipitate is redissolved and solvent is added if solvent loss has occurred.
7.9 Preparation of stock solutions—Prepare in isooctane per the steps below. Observe the safety precautions in Section 5.
7.9.1 Dissolve an appropriate amount of assayed reference material in solvent. For example, weigh 10 mg of malathion in a 10-mL ground-glass stoppered volumetric flask and fill to the mark with isooctane. After the malathion is completely dissolved, transfer the solution to a 15-mL vial with fluoropolymer-lined cap.
7.9.2 Stock solutions should be checked for signs of degradation prior to the preparation of calibration or performance test standards.
7.9.3 Stock standard solutions shall be replaced after 6 months, or sooner if comparison with quality control check standards indicates a change in concentration.
7.10 Secondary mixtures—Using stock solutions (Section 7.9), prepare mixtures at the levels shown in Table 3 for calibration and calibration verification (Sections 10.3 and 15.4), for initial and ongoing precision and recovery (Sections 9.2 and 15.5), and for spiking into the sample matrix (Section 9.4).
7.11 Surrogate spiking solution—Prepare tributyl phosphate and triphenyl phosphate each at a concentration of 10 µg/mL in acetone.
7.12 Stability of solutions—All standard solutions (Section 7.8) shall be analyzed within 48 hours of preparation and on a monthly basis thereafter for signs of degradation. Standards will remain acceptable if the peak area remains within ±15% of the area obtained in the initial analysis of the standard.
7.13 Combined QC standard—Mix equal volumes of the high concentration calibration solutions (Table 3) to produce this standard. It is used for calibration (Section 10.4), calibration verification (Section 15.4), and for initial (Section 9.2.) and ongoing (Section 15.5) demonstrations of method performance.
8.0 Sample Preservation
8.1 Collect aqueous samples in glass containers following conventional sampling practices (Reference 7), except that the bottle shall not be prerinsed with sample before collection. Aqueous samples that flow freely are collected in refrigerated bottles using automatic sampling equipment. Solid samples are collected as grab samples using wide-mouth jars. Tissue samples may be collected in jars or wrapped in aluminum foil.
8.2 Storage Temperature
8.2.1 Aqueous samples—Maintain at 0-4 EC from the time of collection until extraction.
8.2.2 Solid samples—Maintain at 0-4 EC from time of collection until extraction, or freeze at <-10 EC.
September 2000 1111

Method 1657, Revision A
8.2.3 Tissue samples—Freeze at <-10 EC upon collection unless the sample will be extracted within 12 hours, in which case maintain at 0-4 EC from the time of collection until extraction.
8.3 Aqueous sample preservation
8.3.1 If the sample will not be extracted within 72 hours of collection, adjust the sample to a pH of 5.0 to 9.0 using sodium hydroxide or sulfuric acid solution. Record the volume of acid or base used.
8.3.2 If residual chlorine is present in an aqueous sample, add 80 mg sodium thiosulfate per liter of water. EPA Methods 330.4 and 330.5 may be used to measure residual chlorine (Reference 8).
8.4 Holding times
8.4.1 Aqueous and unfrozen solid samples—Begin sample extraction within 7 days of collection
8.4.2 Frozen solid and tissue samples—If stored in the dark at <-10EC, solid, semi-solid, multi-phase, and tissue samples may be stored for up to one year prior to extraction.
8.4.3 Analyze all extracts within 40 days of extraction.
9.0 Quality Control
9.1 Each laboratory that uses this Method is required to operate a formal quality control (QC) program (Reference 6). The minimum requirements of this program consist of an initial demonstration of laboratory capability, ongoing analyses of standards and blanks as tests of continued performance, and analysis of matrix spike samples to assess recovery and precision. Laboratory performance is compared to established performance criteria to determine if the results of analyses meet the performance characteristics of this Method. For the performance tests, a reference matrix is used that most closely simulates the matrix of interest. For aqueous, solid, and tissue samples, reference matrices of reagent water (Section 7.7.1), playground sand (Section 7.7.2), or corn oil (Section 7.7.3), respectively, are suggested.
9.1.1 The laboratory shall make an initial demonstration of the ability to generate acceptable precision and recovery with this Method. This ability is established as described in Section 9.2.
9.1.2 The laboratory is permitted to modify this Method to improve separations or lower the costs of measurements, provided all performance requirements are met. These options include use of alternate extraction techniques such as solid-phase extraction and accelerated solvent extraction, alternate concentration techniques such as rotary evaporation, and alternate cleanup techniques such as high-performance liquid chromatography. Changes in the principle of the determinative technique, such as the use of colorimetry, are not allowed.
9.1.2.1 Each time a modification is made to this Method, the laboratory is required to repeat the procedure in Section 9.2 to demonstrate performance. If a detection limit will be affected by the modification, the laboratory is required to demonstrate that the MDL (40 CFR Part 136, Appendix B) is less than or equal to the MDL in this Method for the analyte(s) of interest. If this Method will be used for compliance monitoring, the MDL for the modified
September 2000 1212
Method 1657, Revision A
method must be less than or equal to the MDL of this Method or one-third the regulatory compliance limit, whichever is greater. If the change will affect calibration, the instrument must be recalibrated according to Section 10.
9.1.2.2 The laboratory is required to maintain records of modifications made to this Method. These records include the following, at a minimum:
9.1.2.2.1 The names, titles, addresses, and telephone numbers of the analyst(s) who performed the analyses and modification, and the quality control officer who witnessed and will verify the analyses and modification
9.1.2.2.2 A narrative stating the reason(s) for the modification(s)
9.1.2.2.3 Results from all quality control (QC) tests comparing the modified method to this Method, including the following:
(a) Calibration (Section 10) (b) Initial precision and recovery (Section 9.2) (c) Analysis of blanks (Section 9.5) (d) Matrix spike analysis (Section 9.4) (e) Ongoing precision and recovery (Section 15.5) (f) Surrogate recovery (Section 9.3) (g) Method detection limit (Section 9.1.2.1)
9.1.2.2.4 Data that will allow an independent reviewer to validate each determination by tracking the instrument output to the final result. These data are to include the following:
(a) Sample numbers and other identifiers (b) Processing dates (c) Analysis dates (d) Analysis sequence/run chronology (e) Sample weight or volume (f) Copies of logbooks, chart recorder, or other raw data output (g) Calculations linking raw data to the results reported
9.1.3 The laboratory shall spike all samples with at least one surrogate compound to monitor method performance. This test is described in Section 9.3. When results of these spikes indicate atypical method performance for samples, the samples are diluted to bring method performance within acceptable limits (Section 18).
9.1.4 Analyses of matrix spike (MS) samples are required to demonstrate the recovery and to monitor matrix interferences. Section 9.4 describes the procedure and QC criteria for spiking.
9.1.5 The laboratory shall, on an ongoing basis, demonstrate through calibration verification and the analysis of the combined QC standard (Section 7.13) that the analysis system is in control. These procedures are described in Sections 15.1, 15.4, and 15.5.
September 2000 1313

Method 1657, Revision A
9.1.6 The laboratory should maintain records to define the quality of data that is generated. Development of accuracy statements is described in Section 9.4.4 and 15.5.4.
9.1.7 Analyses of blanks are required to demonstrate freedom from contamination. The procedures and criteria for analysis of a blank are described in Section 9.5.
9.1.8 Other analytes may be determined by this Method. The procedure for establishing a QC acceptance criteria for a new analyte is given in Section 9.6.
9.1.9 QC using this Method is controlled by an analytical batch. An analytical batch is a set of samples started through the extraction process during a given 12-hour shift, to a maximum of 20. A batch may be from 1 to as many as 20 samples. Each batch must be accompanied by a blank, an OPR, and MS.
9.2 Initial demonstration of laboratory capability
9.2.1 Method detection limit—To establish the ability to detect the analytes of interest in this Method, the laboratory shall achieve MDLs that are less than or equal to the MDLs listed in Table 2 or one-third the regulatory compliance limit, whichever is greater. The MDLs shall be determined according to the procedure at 40 CFR 136, Appendix B using the apparatus, reagents, and standards that will be used in the practice of this Method. These MDLs shall be used for determination of laboratory capability only, and should be determined when a new operator begins work or whenever, in the judgment of the laboratory, a change in instrument hardware or operating conditions would dictate reevaluation of capability.
9.2.2 Initial precision and recovery—To establish the ability to generate acceptable precision and recovery, the laboratory shall perform the following operations.
9.2.2.1 For aqueous samples, extract, concentrate, and analyze one set of four 1-L aliquots of reagent water spiked with the combined QC standard (Section 7.13) according to the procedure in Section 11. Alternatively, sets of four replicates of the individual calibration groups (Table 3) may be used. For samples containing high solids, a set of four 30-g aliquots of the high-solids reference matrix (Section 7.7.2) are used. For tissue samples, a set of four 10-g aliquots of the tissue reference matrix (Section 7.7.3) are used.
9.2.2.2 Using results of the set of four analyses, compute the average percent recovery (X) and the relative standard deviation (RSD) of percent recovery for each analyte.
9.2.2.3 For each analyte, compare X and the RSD and with the corresponding limits for initial precision and recovery in Table 4. For coeluting analytes, use the coeluted compound with the least restrictive specification (largest RSD and widest range). If X and RSD for all analytes meet the acceptance criteria, system performance is acceptable and analysis of blanks and samples may begin. If, however, any individual RSD exceeds the precision limit or any individual X falls outside the range for recovery, system performance is unacceptable for that analyte. In this case, correct the problem and repeat the test.
September 2000 1414
Method 1657, Revision A
9.3 Surrogates - The laboratory shall spike all samples with surrogates (Section 7.11) to assess method performance on the sample matrix.
9.3.1 Analyze each sample according to this Method beginning in Section 11.
9.3.2 Compute the percent recovery (P) of the surrogates.
9.3.3 The recovery of the surrogates shall be in the range of 40 - 120%. If the recovery of a surrogate falls outside of these limits, method performance is unacceptable for that sample. Water samples are diluted, and smaller amounts of soils, sludges, sediments, and tissues are reanalyzed per Section 18.
9.4 Matrix spike—The laboratory shall spike (matrix spike) at least 5% of the samples from a given matrix type (e.g., influent to treatment, treated effluent, produced water, river sediment, soil, tissue). If only one sample from a given matrix type is analyzed, a separate aliquot of that sample shall be spiked.
9.4.1 The concentration of the matrix spike shall be determined as follows:
9.4.1.1 If, as in compliance monitoring, the concentration of a specific analyte in the sample is being checked against a regulatory concentration limit, the MS shall be at that limit or at 1 to 5 times higher than the background concentration determined in Section 9.4.2, whichever concentration is greater.
9.4.1.2 If the concentration of an analyte in the sample is not being checked against a limit specific to the analyte, the MS shall be at the concentration of the combined QC standard (Section 7.13) or at 1 to 5 times higher than the background concentration, whichever concentration is greater.
9.4.1.3 If it is impractical to determine the background concentration before spiking (e.g., maximum holding times will be exceeded), the matrix spike concentration shall be the regulatory concentration limit, if any; otherwise, the greater of either 5 times the expected background concentration or at the concentration of the combined QC standard (Section 7.13).
9.4.2 Analyze one sample aliquot to determine the background concentration (B) of each analyte. If necessary, prepare a standard solution appropriate to produce a level in the sample 1 to 5 times the background concentration. Spike a second sample aliquot with the standard solution and analyze it to determine the concentration after spiking (A) of each analyte. Calculate the percent recovery (P) of each analyte:
Equation 1
P = (100(A-B)/T) where T = True value of the spike
September 2000 1515

Method 1657, Revision A
9.4.3 The matrix spike recovery in sample should be 25 - 150%. For the OPR, compare the percent recovery for each analyte with the corresponding QC acceptance criteria in Table 4.
9.4.3.1 If the results of both the MS and the OPR fall outside the acceptance criteria, the analytical system is judged to be not in control. The laboratory must identify and correct the problem and reanalyze all samples in the sample batch.
9.4.3.2 If results for the MS fail the acceptance criteria, and recovery for the OPR standard (Section 15.5) for the analytical batch is within the acceptance criteria in Table 4, an interference is present and the results may not be reported or otherwise used for permitting or regulatory compliance purposes. If the interference can be attributed to sampling, the site or discharge should be resampled. If the interference can be attributed to a method deficiency, the laboratory must modify this Method, repeat the test required in Section 9.1.2, and repeat analysis of the sample and MS.
9.4.3.3 If the interference cannot be overcome after this Method has been modified, the sample is complex and must be diluted and reanalyzed per Section 18.
9.4.4 As part of the QC program for the laboratory, it is suggested but not required that method precision and recovery be assessed and records be maintained. After the analysis of five spiked samples of a given matrix type (water, soil, sludge, sediment, tissue) in which the analytes pass the tests in Section 9.4.3, compute the average percent recovery (P) and the standard deviation of the percent recovery for each analyte (or coeluting analyte group). Express the accuracy assessment as a percent recovery interval from P - 2sp to P + 2sp for each matrix. For example, if P=90% and sp=10% for five analyses of compost, the accuracy interval is expressed as 70 to 110%. Update the accuracy assessment for each analyte in each matrix on a regular basis (e.g., after each 5 to 10 new accuracy measurements).
9.5 Blanks—Reference matrix blanks are analyzed to demonstrate freedom from contamination.
9.5.1 Extract and concentrate a 1-L reagent water blank, a 30-g high-solids reference matrix blank, or a 10-g tissue matrix blank (whichever is appropriate) with each sample batch (Section 9.1.9). Analyze the blank immediately after analysis of the combined QC standard (Section 7.13) to demonstrate freedom from contamination.
9.5.2 If any of the analytes of interest (Table 1) or any potentially interfering substance is found in a blank at a concentration greater than the concentration of the low concentration calibration solution in Table 3 (assuming the same calibration factor as for triphenyl phosphate for analytes not listed in Table 1), analysis of samples is halted until the source of contamination is eliminated and a blank shows no evidence of contamination at this level.
9.6 Application of this Method to other analytes.
9.6.1 To establish QC acceptance criteria for an analyte, determine the precision and recovery by analyzing four replicates of the analyte along with the combined QC standard per the procedure in Section 9.2. If the analyte coelutes with an analyte in the QC standard, prepare a new QC standard without the coeluting component(s).
September 2000 1616
Method 1657, Revision A
9.6.2 Compute the average percent recovery (A) and the RSD of percent recovery (RSDn) for the new analyte, and measure the recovery and RSD for the other analytes. The data for the new analyte are valid if the precision and recovery specifications for the other analytes are met; otherwise, the analytical problem is corrected and the test is repeated. Establish a preliminary QC limit of 2RSDn for precision and of A ± 2RSDn for recovery for the new analyte and add to the acceptance criteria in Table 4.
9.7 The specifications contained in this Method can be met if the apparatus used is calibrated properly, then maintained in a calibrated state. The standards used for calibration (Sections 7.8 - 7.13), calibration verification (Section 15.4), and for initial (Section 9.2) and ongoing (Section 15.5) precision and recovery should be identical, so that the most precise results will be obtained. The GC instruments will provide the most reproducible results if dedicated to the settings and conditions required for the analyses of the analytes given in this Method.
9.8 Depending on specific program requirements, field replicates and field spikes of the analytes of interest into samples may be required to assess the accuracy of the sampling and sample transporting techniques.
10.0 Setup and Calibration
10.1 Configure the GC system as given in Section 6.8 and establish the operating conditions in Table 2.
10.2 Attainment of MDL—Determine that each column/detector system meets the MDLs in Table 2.
10.3 Calibration.
10.3.1 Injection of calibration solutions.
10.3.1.1 Analytes with calibration data in Table 3—The analytes in each calibration group in Table 3 were chosen so that each analyte would be separated from the others by approximately 1 minute on the primary column. The concentrations were chosen to bracket the working range of the FPD. However, because the response of some models of FPD are greater than others, it may be necessary to inject a larger volume of calibration solution for these detectors.
10.3.1.2 Analytes without calibration data in Table 3—Prepare calibration standards at a minimum of three concentration levels. One of these concentrations should be near, but above, the MDL (Table 2) and the other concentrations should define the working range of the detectors.
10.3.1.3 Set the automatic injector to inject a constant volume in the range of 0.5 to 5.0 µL of each calibration solution into the GC column/detector pairs, beginning with the lowest level mixture and proceeding to the highest. For each analyte, compute and store, as a function of the concentration injected, the retention time and peak area on each column/detector system (primary and confirmatory).
September 2000 1717
Method 1657, Revision A
10.3.2 Retention time—The polar nature of some analytes causes the retention time to decrease as the quantity injected increases. To compensate this effect, the retention time for analyte identification is correlated with the analyte level.
10.3.2.1 If the difference between the maximum and minimum retention times for any analyte is less than 5 seconds over the calibration range, the retention time for that analyte can be considered constant and an average retention time may be used for analyte identification.
10.3.2.2 Retention-time calibration curve (retention time vs. amount)—If the retention time for an analyte in the lowest level standard is more than 5 seconds greater than the retention time for the analyte in the highest level standard, a retention-time calibration curve shall be used for identification of that analyte.
10.3.3 Calibration factor (ratio of area to amount injected).
10.3.3.1 Compute the RSD of the calibration factor over the calibration range for each analyte on each column/detector system.
10.3.3.2 Linearity—If the calibration factor for any analyte is constant (RSD <20%) over the calibration range, an average calibration factor may be used for that analyte; otherwise, the complete calibration curve (area vs. amount) for that analyte shall be used.
10.4 Combined QC standards—To preclude periodic analysis of all of the individual calibration groups of analytes (Table 3), calibration of the GC systems are verified with combined solutions as a final step. Not all of the analytes in these standards will be separated by the GC columns used in this Method. Retention times and calibration factors are verified for the analytes that are resolved, and calibration factors are obtained for the unresolved peaks. These combined QC standards are prepared at the level the mid-range calibration standard (Table 3).
10.4.1 Analyze the combined QC standard on each column/detector pair.
10.4.1.1 For those analytes that exhibit a single, resolved GC peak, the retention time shall be within ±5 seconds of the retention time of the peak in the medium level calibration standard (Table 3), and the calibration factor using the primary column shall be within ±20% of the calibration factor in the medium level standard (Table 3). If the retention times are outside of these windows, readjust the analytical conditions until this test is met, or recalibrate and repeat this test.
10.4.1.2 For coeluted compounds, compute and store the retention times at the peak maxima on both columns (primary and confirmatory), and also compute and store the calibration factors on both columns. These results will be used for calibration verification (Section 15.2 and 15.4) and for precision and recovery studies (Sections 9.2 and 15.5).
11.0 Sample Preparation
11.1 Determination of percent solids (for non-tissue samples expected or known to contain >1% solids).
September 2000 1818

Method 1657, Revision A
11.1.1 Weigh 5 to 10 g of sample into a tarred beaker. Record the weight to three significant figures.
11.1.2 Dry overnight (12 hours minimum) at 110EC (±5 EC), and cool in a desiccator.
11.1.3 Determine percent solids as follows:
Equation 2
weight of dry sample% solids ' x 100 weight of wet sample
11.2 Preparation of samples for extraction.
11.2.1 Samples containing 0-30% solids.
11.2.1.1 Aqueous samples containing 1% solids or less—Extract the sample directly using continuous liquid-liquid extraction techniques.
11.2.1.1.1 Measure 1 L (±0.01 L) of sample into a clean 1.5- to 2-L beaker.
11.2.1.1.2 Spike 1.0 mL of the surrogate spiking solution (Section 7.11) into the sample aliquot. Proceed to preparation of the QC aliquots for low-solids samples (Section 11.2.1.3).
11.2.1.2 Samples containing 1 to 30% solids.
11.2.1.2.1 Mix sample thoroughly.
11.2.1.2.2 Using the percent solids found in Section 11.1.3, determine the weight of sample required to produce 1-L of solution containing 1% solids as follows:
Equation 3
1000 gsample weight ' % solids
11.2.1.2.3 Place the weight determined in Section 11.2.1.2.2 in a clean 1.5- to 2.0-L beaker. Discard all sticks, rocks, leaves, and other foreign material prior to weighing.
11.2.1.2.4 Bring the volume of the sample aliquot(s) to 100- to 200-mL with reagent water.
11.2.1.2.5 Spike 1.0 mL of the appropriate surrogate spiking solution (Section 7.11) into each sample aliquot.
September 2000 1919
Method 1657, Revision A
11.2.1.2.6 Using a clean metal spatula, break any solid portions of the sample into small pieces.
11.2.1.2.7 Place the ¾” horn on the ultrasonic probe approximately ½” below the surface of each sample aliquot and pulse at 50% for 3 minutes at full power. If necessary, remove the probe from the solution and break any large pieces using the metal spatula or a stirring rod and repeat the sonication. Clean the probe with methylene chloride:acetone (1:1) between samples to preclude cross-contamination.
11.2.1.2.8 Bring the sample volume to 1.0 L (±0.1 L) with reagent water.
11.2.1.3 Preparation of QC aliquots for samples containing low solids (<30%).
11.2.1.3.1 For each sample or sample batch (to a maximum of 20) to be extracted at the same time, place two 1.0-L (±0.1 L) aliquots of reagent water in clean 1.5- to 2.0-L beakers.
11.2.1.3.2 Blank—Spike 1.0 mL of the pesticide surrogate spiking solution (Section 7.11) into one reagent water aliquot.
11.2.1.3.3 OPR—Spike 1.0 mL of the pesticide surrogate spiking solution (Section 7.11) and the combined QC standard (Section 7.13) into the second reagent water aliquot.
11.2.1.3.4 Matrix Spike—Prepare an aliquot at the concentrations specified in Section 9.4.
11.2.1.3.5 Stir and equilibrate all sample and QC solutions for 1 to 2 hours. Extract the samples and QC aliquots per Section 12.1.
11.2.2 Samples containing 30% solids or greater.
11.2.2.1 Mix the sample thoroughly.
11.2.2.2 Weigh 30 g (±0.3 g) into a clean 400- to 500-mL beaker. Discard all sticks, rocks, leaves, and other foreign material prior to weighing.
11.2.2.3 Spike 1.0 mL of the surrogate spiking solution (Section 7.11) into the sample aliquot.
11.2.2.4 QC aliquots—For each sample or sample batch (to a maximum of 20) to be extracted at the same time, place two 30-g (±0.3 g) aliquots of the high-solids reference matrix in clean 400- to 500-mL beakers.
11.2.2.4.1 Blank—Spike 1.0 mL of the surrogate spiking solution (Section 7.11) into one aliquot of the high-solids reference matrix.
11.2.2.4.2 OPR—Spike 1.0 mL of the surrogate spiking solution (Section 7.11) and the combined QC standard (Section 7.13) into the second high-solids reference matrix aliquot.
11.2.2.4.3 Matrix spike—Prepare an aliquot at the concentration specified in Section 9.4
September 2000 2020
Method 1657, Revision A
11.2.2.5 Extract the high-solids samples per Section 12.0.
11.2.3 Tissue samples
11.2.3.1 Prior to processing tissue samples, the laboratory must determine the exact tissue to be analyzed. Common requests for analysis of fish tissue include whole fish-skin on, whole fish-skin removed, edible fish fillets (filleted in the field or by the laboratory), specific organs, and other portions. Once the appropriate tissue has been determined, the sample must be homogenized.
11.2.3.2 Homogenization
11.2.3.2.1 Samples are homogenized while still frozen, where practical. If the laboratory must dissect the whole fish to obtain the appropriate tissue for analysis, the unused tissues may be rapidly refrozen and stored in a clean glass jar for subsequent use.
11.2.3.2.2 Each analysis requires 10 g of tissue (wet weight). Therefore, homogenize at least 30 g of tissue to allow for the MS and for re-extraction of a second aliquot of the same homogenized sample, if re-analysis is required. When whole fish analysis is required, the entire fish is homogenized.
11.2.3.2.3 Homogenize the sample in a tissue homogenizer (Section 6.3.3.1) or grind in a meat grinder (Section 6.3.3.2). Cut tissue too large to feed into the grinder into smaller pieces. To assure homogeneity, grind three times.
11.2.3.2.4 Transfer approximately 10 g (wet weight) of homogenized tissue to a clean, tared, 400to 500-mL beaker. Record the weight to 3 significant figures.
11.2.3.2.5 Spike 1.0 mL of the surrogate spiking solution (Section 7.11) into the sample.
11.2.3.2.6 Transfer the remaining homogenized tissue to a clean jar with a fluoropolymer-lined lid. Seal the jar and store the tissue at <-10 EC. Return any tissue that was not homogenized to its original container and store at <-10 EC.
11.2.3.3 Preparation of QC aliquots.
11.2.3.3.1 For each sample or sample batch (Section 9.1.9), weigh two 10-g (± 1 g) aliquots of the tissue reference matrix (Section 7.7.3) into clean 400- to 500-mL beakers. One aliquot will serve as the blank and the other as the OPR.
11.2.3.3.2 Spike 1.0 mL of the surrogate spiking solution (Section 7.11) into each aliquot.
11.2.3.3.3 OPR—Spike the combined QC standard (Section 7.13) into one of the aliquots.
11.2.3.3.4 MS—Prepare an aliquot at the concentrations specified in Section 9.4.
September 2000 2121
Method 1657, Revision A
11.2.4 Samples containing methamidophos and other highly water-soluble analytes—Prepare samples containing less than 30% solids per Section 11.2.1; prepare samples containing greater than 30% solids per Section 11.2.2; and prepare tissue samples per Section 11.2.3.
11.2.4.1 Interferences—If interferences are expected, aqueous samples can be pre-extracted with methylene chloride to remove these interferences. This extract can be used for determination of insoluble or slightly soluble analytes and the surrogates. Methamidophos is only sightly soluble in methylene chloride and will not be in this extract unless carried by polar species in the sample matrix. If analytes other than methamidophos are not to be determined, the methylene chloride extract can be discarded.
11.2.4.2 Determine the percent solids and prepare a 1-L sample aliquot and the QC aliquots per Sections 11.2.1.3 and 11.2.2.4 and 11.2.3.3, except do not spike the surrogate into the sample aliquot if the methylene chloride extract will be discarded (Section 11.2.4.1).
11.2.4.3 Extract the aliquots per Section 12.0 using methylene chloride to remove interferences.
11.2.4.4 After extraction, remove the water and methylene chloride from the extractor. Decant the aqueous portion into a beaker and combine the remaining methylene chloride with the extract in the distilling flask. If the methylene chloride extract is to be used for determination of other analytes and the surrogate, proceed to Section 12.4 with that extract.
11.2.4.5 Saturate the water sample with sodium chloride. Approximately 350 g will be required.
NOTE: As a result of the increased density of the water caused by saturation with salt, the sample may sink to where the water enters the siphon tube of the continuous extractor. To prevent this from occurring, use a smaller volume of water (e.g., 800 mL) in the extractor. Correct for this adjustment in the calculation of the concentration of the analytes in the extract (Section 15).
11.2.4.6 If the methylene chloride extract was discarded, spike the surrogates into the sample aliquot.
11.2.4.7 Extract the sample per Section 12.0 except use a chloroform:acetone azeotrope (2:1 v/v or 4:1 w/w) for the extraction.
12.0 Extraction and Concentration
12.1 Continuous extraction of low-solids (aqueous) samples—Place 100 to 150 mL solvent (methylene chloride or 2:1 v/v chloroform:acetone, as appropriate) in each continuous extractor and 200 to 300 mL in each distilling flask.
12.1.1 Pour the sample(s), blank, and standard aliquots into the extractors. Rinse the glass containers with 50 to 100 mL methylene chloride and add to the respective extractors. Include all solids in the extraction process.
September 2000 2222
Method 1657, Revision A
12.1.2 Adjust the pH of the waters in the extractors to 5- 9 with NaOH or H2SO4 while monitoring with a pH meter.
NOTE: Warning—Some samples require acidification in a hood because of the potential for generating hydrogen sulfide.
12.1.3 Begin the extraction by heating the flask until the solvent is boiling. When properly adjusted, one to two drops of solvent per second will fall from the condenser tip into the water. Test and adjust the pH of the waters after the first 1 to 2 hours of extraction. Extract for 18 to 24 hours.
12.1.4 Remove the distilling flask, estimate and record the volume of extract (to the nearest 100 mL), and pour the contents through a prerinsed drying column containing 7 to 10 cm of granular anhydrous sodium sulfate. Rinse the distilling flask with 30 to 50 mL of methylene chloride and pour through the drying column. For extracts to be cleaned up using GPC, collect the solution in a 500-mL K-D evaporator flask equipped with a 10-mL concentrator tube. Seal, label, and concentrate per Sections 12.4 to 12.5.
12.2 Ultrasonic extraction of high-solids samples—Procedures are provided for extraction of non-sewage sludge (Section 12.2.1) and sewage sludge samples (Section 12.2.2).
12.2.1 Ultrasonic extraction of non-sewage sludge high-solids aliquots.
12.2.1.1 Add 60 to 70 g of powdered anhydrous sodium sulfate to the sample and QC aliquots. Mix each aliquot thoroughly. Some wet sludge samples may require more than 70 g for complete removal of water. All water must be removed prior to addition of organic solvent so that the extraction process is efficient.
12.2.1.2 Add 100 mL (±10 mL) of acetone:methylene chloride (1:1) to each of the aliquots and mix thoroughly.
12.2.1.3 Place the ¾” horn on the ultrasonic probe approximately ½” below the surface of the solvent but above the solids layer and pulse at 50% for 3 minutes at full power. If necessary, remove the probe from the solution and break any large pieces using a metal spatula or a stirring rod and repeat the sonication.
12.2.1.4 Decant the extract through a prerinsed drying column containing 7 to 10 cm of granular anhydrous sodium sulfate into 500- to 1000-mL graduated cylinder.
12.2.1.5 Repeat the extraction steps (Sections 12.2.1.2 to 12.2.1.4) twice more for each sample and QC aliquot. On the final extraction, swirl the sample or QC aliquot, pour into its respective drying column, and rinse with acetone:methylene chloride. Record the total extract volume. If necessary, transfer the extract to a centrifuge tube and centrifuge for 10 minutes to settle fine particles. Concentrate the extract per Section 12.4 to 12.5.
12.2.2 Ultrasonic extraction of high solids sewage sludge aliquots.
12.2.2.1 Add 100 mL (±10 mL) of acetonitrile to each of the aliquots and mix thoroughly.
September 2000 2323
Method 1657, Revision A
12.2.2.2 Place the ¾” horn on the ultrasonic probe approximately ½” below the surface of the solvent but above the solids layer and pulse at 50% for 3 minutes at full power. If necessary, remove the probe from the solution and break any large pieces using a metal spatula or a stirring rod and repeat the sonication.
12.2.2.3 Decant the extract through filter paper into a 1000- to 2000-mL separatory funnel.
12.2.2.4 Repeat the extraction and filtration steps (Sections 12.2.2.2 to 12.2.2.3) using a second 100 mL (±10 mL) of acetonitrile.
12.2.2.5 Repeat the extraction step (Sections 12.2.2.2 and 12.2.2.2) using 100 mL (±10 mL) of methylene chloride. On this final extraction, swirl the sample or QC aliquot, pour into its respective filter paper, and rinse with methylene chloride. Record the total extract volume.
12.2.2.6 For each extract, prepare 1.5 to 2 L of reagent water containing 2% sodium sulfate. Adjust the pH of the water to 6.0 to 9.0 with NaOH or H2SO4 (Section 7.3.2).
12.2.2.7 Back-extract each extract three times sequentially with 500 mL of the aqueous sodium sulfate solution, returning the bottom (organic) layer to the separatory funnel the first two times while discarding the top (aqueous) layer. On the final back-extraction, filter each pesticide extract through a prerinsed drying column containing 7 to 10 cm of granular anhydrous sodium sulfate into a 500- to 1000-mL graduated cylinder. Record the final extract volume.
12.2.3 For extracts to be cleaned up using GPC, filter these extracts through Whatman #41 paper into a 500-mL K-D evaporator flask equipped with a 10-mL concentrator tube. Rinse the graduated cylinder or centrifuge tube with 30 to 50 mL of methylene chloride and pour through filter to complete the transfer. Seal and label the K-D flask. Concentrate these fractions per Section 12.4 and 12.5.
12.3 Tissue extraction and determination of lipid content.
12.3.1 Pre-extraction of the Soxhlet apparatus.
12.3.1.1 Charge a clean extraction thimble (Section 6.4.9.2) with 5.0 g of silica (Section 7.6.2).
12.3.1.2 Place the thimble in a clean extractor. Place 30 to 40 mL of methylene chloride:hexane (1:1) mixture in the receiver and 200 to 250 mL of methylene chloride:hexane (1:1) mixture in the flask.
12.3.1.3 Pre-extract by heating the flask until the methylene chloride:hexane (1:1) mixture is boiling. When properly adjusted, one to two drops of methylene chloride:hexane (1:1) mixture will fall per second from the condenser tip into the receiver. Extract the apparatus for a minimum of three hours.
12.3.1.4 After pre-extraction, cool and disassemble the apparatus. Rinse the thimble with methylene chloride:hexane (1:1) mixture and allow to air dry.
September 2000 2424
Method 1657, Revision A
12.3.2 Sample extraction.
12.3.2.1 Add 30 to 40 g of powdered anhydrous sodium sulfate (Section 7.3.2) to each sample and QC aliquot (Sections 11.2.3.2 and 11.2.3.3) and mix thoroughly. Cover the beakers with aluminum foil and allow to equilibrate for 12-24 hours. Remix prior to extraction to prevent clumping. If necessary, add more sodium sulfate and re-mix. The sample must be dehydrated completely for efficient extraction. Complete dehydration is indicated by a free-flowing sample/sodium sulfate mixture.
12.3.2.2 Reassemble the pre-extracted Soxhlet apparatus and add a fresh charge of methylene chloride:hexane to the reflux flask.
12.3.2.3 Transfer the sample/sodium sulfate mixture (Section 12.3.2.1) to the Soxhlet thimble, and install the thimble in the Soxhlet apparatus.
12.3.2.4 Rinse the beaker with several portions of solvent mixture and add to the thimble. Fill the thimble/receiver with solvent. Extract for 18 to 24 hours.
12.3.2.5 After extraction, cool and disassemble the apparatus. Filter each extract through Whatman #41 paper into a 500-mL K-D evaporator flask equipped with a 10-mL concentrator tube. Rinse the extraction apparatus with 30 to 50 mL of methylene chloride and add to the K-D flask.
12.3.3 Percent lipid determination—The lipid content is determined by extraction of tissue with the same solvent system (methylene chloride:hexane) that was used in EPA's National Dioxin Study so that lipid contents are consistent with that study.
12.3.3.1 Concentrate the tissue extract to near dryness using the macro concentration procedure in Section 12.4.
12.3.3.2 Complete the removal of the solvent—Transfer the vial containing the sample extract to the nitrogen blowdown device (Section 6.4.8.3). Adjust the flow of nitrogen so that the surface of the solvent is just visibly disturbed. Lower the vial into a water bath temperature of approximately 60 EC. Weigh the receiver, record the weight, and return the receiver to the blowdown apparatus, concentrating the residue until a constant weight is obtained. Record the weight of the receiver, boiling chips, and residue.
12.3.3.3 Redissolve the residue in methylene chloride and quantitatively transfer to a vial for GPC cleanup (Section 13.2), retaining the boiling chips in the receiver.
12.3.3.4 Allow the receiver and chips to dry and weigh the receiver (including the boiling chips).
12.3.3.5 Calculate the lipid content to the nearest three significant figures as follows:
September 2000 2525
Method 1657, Revision A
Equation 4
% lipid ' weight of residue (g)
weight of tissue (g) x 100
12.3.3.6 It is not necessary to determine the lipid content of the blank, IPR, or OPR aliquots.
12.4 Macro concentration.
12.4.1 Concentrate the extracts in separate 500-mL K-D flasks equipped with 10-mL concentrator tubes. Add one to two clean boiling chips to the flask and attach a three-ball macro Snyder column. Prewet the column by adding approximately 1 mL of methylene chloride through the top. Place the K-D apparatus in a hot water bath so that the entire lower rounded surface of the flask is bathed with steam. Adjust the vertical position of the apparatus and the water temperature as required to complete the concentration in 15 to 20 minutes. At the proper rate of distillation, the balls of the column will actively chatter but the chambers will not flood.
12.4.2 When the liquid has reached an apparent volume of 1 mL, remove the K-D apparatus from the bath and allow the solvent to drain and cool for at least 10 minutes.
12.4.3 If the extract is to be cleaned up using GPC, remove the Snyder column and rinse the flask and its lower joint into the concentrator tube with 1 to 2 mL of methylene chloride. A 5-mL syringe is recommended for this operation. Adjust the final volume to 10 mL and proceed to GPC cleanup in Section 13. If the extract is to be cleaned up by SPE or injected into the GC, proceed per Section 12.5.
12.5 Solvent exchange—Extracts to be cleaned up by SPE are exchanged into the SPE elution solvent (Section 7.6.1.2); extracts to be injected into the GC are exchanged in to toluene:acetone (1:10).
12.5.1 Remove the Snyder column, add approximately 10 mL of the appropriate solvent and a clean boiling chip, and reattach the Snyder column. Concentrate the extract per Section 12 except use the appropriate solvent to pre-wet the column. The elapsed time for concentration to approximately 2 mL should be 5 to 10 minutes.
12.5.2 Remove the Snyder column and rinse the flask and its lower joint into the concentrator tube with the respective solvent. Proceed to micro concentration and solvent exchange (Section 12.6).
12.6 Micro-concentration and solvent exchange—Extracts to be cleaned up using SPE are exchanged into 1.0 mL of SPE elution solvent (Section 7.6.1.2). Extracts that have been cleaned up and are ready for GC analysis are exchanged into toluene:acetone.
September 2000 2626

Method 1657, Revision A
12.6.1 Transfer the vial containing the sample extract to the nitrogen blowdown device (Section 6.4.8.3). Adjust the flow of nitrogen so that the surface of the solvent is just visibly disturbed. A large vortex in the solvent may cause analyte loss.
12.6.2 Lower the vial into a 45 EC water bath and continue concentrating.
12.6.2.1 If the extract is to be concentrated to dryness for weight determination (Section 12.3.3.2), blow dry at 60 EC until a constant weight is obtained.
12.6.2.2 If the extract is to be concentrated for injection into the GC or the solvent is to be exchanged for extract cleanup, proceed as follows:
12.6.3 When the volume of the liquid is approximately 0.5 mL, add 2 to 3 mL of the desired solvent and continue concentrating to approximately 0.5 mL. Repeat the addition of solvent and concentrate once more.
12.6.4 Adjust the volume of an extract to be cleaned up to 1.0 mL. Proceed to extract cleanup (Section 13.3).
12.6.5 For an extract that was cleaned up and is ready for GC analysis, adjust the volume as follows:
12.6.5.1 Aqueous samples containing <1% solids—Adjust the final extract volume to be consistent with the volume extracted.
12.6.5.1.1 For extracts that have been cleaned up using GPC, adjust the final extract volume to 1/200 of the volume extracted. For example, if the volume extracted is 950 mL, adjust the final extract volume to 4.8 mL.
12.6.5.1.2 For extracts that have not been cleaned up using GPC, adjust the final extract volume to 1/100 of the volume extracted. For example, if the volume extracted is 1000 mL, adjust the final extract volume to 10 mL.
NOTE: The difference in volume fractions (1/200 or 1/100) accounts for the 50% loss in the GPC cleanup. Also, by preserving the ratio between the volume extracted and the final extract volume, the concentrations, detection limits, and minimum levels of quantitation do not need to be adjusted for differences in the volume extracted.
12.6.5.2 For aqueous samples containing >1% solids, soil, sludge, and tissue samples, adjust the final extract volume to 5.0 mL if the extract was cleaned up by GPC; otherwise, adjust the volume to 10 mL (the difference accounts for the 50% loss in the GPC cleanup).
12.6.6 Transfer the concentrated extract to a vial with fluoropolymer-lined cap. Seal the vial and label with the sample number. Store in the dark at room temperature until ready for GC analysis. If GC analysis will not be performed on the same day, store the vial in the dark at <-10 EC. Analyze the extract by GC per the procedure in Section 14.
September 2000 2727
Method 1657, Revision A
13.0 Extract Cleanup
13.1 Except for tissues, soils, and sediments cleanup procedures may not be necessary. If particular circumstances require the use of a cleanup procedure, the analyst may use any or all of the procedures below or any other appropriate procedure. However, the analyst shall first repeat the tests in Section 9.2 to demonstrate that the requirements of Section 9.2 can be met using the cleanup procedure(s) as an integral part of this Method. Figure 1 outlines the cleanup steps.
13.1.1 Gel permeation chromatography (Section 13.2) removes many high molecular weight interferences that cause GC column performance to degrade. It is used for all soil, sediment, and tissue extracts and may be used for water extracts that are expected to contain high molecular weight organic analytes (e.g., polymeric materials, humic acids).
13.1.2 The solid-phase extraction cartridge (Section 13.3) removes polar organic analytes such as phenols.
13.2 Gel permeation chromatography (GPC).
13.2.1 Column packing.
13.2.1.1 Place 70 to 75 g of SX-3 Bio-beads in a 400- to 500-mL beaker.
13.2.1.2 Cover the beads with methylene chloride and allow to swell overnight (12 hours minimum).
13.2.1.3 Transfer the swelled beads to the column and pump solvent through the column, from bottom to top, at 4.5 to 5.5 mL/min prior to connecting the column to the detector.
13.2.1.4 After purging the column with solvent for 1 to 2 hours, adjust the column head pressure to 7 to 10 psig, and purge for 4 to 5 hours to remove air. Maintain a head pressure of 7 to 10 psig. Connect the column to the detector.
13.2.2 Column calibration.
13.2.2.1 Load 5 mL of the calibration solution (Section 7.5) into the sample loop.
13.2.2.2 Inject the calibration solution and record the signal from the detector. The elution pattern will be corn oil, bis(2-ethylhexyl) phthalate, pentachlorophenol, perylene, and sulfur.
13.2.2.3 Set the "dump time" to allow >85% removal of the corn oil and >85% collection of the phthalate.
13.2.2.4 Set the "collect time" to the peak minimum between perylene and sulfur.
13.2.2.5 Verify the calibration with the calibration solution after every 20 extracts. Calibration is verified if the recovery of the pentachlorophenol is greater than 85%. If calibration is not verified, the system shall be recalibrated using the calibration solution, and the previous
September 2000 2828

Method 1657, Revision A
batch of samples (those affected by the calibration) shall be re-extracted and cleaned up using a calibrated GPC system.
13.2.3 Extract cleanup—GPC requires that the column not be overloaded. The column specified in this Method is designed to handle a maximum of 0.5 g of high molecular weight material in a 5-mL extract. If the extract is known or expected to contain more than 0.5 g, the extract is split into fractions for GPC and the fractions are combined after elution from the column. The solids content of the extract may be obtained gravimetrically by evaporating the solvent from a 50-µL aliquot.
13.2.3.1 Filter the extract or load through the filter holder to remove particulate. Load the 5.0 mL extract onto the column.
13.2.3.2 Elute the extract using the calibration data determined in Section 13.2.2. Collect the eluate in a clean 400- to 500-mL beaker.
13.2.3.3 Rinse the sample loading tube thoroughly with methylene chloride between extracts to prepare for the next sample.
13.2.3.4 If a particularly dirty extract is encountered, a 5.0-mL methylene chloride blank shall be run through the system to check for carry-over.
13.2.3.5 Concentrate the extract and exchange into hexane per Sections 12.4 and 12.5. Adjust the final volume to 5.0 mL.
13.3 Solid-phase extraction (SPE).
13.3.1 Setup.
13.3.1.1 Attach the Vac-elute manifold to a water aspirator or vacuum pump with the trap and gauge installed between the manifold and vacuum source.
13.3.1.2 Place the SPE cartridges in the manifold, turn on the vacuum source, and adjust the vacuum to 5 to 10 psig.
13.3.2 Cartridge washing—Pre-elute each cartridge prior to use sequentially with 10-mL portion each of hexane, methanol, and water using vacuum for 30 seconds after each eluant. Follow this pre-elution with 1 mL methylene chloride and three 10-mL portions of the elution solvent (Section 7.6.1.2) using vacuum for 5 minutes after each eluant. Tap the cartridge lightly while under vacuum to dry between eluants. The three portions of elution solvent may be collected and used as a blank if desired. Finally, elute the cartridge with 10 mL each of methanol and water, using the vacuum for 30 seconds after each eluant.
13.3.3 Cartridge certification—Each cartridge lot must be certified to ensure recovery of the analytes of interest and removal of 2,4,6-trichlorophenol.
September 2000 2929

Method 1657, Revision A
13.3.3.1 To make the test mixture, add the trichlorophenol solution (Section 7.6.1.1) to the combined calibration standard (Section 7.5). Elute the mixture using the procedure in Section 13.3.4.
13.3.3.2 Concentrate the eluant to 1.0 mL and inject 1.0 µL of the concentrated eluant into the GC using the procedure in Section 13. The recovery of all analytes (including the unresolved GC peaks) shall be within the ranges for recovery specified in Table 4, and the peak for trichlorophenol shall not be detectable; otherwise the SPE cartridge is not performing properly and the cartridge lot shall be rejected.
13.3.4 Extract cleanup.
13.3.4.1 After cartridge washing (Section 13.3.2), release the vacuum and place the rack containing the 50 mL volumetric flasks (Section 6.7.3) in the vacuum manifold. Reestablish the vacuum at 5 to 10 psig.
13.3.4.2 Using a pipette or a 1-mL syringe, transfer 1.0 mL of extract (Section 12.5.4) to the SPE cartridge. Apply vacuum for five minutes to dry the cartridge. Tap gently to aid in drying.
13.3.4.3 Elute each cartridge into its volumetric flask sequentially with three 10-mL portions of the elution solvent (Section 7.6.1.2), using vacuum for 5 minutes after each portion. Collect the eluants in the 50-mL volumetric flasks.
13.3.4.4 Release the vacuum and remove the 50-mL volumetric flasks.
13.3.4.5 Concentrate the eluted extracts per Sections 12.4 and 12.5.
14.0 Gas Chromatography
Table 2 summarizes the recommended operating conditions for the gas chromatography. Included in this table are the retention times and estimated detection limits that can be achieved under these conditions. Examples of the separations achieved by the primary and confirmatory columns are shown in Figure 2.
14.1 Calibrate the system as described in Section 10.
14.2 Set the auto sampler to inject the same volume that was chosen for calibration (Section 10.3) for all standards and extracts of blanks and samples.
14.3 Set the data system or GC control to start the temperature program upon sample injection, and begin data collection after the solvent peak elutes. Set the data system to stop data collection after the last analyte is expected to elute and to return the column to the initial temperature.
15.0 System and Laboratory Performance
15.1 At the beginning of each 12-hour shift during which analyses are performed, GC system performance and calibration are verified for all pollutants and surrogates on both column/detector systems. For these
September 2000 3030
Method 1657, Revision A
tests, analysis of the combined QC standard (Section 10.4) shall be used to verify all performance criteria. Adjustment and/or recalibration (per Section 10) shall be performed until all performance criteria are met. Only after all performance criteria are met may samples, blanks, and precision and recovery standards be analyzed.
15.2 Retention times—The absolute retention times of the peak maxima shall be within ±10 seconds of the retention times in the initial calibration (Section 10.4.1).
15.3 GC resolution—Resolution is acceptable if the valley height between two peaks (as measured from the baseline) is less than 10% of the taller of the two peaks.
15.3.1 Primary column (DB-1)—Malathion and ethyl parathion.
15.3.2 Confirmatory column (DB-1701)—Terbufos and diazinon.
15.4 Calibration verification—Calibration is verified for the combined QC standard only.
15.4.1 Inject the combined QC standard (Section 7.13).
15.4.2 Compute the percent recovery of each analyte or coeluting analytes, based on the calibration data (Section 10.4).
15.4.3 For each analyte or coeluted analytes, compare this calibration verification recovery with the corresponding limits for ongoing recovery in Table 4. For coeluting analytes, use the coeluted analyte with the least restrictive specification (the widest range). If the recoveries for all analytes meet the acceptance criteria, system performance is acceptable and analysis of blanks and samples may begin. If, however, any recovery falls outside the calibration verification range, system performance is unacceptable for that analyte. In this case, correct the problem and repeat the test, or recalibrate (Section 10).
15.5 Ongoing precision and recovery.
15.5.1 Analyze the extract of the OPR extracted with each sample batch (Sections 11.2.1.3.3, 11.2.2.4.3, 11.2.3.3.3).
15.5.2 Compute the percent recovery of each analyte and coeluting analytes.
15.5.3 For each analyte or coeluted analytes, compare the percent recovery with the limits for ongoing recovery in Table 4. For coeluted analytes, use the coeluted analyte with the least restrictive specification (widest range). If all analytes pass, the extraction, concentration, and cleanup processes are in control and analysis of blanks and samples may proceed. If, however, any of the analytes fail, these processes are not in control. In this event, correct the problem, re-extract the sample batch, and repeat the ongoing precision and recovery test.
15.5.4 If desired, add results that pass the specifications in Section 15.5.3 to initial and previous ongoing data. Update QC charts to form a graphic representation of continued laboratory performance. Develop a statement of laboratory data quality for each analyte by calculating
September 2000 3131
Method 1657, Revision A
the average percent recovery (R) and the standard deviation of percent recovery sr. Express the accuracy as a recovery interval from R ! 2sr to R + 2sr. For example, if R = 95% and sr = 5%, the accuracy is 85 to 105%.
16.0 Qualitative Determination
16.1 Qualitative determination is accomplished by comparison of data from analysis of a sample or blank with data from analysis of the shift standard (Section 15.1), and with data stored in the retention-time and calibration libraries (Section 10.4.3). Identification is confirmed when retention time and amounts agree per the criteria below.
16.2 For each analyte on each column/detector system, establish a retention-time window ±20 seconds on either side of the retention time in the calibration data (Section 10.4). For analytes that have a retention-time curve (Section 10.3.2.2), establish this window as the minimum -20 seconds and maximum +20 seconds.
16.2.1 Analytes not requiring a retention-time calibration curve—If a peak from the analysis of a sample or blank is within a window (as defined in Section 16.2) on the primary column/detector system, it is considered tentatively identified. A tentatively identified analyte is confirmed when (1) the retention time for the analyte on the confirmatory column/detector system is within the retention-time window on that system, and (2) the computed amounts (Section 17) on each system (primary and confirmatory) agree within a factor of 2.
16.2.2 Analytes requiring a retention-time calibration curve—If a peak from the analysis of a sample or blank is within a window (as defined in Section 16.2) on the primary column/detector system, it is considered tentatively identified. A tentatively identified analyte is confirmed when (1) the retention times on both systems (primary and confirmatory) are within ±30 seconds of the retention times for the computed amounts (Section 17), as determined by the retention-time calibration curve (Section 10.3.3.2), and (2) the computed amounts (Section 17) on each system (primary and confirmatory) agree within a factor of 2.
16.2.3 When the concentration of an analyte is sufficient, it should be further identified by gas chromatography/mass spectrometry (GC/MS).
16.2.4 Additional information that may aid the laboratory in the identification of an analyte—The occurrence of peaks eluting near the retention time of an analyte of interest increases the probability of a false positive for the analyte. If the concentration is insufficient for confirmation by GC/MS, the laboratory must use all of the cleanup procedures in this Method (Section 18.2) to attempt to remove the interferences. After all attempts at cleanup are exhausted, the following steps may be helpful to assure that the substance that appears in the RT windows on both columns is the analyte of interest.
16.2.4.1 Determine the consistency of the RT data for the analyte on each column. For example, if the RT is very stable (i.e., varies by no more than a few seconds) for the VER, BLK, OPR, and MS, the RT for the analyte of interest in the sample should be within this variation regardless of the window established in Section 16.2. If the analyte is not within this variation on both columns, it is likely not present.
September 2000 3232
Method 1657, Revision A
16.2.4.2 The possibility exists that the RT for the analyte in a sample could shift if extraneous materials are present. This possibility can be confirmed or refuted by the behavior of the surrogates in the sample. If the RTs for the surrogates on both columns are consistent with their RTs in the VER, BLK, OPR and MS data, the RT for the analyte of interest cannot shift.
16.2.4.3 If the RT for the analyte is shifted slightly later on one column and earlier on the other, and the surrogates have not shifted, it is highly unlikely that the pesticide is present because shifts nearly always occur in the same direction on both columns.
17.0 Quantitative Determination
17.1 Using the GC data system, compute the concentration of the analyte detected in the extract (in Fg/mL) using the calibration factor or calibration curve (Section 10.3.2.2).
17.2 Liquid samples
17.2.1 Compute the concentration in the sample using the following equation: Equation 5
C ' s 10 (C ex)
(V s)
where Cs = Concentration in the sample, in µg/L Vex = Final extract total volume, in mL Cex= Concentration in the extract, in µg/mL Vs = Sample extracted, in L
17.2.2. Samples containing <1% solids - If the final extract volume was adjusted to be consistent with the sample volume extracted (Section 12.6.5.1), adjust the concentrations of the surrogate and matrix spike compounds for the sample volume (Section 12.6.5.1). For example, if the sample volume was 950mL, adjust the concentration of the surrogates and matrix spike compounds by multiplying the concentration by 1000/950.
17.3 Solid samples—Compute the concentration in the solid phase of the sample using the following equation:
September 2000 3333
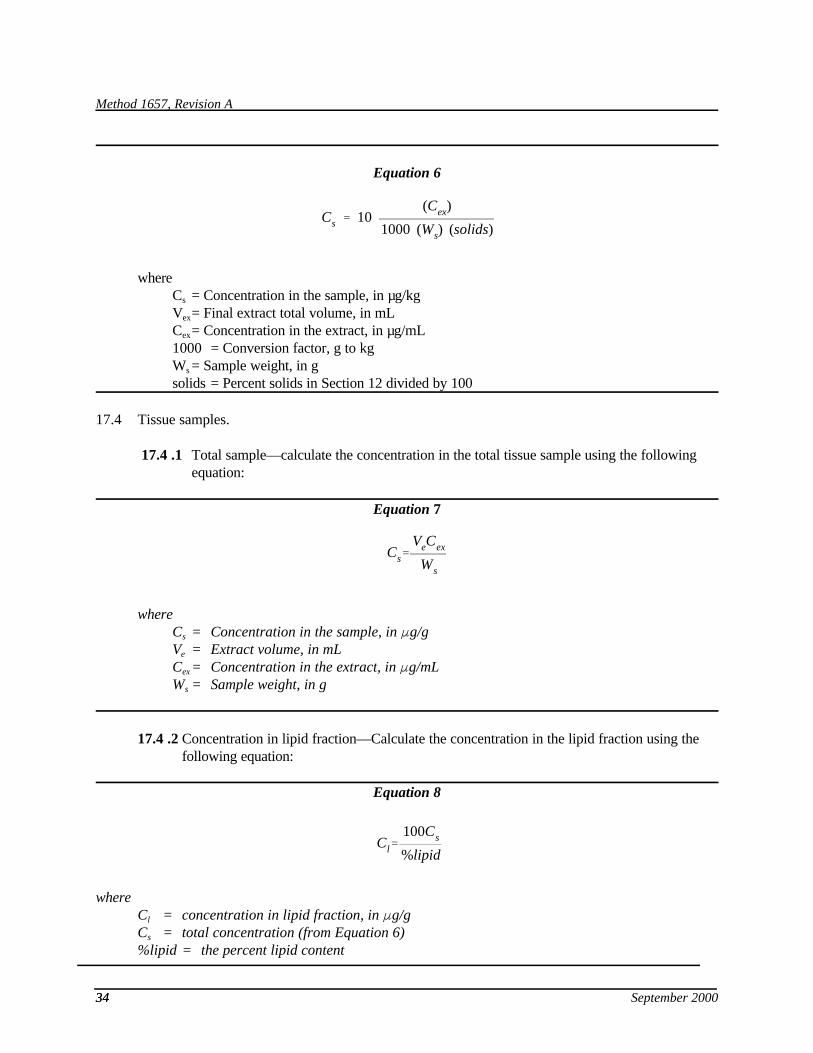
Method 1657, Revision A
Equation 6
(C ex)
1000 (W s) (solids)C ' s 10
where Cs = Concentration in the sample, in µg/kg Vex= Final extract total volume, in mL Cex= Concentration in the extract, in µg/mL 1000 = Conversion factor, g to kg Ws = Sample weight, in g solids = Percent solids in Section 12 divided by 100
17.4 Tissue samples.
17.4 .1 Total sample—calculate the concentration in the total tissue sample using the following equation:
Equation 7
V C e exC ' s W s
where Cs = Concentration in the sample, in Fg/g Ve = Extract volume, in mL Cex= Concentration in the extract, in Fg/mL Ws = Sample weight, in g
17.4 .2 Concentration in lipid fraction—Calculate the concentration in the lipid fraction using the following equation:
Equation 8
100C sCl ' %lipid
where Cl = concentration in lipid fraction, in Fg/g Cs = total concentration (from Equation 6) %lipid = the percent lipid content
September 2000 3434
Method 1657, Revision A
17.5 If the concentration of any analyte exceeds the calibration range of the system, the extract is diluted by a factor of 10, and an aliquot of the diluted extract is analyzed.
17.6 Report results for all pollutants found in all standards, blanks, and samples to three significant figures. Results for samples that have been diluted are reported at the least dilute level at which the concentration is in the calibration range.
17.7 The laboratory must report the lower value from the two columns. The laboratory must analyze the sample by GC/MS or on a third column when analytes have co-eluted or interfere with determination on one of the two columns used in the analysis.
17.8 Quantitative information that may aid in the confirmation of the presence of an analyte
17.8.1 Sections 16.2.1 and 16.2.2 state that if the amounts on both column/detector systems agree within a factor of 2, the pesticide is present. This factor of 2 is generous and allows for the pesticide that has the largest measurement error. A better indication of the actual measurement error can be gained from the IPR and VER data. Using these data, establish a measurement window ±3 standard deviations (or ±3 RSD) around the mean on one column. If the concentration for the pesticide determined on the other column/detector system agrees within this window, and the RT data agree (from Section 16), the pesticide is definitely confirmed.
17.8.2 If the amounts do not agree, and the RT data indicate the presence of the analyte (per Section 16), it is likely that an interference is present on the column that yielded the highest result. Look for a separate peak for this interferent on the other column. It should be near the peak for the analyte of interest, and the area of the peak, when added to the area of the peak for the analyte of interest, should provide an estimate of what the concentration would be if the peaks coincided. This concentration should roughly agree with the concentration determined for the analyte on the column on which the suspected interference occurred. In this event, the pesticide is confirmed and lowest concentration should be reported.
18.0 Analysis of Complex Samples
18.1 Some samples may contain high levels (>1000 ng/L) of the analytes of interest, interfering analytes, and/or polymeric materials. Some samples may not concentrate to 10 mL (Section 12.5); others may overload the GC column and/or detector.
18.2 The analyst shall attempt to clean up all complex samples using GPC (Section 13.2), and the SPE cartridge (Section 13.3). If these techniques do not remove the interfering analytes, the extract is diluted by a factor of 10 and reanalyzed (Section 17.4).
18.3 Recovery of surrogates—In most samples, surrogate recoveries will be similar to those from reagent water or from the high solids reference matrix. If the surrogate recovery is outside the range
September 2000 3535
Method 1657, Revision A
specified in Section 9.3.3, the sample shall be re-extracted and reanalyzed. If the surrogate recovery is still outside this range, the sample is diluted by a factor of 10 and reanalyzed (Section 17.4).
18.4 Recovery of matrix spikes—In most samples, matrix spike recoveries will be similar to those from reagent water or from the high solids reference matrix. If the matrix spike recovery is outside the range specified in Table 4, the sample shall be diluted by a factor of 10, respiked, and reanalyzed. If the matrix spike recovery is still outside the range, this Method may not apply to the sample being analyzed and the result may not be reported or used for permitting or regulatory compliance purposes. However, a failure to meet the performance criteria in this Method does not relieve a discharger from timely reporting.
19.0 Method Performance
19.1 Development of this Method is detailed in References 9 and 10.
20.0 Pollution Prevention
20.1 Pollution prevention encompasses any technique that reduces or eliminates the quantity or toxicity of waste at the point of generation. Many opportunities for pollution prevention exist in laboratory operations. EPA has established a preferred hierarchy of environmental management techniques that places pollution prevention as the management option of first choice. Whenever feasible, laboratory personnel should use pollution prevention techniques to address waste generation. When wastes cannot be reduced feasiblely at the source, the Agency recommends recycling as the next best option. The solvents used in this Method should be reused as practicable by purifying by distillation. The only other chemicals used in this Method are the neat materials used in preparing standards. These standards are used in extremely small amounts and pose little threat to the environment when managed properly. Standards should be prepared in volumes consistent with laboratory use to minimize the disposal of excess volumes of expired standards.
20.2 For information about pollution prevention that may be applied to laboratories and research institutions, consult Less is Better: Laboratory Chemical Management for Waste Reduction, available from the American Chemical Society's Department of Governmental Relations and Science Policy, 1155 16th Street NW, Washington DC 20036, 202/872–4477.
21.0 Waste Management
21.1 The laboratory is responsible for complying with all Federal, State, and local regulations governing waste management, particularly hazardous waste identification rules and land disposal restrictions, and for protecting the air, water, and land by minimizing and controlling all releases from fume hoods and bench operations. Compliance with all sewage discharge permits and regulations is also required. An overview of requirements can be found in Environmental Management Guide for Small Laboratories (EPA 233-B-98-001).
21.2 Acids, bases, and samples at pH <2 must be neutralized before being disposed of, or must be handled as hazardous waste.
September 2000 3636

Method 1657, Revision A
21.3 For further information on waste management, consult The Waste Management Manual for Laboratory Personnel and Less is Better: Laboratory Chemical Management for Waste Reduction, both available from the American Chemical Society's Department of Government Relations and Science Policy, 1155 16th Street NW, Washington, DC 20036.
22.0 References
1. "Guideline Establishing Test Procedures for the Analysis of Pollutants under the Clean Water Act; Final Rule and Interim Final Rule and Proposed Rule," 40 CFR Part 136.
2. "Methods for the Determination of Organic Analytes in Drinking Water," U.S. Environmental Protection Agency, Environmental Monitoring Systems Laboratory, Cincinnati, Ohio: EPA-600/488/039, December 1988.
3. "Carcinogens—Working with Carcinogens." Department of Health, Education, and Welfare; Public Health Service; Center for Disease Control; National Institute for Occupational Health and Safety: Publication 77-206, August 1977.
4. "OSHA Safety and Health Standards, General Industry" (29 CFR 1910). Occupational Safety and Health Administration: January 1976.
5. "Safety in Academic Chemistry Laboratories," American Chemical Society Committee on Chemical Safety: 1979.
6. "Handbook of Quality Control in Wastewater Laboratories," U.S. Environmental Protection Agency, Environmental Monitoring and Support Laboratory, Cincinnati, OH: EPA-600/4-79-019, March 1979.
7. "Standard Practice for Sampling Water" (ASTM Annual Book of Standards), American Society for Testing and Materials, Philadelphia, Pennsylvania: 76, 1980.
8. "Methods 330.4 and 330.5 for Total Residual Chlorine," U.S. Environmental Protection Agency, Environmental Monitoring and Support Laboratory, Cincinnati, OH: EPA-600/4-70-020, March 1979.
9. "Consolidated GC Method for the Determination of ITD/RCRA Pesticides using Selective GC Detectors," S-CUBED, A Division of Maxwell Laboratories, Inc., La Jolla, CA: Ref. 32145-01, Document R70, September 1986.
10. "Method Development and Validation, EPA Method 1618," Pesticide Center, Department of Environmental Health, Colorado State University: November 1988, January 1989, and March 1992.
September 2000 3737
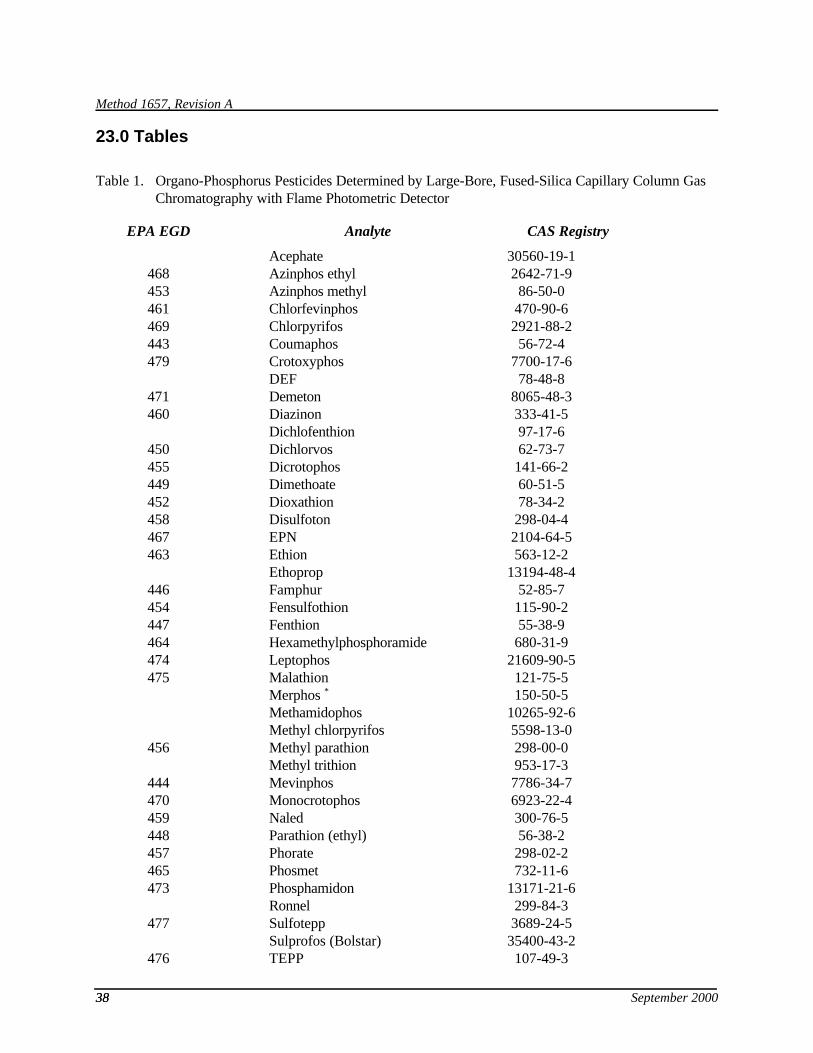
Method 1657, Revision A
23.0 Tables
Table 1. Organo-Phosphorus Pesticides Determined by Large-Bore, Fused-Silica Capillary Column Gas Chromatography with Flame Photometric Detector
EPA EGD Analyte CAS Registry
Acephate 30560-19-1 468 Azinphos ethyl 2642-71-9 453 Azinphos methyl 86-50-0 461 Chlorfevinphos 470-90-6 469 Chlorpyrifos 2921-88-2 443 Coumaphos 56-72-4 479 Crotoxyphos 7700-17-6
DEF 78-48-8 471 Demeton 8065-48-3 460 Diazinon 333-41-5
Dichlofenthion 97-17-6 450 Dichlorvos 62-73-7 455 Dicrotophos 141-66-2 449 Dimethoate 60-51-5 452 Dioxathion 78-34-2 458 Disulfoton 298-04-4 467 EPN 2104-64-5 463 Ethion 563-12-2
Ethoprop 13194-48-4 446 Famphur 52-85-7 454 Fensulfothion 115-90-2 447 Fenthion 55-38-9 464 Hexamethylphosphoramide 680-31-9 474 Leptophos 21609-90-5 475 Malathion 121-75-5
Merphos * 150-50-5 Methamidophos 10265-92-6 Methyl chlorpyrifos 5598-13-0
456 Methyl parathion 298-00-0 Methyl trithion 953-17-3
444 Mevinphos 7786-34-7 470 Monocrotophos 6923-22-4 459 Naled 300-76-5 448 Parathion (ethyl) 56-38-2 457 Phorate 298-02-2 465 Phosmet 732-11-6 473 Phosphamidon 13171-21-6
Ronnel 299-84-3 477 Sulfotepp 3689-24-5
Sulprofos (Bolstar) 35400-43-2 476 TEPP 107-49-3
September 2000 3838
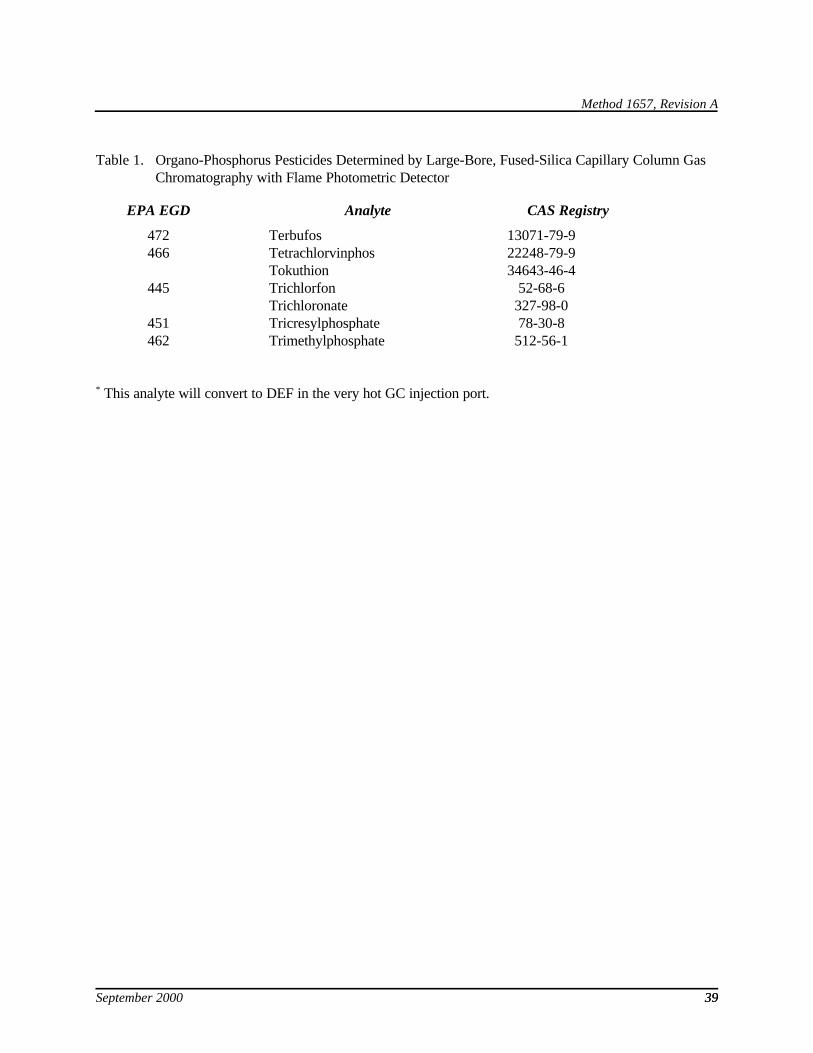
Method 1657, Revision A
Table 1. Organo-Phosphorus Pesticides Determined by Large-Bore, Fused-Silica Capillary Column Gas Chromatography with Flame Photometric Detector
EPA EGD Analyte CAS Registry
472 Terbufos 13071-79-9 466 Tetrachlorvinphos 22248-79-9
Tokuthion 34643-46-4 445 Trichlorfon 52-68-6
Trichloronate 327-98-0 451 Tricresylphosphate 78-30-8 462 Trimethylphosphate 512-56-1
* This analyte will convert to DEF in the very hot GC injection port.
September 2000 3939

Method 1657, Revision A
Table 2. Gas Chromatography of Organo-Phosphorus Pesticides
Retention Time 1 (min) EPA EGD
Analyte MDL 2, 3
(ng/L) DB-1 DB-1 701
450 Dichlorvos 6.56 9.22 4 444 Mevinphos 11.85 16.20 74
Acephate 12.60 17.40 500 445 Trichlorofon 12.69 18.85 1503
Methamidophos 15.10 19.20 100 471 Demeton-A 17.70 20.57 19
Ethoprop 18.49 21.43 7 459 Naled 18.92 23.00 18 455 Dicrotophos 19.33 26.30 81 470 Monocrotophos 19.62 29.24 85 477 Sulfotepp 20.04 23.68 6 457 Phorate 20.12 23.08 10 449 Dimethoate 20.59 29.29 27
Demeton-B 21.40 25.52 21 452 Dioxathion 22.24 26.70 121 472 Terbufos 22.97 24.55 26 473 Phosphamidon-E 23.70 29.89 28 458 Disulfoton 23.89 27.01 32 460 Diazinon 24.03 26.10 38
Tributyl phosphate (surr) 24.50 17.20 -Phosphamidon-Z 25.88 32.62 116
456 Methyl parathion 25.98 32.12 18 Dichlorofenthion 26.11 28.66 6 Methyl chlorpyrifos 26.29 29.53 13 Ronnel 27.33 30.09 11
475 Malathion 28.87 33.49 11 447 Fenthion 29.14 32.16 22 448 Parathion 29.29 34.61 10 469 Chlorpyrifos 29.48 32.15 4
Trichloronate 30.44 32.12 14 461 Chlorfevinphos 32.05 36.08 2 479 Crotoxyphos 32.65 37.58 81
Tokuthion 33.30 37.17 2 466 Tetrachlorvinphos 33.40 37.85 12
DEF 34.05 37.50 50 Merphos-B 35.16 37.37 18
454 Fensulfothion 36.58 43.86 104 Methyl trithion 36.62 40.52 10
4040 September 2000

Method 1657, Revision A
Table 2. Gas Chromatography of Organo-Phosphorus Pesticides
Retention Time 1 (min) EPA EGD
Analyte MDL 2, 3
(ng/L) DB-1 DB-1 701
463 Ethion 37.61 41.67 13 Sulprofos 38.10 41.74 6
446 Famphur 38.24 46.37 27 465 Phosmet 41.24 48.22 14 467 EPN 41.94 47.52 9 453 Azinphos methyl 43.33 50.26 9 474 Leptophos 44.32 47.36 14 468 Azinphos ethyl 45.55 51.88 22
Triphenyl phosphate (surr) 47.68 40.43 -443 Coumaphos 48.02 56.44 24
Notes: 1. Columns: 30 m long × 0.53 mm ID; DB-1: 1.5 µ; DB-1701: 1.0 µ. Conditions suggested to meet
retention times shown: 110EC for 0.5 min, 110 to 250E at 3EC/min, 250EC until coumaphos elutes. Carrier gas flow rate approximately 7 mL/min.
2. 40 CFR Part 136, Appendix B. 3. Estimated. Detection limits for soils (in ng/kg) are estimated to be 30 to 100 times this level.
September 2000 4141
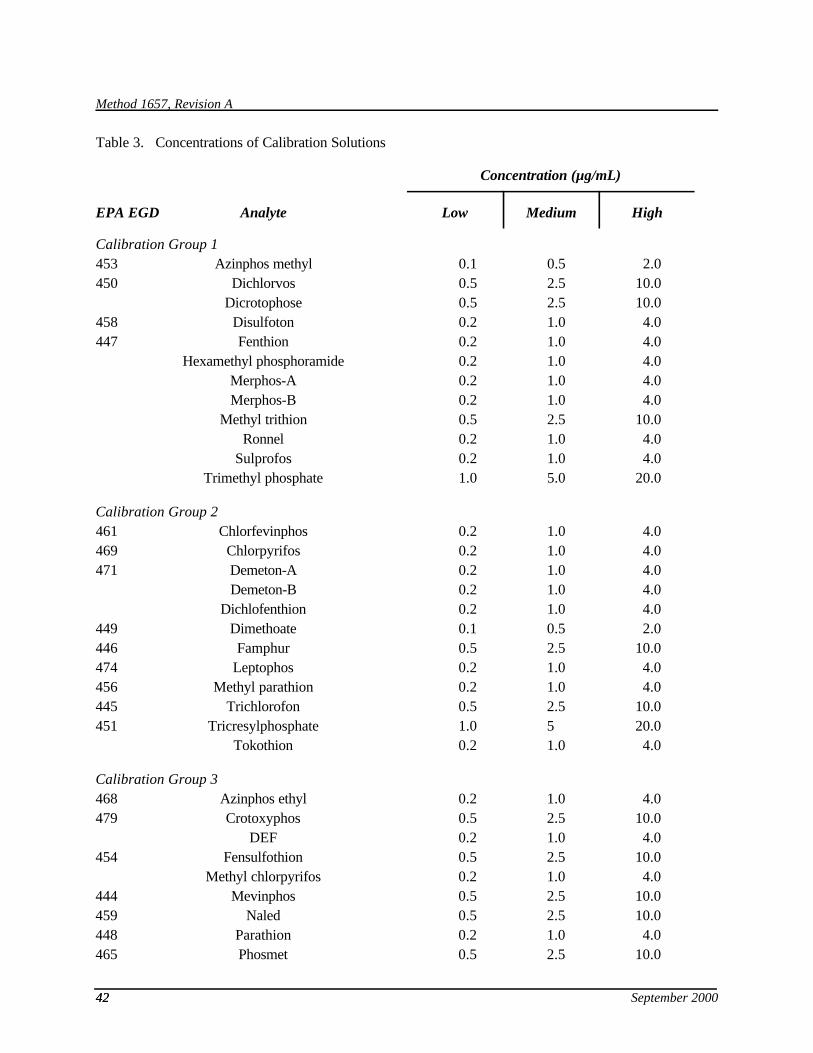
Method 1657, Revision A
Table 3. Concentrations of Calibration Solutions
EPA EGD Analyte
Calibration Group 1
Low
Concentration (µg/mL)
Medium High
453 Azinphos methyl 0.1 0.5 2.0 450 Dichlorvos 0.5 2.5 10.0
Dicrotophose 0.5 2.5 10.0 458 Disulfoton 0.2 1.0 4.0 447 Fenthion 0.2 1.0 4.0
Hexamethyl phosphoramide 0.2 1.0 4.0 Merphos-A 0.2 1.0 4.0 Merphos-B 0.2 1.0 4.0
Methyl trithion 0.5 2.5 10.0 Ronnel 0.2 1.0 4.0
Sulprofos 0.2 1.0 4.0 Trimethyl phosphate
Calibration Group 2
1.0 5.0 20.0
461 Chlorfevinphos 0.2 1.0 4.0 469 Chlorpyrifos 0.2 1.0 4.0 471 Demeton-A 0.2 1.0 4.0
Demeton-B 0.2 1.0 4.0 Dichlofenthion 0.2 1.0 4.0
449 Dimethoate 0.1 0.5 2.0 446 Famphur 0.5 2.5 10.0 474 Leptophos 0.2 1.0 4.0 456 Methyl parathion 0.2 1.0 4.0 445 Trichlorofon 0.5 2.5 10.0 451 Tricresylphosphate 1.0 5 20.0
Tokothion
Calibration Group 3
0.2 1.0 4.0
468 Azinphos ethyl 0.2 1.0 4.0 479 Crotoxyphos 0.5 2.5 10.0
DEF 0.2 1.0 4.0 454 Fensulfothion 0.5 2.5 10.0
Methyl chlorpyrifos 0.2 1.0 4.0 444 Mevinphos 0.5 2.5 10.0 459 Naled 0.5 2.5 10.0 448 Parathion 0.2 1.0 4.0 465 Phosmet 0.5 2.5 10.0
September 2000 4242
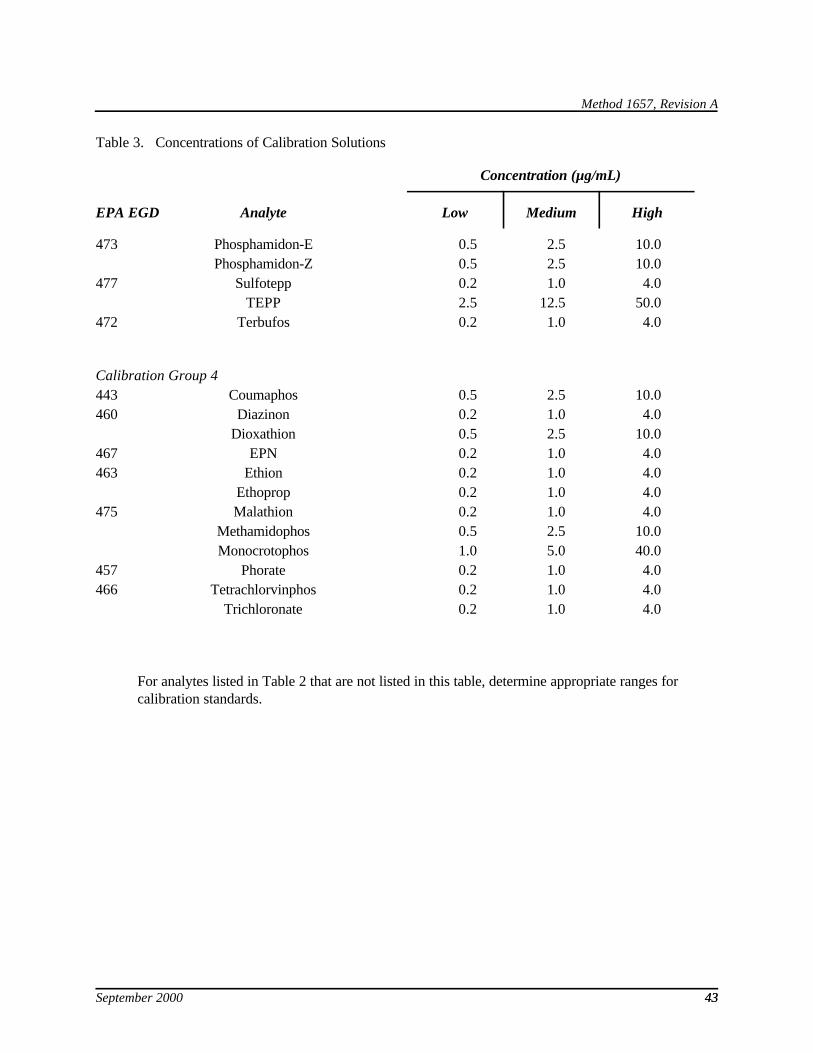
Method 1657, Revision A
Table 3. Concentrations of Calibration Solutions
EPA EGD Analyte
Concentration (µg/mL)
Low Medium High
473 Phosphamidon-E 0.5 2.5 10.0 Phosphamidon-Z 0.5 2.5 10.0
477 Sulfotepp 0.2 1.0 4.0 TEPP 2.5 12.5 50.0
472 Terbufos 0.2 1.0 4.0
Calibration Group 4 443 Coumaphos 0.5 2.5 10.0 460 Diazinon 0.2 1.0 4.0
Dioxathion 0.5 2.5 10.0 467 EPN 0.2 1.0 4.0 463 Ethion 0.2 1.0 4.0
Ethoprop 0.2 1.0 4.0 475 Malathion 0.2 1.0 4.0
Methamidophos 0.5 2.5 10.0 Monocrotophos 1.0 5.0 40.0
457 Phorate 0.2 1.0 4.0 466 Tetrachlorvinphos 0.2 1.0 4.0
Trichloronate 0.2 1.0 4.0
For analytes listed in Table 2 that are not listed in this table, determine appropriate ranges for calibration standards.
September 2000 4343
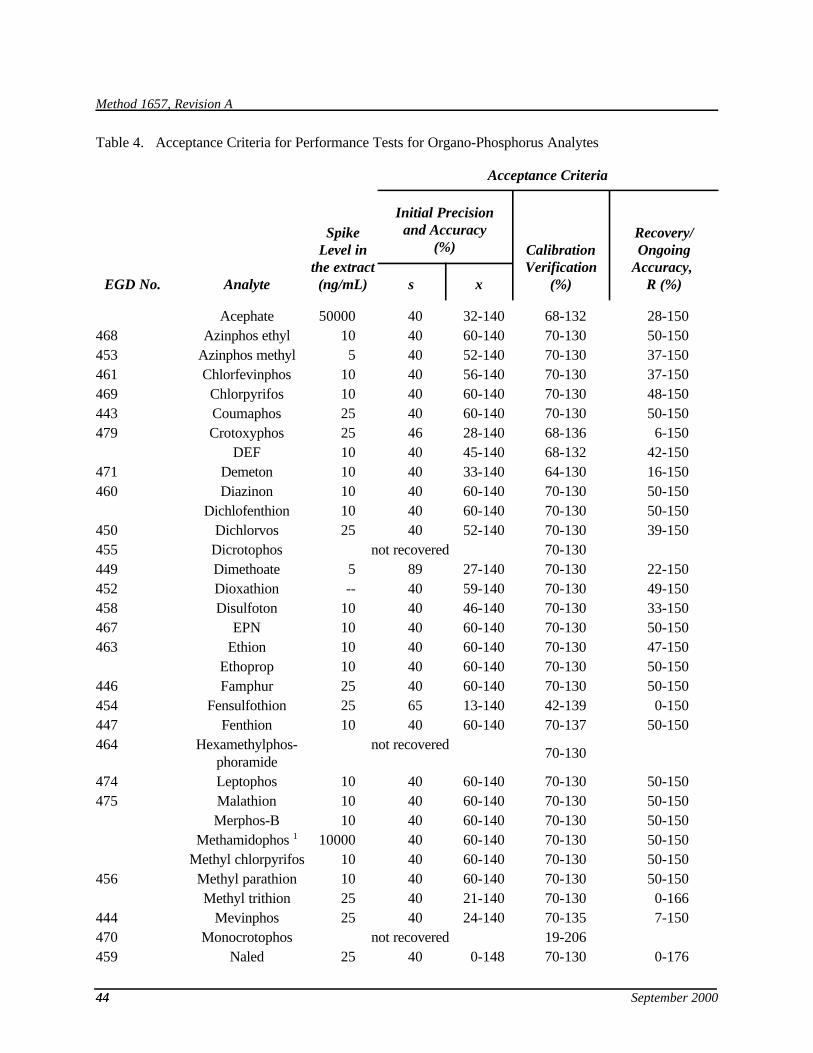
Method 1657, Revision A
Table 4. Acceptance Criteria for Performance Tests for Organo-Phosphorus Analytes
Acceptance Criteria
Initial Precision and Accuracy
(%) Spike
Level in the extract
(ng/mL)
Recovery/ Ongoing
Accuracy, R (%)
Calibration Verification
(%) EGD No. Analyte s x
Acephate 50000 40 32-140 68-132 28-150 468 Azinphos ethyl 10 40 60-140 70-130 50-150 453 Azinphos methyl 5 40 52-140 70-130 37-150 461 Chlorfevinphos 10 40 56-140 70-130 37-150 469 Chlorpyrifos 10 40 60-140 70-130 48-150 443 Coumaphos 25 40 60-140 70-130 50-150 479 Crotoxyphos 25 46 28-140 68-136 6-150
DEF 10 40 45-140 68-132 42-150 471 Demeton 10 40 33-140 64-130 16-150 460 Diazinon 10 40 60-140 70-130 50-150
Dichlofenthion 10 40 60-140 70-130 50-150 450 Dichlorvos 25 40 52-140 70-130 39-150 455 Dicrotophos not recovered 70-130 449 Dimethoate 5 89 27-140 70-130 22-150 452 Dioxathion - 40 59-140 70-130 49-150 458 Disulfoton 10 40 46-140 70-130 33-150 467 EPN 10 40 60-140 70-130 50-150 463 Ethion 10 40 60-140 70-130 47-150
Ethoprop 10 40 60-140 70-130 50-150 446 Famphur 25 40 60-140 70-130 50-150 454 Fensulfothion 25 65 13-140 42-139 0-150 447 Fenthion 10 40 60-140 70-137 50-150 464 Hexamethylphos
phoramide not recovered
70-130
474 Leptophos 10 40 60-140 70-130 50-150 475 Malathion 10 40 60-140 70-130 50-150
Merphos-B 10 40 60-140 70-130 50-150 Methamidophos 1 10000 40 60-140 70-130 50-150
Methyl chlorpyrifos 10 40 60-140 70-130 50-150 456 Methyl parathion 10 40 60-140 70-130 50-150
Methyl trithion 25 40 21-140 70-130 0-166 444 Mevinphos 25 40 24-140 70-135 7-150 470 Monocrotophos not recovered 19-206 459 Naled 25 40 0-148 70-130 0-176
4444 September 2000
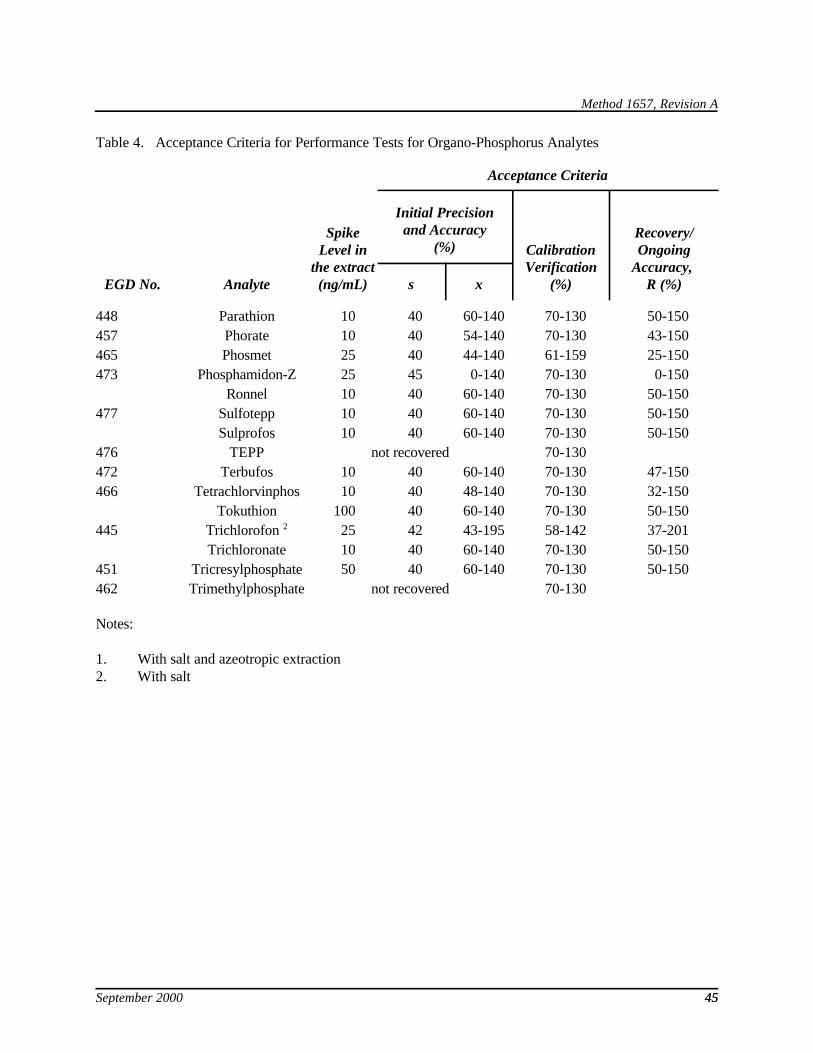
Method 1657, Revision A
Table 4. Acceptance Criteria for Performance Tests for Organo-Phosphorus Analytes
Acceptance Criteria
Initial Precision and Accuracy
(%) Spike
Level in the extract
(ng/mL)
Recovery/ Ongoing
Accuracy, R (%)
Calibration Verification
(%) EGD No. Analyte s x
448 Parathion 10 40 60-140 70-130 50-150 457 Phorate 10 40 54-140 70-130 43-150 465 Phosmet 25 40 44-140 61-159 25-150 473 Phosphamidon-Z 25 45 0-140 70-130 0-150
Ronnel 10 40 60-140 70-130 50-150 477 Sulfotepp 10 40 60-140 70-130 50-150
Sulprofos 10 40 60-140 70-130 50-150 476 TEPP not recovered 70-130 472 Terbufos 10 40 60-140 70-130 47-150 466 Tetrachlorvinphos 10 40 48-140 70-130 32-150
Tokuthion 100 40 60-140 70-130 50-150 445 Trichlorofon 2 25 42 43-195 58-142 37-201
Trichloronate 10 40 60-140 70-130 50-150 451 Tricresylphosphate 50 40 60-140 70-130 50-150 462 Trimethylphosphate not recovered 70-130
Notes:
1. With salt and azeotropic extraction 2. With salt
September 2000 4545

Method 1657, Revision A
September 2000 4646

Method 1657, Revision A
September 2000 4747
Method 1657, Revision A
24.0 Glossary
The definitions and purposes below are specific to this Method, but have been conformed to common usage as much as possible.
24.1 Ambient Water—Waters in the natural environment (e.g., rivers, lakes, streams, and other receiving waters), as opposed to effluent discharges.
24.2 Analytical Batch—A batch of up to 20 samples that are oxidized with the same batch of reagents and analyzed during the same 12-hour shift. Each analytical batch must also include an OPR and a QCS. In addition, MS/MSD samples must be prepared at a frequency of 10% per analytical batch (one MS/MSD for every 10 samples).
24.3 Intercomparison Study—An exercise in which samples are prepared and split by a reference laboratory, then analyzed by one or more testing laboratories and the reference laboratory. The intercomparison, with a reputable laboratory as the reference laboratory, serves as the best test of the precision and accuracy of the analyses at natural environmental levels.
24.4 Matrix Spike (MS) and Matrix Spike Duplicate (MSD)—Aliquots of an environmental sample to which known quantities of the analyte(s) of interest is added in the laboratory. The MS and MSD are analyzed exactly like a sample. Their purpose is to quantify the bias and precision caused by the sample matrix. The background concentrations of the analytes in the sample matrix must be determined in a separate aliquot and the measured values in the MS and MSD corrected for these background concentrations.
24.5 May—This action, activity, or procedural step is allowed but not required.
24.6 May not—This action, activity, or procedural step is prohibited.
24.7 Minimum Level (ML)—The lowest level at which the entire analytical system must give a recognizable signal and acceptable calibration point for the analyte. It is equivalent to the concentration of the lowest calibration standard, assuming that all method-specified sample weights, volumes, and cleanup procedures have been employed. The ML is calculated by multiplying the MDL by 3.18 and rounding the result to the number nearest to (1, 2, or 5) x 10n, where n is an integer.
24.8 Must—This action, activity, or procedural step is required.
24.9 Quality Control Sample (QCS)—A sample containing analytes at known concentrations. The QCS is obtained from a source external to the laboratory, or is prepared from a source of standards different from the source of calibration standards. It is used as an independent check of instrument calibration.
24.10 Reagent Water—Water demonstrated to be free from analytes at the MDLs of this Method. It is prepared from 18 MS ultrapure deionized water starting from a prepurified source. Reagent water is used to wash bottles, as trip and field blanks, and in the preparation of standards and reagents.
September 2000 4848

Method 1657, Revision A
24.11 Regulatory Compliance Limit—A limit on the concentration or amount of a pollutant or contaminant specified in a nationwide standard, in a permit, or otherwise established by a regulatory authority.
24.12 Shall—This action, activity, or procedure is required.
24.13 Should—This action, activity, or procedure is suggested, but not required.
24.14 Stock Solution—A solution containing an analyte that is prepared from a reference material traceable to EPA, NIST, or a source that will attest to the purity and authenticity of the reference material.
September 2000 4949