methanol industry overview - stanford university · pdf filemethanol industry overview marc...
TRANSCRIPT

Confidential. © 2017 IHS MarkitTM. All Rights Reserved.Confidential. © 2017 IHS MarkitTM. All Rights Reserved.
Methanol Industry OverviewMarc Alvarado, Associate Director – Syngas Chemicals
+1 (281) 752-3271 [email protected]

Confidential. © 2017 IHS MarkitTM. All Rights Reserved.
Contents
• IHSMarkit• ValueChain• FeedstocksandImplicationsforMethanol• DemandforMethanol•MethanolProduction• TradeShiftsandPrices• Conclusions
2

Confidential. © 2017 IHS MarkitTM. All Rights Reserved.
Every colleague is committed to putting Customers First
Our mission is to deliver a powerful combination of world-class expertise, knowledge and solutions so you can make more informed decisions to enable your organizations’ long-term, sustainable growth.
3
Including 5,000+ analysts, data scientists, financial experts and industry specialists who offer:
• Unsurpassed ability to interpret data• Award-winning forecasting • Relationships with industry leaders
Offices in 34 countries
IHS Markit colleagues
12,000+ 130+
© 2017 IHS Markit. All Rights Reserved.

Confidential. © 2017 IHS MarkitTM. All Rights Reserved.
Addressing strategic challenges with interconnected capabilities
4
MARITIME& TRADE
ENGINEERING & PRODUCT DESIGN
AEROSPACE,DEFENSE &SECURITY
CHEMICAL
DIGITAL & WEB SOLUTIONS
ECONOMICS &COUNTRY RISKENERGY
FINANCIALMARKETS DATA
& SERVICES
AUTOMOTIVE
OPERATIONAL RISK& REGULATORY COMPLIANCE
TECHNOLOGY,MEDIA &TELECOM
We deliver on the promise of The New Intelligence
IHS Markit provides leaders from multiple industries with the perspective and insights you need to make the best choices and stay ahead of the competition.
© 2017 IHS Markit. All Rights Reserved.

Confidential. © 2017 IHS MarkitTM. All Rights Reserved.
Core Segments within Energy & Natural Resources
5
• Country E&P Terms and Above-Ground Risk
• Plays and Basins• Costs and Technology• Companies and Transactions
• Global Gas• Coal• Power and Renewables• Regional Gas, Power and Coal
Markets
• Crude Oil Markets• Midstream Oil and Natural Gas
Liquids• Refining and Marketing• Company Strategies and
Performance
UPSTREAM OIL MIDSTREAM, DOWNSTREAM & CHEMICAL
POWER, GAS, COAL& RENEWABLES
• Long-Term Planning & Scenarios • Climate Strategy
• Curated Content• Integrated Energy Events & CERAWeek
• Chemical Week and Market Daily Service
• Base Chemicals & Plastics
• Specialty Chemicals• Costs & Technology• Company Benchmarking &
Analytics
ENERGY-WIDE PERSPECTIVES
Our core capabilities serve our energy and chemical customers across the value chain through focused data and insight subscriptions as well as consulting.

Confidential. © 2017 IHS MarkitTM. All Rights Reserved.
Chemical Product Portfolio - Information, Analytics, Expertise
6
Base Chemical Insights
Aromatics & Fibers
Chlor-Alkali & Vinyls
Light Olefins & Derivatives
Heavy C4 Olefins & Derivatives
Plastics & Polymers
Syngas Chemicals
Specialty Chemical InsightsIndustrial Gases &
Fertilizers
Inorganics & Mining Materials
Intermediates, Fibers & Films
Polymers & Elastomers
Pure Specialties
Renewables & Nutrition
Resins & Coatings
Solvents & Surfactants
Technology & Analytics
Process Economics
Competitive Cost and Margin Analytics
Capital Costs Service
Special Studies
Business Information &
Same-Day Analysis
Chemical Week
Chemical Company Analysis
Directory of Chemical Producers
Market Daily Service
Member Events
Consulting Services
Strategy
Commercial Analysis
Transaction Support
Technology Assessment
Industry Training

Confidential. © 2017 IHS MarkitTM. All Rights Reserved.
Value Chain
Confidential. © 2017 IHS MarkitTM. All Rights Reserved.
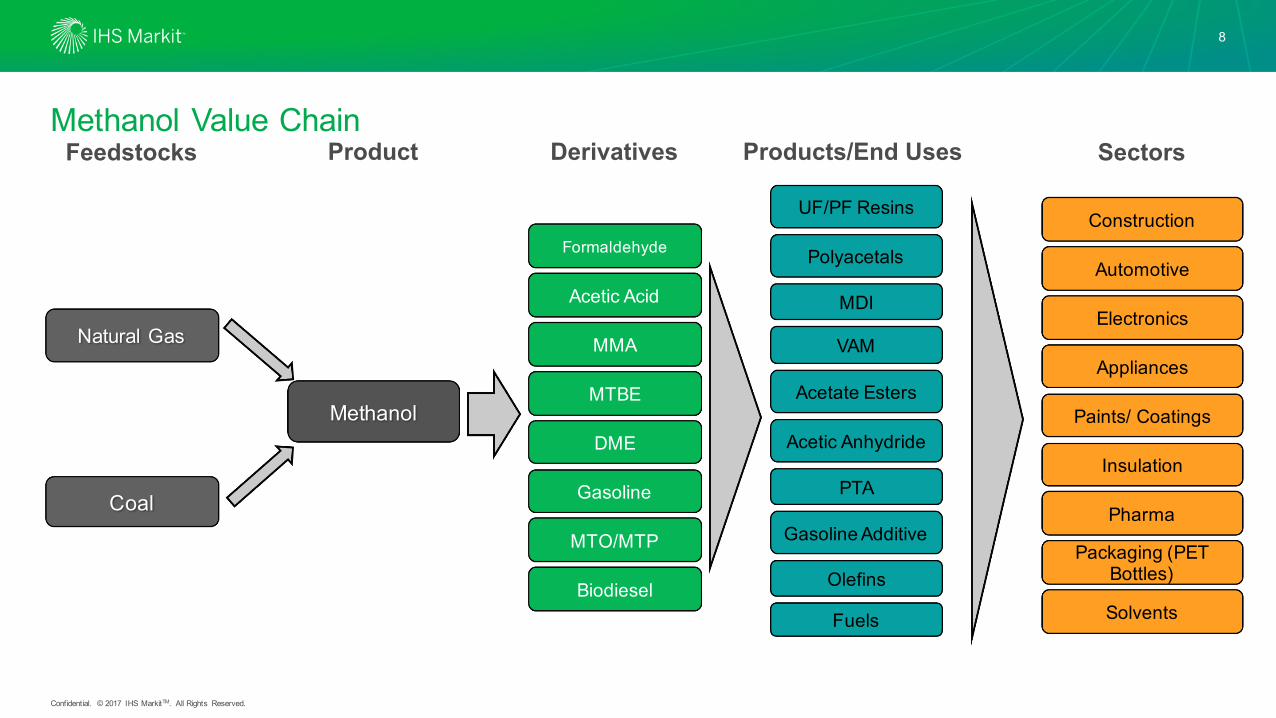
Feedstocks Product Derivatives Products/End Uses Sectors
Natural Gas
Methanol
Formaldehyde
Acetic Acid
MMA
MTBE
DME
GasolineCoal
Construction
Automotive
Electronics
Appliances
Paints/ Coatings
Insulation
Pharma
Packaging (PET Bottles)
MTO/MTP
Biodiesel
UF/PF Resins
MDI
VAM
Gasoline Additive
Polyacetals
Acetate Esters
Acetic Anhydride
Olefins
Fuels
PTA
Solvents
Methanol Value Chain
8

Confidential. © 2017 IHS MarkitTM. All Rights Reserved.
Feedstocks and Implications for Methanol
Confidential. © 2017 IHS MarkitTM. All Rights Reserved.
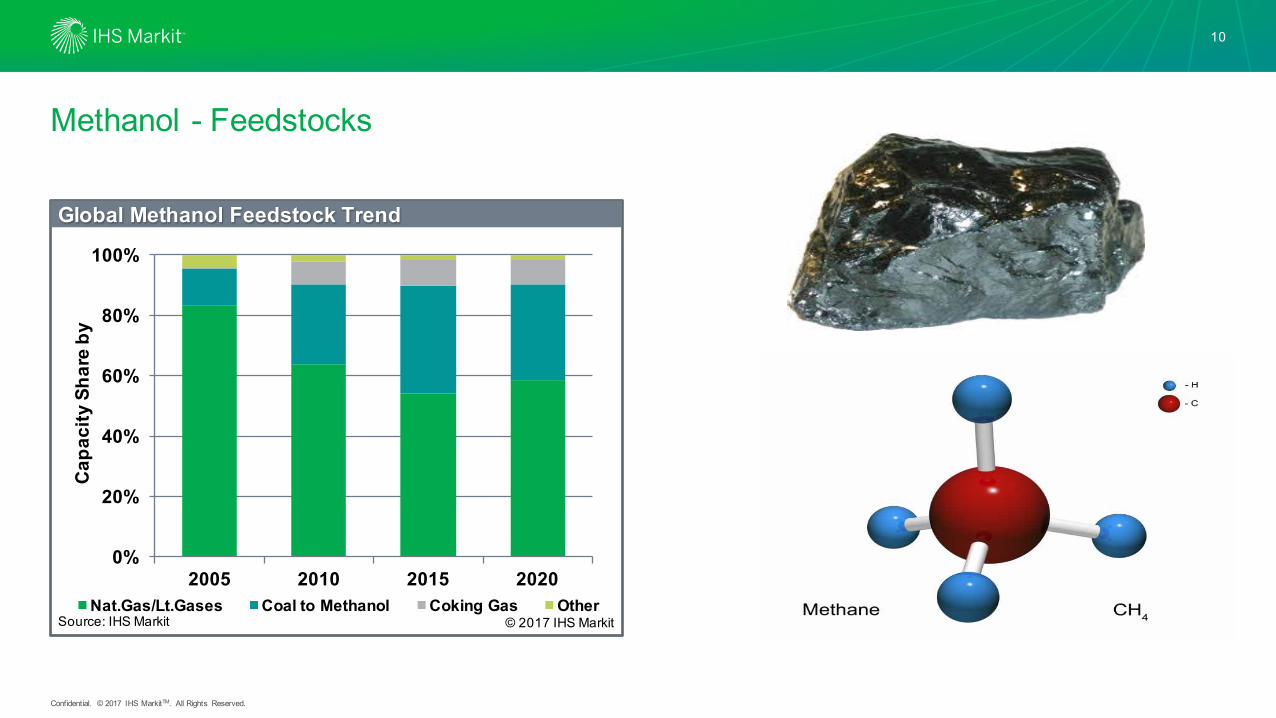
Methanol - Feedstocks
0%
20%
40%
60%
80%
100%
2005 2010 2015 2020Nat.Gas/Lt.Gases Coal to Methanol Coking Gas Other
© 2017 IHS Markit
Global Methanol Feedstock Trend
Source: IHS Markit
Capa
city
Sha
re b
y
10

Confidential. © 2017 IHS MarkitTM. All Rights Reserved.
Global Crude Prices Recover as Oil S/D Balances TightenChinese Coal not forecast to be volatile
11
0
20
40
60
80
100
120
140
0
100
200
300
400
500
600
700
800
2000
2001
2002
2003
2004
2005
2006
2007
2008
2009
2010
2011
2012
2013
2014
2015
2016
2017
2018
2019
2020
2021
Brent Crude Oil
China Coal vs. Crude Oil Pricing
Source: IHS Markit © 2017 IHS Markit
Q Coal
China Coal vs. Crude Oil Pricing
Source: IHS Markit © 2017 IHS Markit
Q C
oal,
Dolla
rs P
er
Met
ric T
on
Crud
e O
il, D
olla
rs P
er
Barre
l

Confidential. © 2017 IHS MarkitTM. All Rights Reserved.
Global Crude Prices Recover as Oil S/D Balances TightenUS Natural Gas not forecast to be volatile
0
30
60
90
120
10 11 12 13 14 15 16 17 18 19 20 210
5
10
15
20
Natural Gas WTI Brent
Global Crude Oil vs. USGC Natural Gas
Source: IHS Markit © 2017 IHS Markit
12
Confidential. © 2017 IHS MarkitTM. All Rights Reserved.
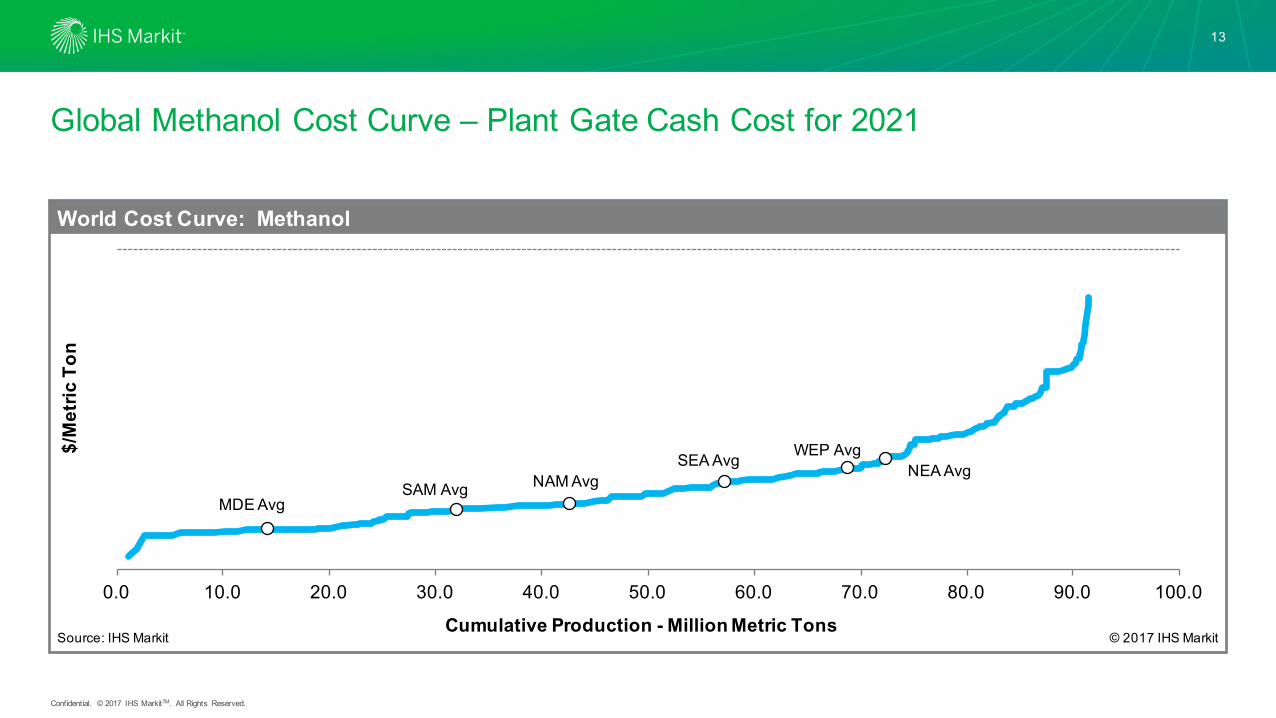
Global Methanol Cost Curve – Plant Gate Cash Cost for 2021
MDE AvgNAM Avg NEA Avg
SAM Avg
SEA Avg WEP Avg
0.0 10.0 20.0 30.0 40.0 50.0 60.0 70.0 80.0 90.0 100.0
World Cost Curve: MethanolWorld Cost Curve: Methanol
Cumulative Production - Million Metric Tons
World Cost Curve: MethanolWorld Cost Curve: MethanolWorld Cost Curve: MethanolWorld Cost Curve: MethanolWorld Cost Curve: MethanolWorld Cost Curve: MethanolWorld Cost Curve: MethanolWorld Cost Curve: MethanolWorld Cost Curve: MethanolWorld Cost Curve: MethanolWorld Cost Curve: MethanolWorld Cost Curve: MethanolWorld Cost Curve: MethanolWorld Cost Curve: Methanol
$/M
etric
Ton
Source: IHS Markit © 2017 IHS Markit
13

Confidential. © 2017 IHS MarkitTM. All Rights Reserved.
Global Methanol Cost Curve – Plant Gate Cash Cost for 2021
0.0 10.0 20.0 30.0 40.0 50.0 60.0 70.0 80.0 90.0 100.0
World Cost Curve: MethanolWorld Cost Curve: Methanol
Cumulative Production - Million Metric Tons
World Cost Curve: MethanolWorld Cost Curve: MethanolWorld Cost Curve: MethanolWorld Cost Curve: MethanolWorld Cost Curve: MethanolWorld Cost Curve: MethanolWorld Cost Curve: MethanolWorld Cost Curve: MethanolWorld Cost Curve: MethanolWorld Cost Curve: MethanolWorld Cost Curve: MethanolWorld Cost Curve: MethanolWorld Cost Curve: MethanolWorld Cost Curve: Methanol
$/M
etric
Ton
Source: IHS Markit © 2017 IHS Markit
World Cost Curve: MethanolWorld Cost Curve: MethanolWorld Cost Curve: MethanolWorld Cost Curve: MethanolWorld Cost Curve: MethanolWorld Cost Curve: MethanolWorld Cost Curve: MethanolWorld Cost Curve: MethanolWorld Cost Curve: MethanolWorld Cost Curve: MethanolWorld Cost Curve: MethanolWorld Cost Curve: MethanolWorld Cost Curve: MethanolWorld Cost Curve: MethanolWorld Cost Curve: MethanolWorld Cost Curve: MethanolWorld Cost Curve: MethanolWorld Cost Curve: MethanolWorld Cost Curve: MethanolWorld Cost Curve: MethanolWorld Cost Curve: MethanolWorld Cost Curve: MethanolWorld Cost Curve: MethanolWorld Cost Curve: MethanolWorld Cost Curve: MethanolWorld Cost Curve: MethanolWorld Cost Curve: MethanolWorld Cost Curve: MethanolWorld Cost Curve: MethanolWorld Cost Curve: Methanol
Coal Based Units
14

Confidential. © 2017 IHS MarkitTM. All Rights Reserved.
What are the feedstock implications for methanol?
• TheincrementaltonofmethanolwillcontinuetobeproducedfromcoalinChina(mostly3rd and4thquartileonthecostcurve)
• ThecoalpricewillcontinuetobeamajorfactorindeterminingthefloorpriceofmethanolinChina
• ThelowcostofUSnaturalgaswillkeepUSmethanolproducerscompetitive(2nd quartileonthecostcurve)
• Lowproductioncostwillresultinfurtherinvestmentinmethanolprojectsincertainmarkets
15
Confidential. © 2017 IHS MarkitTM. All Rights Reserved.
Demand for Methanol

Confidential. © 2017 IHS MarkitTM. All Rights Reserved.
2010 Global Methanol Demand: Chemicals and Energy End-Uses
Formaldehyde34.0%
Acetic Acid10.8%
MTBE/TAME12.6%
Methyl Methacrylate2.1%
Gasoline Blending6.6%
Biodiesel3.8%
Dimethyl Ether9.6%
Methylamines4.0%
Chloromethanes3.8%
Solvents5.6%
Others/DMT7.0%
World: 2010 Methanol Demand by End Use
Demand = 49.3 Million Metric TonsSource: IHS Markit © 2017 IHS Markit
17

Confidential. © 2017 IHS MarkitTM. All Rights Reserved.
2021 Global Methanol Demand: The Importance of MTO – 1 in 5 tons of methanol
Formaldehyde26.9%
Acetic Acid8.3%
MTBE/TAME9.7%
Methyl Methacrylate1.6%
Gasoline Blending8.5%
Biodiesel3.5%
Dimethyl Ether6.8%
Methylamines2.7%
Chloromethanes2.3%
MTO/MTP19.3%
Solvents4.0%
Others/DMT6.3%
World: 2021 Methanol Demand by End Use
Demand = 95.2 Million Metric TonsSource: IHS Markit © 2017 IHS Markit
18

Confidential. © 2017 IHS MarkitTM. All Rights Reserved.
Global Methanol Demand by Region
19
0
60
120
11 12 13 14 15 16 17 18 19 20 21 26N. America S. America W. Europe C. Europe CIS & Baltics Africa Middle East Indian Subc. NE Asia SE Asia
World: Methanol Demand by Region
Source: IHS Markit © 2017 IHS Markit
Mill
ion
Met
ric T
ons

Confidential. © 2017 IHS MarkitTM. All Rights Reserved.
Global Methanol Consumption Categories
20
0
20
40
60
80
100
120
11 12 13 14 15 16 17 18 19 20 21 26Traditional derivatives MTO/MTP Fuel
Global Methanol Consumption
Mill
ion
Met
ric T
ons
Global Methanol ConsumptionGlobal Methanol Consumption
Source: IHS Markit © 2017 IHS Markit

Confidential. © 2017 IHS MarkitTM. All Rights Reserved.
The Methanol Industry Is Entered Into A New Dimension With Much Larger MTO Plants
0
500
1000
1500
2000
2500
Formaldehyde Acetic Acid MTBE DME MTO MTP
Average Plant Size Largest Plant Size
Capacity to consume methanol by key derivative in China (2017)
© 2017 IHS Markit
Thou
sand
Met
ricTo
ns
Source: IHS Markit
21
21

Confidential. © 2017 IHS MarkitTM. All Rights Reserved.
Ethylene Cash Cost Comparison
22
U.S. Ethane Western Canada
China CTO Northeast Asia Naphtha
West Europe Naphtha
Southeast Asia Naphtha
China MTO
2011 2016 2021 SAR @ $1.75/MMbtu
World Ethylene Cast Cost Comparison
Source: IHS © 2017 IHS
USDo
llar P
er M
etric
Ton
Notes: CTO/MTO : Cash costs based on one ton of total olefin basis (50/50 ethylene/propylene)

Confidential. © 2017 IHS MarkitTM. All Rights Reserved.
Ethylene Cash Cost Comparison
23
U.S. Ethane Western Canada
China CTO Northeast Asia Naphtha
West Europe Naphtha
Southeast Asia Naphtha
China MTO
2011 2016 2021 SAR @ $1.75/MMbtu
World Ethylene Cast Cost Comparison
Source: IHS © 2017 IHS
USDo
llar P
er M
etric
Ton
Notes: CTO/MTO : Cash costs based on one ton of total olefin basis (50/50 ethylene/propylene)

Confidential. © 2017 IHS MarkitTM. All Rights Reserved.
Ethylene Cash Cost Comparison
24
U.S. Ethane Western Canada
China CTO Northeast Asia Naphtha
West Europe Naphtha
Southeast Asia Naphtha
China MTO
2011 2016 2021 SAR @ $1.75/MMbtu
World Ethylene Cast Cost Comparison
Source: IHS © 2017 IHS
USDo
llar P
er M
etric
Ton
Notes: CTO/MTO : Cash costs based on one ton of total olefin basis (50/50 ethylene/propylene)

Confidential. © 2017 IHS MarkitTM. All Rights Reserved.
Methanol in the Chinese Gasoline Pool
25
0
200
400
600
800
1,000
0.00 0.50 1.00 1.50 2.00 2.50 3.00 3.50 4.00 4.50 5.00 5.50 6.00 6.50Met
hano
l Pric
e, D
olla
rs P
er M
etric
Ton
Methanol
Gasoline Price, Dollars Per Gallon
Equivalent energy price for methanol
Forecast price range of gasoline, 2017
Methanol Values Into Direct Gasoline Blending
Source: IHS Markit © 2017 IHS Markit
Confidential. © 2017 IHS MarkitTM. All Rights Reserved.
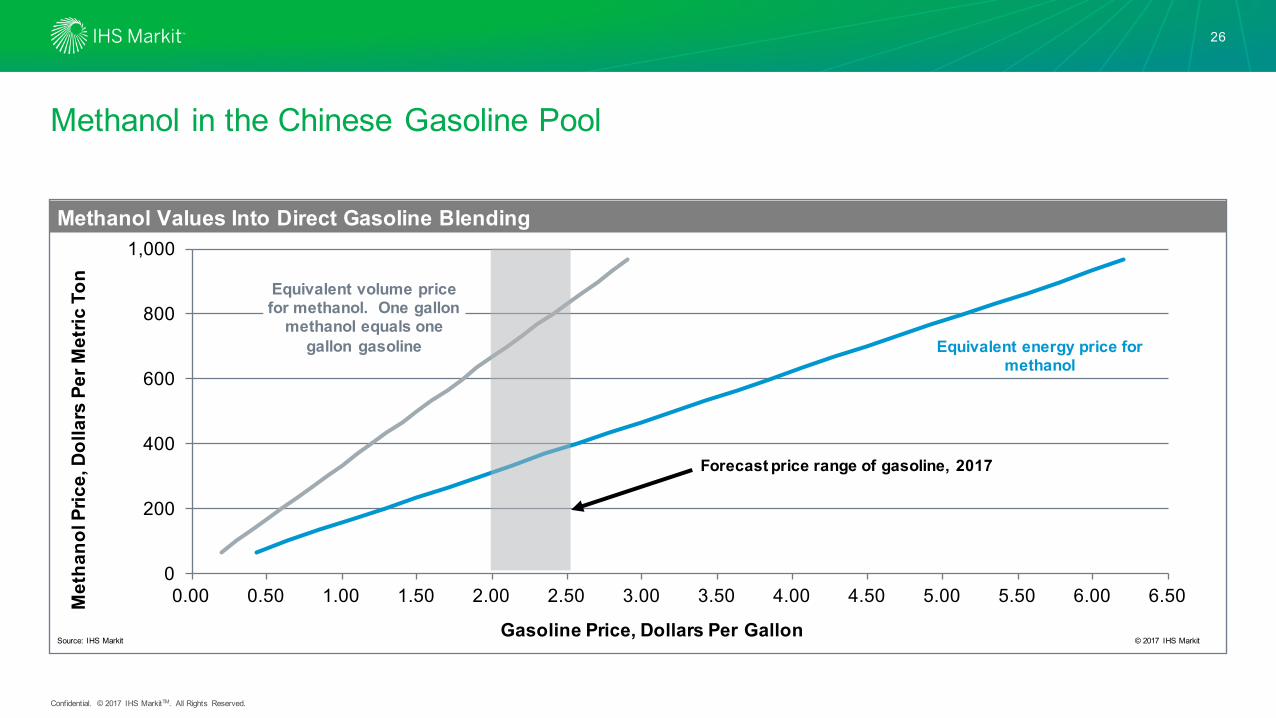
Methanol in the Chinese Gasoline Pool
26
0
200
400
600
800
1,000
0.00 0.50 1.00 1.50 2.00 2.50 3.00 3.50 4.00 4.50 5.00 5.50 6.00 6.50Met
hano
l Pric
e, D
olla
rs P
er M
etric
Ton
Gasoline Price, Dollars Per Gallon
Equivalent energy price for methanol
Equivalent volume price for methanol. One gallon
methanol equals one gallon gasoline
Forecast price range of gasoline, 2017
Methanol Values Into Direct Gasoline Blending
Source: IHS Markit © 2017 IHS Markit

Confidential. © 2017 IHS MarkitTM. All Rights Reserved.
Methanol in the Chinese Gasoline Pool
27
0
200
400
600
800
1,000
0.00 0.50 1.00 1.50 2.00 2.50 3.00 3.50 4.00 4.50 5.00 5.50 6.00 6.50Met
hano
l Pric
e, D
olla
rs P
er M
etric
Ton
Gasoline Price, Dollars Per Gallon
Methanol Values Into Direct Gasoline Blending
Source: IHS Markit © 2017 IHS Markit
This gap makes illegal blending attractive,
resulting in a portion of inelastic demand

Confidential. © 2017 IHS MarkitTM. All Rights Reserved.
What are the demand implications for methanol?
• SteadyGDPtypegrowthisexpectedforthe‘traditional’methanolderivatives
• Theforecastincreaseinthecrudeoilpricewillleadtoasteadyriseinmethanolprices– energyapplicationsandMTOcloselycorrelatedtooil– however,thisrisewillbeconstrainedoverthenextfewyearsbythecostcompetitivenessoftheseoptions
28
Confidential. © 2017 IHS MarkitTM. All Rights Reserved.
Methanol Production
Confidential. © 2017 IHS MarkitTM. All Rights Reserved.
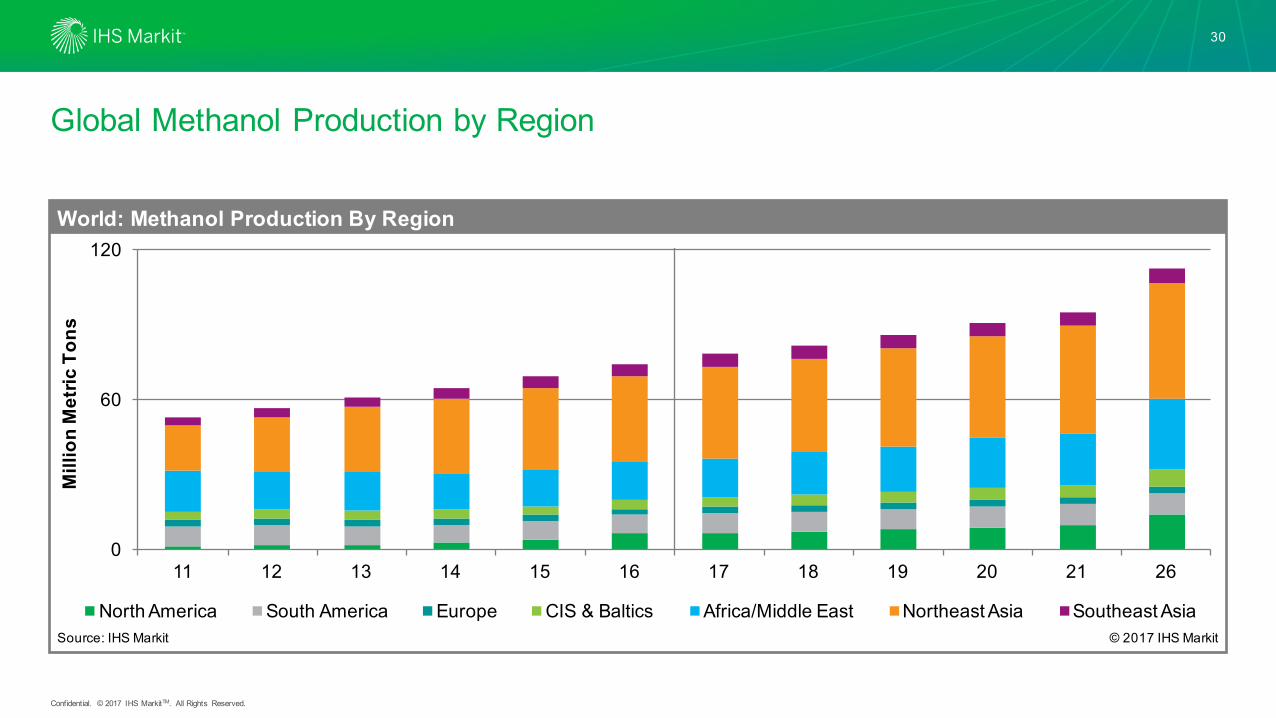
Global Methanol Production by Region
0
60
120
11 12 13 14 15 16 17 18 19 20 21 26
North America South America Europe CIS & Baltics Africa/Middle East Northeast Asia Southeast Asia
Mill
ion
Met
ric T
ons
World: Methanol Production By Region
Source: IHS Markit © 2017 IHS Markit
30
Confidential. © 2017 IHS MarkitTM. All Rights Reserved.
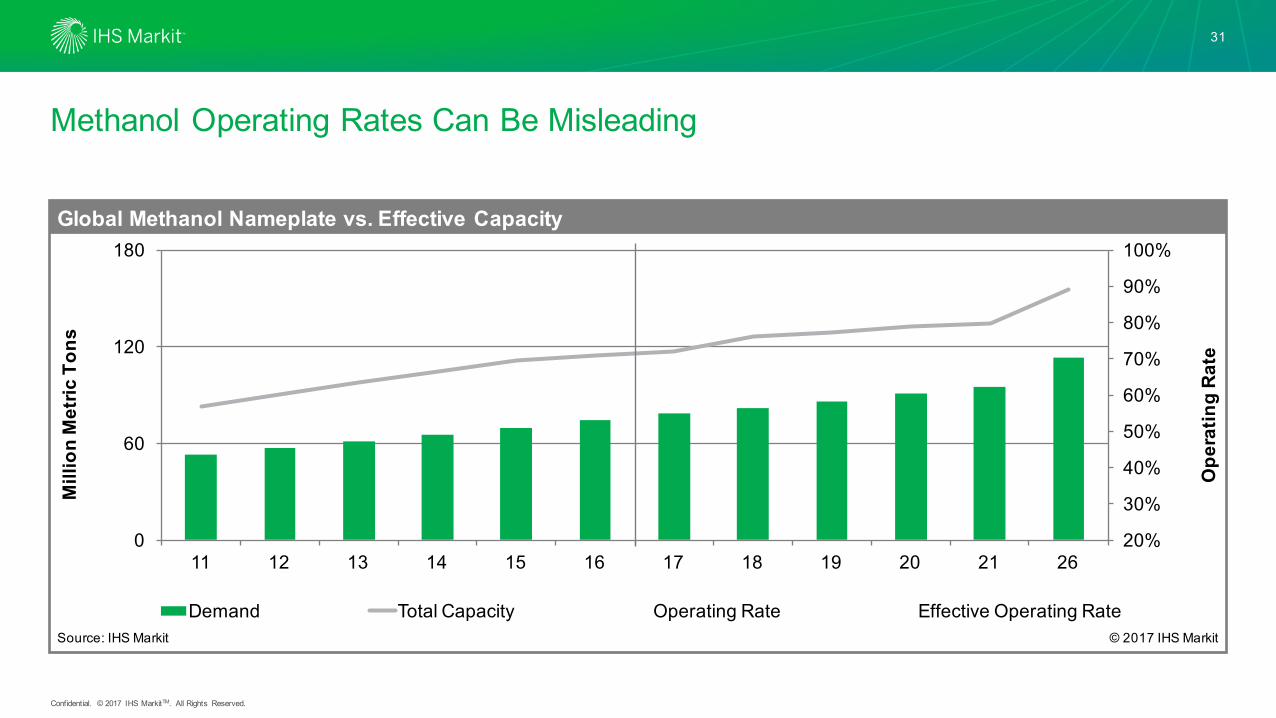
Methanol Operating Rates Can Be Misleading
31
20%
30%
40%
50%
60%
70%
80%
90%
100%
0
60
120
180
11 12 13 14 15 16 17 18 19 20 21 26
Demand Total Capacity Operating Rate Effective Operating Rate
Mill
ion
Met
ric T
ons
Ope
ratin
gRa
te
Global Methanol Nameplate vs. Effective Capacity
Source: IHS Markit © 2017 IHS Markit

Confidential. © 2017 IHS MarkitTM. All Rights Reserved.
Methanol Operating Rates Can Be Misleading
32
20%
30%
40%
50%
60%
70%
80%
90%
100%
0
60
120
180
11 12 13 14 15 16 17 18 19 20 21 26
Demand Total Capacity Operating Rate Effective Operating Rate
Mill
ion
Met
ric T
ons
Ope
ratin
gRa
te
Global Methanol Nameplate vs. Effective Capacity
Source: IHS Markit © 2017 IHS Markit

Confidential. © 2017 IHS MarkitTM. All Rights Reserved.
Methanol Operating Rates Can Be Misleading
33
20%
30%
40%
50%
60%
70%
80%
90%
100%
0
60
120
180
11 12 13 14 15 16 17 18 19 20 21 26
Demand Total Capacity Operating Rate Effective Operating Rate
Mill
ion
Met
ric T
ons
Ope
ratin
gRa
te
Global Methanol Nameplate vs. Effective Capacity
Source: IHS Markit © 2017 IHS Markit
Confidential. © 2017 IHS MarkitTM. All Rights Reserved.
Methanol Trade Shifts and Prices

Confidential. © 2017 IHS MarkitTM. All Rights Reserved.
Historical Regional Methanol Net Trade
N America is a major net importer
S America is a major net exporter
W Europe is a major net importer
Middle East is a major net exporter
Northeast Asia is a major net importer
Southeast Asia is a net exporter
35
Confidential. © 2017 IHS MarkitTM. All Rights Reserved.
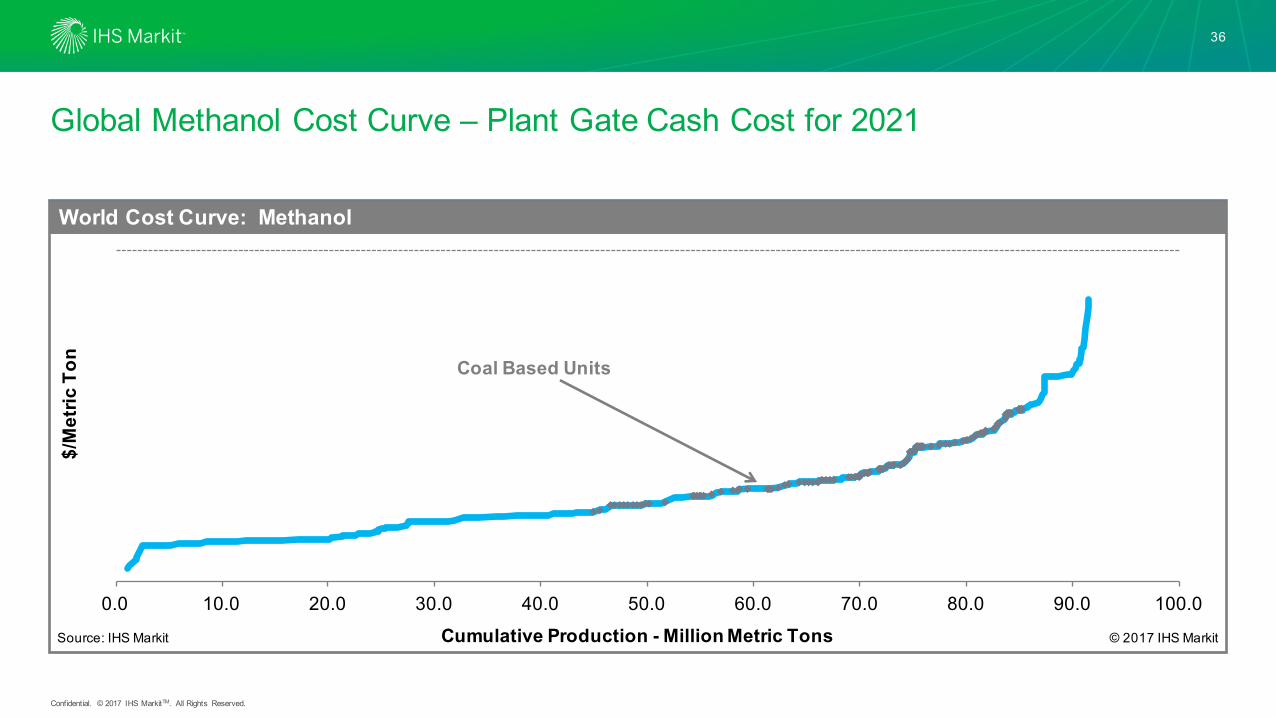
Global Methanol Cost Curve – Plant Gate Cash Cost for 2021
0.0 10.0 20.0 30.0 40.0 50.0 60.0 70.0 80.0 90.0 100.0
World Cost Curve: MethanolWorld Cost Curve: Methanol
Cumulative Production - Million Metric Tons
World Cost Curve: MethanolWorld Cost Curve: MethanolWorld Cost Curve: MethanolWorld Cost Curve: MethanolWorld Cost Curve: MethanolWorld Cost Curve: MethanolWorld Cost Curve: MethanolWorld Cost Curve: MethanolWorld Cost Curve: MethanolWorld Cost Curve: MethanolWorld Cost Curve: MethanolWorld Cost Curve: MethanolWorld Cost Curve: MethanolWorld Cost Curve: Methanol
$/M
etric
Ton
Source: IHS Markit © 2017 IHS Markit
World Cost Curve: MethanolWorld Cost Curve: MethanolWorld Cost Curve: MethanolWorld Cost Curve: MethanolWorld Cost Curve: MethanolWorld Cost Curve: MethanolWorld Cost Curve: MethanolWorld Cost Curve: MethanolWorld Cost Curve: MethanolWorld Cost Curve: MethanolWorld Cost Curve: MethanolWorld Cost Curve: MethanolWorld Cost Curve: MethanolWorld Cost Curve: MethanolWorld Cost Curve: MethanolWorld Cost Curve: MethanolWorld Cost Curve: MethanolWorld Cost Curve: MethanolWorld Cost Curve: MethanolWorld Cost Curve: MethanolWorld Cost Curve: MethanolWorld Cost Curve: MethanolWorld Cost Curve: MethanolWorld Cost Curve: MethanolWorld Cost Curve: MethanolWorld Cost Curve: MethanolWorld Cost Curve: MethanolWorld Cost Curve: MethanolWorld Cost Curve: MethanolWorld Cost Curve: Methanol
Coal Based Units
36

Confidential. © 2017 IHS MarkitTM. All Rights Reserved.
Global Methanol Cost Curve – Plant Gate Cash Cost for 2021
MDE Avg
0.0 10.0 20.0 30.0 40.0 50.0 60.0 70.0 80.0 90.0 100.0
World Cost Curve: MethanolWorld Cost Curve: Methanol
Cumulative Production - Million Metric Tons
World Cost Curve: MethanolWorld Cost Curve: MethanolWorld Cost Curve: MethanolWorld Cost Curve: MethanolWorld Cost Curve: MethanolWorld Cost Curve: MethanolWorld Cost Curve: MethanolWorld Cost Curve: MethanolWorld Cost Curve: MethanolWorld Cost Curve: MethanolWorld Cost Curve: MethanolWorld Cost Curve: MethanolWorld Cost Curve: MethanolWorld Cost Curve: Methanol
$/M
etric
Ton
Source: IHS Markit © 2017 IHS Markit
37

Confidential. © 2017 IHS MarkitTM. All Rights Reserved.
Global Methanol Price Mechanism: Middle East Netback
NAM
•ME price to North America = China price + Freight differential + Duties
SAM
•South American producers price to N. America at a price to discourage ME imports to N. America
WEP
•ME Price to Europe = China price + Freight differential + duties + handling•W. European producers marginal cost may force upward adjustment
ME
•Global price taker•Balances exports to regions for highest netback (NB)•NB ME China = China price less freight ME to China•Incremental cost to deliver to WE vs. China•Incremental Cost to deliver to NA vs. China
NEA & SEA
•Global marginal cost production block•Global price setter
38

Confidential. © 2017 IHS MarkitTM. All Rights Reserved.
Regional Methanol Net Trade - 2016 versus 2021
20162021
N America changes to large net export position
-1419
1530
5713
6576
S America becomes a larger net exporter
-5095
-4599
W Europe becomes a larger net importer
1034914571
Middle East becomes a larger net exporter
-13216
-21291
Northeast Asia becomes a larger net importer
2303
1975
Southeast Asia becomes a smaller net exporter
39

Confidential. © 2017 IHS MarkitTM. All Rights Reserved.
Forecasted Global Methanol Price Mechanism: Producer Netback Balance
NAM
•North American price to be Asia less some function of freight•Market balanced by exporting to Europe and Asian
SAM
•Exports to North America and Europe continue with Atlantic basin balance maintained by moving additional tons to Asia
WEP
•ME Price to Europe = China price + Freight differential + duties + handling
ME
•Global price taker•Balances exports to regions for highest netback (NB)
NEA & SEA
• Remains global marginal cost production block•Global price setter
To Asia
From Americas
40

Confidential. © 2017 IHS MarkitTM. All Rights Reserved.
Regional Methanol Price Comparison – Long Term
200
300
400
500
2010
2011
2012
2013
2014
2015
2016
2017
2018
2019
2020
2021
2022
2023
2024
2025
2026
U.S. Spot WEP Spot T2 NEA Spot
Methanol Annual Regional Price Comparison
Dolla
rs p
er m
etric
Ton
Source: IHS Markit © 2017 IHS Markit
41

Confidential. © 2017 IHS MarkitTM. All Rights Reserved.
Methanol vs Energy Products vs MTO Affordability
2000 2005 2010 2015 2020 2025 2030 2035 2040
Methanol - Asia Gasoline - NEA Crude Oil - NEA MTO Affordability
Equivalent Price for Energy Products and MTO for Asia
Dolla
rs p
er m
etric
Ton

Confidential. © 2017 IHS MarkitTM. All Rights Reserved.
Methanol vs Energy Products vs MTO Affordability
43
2000 2005 2010 2015 2020 2025 2030 2035 2040
Methanol - Asia Gasoline - NEA Crude Oil - NEA MTO Affordability
Equivalent Price for Energy Products and MTO for Asia
Dolla
rs p
er m
etric
Ton

Confidential. © 2017 IHS MarkitTM. All Rights Reserved.
Conclusions

Confidential. © 2017 IHS MarkitTM. All Rights Reserved.
Conclusions
• CoalbasedproductioninEasternChinapopulatesthefourthquartileofthecostcurveandsetsthemethanolpriceastheincrementaltonofproduction
• Thespreadbetweennaturalgasprices– asamethanolfeedstock– andcrudeoil– asabasisforderivativeaffordability– isdrivingcapacityadditionsinselectgeographies
• Globaldemandgrowthformethanolisat4.3%AAGRfrom2016to2026versusGDPat3.0%• MTOisakeydriverat9.7%duringthattimeperiod
• Globaloperatingratesareactuallyhigherthanwhatnameplatewouldsuggest• Thereisaninabilitytoraiseratesfurther incertainlocations
• Methanolisafungiblecommoditywithregionalpricessetbyfreightanddutydifferentials• Thepricemechanismsarelikelytoundergoashiftwithchangesintradepatterns
• MethanolpricesarecappedbyMTOaffordability
45

Confidential. © 2017 IHS MarkitTM. All Rights Reserved.
35th WORLD METHANOL CONFERENCE
• 29th – 30 September, 2017
• Berlin Pullman Hotel, Berlin, Germany
• Full day workshop "Introduction to Methanol" on September 29, 2017
• More about IHS World Methanol Conference at www.ihs.com/WMC2017
Vopak Webinar May 2017
46