methane isotopologue parameter assessment of multiple

1
European Space Agency www.esa.int Methane isotopologue parameter assessment of multiple spectral databases using TCCON Edward Malina 1 , Ben Veihelmann 1 , Dietrich G. Feist 2,3 and Isamu Morino 4 1 Earth and Mission Science Division – ESTEC/European Space Agency (ESA) – the Netherlands 2 DLR - Institute of Atmospheric Physics – Germany, 3 Max Planck Institute for Biogeochemistry – Germany 4 National Institute for Environmental Studies – Japan Email: [email protected] In this study, we perform retrievals of the two main methane isotopologues 12 CH 4 and 13 CH 4 using the Total Carbon Column Observing Network (TCCON). With the aim of assessing the biases associated with methane retrieval in the future Copernicus Sentinel 5 spectral regions. To assess the biases we use the TCCON GGG2014 retrieval environment, and four separate spectroscopy databases, the JPL/TCCON spectroscopy database; the HITRAN2016 database; the GEISA2015 database; and the ESA SEOM-IAS database. We find significant variability in the retrievals of methane isotopologues, both in terms of the band and database. The SEOM-IAS database, with the addition on non-Voigt elements tends to show better spectral fits, and agrees closely with the current standard TCCON retrievals. SUMMARY 3. TCCON SPECTRAL WINDOWS Window Range (cm -1 ) Target species Source 1 4190-4340 12 CH 4 Sentinel 5 baseline 2 5880-5996 12 CH 4 TCCON Standard 3 5996.45-6007.55 12 CH 4 TCCON Standard 4 6007-6145 12 CH 4 TCCON Standard 5 4190-4340 13 CH 4 Sentinel 5 baseline 6 6007-6145 13 CH 4 TCCON Standard Variable seasons, hot wet summers, dry cold winters High population density region, anthropogenic sources. TSUKUBA (TK) (01/04/2016) Near the equator, constant year round conditions. Low populations density, natural sources. ASCENSION ISLAND (AI) (01/10/2016) CONCLUSIONS HITRAN2016: https://hitran.org/ GEISA2015: http://cds- espri.ipsl.upmc.fr/GEISA/geisa_raie_2 015.php SEOM-IAS: https://www.wdc.dlr.de/seom-ias/ GGG2014: https://tccon- wiki.caltech.edu/ 8. REFERENCES EXAMPLE 12 CH 4 RETRIEVAL TIMELINES SEOM-IAS database has improved spectral fit performance, Also shows least variation in δ 13 C. Climate and site do not impact the indicated differences. Large variations in δ 13 C calculation depending on bands and spectral database. “rel. difference” refers to differences from band 4 of TCCON/JPL database ISOTOPOLOGUES Chemical species of molecule that contains at least one isotope in its structure. METHANE SOURCES: The ability to distinguish between the isotopologues of methane, allows an observer to determine the source of the methane emissions. (Etiope 2009). METHANE ISOTOPOLOGUES 13 = 13 12 13 12 −1 × 1000 Atmospheric Methane and its composition. Rigby et al (2012). Courtesy of Nixon et al (2012). δ 13 C: Global tropospheric averages of -45‰, abiogenic sources -20‰, and biogenic sources -60‰. 98% of Atmospheric Methane. 1.1% of Atmospheric Methane. δ 13 C TCCON Bands 1 & 5 TCCON Bands 4 & 6 HITRAN Bands 1 & 5 HITRAN Bands 4 & 6 GEISA Bands 1 & 5 GEISA Bands 4 & 6 SEOM Bands 1 & 5 TK 01/04/2016 -116‰ -1.52‰ -59.1‰ -33.1‰ -358‰ -193‰ -109‰ TK 07/07/2016 -173‰ 74.5‰ -159‰ 296‰ -518‰ -202‰ -143‰ AI 23/08/2016 -108‰ -92.4‰ -104‰ -8.47‰ -384‰ -297‰ -95.0‰ AI 01/10/2016 -115‰ 43.6‰ -46.7‰ 160‰ -419‰ -134‰ -84.2‰ JPL/TCCON (Black Voigt) HITRAN2016 (Red Voigt) GEISA2015 (Blue Voigt) SEOM-IAS (Green Non-Voigt) SPECTROSCOPY (ASSUMED LINESHAPES) SPECTRAL WINDOWS EXAMPLE TRANSMISSION SPECTRA AND RESIDUAL TRANSMISSION TYPICALLY SEOM-IAS SHOWS LOWEST FIT RESIDUALS (FOR THE 2.3 μM TCCON retrieval windows for 12 CH 4 , with addition of Sentinel 5 band. Wide windows only for 13 CH 4 . Retrieval statistics indicate that SEOM-IAS shows the lowest residual error. DAY AVERAGED δ 13 C VALUES Window 1 Window 2 Window 3 Window 4 RMSE TCCON: 4.438x10 -3 HITRAN: 6.803x10 -3 GEISA: 5.678x10 -3 SEOM: 4.268x10 -3 TCCON: 3.076x10 -3 HITRAN: 3.747x10 -3 GEISA: 3.910x10 -3 SEOM: nan TCCON: 3.846x10 -3 HITRAN: 5.302x10 -3 GEISA: 6.010x10 -3 SEOM: nan TCCON: 2.680x10 -3 HITRAN: 3.578x10 -3 GEISA: 3.722x10 -3 SEOM: nan Calculated from the δ 13 C equation and retrievals from TCCON spectral windows. TK and AI both show wide variations in retrieval values, depending on spectral band and database. Windows 5 & 6 focused on 13 CH 4 show same fit values as windows 1 and 4.

Upload: others

Post on 29-Nov-2021

0 views

Category:

Documents


0 download

TRANSCRIPT

European Space Agencywww.esa.int

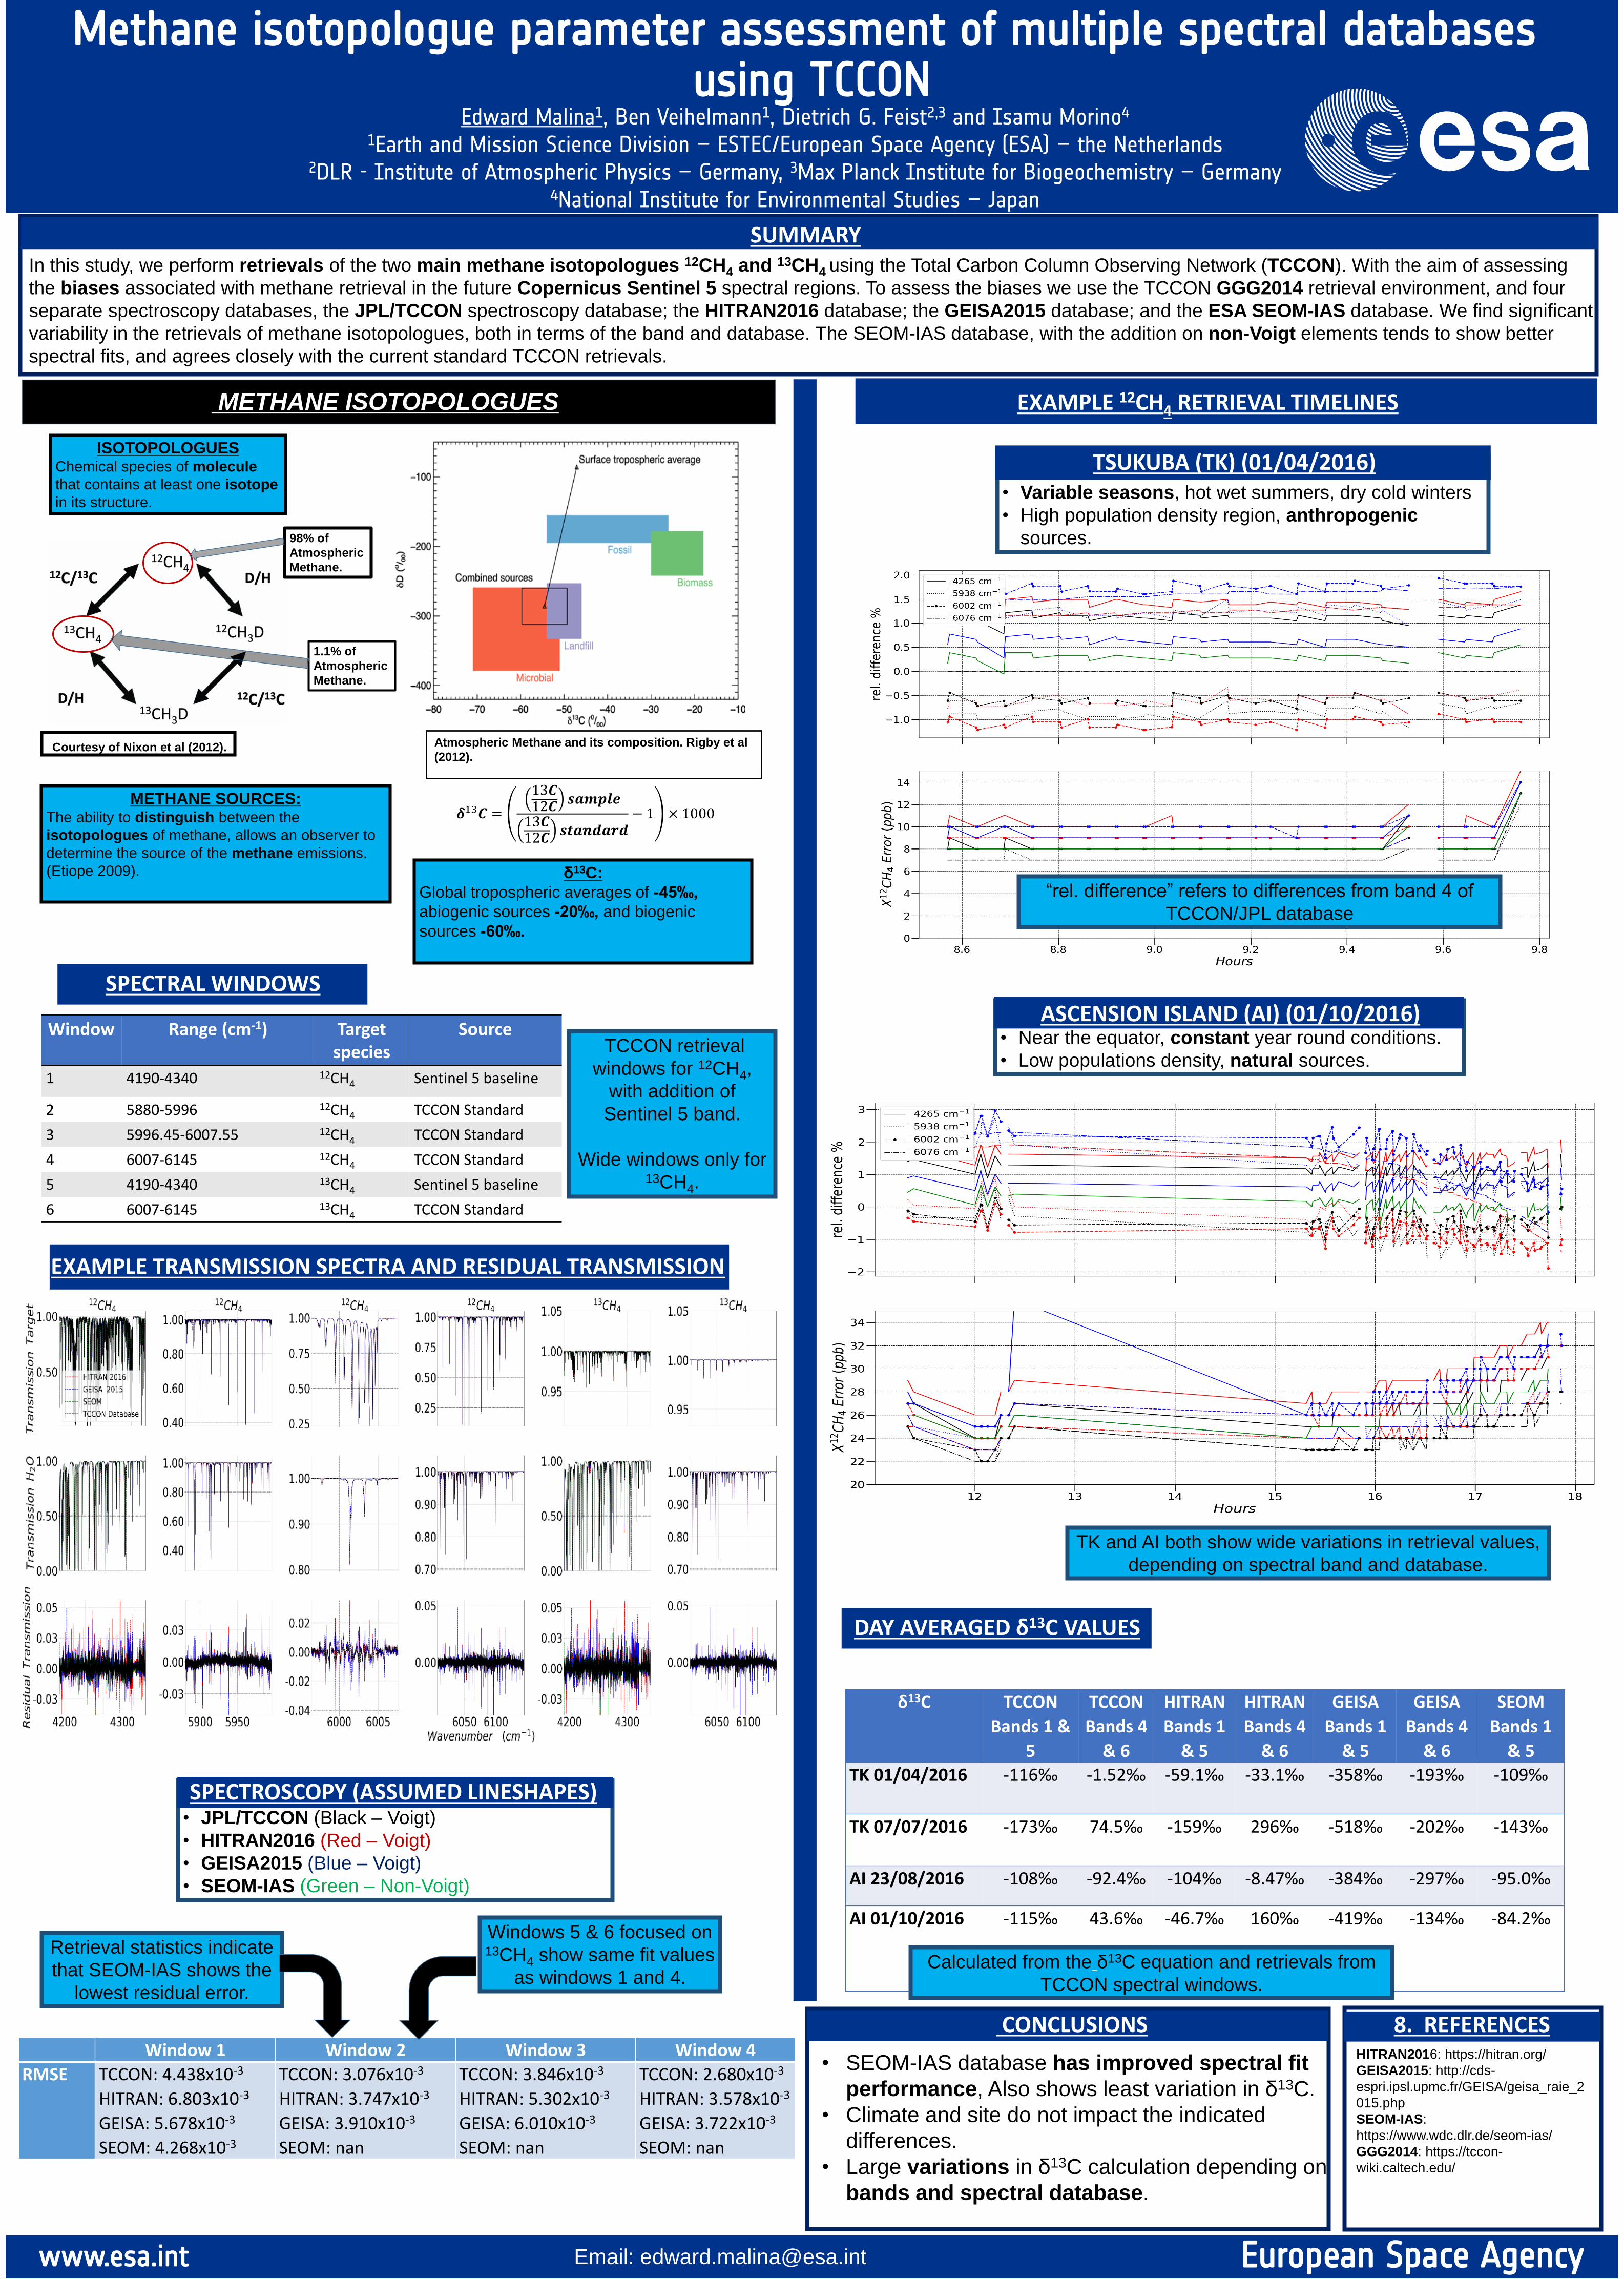
Methane isotopologue parameter assessment of multiple spectral databasesusing TCCON

Edward Malina1, Ben Veihelmann1, Dietrich G. Feist2,3 and Isamu Morino4

1Earth and Mission Science Division – ESTEC/European Space Agency (ESA) – the Netherlands2DLR - Institute of Atmospheric Physics – Germany, 3Max Planck Institute for Biogeochemistry – Germany

4National Institute for Environmental Studies – Japan

Email: [email protected]

SUMMARYIn this study, we perform retrievals of the two main methane isotopologues 12CH4 and 13CH4 using the Total Carbon Column Observing Network (TCCON). With the aim of assessing

the biases associated with methane retrieval in the future Copernicus Sentinel 5 spectral regions. To assess the biases we use the TCCON GGG2014 retrieval environment, and four

separate spectroscopy databases, the JPL/TCCON spectroscopy database; the HITRAN2016 database; the GEISA2015 database; and the ESA SEOM-IAS database. We find significant

variability in the retrievals of methane isotopologues, both in terms of the band and database. The SEOM-IAS database, with the addition on non-Voigt elements tends to show better

spectral fits, and agrees closely with the current standard TCCON retrievals.

SUMMARY

3. TCCON SPECTRAL WINDOWS

Window Range (cm-1) Target species

Source

1 4190-4340 12CH4 Sentinel 5 baseline

2 5880-5996 12CH4 TCCON Standard

3 5996.45-6007.55 12CH4 TCCON Standard

4 6007-6145 12CH4 TCCON Standard

5 4190-4340 13CH4 Sentinel 5 baseline

6 6007-6145 13CH4 TCCON Standard

• Variable seasons, hot wet summers, dry cold winters

• High population density region, anthropogenic

sources.

TSUKUBA (TK) (01/04/2016)

• Near the equator, constant year round conditions.

• Low populations density, natural sources.

ASCENSION ISLAND (AI) (01/10/2016)

CONCLUSIONS HITRAN2016: https://hitran.org/

GEISA2015: http://cds-

espri.ipsl.upmc.fr/GEISA/geisa_raie_2

015.php

SEOM-IAS:

https://www.wdc.dlr.de/seom-ias/

GGG2014: https://tccon-

wiki.caltech.edu/

8. REFERENCES

EXAMPLE 12CH4 RETRIEVAL TIMELINES

• SEOM-IAS database has improved spectral fit

performance, Also shows least variation in δ13C.

• Climate and site do not impact the indicated

differences.

• Large variations in δ13C calculation depending on

bands and spectral database.

“rel. difference” refers to differences from band 4 of

TCCON/JPL database

ISOTOPOLOGUESChemical species of molecule

that contains at least one isotope

in its structure.

METHANE SOURCES:The ability to distinguish between the

isotopologues of methane, allows an observer to

determine the source of the methane emissions.

(Etiope 2009).

METHANE ISOTOPOLOGUES

𝜹13𝑪 =

13𝑪12𝑪

𝒔𝒂𝒎𝒑𝒍𝒆

13𝑪12𝑪

𝒔𝒕𝒂𝒏𝒅𝒂𝒓𝒅− 1 × 1000

Atmospheric Methane and its composition. Rigby et al

(2012).Courtesy of Nixon et al (2012).

δ13C:

Global tropospheric averages of -45‰,

abiogenic sources -20‰, and biogenic

sources -60‰.

98% of

Atmospheric

Methane.

1.1% of

Atmospheric

Methane.

δ13C TCCON

Bands 1 &

5

TCCON

Bands 4

& 6

HITRAN

Bands 1

& 5

HITRAN

Bands 4

& 6

GEISA

Bands 1

& 5

GEISA

Bands 4

& 6

SEOM

Bands 1

& 5

TK 01/04/2016 -116‰ -1.52‰ -59.1‰ -33.1‰ -358‰ -193‰ -109‰

TK 07/07/2016 -173‰ 74.5‰ -159‰ 296‰ -518‰ -202‰ -143‰

AI 23/08/2016 -108‰ -92.4‰ -104‰ -8.47‰ -384‰ -297‰ -95.0‰

AI 01/10/2016 -115‰ 43.6‰ -46.7‰ 160‰ -419‰ -134‰ -84.2‰

• JPL/TCCON (Black – Voigt)

• HITRAN2016 (Red – Voigt)

• GEISA2015 (Blue – Voigt)

• SEOM-IAS (Green – Non-Voigt)

SPECTROSCOPY (ASSUMED LINESHAPES)

SPECTRAL WINDOWS

EXAMPLE TRANSMISSION SPECTRA AND RESIDUAL TRANSMISSION

TYPICALLY SEOM-IAS SHOWS LOWEST FIT RESIDUALS (FOR THE 2.3 μM

TCCON retrieval

windows for 12CH4,

with addition of

Sentinel 5 band.

Wide windows only for 13CH4.

Retrieval statistics indicate

that SEOM-IAS shows the

lowest residual error.

DAY AVERAGED δ13C VALUES

Window 1 Window 2 Window 3 Window 4

RMSE TCCON: 4.438x10⁻³

HITRAN: 6.803x10⁻³

GEISA: 5.678x10⁻³

SEOM: 4.268x10⁻³

TCCON: 3.076x10⁻³

HITRAN: 3.747x10⁻³

GEISA: 3.910x10⁻³

SEOM: nan

TCCON: 3.846x10⁻³

HITRAN: 5.302x10⁻³

GEISA: 6.010x10⁻³

SEOM: nan

TCCON: 2.680x10⁻³

HITRAN: 3.578x10⁻³

GEISA: 3.722x10⁻³

SEOM: nan

Calculated from the δ13C equation and retrievals from

TCCON spectral windows.

TK and AI both show wide variations in retrieval values,

depending on spectral band and database.

Windows 5 & 6 focused on 13CH4 show same fit values

as windows 1 and 4.